industrial and commercial bank of china …...industrial and commercial bank of china (asia) limited...
TRANSCRIPT

1
INDUSTRIAL AND COMMERCIAL BANK OF CHINA (ASIA) LIMITED
中 國 工 商 銀 行( 亞 洲 ) 有 限 公 司 (Incorporated in Hong Kong with limited liability)
Regulatory Disclosure Statement
2019 2ND QUARTER

2
Purpose and Basis of Consolidation
The information contained in this Regulatory Disclosure Statement (the “Statement”) is for
Industrial and Commercial Bank of China (Asia) Limited and its subsidiaries to comply with the
Banking (Disclosure) Rules (“BDR”) (Cap. 155M) and does not constitute statutory financial
statements.
While the Statement is not required to be subject to external audit, it has been reviewed and
verified in accordance with the Group’s governance processes over financial reporting and
policies on disclosures.
Except where indicated otherwise, the financial information contained in this Statement has
been prepared on the basis of regulatory scope of consolidation specified by the Hong Kong
Monetary Authority (“HKMA”) to the Bank.

OV1: Overview of RWA
3
(HK$’000)
(a) (b) (c)
RWA
Minimum
capital
requirements
6/30/2019 3/31/2019 6/30/2019
1 Credit risk for non-securitization exposures 591,189,338 587,112,626 47,295,147
2 Of which STC approach 591,189,338 587,112,626 47,295,147
2a Of which BSC approach - - -
3 Of which foundation IRB approach - - -
4 Of which supervisory slotting criteria approach - - -
5 Of which advanced IRB approach - - -
6 Counterparty default risk and default fund contributions 12,756,030 11,845,775 1,020,483
7 Of which SA-CCR N/A N/A N/A
7a Of which CEM 10,090,522 9,179,856 807,242
8 Of which IMM(CCR) approach N/A N/A N/A
9 Of which others 2,665,508 2,665,919 213,241
10 CVA risk 5,855,400 5,705,638 468,432
11 Equity positions in banking book under the simple
risk-weight method and internal models method - - -
12 Collective investment scheme (“CIS”) exposures – LTA N/A N/A N/A
13 CIS exposures – MBA N/A N/A N/A
14 CIS exposures – FBA N/A N/A N/A
14a CIS exposures – combination of approaches N/A N/A N/A
15 Settlement risk - - -
16 Securitization exposures in banking book - - -
17 Of which SEC-IRBA - - -
18 Of which SEC-ERBA - - -
19 Of which SEC-SA - - -
19a Of which SEC-FBA - - -
20 Market risk 21,742,350 19,282,238 1,739,388
21 Of which STM approach 21,742,350 19,282,238 1,739,388
22 Of which IMM approach - - -
23 Capital charge for switch between exposures in trading
book and banking book (not applicable before the
revised market risk framework takes effect) N/A N/A N/A
24 Operational risk 25,731,438 25,213,388 2,058,515
25 Amounts below the thresholds for deduction (subject to
250% RW) 1,856,218 1,139,633 148,497
26 Capital floor adjustment - - -
26a Deduction to RWA 349,723 344,353 27,978

OV1: Overview of RWA (continued)
4
(HK$’000)
(a) (b) (c)
RWA
Minimum
capital
requirements
6/30/2019 3/31/2019 6/30/2019
26b Of which portion of regulatory reserve for general
banking risks and collective provisions which is not
included in Tier 2 Capital - - -
26c Of which portion of cumulative fair value gains
arising from the revaluation of land and buildings
which is not included in Tier 2 Capital 349,723 344,353 27,978
27 Total 658,781,051 649,954,945 52,702,484
The Group is in compliance with the Banking (Capital) Rules in calculating the risk-weighted
assets (RWA). The Group adopts the standardized (credit risk) approach (STC) for the
non-securitization credit risk RWA (including equity exposure and CIS exposure) calculation,
the current exposure method (CEM) for the counterparty credit risk RWA calculation,
standardized CVA method for the CVA risk RWA calculation, the standardized (market risk)
approach (STM) for the market risk RWA calculation, the basic indicator approach (BIA) for
the operational risk RWA calculation. There was no settlement risk, nor securitization
exposure RWA on the reporting date. There was neither regulatory reserve nor collective
provision which needed to be deducted from RWA. There was no RWA capital floor
adjustment. The RWA of “Amounts below the thresholds for deduction (subject to 250%
RW)” increased by 63% amounting HKD 717 million in Q2 2019, is primarily attributable to
the new capital injection into a financial institution subsidiary during the period. The other
RWA items only shows small or moderate fluctuations as business development.

KM1: Key prudential ratios
5
(HK$’000)
(a) (b) (c) (d) (e)
6/30/2019 3/31/2019 31/12/18 30/09/18 30/06/18
Regulatory capital (amount)
1 Common Equity Tier 1 (CET1) 97,243,266 87,240,964 83,758,638 81,016,715 80,184,650
2 Tier 1 124,836,699 114,986,024 111,439,018 108,675,358 107,919,636
3 Total capital 131,117,393 125,286,922 122,647,581 123,832,810 123,282,400
RWA (amount)
4 Total RWA 658,781,051 649,954,945 621,102,763 641,201,309 673,325,490
Risk-based regulatory capital ratios (as a percentage of RWA)
5 CET1 ratio (%) 14.76% 13.42% 13.49% 12.64% 11.91%
6 Tier 1 ratio (%) 18.95% 17.69% 17.94% 16.95% 16.03%
7 Total capital ratio (%) 19.90% 19.28% 19.75% 19.31% 18.31%
Additional CET1 buffer requirements (as a percentage of RWA)
8 Capital conservation buffer requirement
(%) 2.50% 2.50% 1.88% 1.88% 1.88%
9 Countercyclical capital buffer requirement
(%) 1.43% 1.46% 1.11% 1.09% 1.08%
10 Higher loss absorbency requirements (%)
(applicable only to G-SIBs or D-SIBs) 1.00% 1.00% 1.00% N/A N/A
11 Total AI-specific CET1 buffer requirements
(%) 4.93% 4.96% 3.99% 2.97% 2.95%
12 CET1 available after meeting the AI’s
minimum capital requirements (%) 9.14% 7.80% 7.85% 7.00% 6.28%
Basel III leverage ratio
13 Total leverage ratio (LR) exposure
measure 1,008,248,331 970,830,470 954,169,051 983,523,454 1,041,366,278
14 LR (%) 12.38% 11.84% 11.68% 11.05% 10.36%
Liquidity Coverage Ratio (LCR) / Liquidity Maintenance Ratio (LMR)
Applicable to category 1 institution only:
15 Total high quality liquid assets (HQLA) 89,084,968 71,532,834 72,846,277 70,385,574 74,826,216
16 Total net cash outflows 42,735,113 38,832,316 39,346,587 43,480,966 50,127,499
17 LCR (%) 210.62% 184.02% 185.90% 162.07% 150.74%
Applicable to category 2 institution only:
17a LMR (%) N/A N/A N/A N/A N/A
Net Stable Funding Ratio (NSFR) / Core Funding Ratio (CFR)
Applicable to category 1 institution only:
18 Total available stable funding 557,437,022 534,852,915 529,123,985 531,644,002 552,428,403
19 Total required stable funding 468,093,817 473,250,523 446,290,441 443,864,921 449,835,014
20 NSFR (%) 119.09% 113.02% 118.56% 119.78% 122.81%
Applicable to category 2A institution only:
20a CFR (%) N/A N/A N/A N/A N/A

CC1: Composition of regulatory capital
6
(HK$’000)
(a) (b)
Amount
Source based on
reference
numbers/letters
of the balance
sheet under the
regulatory scope
of consolidation
CET1 capital: instruments and reserves
1 Directly issued qualifying CET1 capital instruments plus any related share
premium 44,187,631 (8)
2 Retained earnings 53,449,365 (9)
3 Disclosed reserves 3,105,775
(10) +(11)+(12)
+(13)+(14)
4 Directly issued capital subject to phase-out arrangements from CET1 (only
applicable to non-joint stock companies)
Not applicable Not applicable
5 Minority interests arising from CET1 capital instruments issued by
consolidated bank subsidiaries and held by third parties (amount allowed in
CET1 capital of the consolidation group)
-
6 CET1 capital before regulatory deductions 100,742,771
CET1 capital: regulatory deductions
7 Valuation adjustments 4,017 (15)
8 Goodwill (net of associated deferred tax liabilities) 980,154 (1)
9 Other intangible assets (net of associated deferred tax liabilities) 15,996 (2)
10 Deferred tax assets (net of associated deferred tax liabilities) 453,484 (3)
11 Cash flow hedge reserve (101,233) (12)
12 Excess of total EL amount over total eligible provisions under the IRB
approach -
13 Credit-enhancing interest-only strip, and any gain-on-sale and other
increase in the CET1 capital arising from securitization transactions -
14 Gains and losses due to changes in own credit risk on fair valued liabilities - (18)
15 Defined benefit pension fund net assets (net of associated deferred tax
liabilities) -
16 Investments in own CET1 capital instruments (if not already netted off
paid-in capital on reported balance sheet) -
17 Reciprocal cross-holdings in CET1 capital instruments -
18 Insignificant LAC investments in CET1 capital instruments issued by financial
sector entities that are outside the scope of regulatory consolidation
(amount above 10% threshold) -
19 Significant LAC investments in CET1 capital instruments issued by financial
sector entities that are outside the scope of regulatory consolidation
(amount above 10% threshold) -
20 Mortgage servicing rights (net of associated deferred tax liabilities) Not applicable Not applicable
21 Deferred tax assets arising from temporary differences (net of associated
deferred tax liabilities)
Not applicable Not applicable
CC1: Composition of regulatory capital
7
(HK$’000)
(a) (b)
Amount
Source based on
reference
numbers/letters
of the balance
sheet under the
regulatory scope
of consolidation
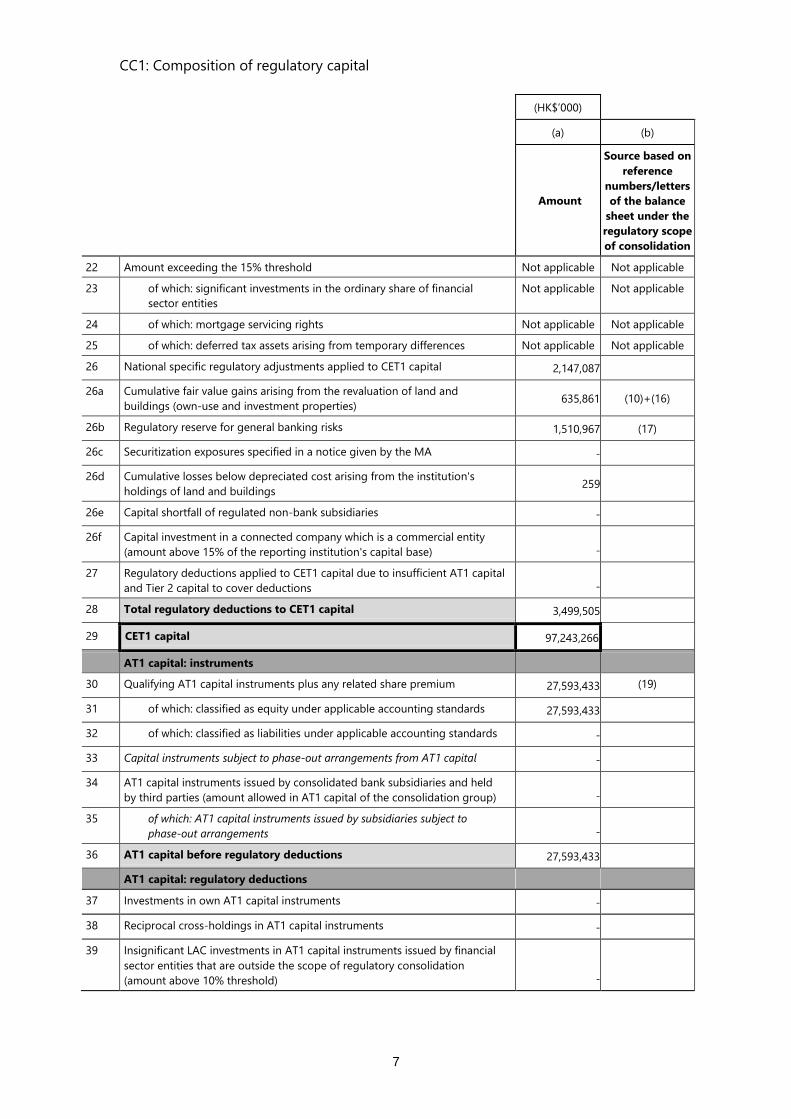
22 Amount exceeding the 15% threshold Not applicable Not applicable
23 of which: significant investments in the ordinary share of financial
sector entities
Not applicable Not applicable
24 of which: mortgage servicing rights Not applicable Not applicable
25 of which: deferred tax assets arising from temporary differences Not applicable Not applicable
26 National specific regulatory adjustments applied to CET1 capital 2,147,087
26a Cumulative fair value gains arising from the revaluation of land and
buildings (own-use and investment properties) 635,861 (10)+(16)
26b Regulatory reserve for general banking risks 1,510,967 (17)
26c Securitization exposures specified in a notice given by the MA -
26d Cumulative losses below depreciated cost arising from the institution's
holdings of land and buildings 259
26e Capital shortfall of regulated non-bank subsidiaries -
26f Capital investment in a connected company which is a commercial entity
(amount above 15% of the reporting institution's capital base) -
27 Regulatory deductions applied to CET1 capital due to insufficient AT1 capital
and Tier 2 capital to cover deductions -
28 Total regulatory deductions to CET1 capital 3,499,505
29 CET1 capital 97,243,266
AT1 capital: instruments
30 Qualifying AT1 capital instruments plus any related share premium 27,593,433 (19)
31 of which: classified as equity under applicable accounting standards 27,593,433
32 of which: classified as liabilities under applicable accounting standards -
33 Capital instruments subject to phase-out arrangements from AT1 capital -
34 AT1 capital instruments issued by consolidated bank subsidiaries and held
by third parties (amount allowed in AT1 capital of the consolidation group) -
35 of which: AT1 capital instruments issued by subsidiaries subject to
phase-out arrangements -
36 AT1 capital before regulatory deductions 27,593,433
AT1 capital: regulatory deductions
37 Investments in own AT1 capital instruments -
38 Reciprocal cross-holdings in AT1 capital instruments -
39 Insignificant LAC investments in AT1 capital instruments issued by financial
sector entities that are outside the scope of regulatory consolidation
(amount above 10% threshold) -

CC1: Composition of regulatory capital
8
(HK$’000)
(a) (b)
Amount
Source based on
reference
numbers/letters
of the balance
sheet under the
regulatory scope
of consolidation
40 Significant LAC investments in AT1 capital instruments issued by financial
sector entities that are outside the scope of regulatory consolidation -
41 National specific regulatory adjustments applied to AT1 capital -
42 Regulatory deductions applied to AT1 capital due to insufficient Tier 2
capital to cover deductions -
43 Total regulatory deductions to AT1 capital -
44 AT1 capital 27,593,433
45 Tier 1 capital (T1 = CET1 + AT1) 124,836,699
Tier 2 capital: instruments and provisions
46 Qualifying Tier 2 capital instruments plus any related share premium -
47 Capital instruments subject to phase-out arrangements from Tier 2 capital 1,165,050 (6) & (7)
48 Tier 2 capital instruments issued by consolidated bank subsidiaries and held
by third parties (amount allowed in Tier 2 capital of the consolidation group) -
49 of which: capital instruments issued by subsidiaries subject to phase-out
arrangements -
50 Collective provisions and regulatory reserve for general banking risks eligible
for inclusion in Tier 2 capital
4,829,506
=-[(5) - (17)] and
limited to 1.25% of
risk-weighted
amount for credit
risks related to
STC approach
51 Tier 2 capital before regulatory deductions 5,994,556
Tier 2 capital: regulatory deductions
52 Investments in own Tier 2 capital instruments -
53 Reciprocal cross-holdings in Tier 2 capital instruments and non-capital LAC
liabilities -
54 Insignificant LAC investments in Tier 2 capital instruments issued by, and
non-capital LAC liabilities of, financial sector entities that are outside the
scope of regulatory consolidation (amount above 10% threshold and, where
applicable, 5% threshold) -
54a Insignificant LAC investments in non-capital LAC liabilities of financial sector
entities that are outside the scope of regulatory consolidation (amount
formerly designated for the 5% threshold but no longer meets the
conditions) (for institutions defined as “section 2 institution” under §2(1) of
Schedule 4F to BCR only) -
55 Significant LAC investments in Tier 2 capital instruments issued by financial
sector entities that are outside the scope of regulatory consolidation (net of
eligible short positions) -

CC1: Composition of regulatory capital
9
(HK$’000)
(a) (b)
Amount
Source based on
reference
numbers/letters
of the balance
sheet under the
regulatory scope
of consolidation
55a Significant LAC investments in non-capital LAC liabilities of financial sector
entities that are outside the scope of regulatory consolidation (net of eligible
short positions) -
56 National specific regulatory adjustments applied to Tier 2 capital (286,138)
56a Add back of cumulative fair value gains arising from the revaluation of land
and buildings (own-use and investment properties) eligible for inclusion in
Tier 2 capital
(286,138) =-[(10)+(16)]*45%
56b Regulatory deductions applied to Tier 2 capital to cover the required
deductions falling within §48(1)(g) of BCR -
57 Total regulatory adjustments to Tier 2 capital (286,138)
58 Tier 2 capital (T2) 6,280,694
59 Total regulatory capital (TC = T1 + T2) 131,117,393
60 Total RWA 658,781,051
Capital ratios (as a percentage of RWA)
61 CET1 capital ratio 14.76%
62 Tier 1 capital ratio 18.95%
63 Total capital ratio 19.90%
64 Institution-specific buffer requirement (capital conservation buffer
plus countercyclical capital buffer plus higher loss absorbency
requirements)
4.93%
65 of which: capital conservation buffer requirement 2.50%
66 of which: bank specific countercyclical capital buffer requirement 1.43%
67 of which: higher loss absorbency requirement 1.00%
68 CET1 (as a percentage of RWA) available after meeting minimum capital
requirements 9.14%
National minima (if different from Basel 3 minimum)
69 National CET1 minimum ratio Not applicable Not applicable
70 National Tier 1 minimum ratio Not applicable Not applicable
71 National Total capital minimum ratio Not applicable Not applicable
Amounts below the thresholds for deduction (before risk weighting)
72 Insignificant LAC investments in CET1, AT1 and Tier 2 capital instruments
issued by, and non-capital LAC liabilities of, financial sector entities that are
outside the scope of regulatory consolidation
6,038,757
73 Significant LAC investments in CET1 capital instruments issued by financial
sector entities that are outside the scope of regulatory consolidation 892,487

CC1: Composition of regulatory capital
10
(HK$’000)
(a) (b)
Amount
Source based on
reference
numbers/letters
of the balance
sheet under the
regulatory scope
of consolidation
74 Mortgage servicing rights (net of associated deferred tax liabilities) Not applicable Not applicable
75 Deferred tax assets arising from temporary differences (net of associated
deferred tax liabilities) Not applicable Not applicable
Applicable caps on the inclusion of provisions in Tier 2 capital
76 Provisions eligible for inclusion in Tier 2 in respect of exposures subject to
the BSC approach, or the STC approach and SEC-ERBA, SEC-SA and SEC-FBA
(prior to application of cap)
4,829,506
77 Cap on inclusion of provisions in Tier 2 under the BSC approach, or the
STC approach, and SEC-ERBA, SEC-SA and SEC-FBA 7,555,167
78 Provisions eligible for inclusion in Tier 2 in respect of exposures subject to
the IRB approach and SEC-IRBA (prior to application of cap)
Not applicable
79 Cap for inclusion of provisions in Tier 2 under the IRB approach and
SEC-IRBA
Not applicable
Capital instruments subject to phase-out arrangements
(only applicable between 1 Jan 2018 and 1 Jan 2022)
80 Current cap on CET1 capital instruments subject to phase-out arrangements Not applicable Not applicable
81 Amount excluded from CET1 due to cap (excess over cap after redemptions
and maturities) Not applicable Not applicable
82 Current cap on AT1 capital instruments subject to phase-out arrangements -
83 Amount excluded from AT1 capital due to cap (excess over cap after
redemptions and maturities) -
84 Current cap on Tier 2 capital instruments subject to phase-out arrangements 1,165,050
85 Amount excluded from Tier 2 capital due to cap (excess over cap after
redemptions and maturities) 2,733,963
Notes to the Template
Description Hong Kong
basis
Basel III
basis
9 Other intangible assets (net of associated deferred tax liabilities) 15,996 15,996
Explanation
As set out in paragraph 87 of the Basel III text issued by the Basel Committee (December 2010), mortgage
servicing rights (“MSRs”) may be given limited recognition in CET1 capital (and hence be excluded from
deduction from CET1 capital up to the specified threshold). In Hong Kong, an AI is required to follow the
accounting treatment of including MSRs as part of intangible assets reported in the AI's financial statements and
to deduct MSRs in full from CET1 capital. Therefore, the amount to be deducted as reported in row 9 may be
greater than that required under Basel III. The amount reported under the column "Basel III basis" in this box
represents the amount reported in row 9 (i.e. the amount reported under the "Hong Kong basis") adjusted by
reducing the amount of MSRs to be deducted to the extent not in excess of the 10% threshold set for MSRs and
the aggregate 15% threshold set for MSRs, DTAs arising from temporary differences and significant investments
CC1: Composition of regulatory capital
11
Description Hong Kong
basis
Basel III
basis
in CET1 capital instruments issued by financial sector entities (excluding those that are loans, facilities or other
credit exposures to connected companies) under Basel III.
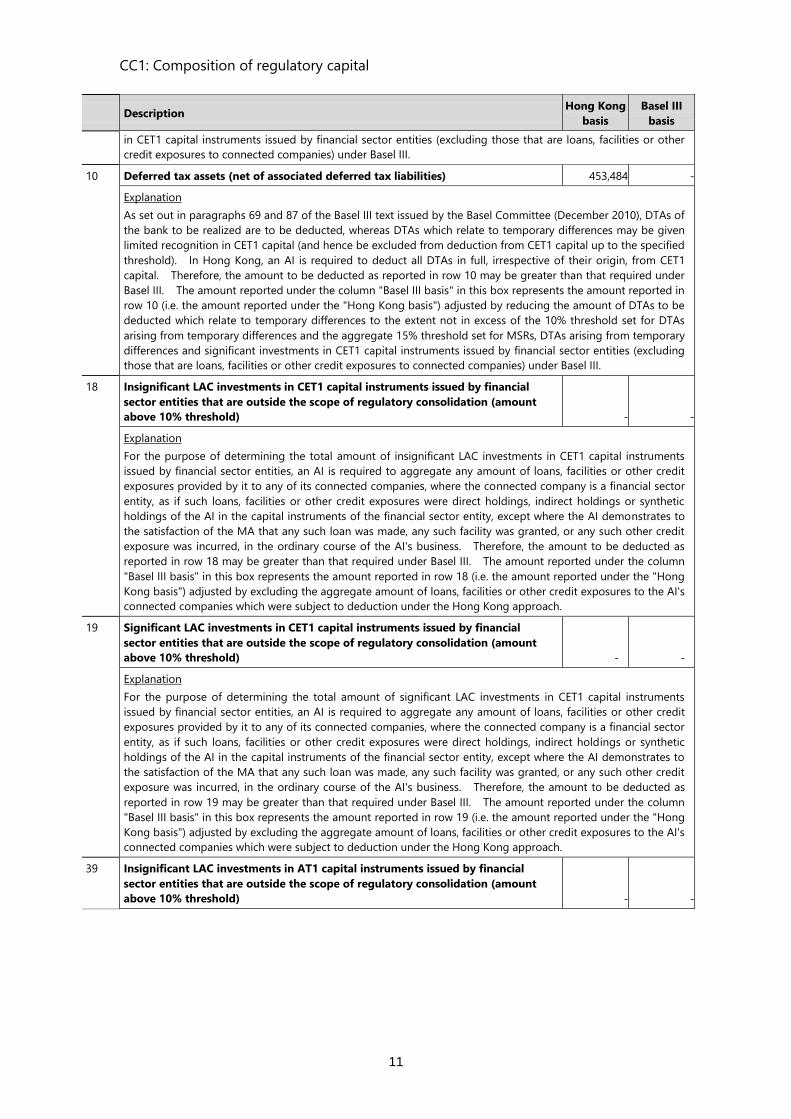
10 Deferred tax assets (net of associated deferred tax liabilities) 453,484 -
Explanation
As set out in paragraphs 69 and 87 of the Basel III text issued by the Basel Committee (December 2010), DTAs of
the bank to be realized are to be deducted, whereas DTAs which relate to temporary differences may be given
limited recognition in CET1 capital (and hence be excluded from deduction from CET1 capital up to the specified
threshold). In Hong Kong, an AI is required to deduct all DTAs in full, irrespective of their origin, from CET1
capital. Therefore, the amount to be deducted as reported in row 10 may be greater than that required under
Basel III. The amount reported under the column "Basel III basis" in this box represents the amount reported in
row 10 (i.e. the amount reported under the "Hong Kong basis") adjusted by reducing the amount of DTAs to be
deducted which relate to temporary differences to the extent not in excess of the 10% threshold set for DTAs
arising from temporary differences and the aggregate 15% threshold set for MSRs, DTAs arising from temporary
differences and significant investments in CET1 capital instruments issued by financial sector entities (excluding
those that are loans, facilities or other credit exposures to connected companies) under Basel III.
18 Insignificant LAC investments in CET1 capital instruments issued by financial
sector entities that are outside the scope of regulatory consolidation (amount
above 10% threshold) - -
Explanation
For the purpose of determining the total amount of insignificant LAC investments in CET1 capital instruments
issued by financial sector entities, an AI is required to aggregate any amount of loans, facilities or other credit
exposures provided by it to any of its connected companies, where the connected company is a financial sector
entity, as if such loans, facilities or other credit exposures were direct holdings, indirect holdings or synthetic
holdings of the AI in the capital instruments of the financial sector entity, except where the AI demonstrates to
the satisfaction of the MA that any such loan was made, any such facility was granted, or any such other credit
exposure was incurred, in the ordinary course of the AI's business. Therefore, the amount to be deducted as
reported in row 18 may be greater than that required under Basel III. The amount reported under the column
"Basel III basis" in this box represents the amount reported in row 18 (i.e. the amount reported under the "Hong
Kong basis") adjusted by excluding the aggregate amount of loans, facilities or other credit exposures to the AI's
connected companies which were subject to deduction under the Hong Kong approach.
19 Significant LAC investments in CET1 capital instruments issued by financial
sector entities that are outside the scope of regulatory consolidation (amount
above 10% threshold) - -
Explanation
For the purpose of determining the total amount of significant LAC investments in CET1 capital instruments
issued by financial sector entities, an AI is required to aggregate any amount of loans, facilities or other credit
exposures provided by it to any of its connected companies, where the connected company is a financial sector
entity, as if such loans, facilities or other credit exposures were direct holdings, indirect holdings or synthetic
holdings of the AI in the capital instruments of the financial sector entity, except where the AI demonstrates to
the satisfaction of the MA that any such loan was made, any such facility was granted, or any such other credit
exposure was incurred, in the ordinary course of the AI's business. Therefore, the amount to be deducted as
reported in row 19 may be greater than that required under Basel III. The amount reported under the column
"Basel III basis" in this box represents the amount reported in row 19 (i.e. the amount reported under the "Hong
Kong basis") adjusted by excluding the aggregate amount of loans, facilities or other credit exposures to the AI's
connected companies which were subject to deduction under the Hong Kong approach.
39 Insignificant LAC investments in AT1 capital instruments issued by financial
sector entities that are outside the scope of regulatory consolidation (amount
above 10% threshold) - -
CC1: Composition of regulatory capital
12
Description Hong Kong
basis
Basel III
basis
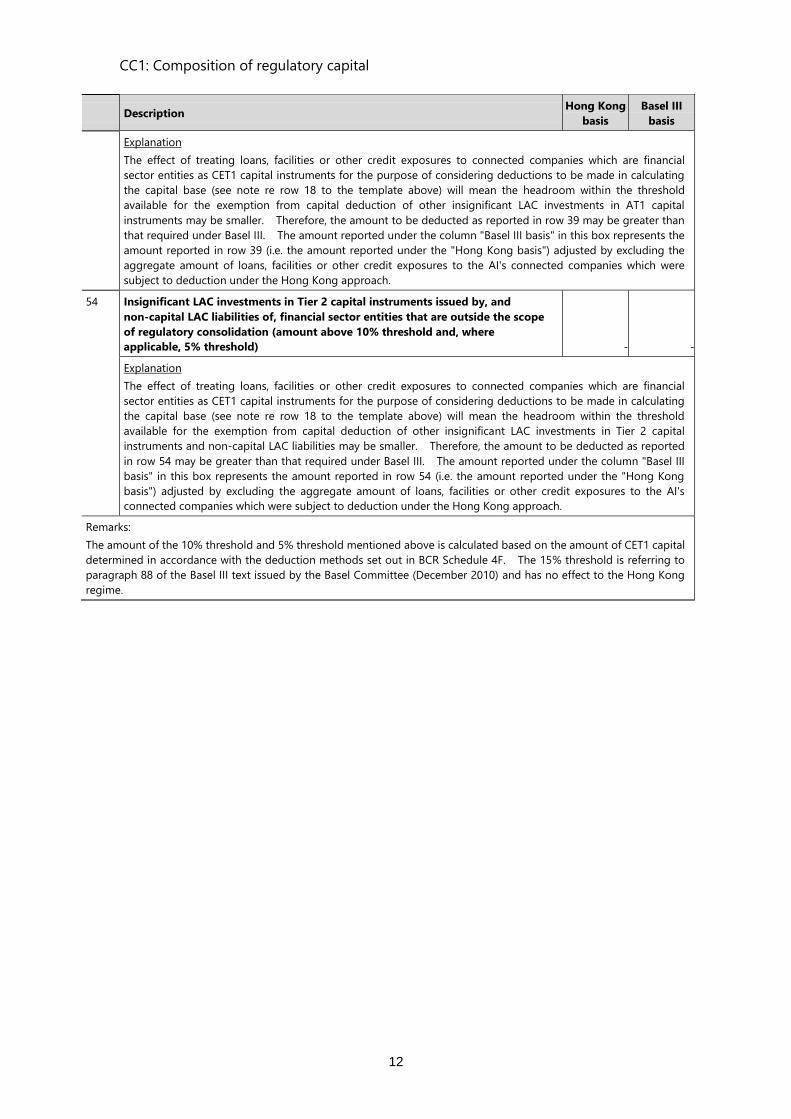
Explanation
The effect of treating loans, facilities or other credit exposures to connected companies which are financial
sector entities as CET1 capital instruments for the purpose of considering deductions to be made in calculating
the capital base (see note re row 18 to the template above) will mean the headroom within the threshold
available for the exemption from capital deduction of other insignificant LAC investments in AT1 capital
instruments may be smaller. Therefore, the amount to be deducted as reported in row 39 may be greater than
that required under Basel III. The amount reported under the column "Basel III basis" in this box represents the
amount reported in row 39 (i.e. the amount reported under the "Hong Kong basis") adjusted by excluding the
aggregate amount of loans, facilities or other credit exposures to the AI's connected companies which were
subject to deduction under the Hong Kong approach.
54 Insignificant LAC investments in Tier 2 capital instruments issued by, and
non-capital LAC liabilities of, financial sector entities that are outside the scope
of regulatory consolidation (amount above 10% threshold and, where
applicable, 5% threshold) - -
Explanation
The effect of treating loans, facilities or other credit exposures to connected companies which are financial
sector entities as CET1 capital instruments for the purpose of considering deductions to be made in calculating
the capital base (see note re row 18 to the template above) will mean the headroom within the threshold
available for the exemption from capital deduction of other insignificant LAC investments in Tier 2 capital
instruments and non-capital LAC liabilities may be smaller. Therefore, the amount to be deducted as reported
in row 54 may be greater than that required under Basel III. The amount reported under the column "Basel III
basis" in this box represents the amount reported in row 54 (i.e. the amount reported under the "Hong Kong
basis") adjusted by excluding the aggregate amount of loans, facilities or other credit exposures to the AI's
connected companies which were subject to deduction under the Hong Kong approach.
Remarks:
The amount of the 10% threshold and 5% threshold mentioned above is calculated based on the amount of CET1 capital
determined in accordance with the deduction methods set out in BCR Schedule 4F. The 15% threshold is referring to
paragraph 88 of the Basel III text issued by the Basel Committee (December 2010) and has no effect to the Hong Kong
regime.

CC2: Reconciliation of regulatory capital to balance sheet
13
(HK$’000)
(a) (b) (c)
Balance sheet
as in
published
financial
statements
30/06/2019
Under
regulatory
scope of
consolidation
30/06/2019
Reference
Assets
Cash and balances with banks and other financial institutions 122,690,985 122,585,390
Placements with banks and other financial institutions 138,467,288 138,467,288
Financial assets held for trading 2,647,851 2,647,851
Financial assets at fair value through profit or loss 5,157,164 601,140
Derivative financial instruments 9,748,408 9,748,408
Advances and other accounts 477,657,641 477,657,641
of which: collective impairment allowances reflected in
regulated capital - (3,318,539) (5)
Financial investments: 177,778,477 177,589,688
– measured at fair value through other comprehensive income 129,425,525 129,185,457
– measured at amortised cost 48,352,952 48,404,231
Investment in an associate 194,094 194,105
Investment in subsidiaries - 5,035,943
Goodwill and other intangible assets 1,017,606 980,154
of which: goodwill - 980,154 (1)
of which: other intangible asset - 15,996 (2)
Investment properties 140,135 140,135
of which: cumulative revaluation gain on investment
properties - 44,129 (16)
Property, plant and equipment 1,991,923 1,988,433
Current income tax asset - -
Deferred income tax assets 453,484 453,484 (3)
Other assets 13,363,116 13,491,614
Total assets 951,308,172 951,581,274
Liabilities
Deposits from banks and other financial institutions 194,249,495 194,249,495
Derivative financial instruments 7,726,023 7,726,023
of which: debit valuation adjustments in respect of
derivative contracts - 4,017
(15)
Deposits from customers 561,548,542 562,988,126
Certificates of deposit issued at amortised cost 12,353,273 12,353,273

CC2: Reconciliation of regulatory capital to balance sheet (continued)
14
(HK$’000)
(a) (b) (c)
Balance sheet
as in
published
financial
statements
30/06/2019
Under
regulatory
scope of
consolidation
30/06/2019
Reference
Debt securities in issue 23,346,883 23,346,883
- Designated at fair value through profit or loss 3,248,299 3,248,299
- At amortised cost 20,098,584 20,098,584
of which: gains due to changes in own credit risk on fair
valued liabilities - - (18)
Current income tax liabilities 1,121,341 1,121,341
Deferred income tax liabilities - -
Subordinated debts measured at amortised cost 3,899,013 3,899,013
of which: subordinate debts not eligible for inclusion in
regulatory capital - - (6)
of which: subordinate debt eligible for inclusion in
regulatory capital - 1,165,050 (7)
Other liabilities 17,186,359 17,400,478
Total liabilities 821,430,929 823,084,632
Shareholders’ equity
Share capital 44,187,631 44,187,631 (8)
Retained earnings 54,820,925 53,449,365 (9)
of which: regulatory reserve for general banking risks - 1,510,967 (17)
Other reserves 3,232,980 3,266,213
of which: bank premises revaluation reserve - 591,732 (10)
of which: investment revaluation reserve - (580,278) (11)
of which: cash flow hedge reserve - (101,233) (12)
of which: exchange reserve - (29,043) (13)
of which: general reserve - 3,224,597 (14)
Additional equity instruments 27,635,707 27,593,433 (19)
Total shareholders’ equity 129,877,243 128,496,642
Total shareholders’ equity and liabilities 951,308,172 951,581,274

CCA: Main features of regulatory capital instruments
15
Main Features Template – Ordinary Shares
1 Issuer Industrial and Commercial Bank of
China (Asia) Limited
2 Unique identifier (eg CUSIP, ISIN or Bloomberg identifier for private placement)
N/A
3 Governing law(s) of the instrument Hong Kong Companies Ordinance
Regulatory treatment
4 Transitional Basel III rules# Common Equity Tier 1
5 Post-transitional Basel III rules+ Common Equity Tier 1
6 Eligible at solo*/group/group & solo Solo and Group
7 Instrument type (types to be specified by each jurisdiction) Ordinary shares
8 Amount recognised in regulatory capital (Currency in million, as of most recent reporting date)
HK$44,188 million
9 Par value of instrument N/A
10 Accounting classification Shareholders’ equity
11 Original date of issuance Since incorporation
12 Perpetual or dated Perpetual
13 Original maturity date N/A
14 Issuer call subject to prior supervisory approval No
15 Optional call date, contingent call dates and redemption amount N/A
16 Subsequent call dates, if applicable N/A
Coupons/dividends
17 Fixed or floating dividend/coupon N/A
18 Coupon rate and any related index N/A
19 Existence of a dividend stopper No
20 Fully discretionary, partially discretionary or mandatory Fully discretionary
21 Existence of step up or other incentive to redeem No
22 Non-cumulative or cumulative Non-cumulative
23 Convertible or non-convertible Non-convertible
24 If convertible, conversion trigger(s) N/A
25 If convertible, fully or partially N/A
26 If convertible, conversion rate N/A
27 If convertible, mandatory or optional conversion N/A
28 If convertible, specify instrument type convertible into N/A
29 If convertible, specify issuer of instrument it converts into N/A
30 Write-down feature No
31 If write-down, write-down trigger(s) N/A
32 If write-down, full or partial N/A
33 If write-down, permanent or temporary N/A
34 If temporary write-down, description of write-up mechanism N/A
35 Position in subordination hierarchy in liquidation (specify instrument type immediately senior to instrument in the insolvency creditor hierarchy of the legal entity concerned).
Depositors, bank’s creditors, holders’ of certificates of deposit issued, debt securities in issue and subordinated debts in issue.
36 Non-compliant transitioned features No
37 If yes, specify non-compliant features N/A

CCA: Main features of regulatory capital instruments
16
Main Features Template – USD Non-Cumulative Subordinated Additional Tier 1 Capital
Securities with perpetual maturity (callable on 21 July 2021)
1 Issuer
Industrial and Commercial Bank of China (Asia) Limited
2 Unique identifier (eg CUSIP, ISIN or Bloomberg identifier for private placement)
XS1449306064
3 Governing law(s) of the instrument The Capital Securities are governed by and shall be construed in accordance with English Law, except that the subordination provisions are governed by and shall be construed in accordance with Hong Kong law.
Regulatory treatment
4 Transitional Basel III rules# N/A
5 Post-transitional Basel III rules+ Additional Tier 1
6 Eligible at solo*/group/group & solo Solo and Group
7 Instrument type (types to be specified by each jurisdiction) Additional Tier 1 capital instruments
8 Amount recognised in regulatory capital (Currency in million, as of most recent reporting date)
HK$7,795 million
9 Par value of instrument USD 1 billion
10 Accounting classification Equity instruments
11 Original date of issuance 21 July 2016
12 Perpetual or dated Perpetual
13 Original maturity date N/A
14 Issuer call subject to prior supervisory approval Yes
15 Optional call date, contingent call dates and redemption amount
First call date: 21 July 2021 (Redemptions in whole at 100%)
16 Subsequent call dates, if applicable any distribution payment date thereafter
Coupons/dividends
17 Fixed or floating dividend/coupon Fixed
18 Coupon rate and any related index Year 1-5: 4.25% per annum payable semi-annually in arrear;
Year 5 onwards: resettable on year 5 and every 5 years thereafter at then prevailing 5-year US Treasury yield plus a fixed initial spread
19 Existence of a dividend stopper Yes
20 Fully discretionary, partially discretionary or mandatory Fully discretionary
21 Existence of step up or other incentive to redeem No
22 Non-cumulative or cumulative Non-cumulative
23 Convertible or non-convertible Non-convertible
24 If convertible, conversion trigger(s) N/A
25 If convertible, fully or partially N/A
26 If convertible, conversion rate N/A
27 If convertible, mandatory or optional conversion N/A
28 If convertible, specify instrument type convertible into N/A
29 If convertible, specify issuer of instrument it converts into N/A
30 Write-down feature Yes
31 If write-down, write-down trigger(s) Upon the occurrence of a Non-Viability Event
32 If write-down, full or partial full
33 If write-down, permanent or temporary permanent
34 If temporary write-down, description of write-up mechanism
N/A
35 Position in subordination hierarchy in liquidation (specify instrument type immediately senior to instrument in the insolvency creditor hierarchy of the legal entity concerned).
Depositors, bank's creditors, creditors of Tier 2 capital and all other subordinated indebtedness of the bank.
36 Non-compliant transitioned features No
37 If yes, specify non-compliant features N/A

CCA: Main features of regulatory capital instruments
17
Main Features Template – USD Non-Cumulative Subordinated Additional Tier 1 Capital
Securities with perpetual maturity (callable on 21 March 2023)
1 Issuer Industrial and Commercial Bank of China (Asia)
Limited
2 Unique identifier (eg CUSIP, ISIN or Bloomberg identifier for private placement)
N/A
3 Governing law(s) of the instrument The Capital Securities are governed by and shall
be construed in accordance with Hong Kong law
Regulatory treatment
4 Transitional Basel III rules# N/A
5 Post-transitional Basel III rules+ Additional Tier 1
6 Eligible at solo*/group/group & solo Solo and Group
7 Instrument type (types to be specified by each jurisdiction) Additional Tier 1 capital instruments
8 Amount recognised in regulatory capital (Currency in million, as of most recent reporting date)
HK$19,798 million
9 Par value of instrument USD 2.536 billion
10 Accounting classification Equity instruments
11 Original date of issuance 21 March 2018
12 Perpetual or dated Perpetual
13 Original maturity date N/A
14 Issuer call subject to prior supervisory approval Yes
15 Optional call date, contingent call dates and redemption amount 21 March 2023(Redemptions in whole at 100%)
16 Subsequent call dates, if applicable any distribution payment date thereafter
Coupons/dividends
17 Fixed or floating dividend/coupon Fixed
18 Coupon rate and any related index Year 1-5: 4.90% per annum payable
semi-annually in arrear; Year 5 onwards:
resettable on year 5 and every 5 years thereafter
at then prevailing 5-year US Treasury yield plus
a fixed initial spread
19 Existence of a dividend stopper Yes
20 Fully discretionary, partially discretionary or mandatory Partially discretionary
21 Existence of step up or other incentive to redeem No
22 Non-cumulative or cumulative Non-cumulative
23 Convertible or non-convertible Non-convertible
24 If convertible, conversion trigger (s) N/A
25 If convertible, fully or partially N/A
26 If convertible, conversion rate N/A
27 If convertible, mandatory or optional conversion N/A
28 If convertible, specify instrument type convertible into N/A
29 If convertible, specify issuer of instrument it converts into N/A
30 Write-down feature Yes
31 If write-down, write-down trigger(s) Upon the occurrence of a Non-Viability Event
32 If write-down, full or partial May be written-down partially
33 If write-down, permanent or temporary Permanent
34 If temporary write-down, description of write-up mechanism N/A
35 Position in subordination hierarchy in liquidation (specify instrument type immediately senior to instrument in the insolvency creditor hierarchy of the legal entity concerned).
Depositors and all other unsubordinated creditors
of the Issuer, creditors in respect of Tier 2 Capital
Instruments and all other Subordinated
Indebtedness of the Issuer.
36 Non-compliant transitioned features No
37 If yes, specify non-compliant features N/A
CCA: Main features of regulatory capital instruments
18
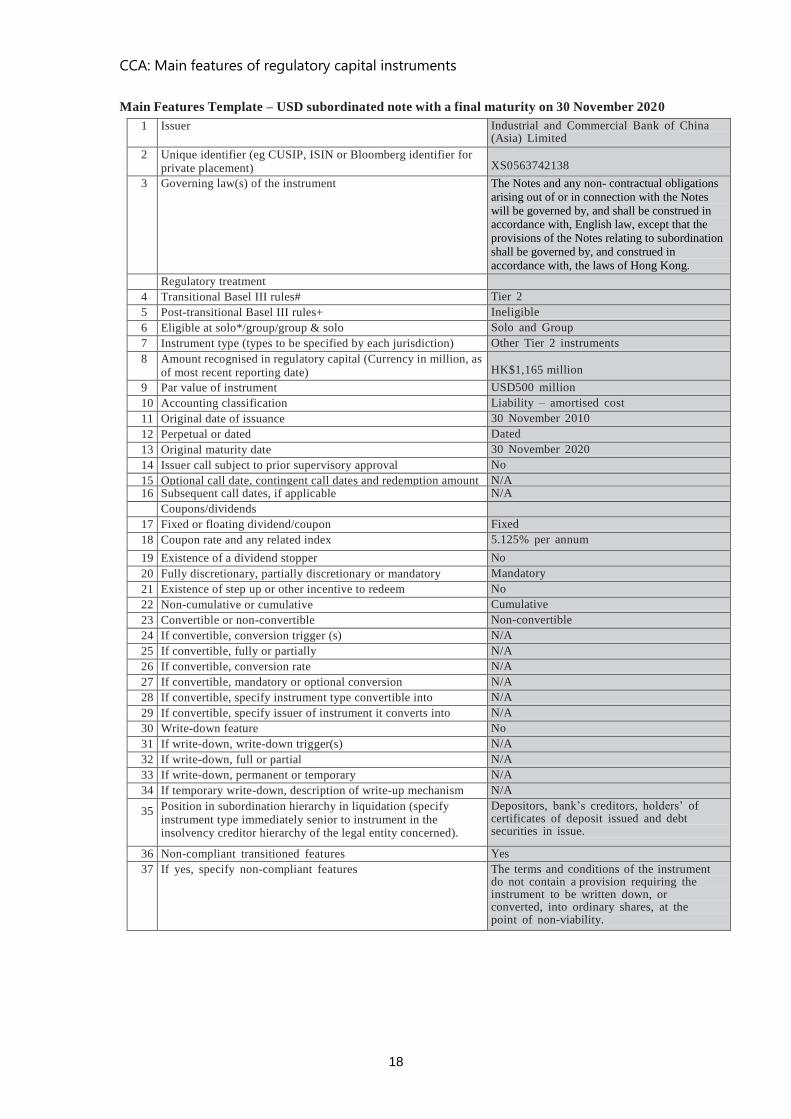
Main Features Template – USD subordinated note with a final maturity on 30 November 2020
1 Issuer Industrial and Commercial Bank of China (Asia) Limited
2 Unique identifier (eg CUSIP, ISIN or Bloomberg identifier for private placement) XS0563742138
3 Governing law(s) of the instrument The Notes and any non- contractual obligations
arising out of or in connection with the Notes
will be governed by, and shall be construed in accordance with, English law, except that the
provisions of the Notes relating to subordination
shall be governed by, and construed in
accordance with, the laws of Hong Kong.
Regulatory treatment
4 Transitional Basel III rules# Tier 2
5 Post-transitional Basel III rules+ Ineligible
6 Eligible at solo*/group/group & solo Solo and Group
7 Instrument type (types to be specified by each jurisdiction) Other Tier 2 instruments
8 Amount recognised in regulatory capital (Currency in million, as of most recent reporting date) HK$1,165 million
9 Par value of instrument USD500 million
10 Accounting classification Liability – amortised cost
11 Original date of issuance 30 November 2010
12 Perpetual or dated Dated
13 Original maturity date 30 November 2020
14 Issuer call subject to prior supervisory approval No
15 Optional call date, contingent call dates and redemption amount N/A 16 Subsequent call dates, if applicable N/A
Coupons/dividends
17 Fixed or floating dividend/coupon Fixed
18 Coupon rate and any related index 5.125% per annum
19 Existence of a dividend stopper No
20 Fully discretionary, partially discretionary or mandatory Mandatory
21 Existence of step up or other incentive to redeem No
22 Non-cumulative or cumulative Cumulative
23 Convertible or non-convertible Non-convertible
24 If convertible, conversion trigger (s) N/A
25 If convertible, fully or partially N/A
26 If convertible, conversion rate N/A
27 If convertible, mandatory or optional conversion N/A
28 If convertible, specify instrument type convertible into N/A
29 If convertible, specify issuer of instrument it converts into N/A
30 Write-down feature No
31 If write-down, write-down trigger(s) N/A
32 If write-down, full or partial N/A
33 If write-down, permanent or temporary N/A
34 If temporary write-down, description of write-up mechanism N/A
35 Position in subordination hierarchy in liquidation (specify instrument type immediately senior to instrument in the insolvency creditor hierarchy of the legal entity concerned).
Depositors, bank’s creditors, holders’ of certificates of deposit issued and debt securities in issue.
36 Non-compliant transitioned features Yes
37 If yes, specify non-compliant features The terms and conditions of the instrument do not contain a provision requiring the instrument to be written down, or converted, into ordinary shares, at the point of non-viability.

CCyB1: Geographical distribution of credit exposures used in countercyclical capital
buffer (“CCyB”)
19
Geographical breakdown by
Jurisdiction (J)
Applicable
JCCyB ratio
in effect (%)
RWA used in
computation
of CCyB ratio
AI-speci
fic CCyB
ratio (%)
CCyB
amount
(%) (Amount)
1 Hong Kong SAR 2.500% 261,372,325
2 China 0.000% 160,256,230
3
Australia (includes Christmas Islands,
Cocos Islands, Norfolk Islands, Heard and
McDonald Islands, Territory of Ashmore
and Cartier Islands and Territory of Coral
Sea Islands) 0.000% 4,103,651
4 Cambodia 0.000% 56
5 Canada 0.000% 8,333
6 Cayman Islands 0.000% 4,172,033
7 Chinese Taipei 0.000% 78,516
8 France 0.000% 77,136
9 India 0.000% 170,235
10 Indonesia 0.000% 1,759,278
11 Ireland 0.000% 3,240,688
12 Italy 0.000% 22,288
13 Luxembourg 0.000% 5,173,450
14 Macao 0.000% 2,875,571
15 Malaysia 0.000% 15,055
16 Myanmar 0.000% 554,650
17 Netherlands 0.000% 979,341
18 New Zealand 0.000% 200,130
19 Philippines 0.000% 204,376
20 Qatar 0.000% 784,797
21 Singapore 0.000% 3,932,741
22 South Africa 0.000% 1,477
23 South Korea 0.000% 84,463
24 Spain 0.000% 360
25 Switzerland 0.000% 1,061
26 Thailand 0.000% 406,108
27 United Arab Emirates 0.000% 390,474
28
United Kingdom (excludes Guernsey, Isle
of Man and Jersey) 1.000% 3,133,157
29
United States (includes American Samoa,
Guam, Midway Islands, Northern Mariana
Islands, Puerto Rico, US Virgin Islands and
Wake Islands) 0.000% 2,070,376
30 Vietnam 0.000% 113,819
31
West Indies UK (includes Anguilla, Antigua
and Barbuda, British Virgin Islands, 0.000% 2,858,995

CCyB1: Geographical distribution of credit exposures used in countercyclical capital
buffer (“CCyB”)
20
Montserrat and St. Christopher/St. Kitts -
Nevis)
Sum 459,041,170
Total
459,041,170 1.430%
6,565,640

LR1: Summary comparison of accounting assets against leverage ratio (“LR”) exposure
measure
21
(a)
Item Value under the
LR framework
(HK$’000)
1 Total consolidated assets as per published financial statements 951,308,172
2 Adjustment for investments in banking, financial, insurance or commercial entities that are
consolidated for accounting purposes but outside the scope of regulatory consolidation 5,035,954
3 Adjustment for fiduciary assets recognised on the balance sheet pursuant to the applicable
accounting standard but excluded from the LR exposure measure -
4 Adjustments for derivative contracts 8,165,431
5 Adjustment for SFTs (i.e. repos and similar secured lending) 2,851,069
6 Adjustment for off-balance sheet (“OBS”) items (i.e. conversion to credit equivalent amounts
of OBS exposures) 48,516,110
6a Adjustment for specific and collective provisions that are allowed to be excluded from
exposure measure (6,089,964)
7 Other adjustments (1,538,441)
8 Leverage ratio exposure measure 1,008,248,331

LR2: Leverage ratio (“LR”)
22
(a) (b)
(HK$’000)
30/6/2019 31/3/2019
On-balance sheet exposures
1 On-balance sheet exposures (excluding those arising from derivative contracts and
SFTs, but including collateral) 918,442,812 877,563,587
2 Less: Asset amounts deducted in determining Tier 1 capital (3,041,745) (3,091,939)
3 Total on-balance sheet exposures (excluding derivative contracts and SFTs) 915,401,067 874,471,648
Exposures arising from derivative contracts
4 Replacement cost associated with all derivative contracts (where applicable net of
eligible cash variation margin and/or with bilateral netting) 8,462,519 8,019,123
5 Add-on amounts for PFE associated with all derivative contracts 12,927,917 12,273,293
6 Gross-up for derivatives collateral provided where deducted from the balance sheet
assets pursuant to the applicable accounting framework - -
7 Less: Deductions of receivables assets for cash variation margin provided under
derivative contracts (4,762,486) (3,477,542)
8 Less: Exempted CCP leg of client-cleared trade exposures - -
9 Adjusted effective notional amount of written credit derivative contracts - -
10 Less: Adjusted effective notional offsets and add-on deductions for written credit
derivative contracts
- -
11 Total exposures arising from derivative contracts 16,627,950 16,814,874
Exposures arising from SFTs
12 Gross SFT assets (with no recognition of netting), after adjusting for sale accounting
transactions 30,942,099 28,340,718
13 Less: Netted amounts of cash payables and cash receivables of gross SFT assets - -
14 CCR exposure for SFT assets 2,851,069 2,491,327
15 Agent transaction exposures - -
16 Total exposures arising from SFTs 33,793,168 30,832,045
Other off-balance sheet exposures
17 Off-balance sheet exposure at gross notional amount 224,382,620 236,720,716
18 Less: Adjustments for conversion to credit equivalent amounts (175,866,510) (182,574,104)
19 Off-balance sheet items 48,516,110 54,146,612
Capital and total exposures
20 Tier 1 capital 124,836,699 114,986,024
20a Total exposures before adjustments for specific and collective provisions 1,014,338,295 976,265,179
20b Adjustments for specific and collective provisions (6,089,964) (5,434,709)
21 Total exposures after adjustments for specific and collective provisions 1,008,248,331 970,830,470
Leverage ratio
22 Leverage ratio 12.38% 11.84%

LR2: Leverage ratio (“LR”)
23
Due to the increase in clearing settlement account balance, the receivables assets for cash
variation margin provided under derivative contracts has raised by HKD 1,285 million
(+36.95%).

LIQ1: Liquidity Coverage Ratio (“LCR”) – for category 1 institution
24
Number of data points used in calculating the average value of the LCR and related components
set out in this template: (71)
(HK$’000)
(a) (b)
Basis of disclosure: consolidated
Unweighted
value
(average)
Weighted
value
(average)
A. HQLA
1 Total HQLA 89,116,781
B. Cash outflows
2 Retail deposits and small business funding, of which: 173,381,137 16,695,508
3 Stable retail deposits and stable small business funding 9,180,615 275,324
4 Less stable retail deposits and less stable small business funding 164,200,522 16,420,184
4a Retail term deposits and small business term funding - -
5 Unsecured wholesale funding (other than small business funding), and debt
securities and prescribed instruments issued by the AI, of which: 264,394,378 130,522,306
6 Operational deposits 39,773,839 9,854,662
7 Unsecured wholesale funding (other than small business funding) not covered
in row 6 221,658,900 117,696,425
8 Debt securities and prescribed instruments issued by the AI and redeemable
within the LCR period 2,961,639 2,971,219
9 Secured funding transactions (including securities swap transactions) 1,870,218
10 Additional requirements, of which: 54,363,817 8,537,920
11 Cash outflows arising from derivative contracts and other transactions, and
additional liquidity needs arising from related collateral requirements 4,418,661 3,449,723
12 Cash outflows arising from obligations under structured financing transactions
and repayment of funding obtained from such transactions - -
13 Potential drawdown of undrawn committed facilities (including committed
credit facilities and committed liquidity facilities) 49,945,156 5,088,197
14 Contractual lending obligations (not otherwise covered in Section B) and other
contractual cash outflows 1,339,060 1,334,753
15 Other contingent funding obligations (whether contractual or non-contractual) 655,643,861 774,991
16 Total Cash Outflows 159,735,696
C. Cash Inflows
17 Secured lending transactions (including securities swap transactions) 402,706 71,035
18 Secured and unsecured loans (other than secured lending transactions covered
in row 17) and operational deposits placed at other financial institutions 158,865,508 123,755,570
19 Other cash inflows 80,670,717 4,657,152
20 Total Cash Inflows 239,938,931 128,483,757
D. Liquidity Coverage Ratio Adjusted value
21 Total HQLA 89,084,968
22 Total Net Cash Outflows 42,735,113
23 LCR (%) 210.62%
LIQ1: Liquidity Coverage Ratio (“LCR”) – for category 1 institution (continued)
25
Liquidity Coverage Ratio
The Liquidity Coverage Ratio (“LCR”) throughout the second quarter of 2019 meets
regulatory requirement and maintains at a high level.
(i) Main drivers of its LCR results
The change in Bank’s LCR is mainly due to increase in HQLA, as well as maturing of various
kinds of asset and liability. Currently, the high LCR level is due to the higher increase in HQLA
than that in net cash outflow within 30 days. The increase in operational deposits is the major
factor for increase in outflow. Although the secured lending transactions and other cash
inflows vary by more than 20%, the changes in their absolute amount are less significant than
those in secured and unsecured loans to other financial institution due to extended
translation tenor.
(ii) Composition of High Quality Liquid Assets (“HQLA”)
The Bank holds a portfolio of unencumbered HQLA which can be readily liquidated to meet
cash flow obligations under stress scenarios, as defined in the LCR rules. These liquid assets
consist primarily of Level 1 HQLA, such as the Hong Kong Exchange Fund bills and notes as
well as the US Treasuries, supplemented by Level 2A and 2B HQLA, such as bonds issued by
highly rated corporate issuers.
(iii) Concentration of funding sources
The Bank maintains a diversified funding base composed mainly by retail and corporate
customer deposits, supplemented by wholesale funding including but not limited to issuance
of certificates of deposit and term debts. Short-term interbank money market borrowing is
also used from time to time to meet temporary funding need.
The Bank continues to expand and diversify its deposit base, and to increase the proportion
of stable deposits in its overall funding pool.
(iv) Derivative Exposures
The Bank closely monitors all its exchange traded and over-the-counter derivative exposures
arising from customer transactions and their corresponding hedging activities. Such
derivative contracts comprise mainly of foreign exchange forwards, interest rate and cross

LIQ1: Liquidity Coverage Ratio (“LCR”) – for category 1 institution (continued)
26
currency swaps. Collateral may be required to be posted to counterparties depending on the
marked-to-market of the derivative contracts.
(v) Currency mismatch
The Bank’s customer deposits are mainly denominated in HKD. To meet customer loan
demand, the Bank swaps surplus HKD funding into USD and other foreign currencies. This
represents the major currency mismatch of the Bank.
On the other hand, as the supply of HKD denominated HQLA is relatively limited, the Bank
covers its HKD mismatch by holding HQLA denominated in USD when necessary. This is in
line with the LCR alternative liquidity approach option elected by the HKMA.
(vi) Centralization of liquidity management
The Bank has a wholly owned subsidiary in the Mainland China, namely China Mercantile
Bank ("CMB"), which has set up its own liquidity risk management policy and managed
liquidity risk in accordance with its local regulatory requirements. CMB calculates its own LCR,
which would then be consolidated with the Bank’s LCR to reflect the liquidity position on a
Group basis.
(vii) Approach to liquidity risk management
The Bank has established a comprehensive liquidity risk management framework in
accordance with the HKMA requirements and BCBS guidance. The Board is ultimately
responsible for liquidity risk management, with the support from Board-level Risk
Management Committee, senior management committees including the Risk Management
Committee and the Asset and Liability Management Committee. Policies and procedures are
in place, with properly approved limits and indicators in order to identify, measure and
monitor liquidity risk. Stress tests are conducted regularly, and the Bank has readied the
Contingent Funding Plan which details the procedures in dealing with a potential liquidity
crisis.

LIQ2: Net Stable Funding Ratio – for category 1 institution
27
30/06/2019
(HK$’000)
(a) (b) (c) (d) (e)
Basis of disclosure: consolidated
Unweighted value by residual maturity
Weighted
amount No specified
term to
maturity
<6 months or
repayable on
demand
6 months to <
12 months
12 months or
more
A. Available stable funding (“ASF”) item
1 Capital: 131,940,881 - - 3,883,500 135,824,381
2 Regulatory capital 131,940,881 - - - 131,940,881
2a Minority interests not covered by row 2 - - - - -
3 Other capital instruments - - - 3,883,500 3,883,500
4 Retail deposits and small business funding: - 177,509,742 22,777 - 160,228,891
5 Stable deposits 8,991,899 568 - 8,542,844
6 Less stable deposits 168,517,843 22,209 - 151,686,047
7 Wholesale funding: - 483,682,479 61,000,392 36,286,259 239,258,311
8 Operational deposits 39,487,690 - - 19,743,845
9 Other wholesale funding - 444,194,789 61,000,392 36,286,259 219,514,466
10 Liabilities with matching interdependent
assets - - - - -
11 Other liabilities: 9,964,944 13,724,499 2,823,386 20,713,746 22,125,439
12 Net derivative liabilities -
13 All other funding and liabilities not
included in the above categories 9,964,944 13,724,499 2,823,386 20,713,746 22,125,439
14 Total ASF 557,437,022
B. Required stable funding (“RSF”) item
15 Total HQLA for NSFR purposes 119,889,345 15,747,604
16 Deposits held at other financial institutions
for operational purposes - 548,091 - - 274,046
17 Performing loans and securities: 6,781,354 327,099,700 120,440,617 314,767,645 412,424,576
18 Performing loans to financial
institutions secured by Level 1 HQLA - - - - -
19 Performing loans to financial
institutions secured by non-Level 1
HQLA and unsecured performing loans
to financial institutions - 226,722,897 69,769,405 18,151,661 87,044,798
20 Performing loans, other than performing
residential mortgage, to non-financial
corporate clients, retail and small
business customers, sovereigns, the
Monetary Authority for the account of
the Exchange Fund, central banks and
PSEs, of which: 6,781,354 94,474,281 42,777,558
214,543,313 256,213,064

LIQ2: Net Stable Funding Ratio – for category 1 institution (continued)
28
30/06/2019
(HK$’000)
(a) (b) (c) (d) (e)
Basis of disclosure: consolidated
Unweighted value by residual maturity
Weighted
amount No specified
term to
maturity
<6 months or
repayable on
demand
6 months to <
12 months
12 months or
more
21 With a risk-weight of less than or
equal to 35% under the STC
approach - 65,914 399,922 2,694,113 1,984,091
22 Performing residential mortgages, of
which: - 1,234,720 502,892 49,719,407 35,637,156
23 With a risk-weight of less than or
equal to 35% under the STC
approach - 891,067 396,514 37,465,732 24,996,516
24 Securities that are not in default and do
not qualify as HQLA, including
exchange-traded equities - 4,667,802 7,390,762 32,353,264 33,529,556
25 Assets with matching interdependent
liabilities - - - - -
26 Other assets: 30,674,343 9,050,745 4,272,349 16,880,168 37,188,902
27 Physical traded commodities, including
gold - -
28 Assets posted as initial margin for
derivative contracts and contributions to
default funds of CCPs 123,222 104,739
29 Net derivative assets 6,294,511 6,294,511
30 Total derivative liabilities before
deduction of variation margin posted 7,721,207 -
31 All other assets not included in the
above categories 16,535,403 12,846,150 4,272,349 17,134,215 30,789,651
32 Off-balance sheet items - 2,458,691
33 Total RSF 468,093,817
34 Net Stable Funding Ratio (%) 119.09%

LIQ2: Net Stable Funding Ratio – for category 1 institution (continued)
29
31/03/2019
(HK$’000)
(a) (b) (c) (d) (e)
Basis of disclosure: consolidated
Unweighted value by residual maturity
Weighted
amount No specified
term to maturity
<6 months or
repayable on
demand
6 months to <
12 months
12 months or
more
C. Available stable funding (“ASF”) item
1 Capital: 122,406,301 - 3,924,975 3,904,840 128,273,629
2 Regulatory capital 122,406,301 - 3,924,975 - 124,368,789
2a Minority interests not covered by row 2 - - - - -
3 Other capital instruments - - - 3,904,840 3,904,840
4 Retail deposits and small business funding: - 172,149,038 - - 155,389,329
5 Stable deposits 9,103,904 - - 8,648,709
6 Less stable deposits 163,045,134 - - 146,740,620
7 Wholesale funding: - 449,722,281 62,919,864 31,619,261 227,416,791
8 Operational deposits 34,433,807 - - 17,216,904
9 Other wholesale funding - 415,288,474 62,919,864 31,619,261 210,199,887
10 Liabilities with matching interdependent
assets - - - - -
11 Other liabilities: 18,511,594 24,526,839 172,042 23,687,145 23,773,166
12 Net derivative liabilities -
13 All other funding and liabilities not
included in the above categories 18,511,594 24,526,839 172,042 23,687,145 23,773,166
14 Total ASF 534,852,915
D. Required stable funding (“RSF”) item
15 Total HQLA for NSFR purposes 111,134,928 15,230,720
16 Deposits held at other financial institutions
for operational purposes - 632,139 - - 316,070
17 Performing loans and securities: 6,539,728 307,374,650 100,696,666 330,458,199 418,781,909
18 Performing loans to financial
institutions secured by Level 1 HQLA - 1,128,832 - - 112,883
19 Performing loans to financial
institutions secured by non-Level 1
HQLA and unsecured performing loans
to financial institutions -
191,486,414 55,766,341 24,327,978 80,934,111
LIQ2: Net Stable Funding Ratio – for category 1 institution (continued)
30
31/03/2019
(HK$’000)
(a) (b) (c) (d) (e)
Basis of disclosure: consolidated
Unweighted value by residual maturity
Weighted
amount No specified
term to maturity
<6 months or
repayable on
demand
6 months to <
12 months
12 months or
more
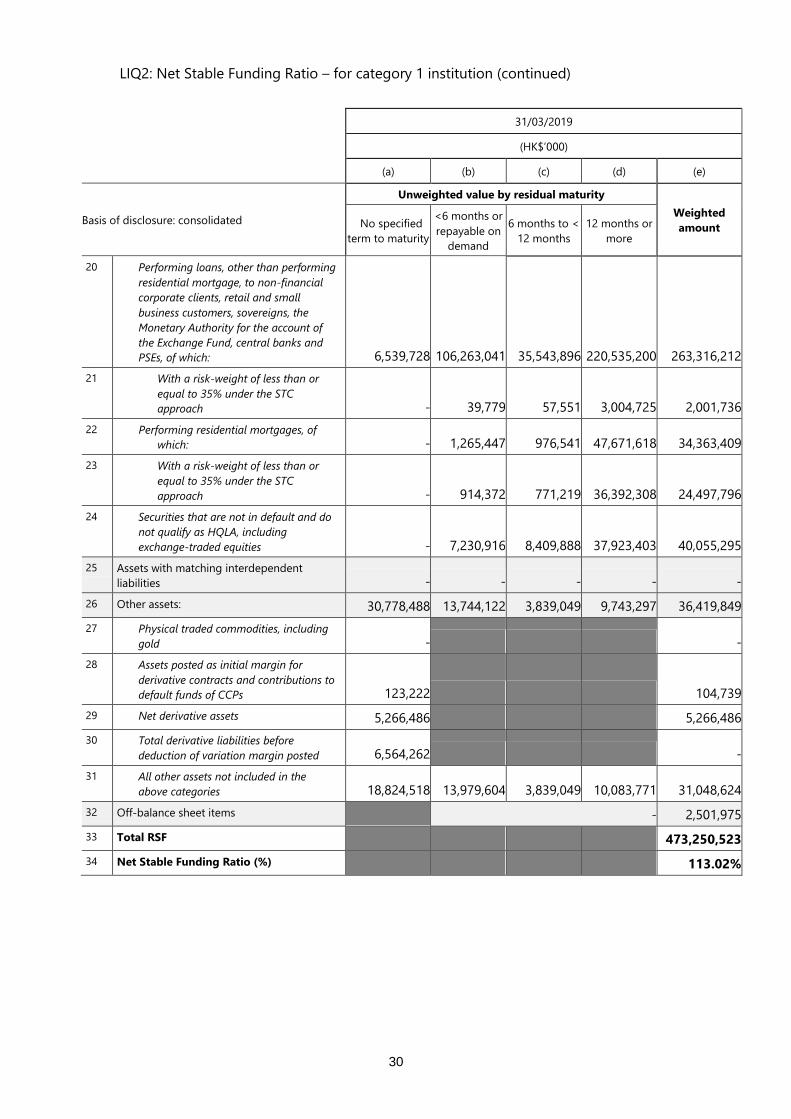
20 Performing loans, other than performing
residential mortgage, to non-financial
corporate clients, retail and small
business customers, sovereigns, the
Monetary Authority for the account of
the Exchange Fund, central banks and
PSEs, of which: 6,539,728
106,263,041 35,543,896
220,535,200 263,316,212
21 With a risk-weight of less than or
equal to 35% under the STC
approach - 39,779 57,551 3,004,725 2,001,736
22 Performing residential mortgages, of
which: - 1,265,447 976,541 47,671,618 34,363,409
23 With a risk-weight of less than or
equal to 35% under the STC
approach - 914,372 771,219 36,392,308 24,497,796
24 Securities that are not in default and do
not qualify as HQLA, including
exchange-traded equities - 7,230,916 8,409,888 37,923,403 40,055,295
25 Assets with matching interdependent
liabilities - - - - -
26 Other assets: 30,778,488 13,744,122 3,839,049 9,743,297 36,419,849
27 Physical traded commodities, including
gold - -
28 Assets posted as initial margin for
derivative contracts and contributions to
default funds of CCPs 123,222 104,739
29 Net derivative assets 5,266,486 5,266,486
30 Total derivative liabilities before
deduction of variation margin posted 6,564,262 -
31 All other assets not included in the
above categories 18,824,518 13,979,604 3,839,049 10,083,771 31,048,624
32 Off-balance sheet items - 2,501,975
33 Total RSF 473,250,523
34 Net Stable Funding Ratio (%) 113.02%

LIQ2: Net Stable Funding Ratio – for category 1 institution (continued)
31
During the second quarter of 2019, net stable funding ratio of the bank satisfied regulatory
requirements and continuously maintained at prudent levels.
(i) Major Factors Affecting NSFR
Factors including asset and liability structure and the change of total assets essentially
contribute to outcomes of the net stable funding ratio. In terms of liability, as of now the
bank’s liability is primarily composed of customer deposits, which have remained relatively
steady and exerted positive influence on stabilizing the net stable funding ratio. In terms of
asset, steady-growing customer loans make up the majority of assets and high quality liquid
assets account for sizeable portion. All above mentioned factors collectively lead to the
bank’s stable NSFR and safe liquidity condition.
(ii) Centralization of Liquidity Management
As the Chinese Mercantile Bank (CMB) is one of the bank’s subsidiaries, an independent
liquidity management policy has been established according to the state’s regulatory
requirement. CMB calculates the NSFR separately for consolidation at the group level to
reflect the group’s overall liquidity risk condition.
CR1: Credit quality of exposures
32
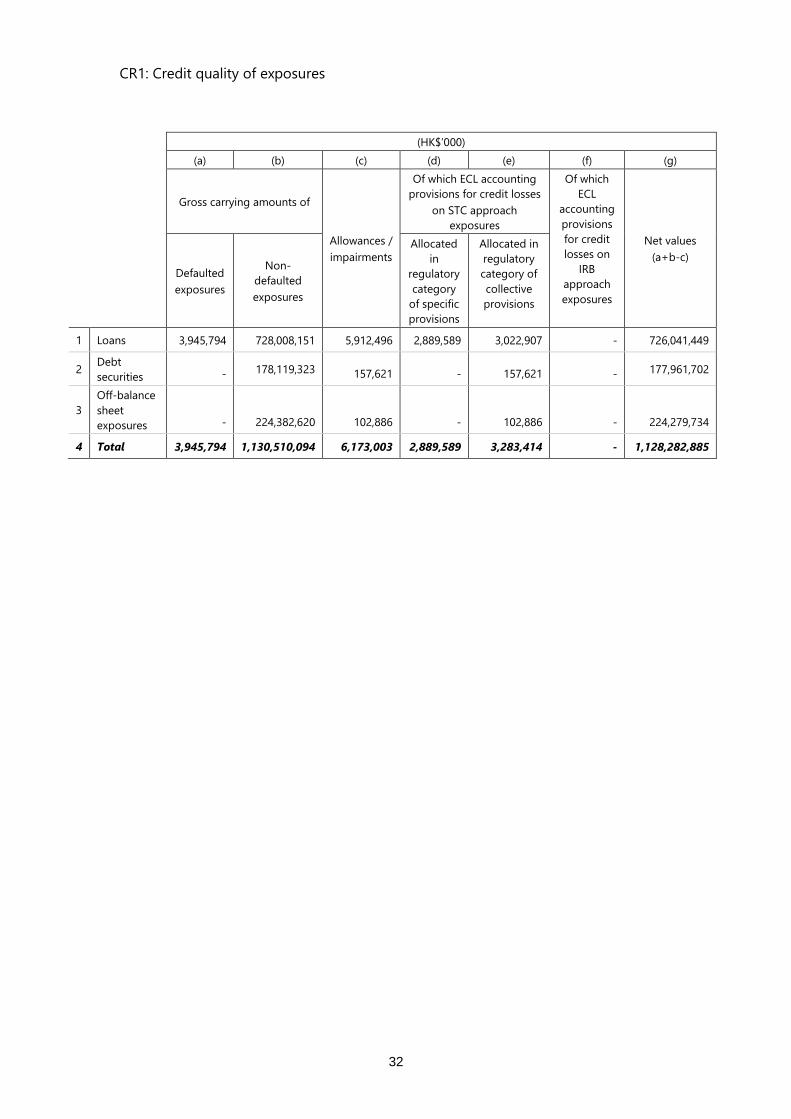
(HK$’000)
(a) (b) (c) (d) (e) (f) (g)
Gross carrying amounts of
Allowances /
impairments
Of which ECL accounting
provisions for credit losses
on STC approach
exposures
Of which
ECL
accounting
provisions
for credit
losses on
IRB
approach
exposures
Net values
(a+b-c)
Defaulted
exposures
Non-
defaulted
exposures
Allocated
in
regulatory
category
of specific
provisions
Allocated in
regulatory
category of
collective
provisions
1 Loans 3,945,794 728,008,151 5,912,496 2,889,589 3,022,907 - 726,041,449
2 Debt
securities - 178,119,323 157,621 - 157,621 - 177,961,702
3
Off-balance
sheet
exposures - 224,382,620 102,886 - 102,886 - 224,279,734
4 Total 3,945,794 1,130,510,094 6,173,003 2,889,589 3,283,414 - 1,128,282,885
CR2: Changes in defaulted loans and debt securities
33
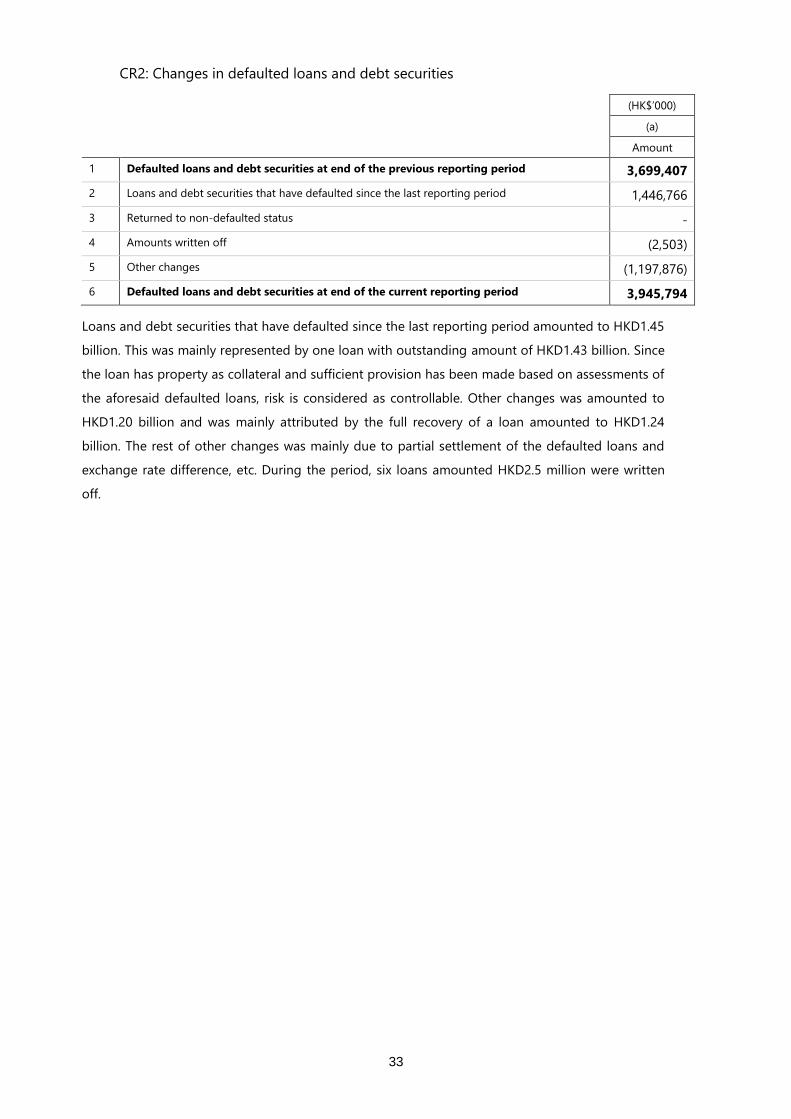
(HK$’000)
(a)
Amount
1 Defaulted loans and debt securities at end of the previous reporting period 3,699,407
2 Loans and debt securities that have defaulted since the last reporting period 1,446,766
3 Returned to non-defaulted status -
4 Amounts written off (2,503)
5 Other changes (1,197,876)
6 Defaulted loans and debt securities at end of the current reporting period 3,945,794
Loans and debt securities that have defaulted since the last reporting period amounted to HKD1.45
billion. This was mainly represented by one loan with outstanding amount of HKD1.43 billion. Since
the loan has property as collateral and sufficient provision has been made based on assessments of
the aforesaid defaulted loans, risk is considered as controllable. Other changes was amounted to
HKD1.20 billion and was mainly attributed by the full recovery of a loan amounted to HKD1.24
billion. The rest of other changes was mainly due to partial settlement of the defaulted loans and
exchange rate difference, etc. During the period, six loans amounted HKD2.5 million were written
off.

CR3: Overview of recognized credit risk mitigation
34
(HK$’000)
(a) (b1) (b) (d) (f)
Exposures
unsecured:
carrying
amount
Exposures to
be secured
Exposures
secured by
recognized
collateral
Exposures
secured by
recognized
guarantees
Exposures
secured by
recognized
credit derivative
contracts
1 Loans 678,287,605 47,753,844 13,463,490 34,290,354 -
2 Debt securities 177,961,702 - - - -
3 Total 856,249,307 47,753,844 13,463,490 34,290,354 -
4 Of which defaulted 3,945,794 1,121,599 1,083,860 37,739 -
The Group adopts the standardized (credit risk) approach (STC) for all the non-securitization
credit risk RWA, and the simply approach in treatment of recognized collateral for the
purpose of calculating RWA. Meanwhile, the recognized collateral and the recognized
guarantees were used as risk mitigation measures to manage the credit risk exposure,
without involving any recognized credit derivative contract. There is no material movement of
CR3 template compared with 31 December 2018.

CR4: Credit risk exposures and effects of recognized credit risk mitigation – for STC approach
35
(HK$’000) %
(a) (b) (c) (d) (e) (f)
Exposures pre-CCF and pre-CRM Exposures post-CCF and post-CRM RWA and RWA density
Exposure classes On-balance sheet amount Off-balance sheet amount On-balance sheet amount Off-balance sheet amount RWA RWA density
1 Sovereign exposures 49,998,418 - 66,678,325 1,763 185,233 0%
2 PSE exposures 5,596,370 414,000 7,502,478 157,000 1,355,737 18%
2a Of which: domestic PSEs 787,416 414,000 2,693,524 157,000 570,105 20%
2b Of which: foreign PSEs 4,808,954 - 4,808,954 - 785,632 16%
3 Multilateral development bank exposures 2,977,697 - 2,977,697 - - 0%
4 Bank exposures 333,250,738 156,141 369,447,291 191,785 132,858,318 36%
5 Securities firm exposures 185,240 1,692,244 185,240 - 92,620 50%
6 Corporate exposures 445,337,158 186,211,687 380,413,718 26,227,611 385,100,324 95%
7 CIS exposures 6,665,373 6,438,966 6,665,373 3,219,483 9,884,856 100%
8 Cash items 561,216 - 12,950,443 2,452,426 1,192,985 8%
9 Exposures in respect of failed delivery on
transactions entered into on a basis other
than a delivery-versus-payment basis - - - - - NA
10 Regulatory retail exposures 20,654,807 28,583,667 20,481,111 25,077 15,379,641 75%
11 Residential mortgage loans 49,062,597 - 47,157,930 - 22,510,873 48%
12 Other exposures which are not past due
exposures 21,166,904 585,915 20,996,912 5 20,996,917 100%
13 Past due exposures 1,465,887 - 1,465,887 - 1,631,834 111%
14 Significant exposures to commercial
entities - - - - - NA
15 Total 936,922,405 224,082,620 936,922,405 32,275,150 591,189,338 61%
CR4: Credit risk exposures and effects of recognized credit risk mitigation – for STC approach
(continued)
36
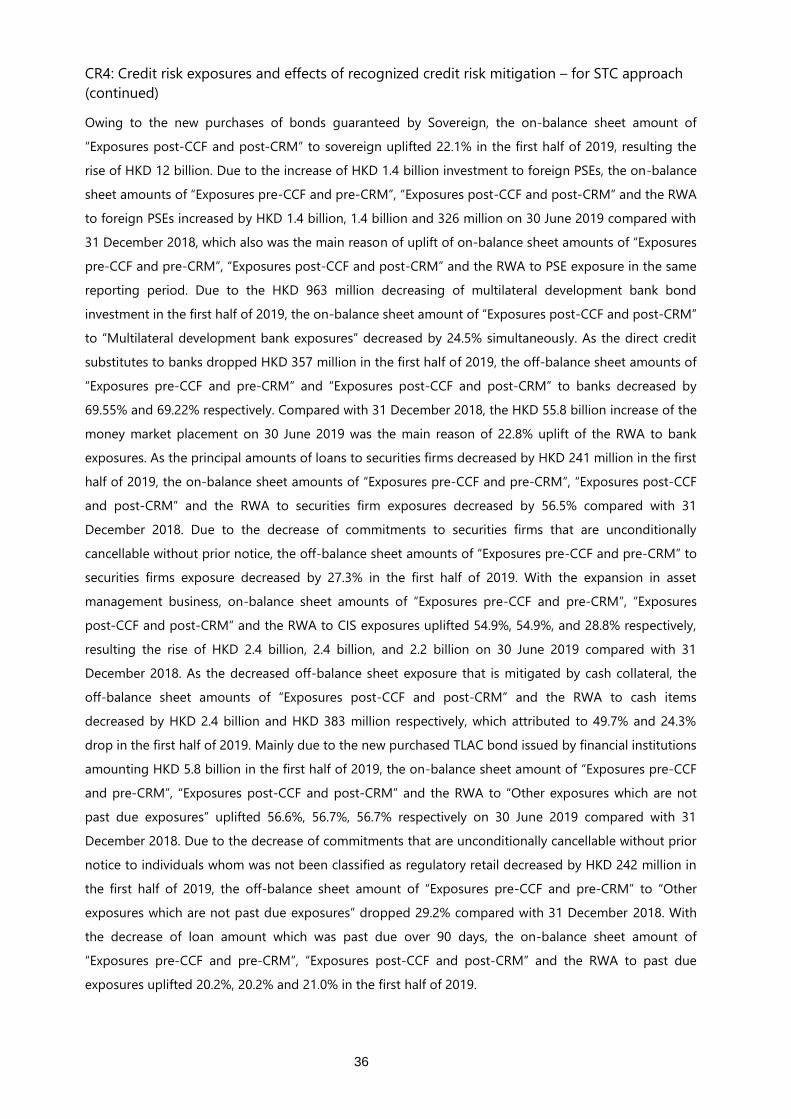
Owing to the new purchases of bonds guaranteed by Sovereign, the on-balance sheet amount of
“Exposures post-CCF and post-CRM” to sovereign uplifted 22.1% in the first half of 2019, resulting the
rise of HKD 12 billion. Due to the increase of HKD 1.4 billion investment to foreign PSEs, the on-balance
sheet amounts of “Exposures pre-CCF and pre-CRM”, “Exposures post-CCF and post-CRM” and the RWA
to foreign PSEs increased by HKD 1.4 billion, 1.4 billion and 326 million on 30 June 2019 compared with
31 December 2018, which also was the main reason of uplift of on-balance sheet amounts of “Exposures
pre-CCF and pre-CRM”, “Exposures post-CCF and post-CRM” and the RWA to PSE exposure in the same
reporting period. Due to the HKD 963 million decreasing of multilateral development bank bond
investment in the first half of 2019, the on-balance sheet amount of “Exposures post-CCF and post-CRM”
to “Multilateral development bank exposures” decreased by 24.5% simultaneously. As the direct credit
substitutes to banks dropped HKD 357 million in the first half of 2019, the off-balance sheet amounts of
“Exposures pre-CCF and pre-CRM” and “Exposures post-CCF and post-CRM” to banks decreased by
69.55% and 69.22% respectively. Compared with 31 December 2018, the HKD 55.8 billion increase of the
money market placement on 30 June 2019 was the main reason of 22.8% uplift of the RWA to bank
exposures. As the principal amounts of loans to securities firms decreased by HKD 241 million in the first
half of 2019, the on-balance sheet amounts of “Exposures pre-CCF and pre-CRM”, “Exposures post-CCF
and post-CRM” and the RWA to securities firm exposures decreased by 56.5% compared with 31
December 2018. Due to the decrease of commitments to securities firms that are unconditionally
cancellable without prior notice, the off-balance sheet amounts of “Exposures pre-CCF and pre-CRM” to
securities firms exposure decreased by 27.3% in the first half of 2019. With the expansion in asset
management business, on-balance sheet amounts of “Exposures pre-CCF and pre-CRM”, “Exposures
post-CCF and post-CRM” and the RWA to CIS exposures uplifted 54.9%, 54.9%, and 28.8% respectively,
resulting the rise of HKD 2.4 billion, 2.4 billion, and 2.2 billion on 30 June 2019 compared with 31
December 2018. As the decreased off-balance sheet exposure that is mitigated by cash collateral, the
off-balance sheet amounts of “Exposures post-CCF and post-CRM” and the RWA to cash items
decreased by HKD 2.4 billion and HKD 383 million respectively, which attributed to 49.7% and 24.3%
drop in the first half of 2019. Mainly due to the new purchased TLAC bond issued by financial institutions
amounting HKD 5.8 billion in the first half of 2019, the on-balance sheet amount of “Exposures pre-CCF
and pre-CRM”, “Exposures post-CCF and post-CRM” and the RWA to “Other exposures which are not
past due exposures” uplifted 56.6%, 56.7%, 56.7% respectively on 30 June 2019 compared with 31
December 2018. Due to the decrease of commitments that are unconditionally cancellable without prior
notice to individuals whom was not been classified as regulatory retail decreased by HKD 242 million in
the first half of 2019, the off-balance sheet amount of “Exposures pre-CCF and pre-CRM” to “Other
exposures which are not past due exposures” dropped 29.2% compared with 31 December 2018. With
the decrease of loan amount which was past due over 90 days, the on-balance sheet amount of
“Exposures pre-CCF and pre-CRM”, “Exposures post-CCF and post-CRM” and the RWA to past due
exposures uplifted 20.2%, 20.2% and 21.0% in the first half of 2019.

CR5: Credit risk exposures by asset classes and by risk weights – for STC approach
37
(HK$’000)
(a) (b) (c) (d) (e) (f) (g) (h) (ha) (i) (j)
Risk Weight
Exposure class
0% 10% 20% 35% 50% 75% 100% 150% 250% Others
Total credit
risk exposures
amount (post
CCF and post
CRM)
1 Sovereign exposures 65,753,925 - 926,163 - - - - - - - 66,680,088
2 PSE exposures 880,795 - 6,778,683 - - - - - - - 7,659,478
2a Of which: domestic PSEs - - 2,850,524 - - - - - - - 2,850,524
2b Of which: foreign PSEs 880,795 - 3,928,159 - - - - - - - 4,808,954
3 Multilateral development
bank exposures 2,977,697 - - - - - - - - - 2,977,697
4 Bank exposures - - 174,632,779 - 194,149,068 - 857,229 - - - 369,639,076
5 Securities firm exposures - - - - 185,240 - - - - - 185,240
6 Corporate exposures
- - 1,402,951 - 40,837,288 - 364,401,090 - - -
406,641,329
7 CIS exposures - - - - - - 9,884,856 - - - 9,884,856
8 Cash items 9,437,939 - 5,964,930 - - - - - - - 15,402,869
9 Exposures in respect of
failed delivery on
transactions entered into
on a basis other than a
delivery-versus-payment
basis - - - - - - - - - - -
10 Regulatory retail exposures - - - - - 20,506,188 - - - - 20,506,188
11 Residential mortgage
loans - - - 36,160,801 - 4,570,150 6,426,979 - - - 47,157,930
12 Other exposures which are
not past due exposures - - - - - - 20,996,917 - - - 20,996,917

CR5: Credit risk exposures by asset classes and by risk weights – for STC approach
38
(HK$’000)
(a) (b) (c) (d) (e) (f) (g) (h) (ha) (i) (j)
Risk Weight
Exposure class
0% 10% 20% 35% 50% 75% 100% 150% 250% Others
Total credit
risk exposures
amount (post
CCF and post
CRM)
13 Past due exposures 6,198 - - - - - 1,115,400 344,289 - - 1,465,887
14 Significant exposures to
commercial entities - - - - - - - - - - -
15 Total 79,056,554 - 189,705,506 36,160,801 235,171,596 25,076,338 403,682,471 344,289 - - 969,197,555
Owing to the new purchases of bond investment HKD 16.3 billion which was guaranteed by the high external rating governments, the Sovereign exposures
with 0% risk weight uplifted 22.5% in the first half of 2019. As the Group decreased the bond investment HKD 274 million in the sovereign foreign PSEs, the
PSE exposures of which foreign PSEs with 0% risk weight dropped 23.7% on 30 June 2019 compared with 31 December 2018. With the increased bond
investment HKD 1.6 billion in the 20% risk weight foreign PSEs by the Group, the PSE exposures of which foreign PSEs with 20% risk weight uplifted 71% in
the first half of 2019, which also attributed to the 36.4% increase of PSE exposures with 20% risk weight. Due to the HKD 963 million decrease of multilateral
development bank bond investment, the multilateral development bank exposures with 0% risk weight dropped 24.5% compared with 31 December 2018.
Mostly due to the HKD 55.8 billion increase of the money market placement on 30 June 2019, the bank exposures with 50% risk weight increased by 53.1%
compared with the end of 2018. Due to the decrease in exposure to banks with lower external ratings, the bank exposures with 100% risk weight decreased
HKD 1.7 billion, which attributed to the 68.5% drop in bank exposures with 100% risk weight in the first half of 2019. As the principal amounts of loans to
securities firms decreased HKD 241 million in the first half of 2019, the securities firms with 50% risk weight dropped 56.5% compared with the end of 2018.
Owing to the decrease in investment in the corporate bond with relevant high external ratings to HKD 436 million in the first half of 2019, the corporate
exposures with 20% risk weight decreased by 23.7% compared with 31 December 2018. Due to the decrease of the on-balance sheet exposures mitigated by
cash collateral on which the 20% risk weight applied, the cash items with 20% risk weight decreased by HKD 1.8 billion, which attributed to 24.3% drop of
cash items with 20% risk weight in the first half of 2019. Following the expansion of residential mortgage business, there is a total increase in exposures to
residential mortgage loans with 35%, 75%, and 100% risk weight by HKD 2.8 billion in the first half of 2019. Mainly due to the newly purchased TLAC bond
issued by financial institutions amounting HKD 5.8 billion in the first half of 2019, the other exposures which are not past due exposures uplifted 56.7% on 30

CR5: Credit risk exposures by asset classes and by risk weights – for STC approach
39
June 2019 compared with 31 December 2018. With the decreasing of loan amount HKD 371 million which was past due over 90 days, the past due exposures
with 150% risk weight dropped 27.3% in the first half of 2019.

CCR1: Analysis of counterparty default risk exposures (other than those to CCPs) by
approaches
40
(HK$’000)
(a) (b) (c) (d) (e) (f)
Replacement
cost (RC) PFE
Effective
EPE
Alpha (α)
used for
computin
g default
risk
exposure
Default risk
exposure after
CRM
RWA
1 SA-CCR (for derivative contracts) - - 1.4 - -
1a CEM 7,335,613 10,958,874 - 18,294,487 10,090,522
2 IMM (CCR) approach - - - -
3 Simple Approach (for SFTs) 30,942,099 1,277,260
4 Comprehensive Approach (for SFTs) - -
5 VaR (for SFTs) - -
6 Total 11,367,782
Compared with 31 December 2018, the overall CEM RWA increased by 26% from HKD 8
billion to 10 billion. The current exposure of interest rates and equity contracts increased
HKD 1.3 billion, which contributed to HKD 1.1 billion RWA increase. In addition, the overall
position increase in foreign exchange and commodities derivative contracts contributed
additional HKD 0.5 billion and HKD 0.4 billion RWA respectively.

CCR2: CVA capital charge
41
(HK$’000)
(a) (b)
EAD post CRM RWA
Netting sets for which CVA capital charge is calculated by the advanced
CVA method - -
1 (i) VaR (after application of multiplication factor if applicable) -
2 (ii) Stressed VaR (after application of multiplication factor if applicable) -
3 Netting sets for which CVA capital charge is calculated by the
standardized CVA method 21,390,435 5,855,400
4 Total 21,390,435 5,855,400
On 30 June 2019, there was no material movement of CCR2 template compared with 31
December 2018.

CCR3: Counterparty default risk exposures (other than those to CCPs) by asset classes and by risk weights – for STC approach
42
(HK$’000)
(a) (b) (c) (ca) (d) (e) (f) (g) (ga) (h) (i)
Risk Weight
Exposure class
0% 10% 20% 35% 50% 75% 100% 150% 250% Others
Total default risk
exposure after
CRM
1 Sovereign exposures - - - - - - - - - - -
2 PSE exposures - - - - - - - - - - -
2a Of which: domestic PSEs - - - - - - - - - - -
2b Of which: foreign PSEs - - - - - - - - - - -
3 Multilateral development bank
exposures - - - - - - - - - - -
4 Bank exposures 27,862,599 - 8,710,606 - 5,379,008 - - - - - 41,952,213
5 Securities firm exposures - - - - - - - - - - -
6 Corporate exposures 250,884 - - - 127,130 - 6,612,541 - - - 6,990,555
7 CIS exposures - - - - - - - - - - -
8 Regulatory retail exposures - - - - - 135,065 - - - - 135,065
9 Residential mortgage loans - - - - - - - - - - -
10 Other exposures which are not past
due exposures - - - - - - 158,753 - - - 158,753
11 Significant exposures to commercial
entities - - - - - - - - - - -
12 Total 28,113,483 - 8,710,606 - 5,506,138 135,065 6,771,294 - - - 49,236,586

CCR3: Counterparty default risk exposures (other than those to CCPs) by asset classes and by risk weights – for STC approach
43
Compared with 31 December 2018, the overall default risk exposure increased by 20% from HKD 41.0 billion to 49.2 billion, mainly contributed
by the increase in 0% risk weight exposure by HKD 6.3 billion and the 100% risk weight corporate exposure by HKD 1.8 billion. The increase was
mainly contributed by overall increase in Repo business and OTC derivative contracts’ default risk exposure by HKD 4.7 billion and HKD 3.6
billion respectively.

CCR5: Composition of collateral for counterparty default risk exposures (including
those for contracts or transactions cleared through CCPs)
44
(HK$’000)
(a) (b) (c) (d) (e) (f)
Derivative contracts SFTs
Fair value of recognized
collateral received
Fair value of posted
collateral
Fair value of
recognized
collateral
received
Fair value of
posted
collateral Segregated Unsegregated Segregated Unsegregated
Cash - domestic currency - - - - - -
Cash - other currencies 303,773 - - - 17,095,503 448,927
Domestic sovereign debt - - - - - -
Other sovereign debt - - - - - 6,977,895
Domestic PSE debt - - - - - 384,306
Government agency debt - - - - - -
Corporate bonds - - - - - 6,818,009
Bank bonds/debts - - - - - 10,994,204
Equity securities - - - - 281,414 -
Other collateral - - - - - 5,037,344
Total 303,773 - - - 17,376,917 30,660,685
The increase of collateral incurred by derivative contracts was due to the increase of
replacement cost in netting set with counterparties under VMCSA contracts. In the meantime,
to deal with the short term liquidity management, the Group made use of REPO and
Reverse-REPO market and entered trades with original maturity less than 3 months. Thus, the
distribution of collateral received and posted in SFTs would show relatively material
movements in the reporting period.

CCR6: Credit-related derivatives contracts
45
(HK$’000)
(a) (b)
Protection bought Protection sold
Notional amounts
Single-name credit default swaps - -
Index credit default swaps - -
Total return swaps - -
Credit-related options - -
Other credit-related derivative contracts - -
Total notional amounts - -
Fair values
Positive fair value (asset) - -
Negative fair value (liability) - -

CCR8: Exposures to CCPs
46
(HK$’000)
(a) (b)
Exposure after CRM RWA
1 Exposures of the AI as clearing member or client to qualifying
CCPs (total) 1,388,248
2 Default risk exposures to qualifying CCPs (excluding items disclosed
in rows 7 to 10), of which: 3,095,949 61,919
3 (i) OTC derivative transactions 3,095,949 61,919
4 (ii) Exchange-traded derivative contracts - -
5 (iii) Securities financing transactions - -
6 (iv) Netting sets subject to valid cross-product netting agreements - -
7 Segregated initial margin -
8 Unsegregated initial margin 3,845,291 76,906
9 Funded default fund contributions 123,222 1,249,423
10 Unfunded default fund contributions - -
11 Exposures of the AI as clearing member or client to
non-qualifying CCPs (total) -
12 Default risk exposures to non-qualifying CCPs (excluding items
disclosed in rows 17 to 20), of which: - -
13 (i) OTC derivative transactions - -
14 (ii) Exchange-traded derivative contracts - -
15 (iii) Securities financing transactions - -
16 (iv) Netting sets subject to valid cross-product netting agreements - -
17 Segregated initial margin -
18 Unsegregated initial margin - -
19 Funded default fund contributions - -
20 Unfunded default fund contributions - -
Compared with 31 December 2018, the CCP RWA increased from HKD 819 million to HKD
1,388 million due to more initial margin and default fund requested by the qualifying CCPs to
the Group as the business development, and which contributed HKD 48 million and HKD 512
million RWA increase respectively.

SEC1: Securitization exposures in banking book
47
(HK$’000)
(a) (b) (c) (d) (e) (f) (g) (h) (i)
Acting as originator (excluding sponsor) Acting as sponsor Acting as investor
Traditional Synthetic Sub-total Traditional Synthetic Sub-total Traditional Synthetic Sub-total
1 Retail (total) – of which: - - - - - - - - -
2 residential mortgage - - - - - - - - -
3 credit card - - - - - - - - -
4 other retail exposures - - - - - - - - -
5 re-securitization exposures - - - - - - - - -
6 Wholesale (total) – of which: - - - - - - - - -
7 loans to corporates - - - - - - - - -
8 commercial mortgage - - - - - - - - -
9 lease and receivables - - - - - - - - -
10 other wholesale - - - - - - - - -
11 re-securitization exposures - - - - - - - - -

SEC2: Securitization exposures in trading book
48
(HK$’000)
(a) (b) (c) (d) (e) (f) (g) (h) (i)
Acting as originator (excluding sponsor) Acting as sponsor Acting as investor
Traditional Synthetic Sub-total Traditional Synthetic Sub-total Traditional Synthetic Sub-total
1 Retail (total) – of which: - - - - - - - - -
2 residential mortgage - - - - - - - - -
3 credit card - - - - - - - - -
4 other retail exposures - - - - - - - - -
5 re-securitization exposures - - - - - - - - -
6 Wholesale (total) – of which: - - - - - - - - -
7 loans to corporates - - - - - - - - -
8 commercial mortgage - - - - - - - - -
9 lease and receivables - - - - - - - - -
10 other wholesale - - - - - - - - -
11 re-securitization exposures - - - - - - - - -
SEC3: Securitization exposures in banking book and associated capital requirements – where AI acts as originator
49
(HK$’000)
(a) (b) (c) (d) (e) (f) (g) (h) (i) (j) (k) (l) (m) (n) (o) (p) (q)
Exposure values (by RW bands)
Exposure values
(by regulatory approach)
RWAs
(by regulatory approach) Capital charges after cap
≤20%
RW
>20%
to
50%
RW
>50%
to
100%
RW
>100%
to
<1250%
RW
1250%
RW
SEC
-IR
BA
SEC
-ER
B
A (
incl
.
IAA
)
SEC
-SA
SEC
-FB
A
SEC
-IR
BA
SEC
-ER
B
A (
incl
.
IAA
)
SEC
-SA
SEC
-FB
A
SEC
-IR
BA
SEC
-ER
B
A (
incl
.
IAA
)
SEC
-SA
SEC
-FB
A
1 Total exposures - - - - - - - - - - - - - - - - -
2 Traditional securitization - - - - - - - - - - - - - - - - -
3 Of which securitization - - - - - - - - - - - - - - - - -
4 Of which retail - - - - - - - - - - - - - - - - -
5 Of which wholesale - - - - - - - - - - - - - - - - -
6 Of which re-securitization - - - - - - - - - - - - - - - - -
7 Of which senior - - - - - - - - - - - - - - - - -
8 Of which non-senior - - - - - - - - - - - - - - - - -
9 Synthetic securitization - - - - - - - - - - - - - - - - -
10 Of which securitization - - - - - - - - - - - - - - - - -
11 Of which retail - - - - - - - - - - - - - - - - -
12 Of which wholesale - - - - - - - - - - - - - - - - -
13 Of which re-securitization - - - - - - - - - - - - - - - - -
14 Of which senior - - - - - - - - - - - - - - - - -
15 Of which non-senior - - - - - - - - - - - - - - - - -

SEC4: Securitization exposures in banking book and associated capital requirements – where AI acts as investor
50
(HK$’000)
(a) (b) (c) (d) (e) (f) (g) (h) (i) (j) (k) (l) (m) (n) (o) (p) (q)
Exposure values (by RW bands)
Exposure values
(by regulatory approach)
RWAs
(by regulatory approach) Capital charges after cap
≤20%
RW
>20%
to
50%
RW
>50%
to
100%
RW
>100%
to
<1250%
RW
1250%
RW
SEC
-IR
BA
SEC
-ER
B
A (
incl
.
IAA
)
SEC
-SA
SEC
-FB
A
SEC
-IR
BA
SEC
-ER
B
A (
incl
.
IAA
)
SEC
-SA
SEC
-FB
A
SEC
-IR
BA
SEC
-ER
B
A (
incl
.
IAA
)
SEC
-SA
SEC
-FB
A
1 Total exposures - - - - - - - - - - - - - - - - -
2 Traditional securitization - - - - - - - - - - - - - - - - -
3 Of which securitization - - - - - - - - - - - - - - - - -
4 Of which retail - - - - - - - - - - - - - - - - -
5 Of which wholesale - - - - - - - - - - - - - - - - -
6 Of which re-securitization - - - - - - - - - - - - - - - - -
7 Of which senior - - - - - - - - - - - - - - - - -
8 Of which non-senior - - - - - - - - - - - - - - - - -
9 Synthetic securitization - - - - - - - - - - - - - - - - -
10 Of which securitization - - - - - - - - - - - - - - - - -
11 Of which retail - - - - - - - - - - - - - - - - -
12 Of which wholesale - - - - - - - - - - - - - - - - -
13 Of which re-securitization - - - - - - - - - - - - - - - - -
14 Of which senior - - - - - - - - - - - - - - - - -
15 Of which non-senior - - - - - - - - - - - - - - - - -

MR1: Market risk under STM approach
51
(HK$’000)
(a)
RWA
Outright product exposures
1 Interest rate exposures (general and specific risk) 5,885,925
2 Equity exposures (general and specific risk) -
3 Foreign exchange (including gold) exposures 13,313,262
4 Commodity exposures 2,477,300
Option exposures
5 Simplified approach -
6 Delta-plus approach 65,863
7 Other approach -
8 Securitization exposures -
9 Total 21,742,350
Compared with 31 Dec 2018, Market risk RWA increased in 30 June 2019 as a result of the
increase in Commodity risk. RWA of Commodity risk increased by HKD 1.67 billion as
commodity position increased in the first half of 2019.