innovative uses of wood promotes market development and supports forest sustainability : a win win...
TRANSCRIPT

Innovative Uses of Wood Promotes Market Development and Supports Forest Sustainability : A win win Situation for Society,Forest Products Industry, and Forest Owners
Al SchulerUSDA Forest ServicePrinceton, WV USA
UNECE Timber Committee & ForumForestier Lemanique SymposiumNeuchatel, SwitzerlandSeptember 23-26, 2002

Background
Need to better utilize the world’s forests – 90% are underutilized
Forest sustainability requires forest management (costs $)
Many wood products are becoming mature while competition is increasing in key markets
Construction is the key market – they are in transition
Need to develop new and innovative (competitive) wood products
Solution(s) – Research and Development (conversion technology forest management including biotechnology, marketing (promoting wood use), ……………
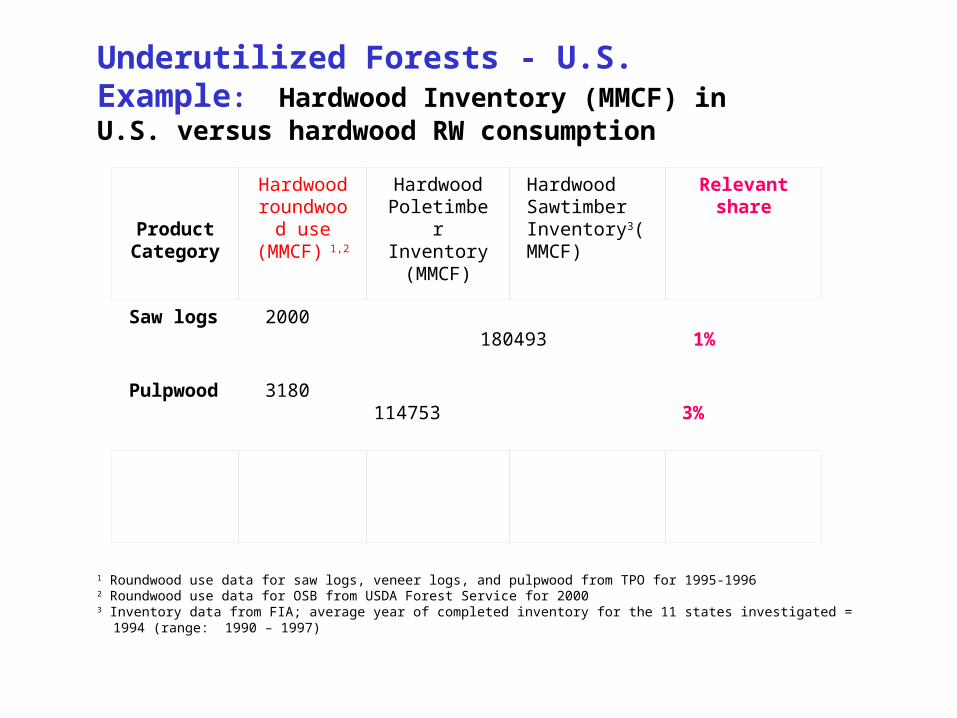
Saw logs 2000 180493 1%
Pulpwood 3180 114753 3%
Product Category
Hardwoodroundwood
use(MMCF) 1,2
Hardwood Poletimber Inventory (MMCF)
Hardwood Sawtimber Inventory3(MMCF)
Relevant share
Underutilized Forests - U.S. Example: Hardwood Inventory (MMCF) in U.S. versus hardwood RW consumption
1 Roundwood use data for saw logs, veneer logs, and pulpwood from TPO for 1995-19962 Roundwood use data for OSB from USDA Forest Service for 20003 Inventory data from FIA; average year of completed inventory for the 11 states investigated = 1994 (range: 1990 – 1997)

Natural Forests : Managed vs Unmanaged – 1980’s estimate
0
500
1000
1500
2000
Boreal Temperate Tropical
Unmanaged ManagedSource: Bowyer FPJ, February 1995
Milions of hectares
Impact – Puts too much Pressure on a few geographic regions, few Species, and sizes/grades. - need conversion Technology that isn’t species and size specific!!!
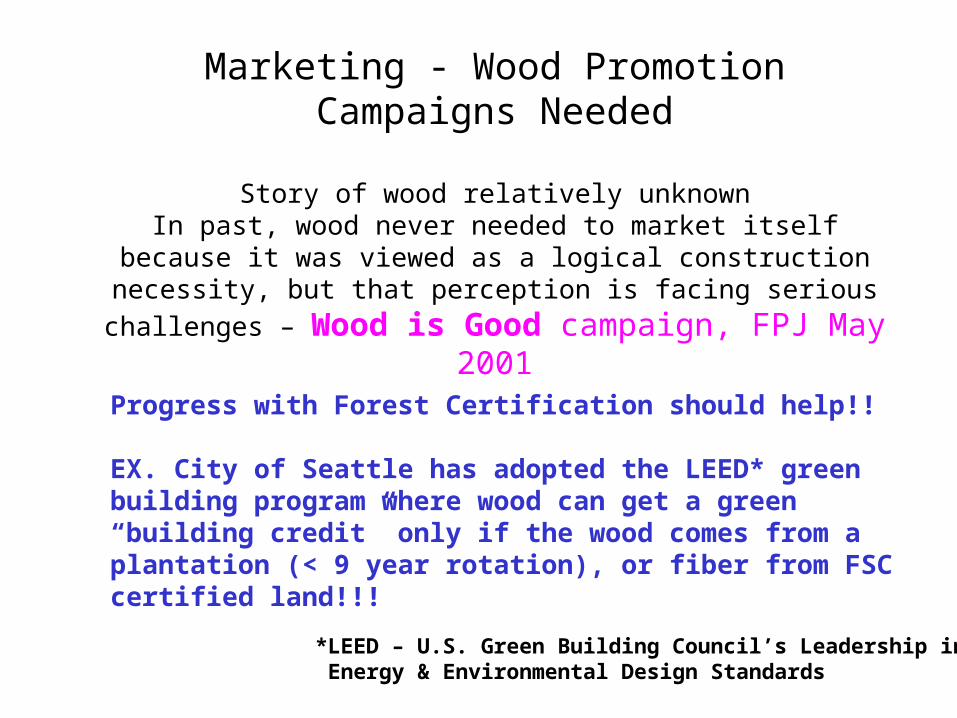
Marketing - Wood Promotion Campaigns Needed
Story of wood relatively unknownIn past, wood never needed to market itself because it was
viewed as a logical construction necessity, but that perception is facing serious challenges – Wood is
Good campaign, FPJ May 2001
Progress with Forest Certification should help!!
EX. City of Seattle has adopted the LEED* green building program where wood can get a green“building credit” only if the wood comes from a plantation (< 9 year rotation), or fiber from FSCcertified land!!!
*LEED – U.S. Green Building Council’s Leadership in Energy & Environmental Design Standards
Global Industrial Forest Plantations
0
20
40
60
80
100
120
140
1990 2000
Million Hectares
Source: Bowyer, Wood & Fiber Science 3(3): 318-333
Plantations less than 3% of natural forests areaPlanting genetically modified trees – big role in helping Northern hemisphere based industry remain globally competitive
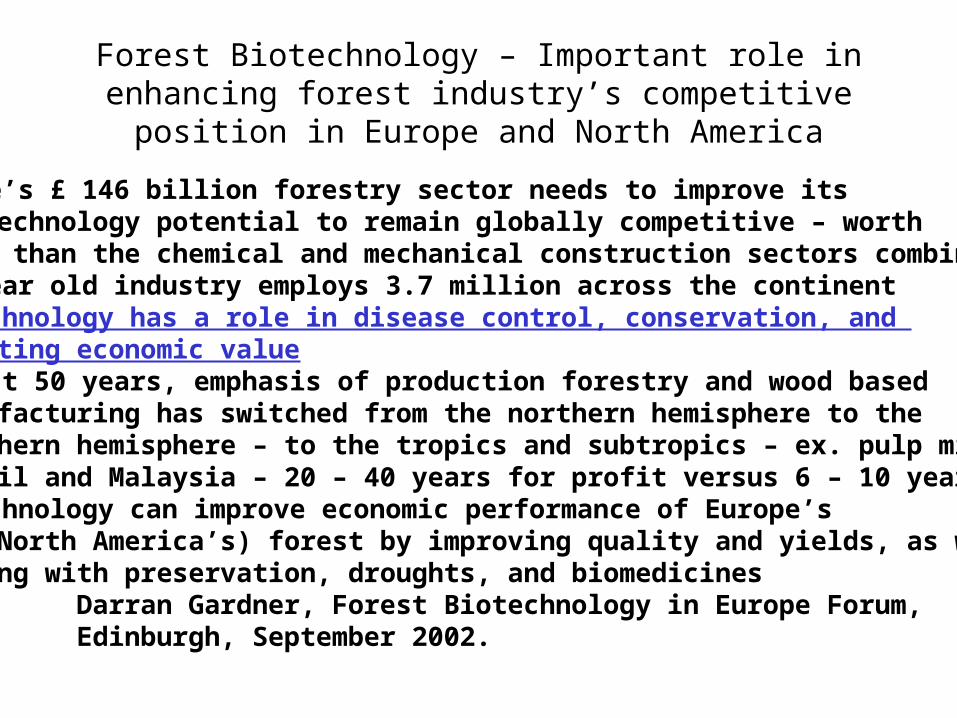
Forest Biotechnology – Important role in enhancing forest industry’s competitive position
in Europe and North America
Europe’s £ 146 billion forestry sector needs to improve its biotechnology potential to remain globally competitive – worth more than the chemical and mechanical construction sectors combined300 year old industry employs 3.7 million across the continentBiotechnology has a role in disease control, conservation, and creating economic valueIn past 50 years, emphasis of production forestry and wood based manufacturing has switched from the northern hemisphere to the southern hemisphere – to the tropics and subtropics – ex. pulp mills in Brazil and Malaysia – 20 – 40 years for profit versus 6 – 10 yearsBiotechnology can improve economic performance of Europe’s (and North America’s) forest by improving quality and yields, as well as helping with preservation, droughts, and biomedicines
Darran Gardner, Forest Biotechnology in Europe Forum,Edinburgh, September 2002.
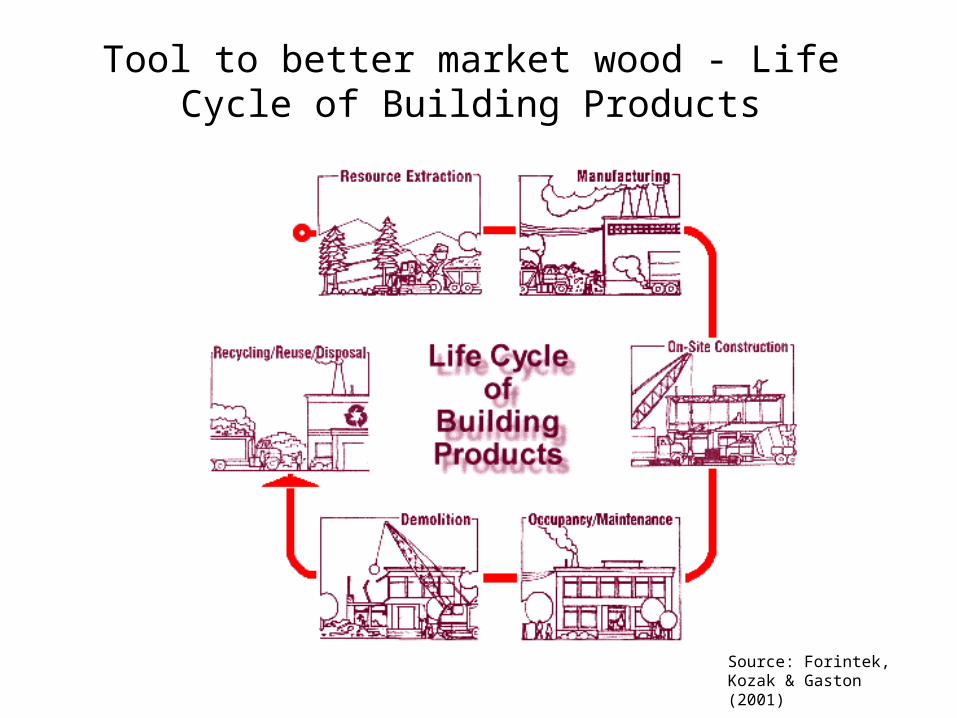
Tool to better market wood - Life Cycle of Building Products
Source: Forintek, Kozak & Gaston (2001)
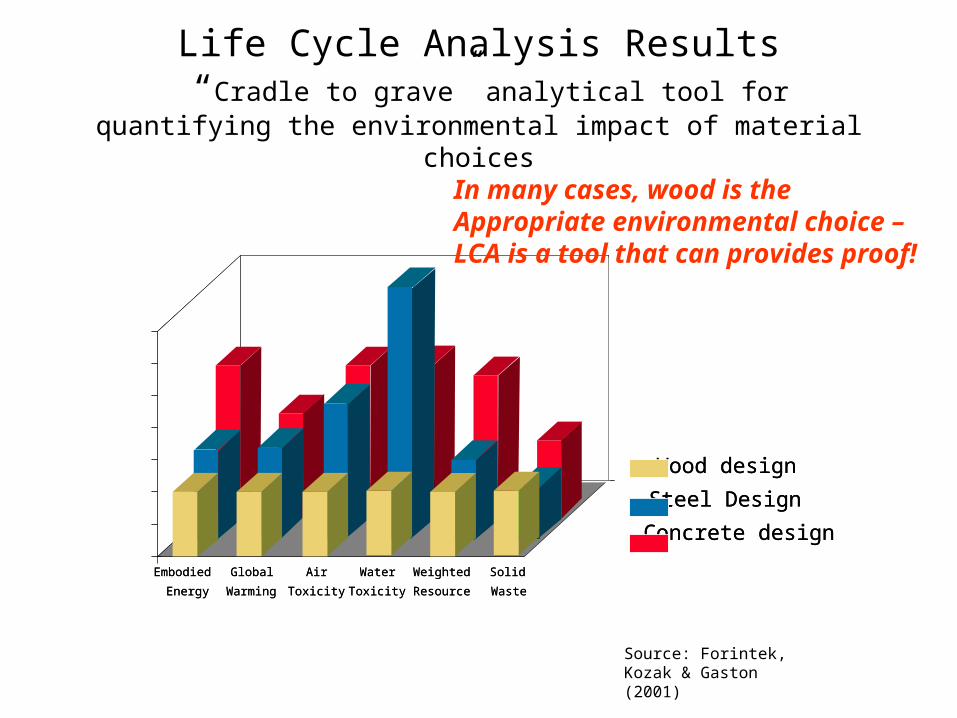
Life Cycle Analysis Results “Cradle to grave” analytical tool for quantifying the
environmental impact of material choices
Embodied
Energy
Global
Warming
Air
Toxicity
Water
Toxicity
Weighted
Resource
Solid
Waste
Wood design
Steel Design
Concrete design
Embodied
Energy
Global
Warming
Air
Toxicity
Water
Toxicity
Weighted
Resource
Solid
Waste
Wood design
Steel Design
Concrete design
Source: Forintek, Kozak & Gaston (2001)
In many cases, wood is theAppropriate environmental choice –LCA is a tool that can provides proof!
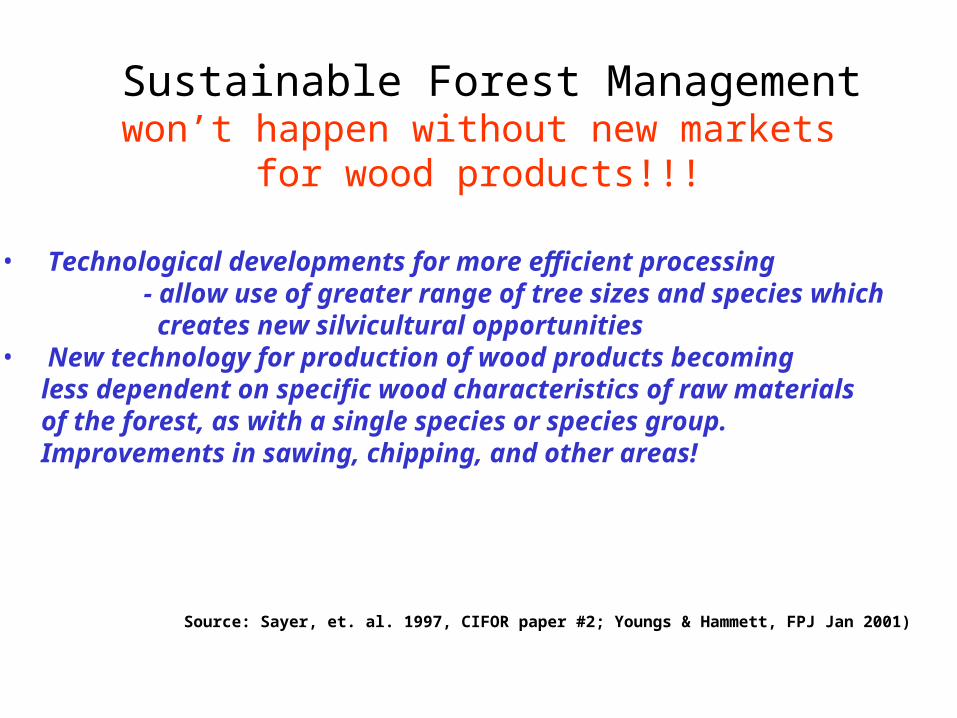
Sustainable Forest Managementwon’t happen without new markets for
wood products!!!
• Technological developments for more efficient processing- allow use of greater range of tree sizes and species which creates new silvicultural opportunities
• New technology for production of wood products becoming less dependent on specific wood characteristics of raw materials of the forest, as with a single species or species group. Improvements in sawing, chipping, and other areas!
Source: Sayer, et. al. 1997, CIFOR paper #2; Youngs & Hammett, FPJ Jan 2001)

Future Wood Fiber Source?? – need more innovative conversion technology
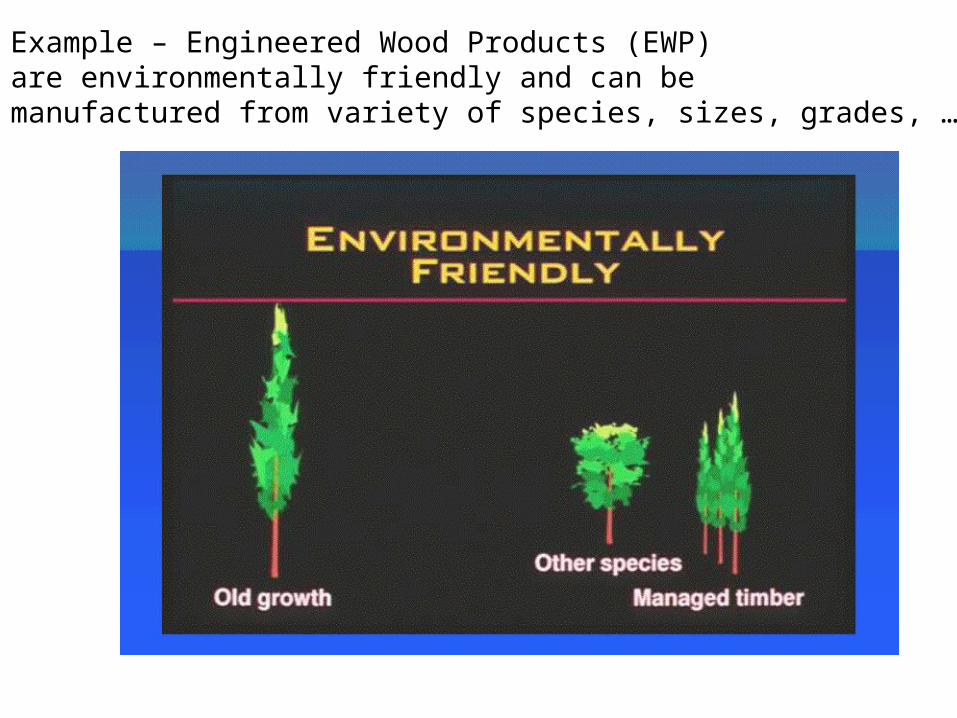
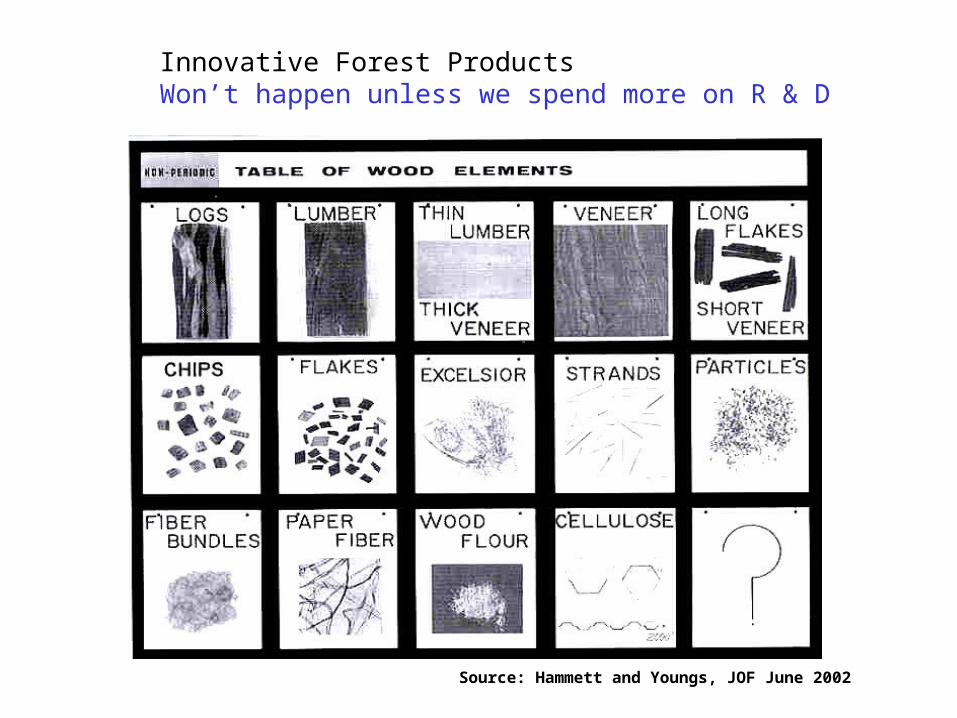
Example – Engineered Wood Products (EWP)are environmentally friendly and can be manufactured from variety of species, sizes, grades, …
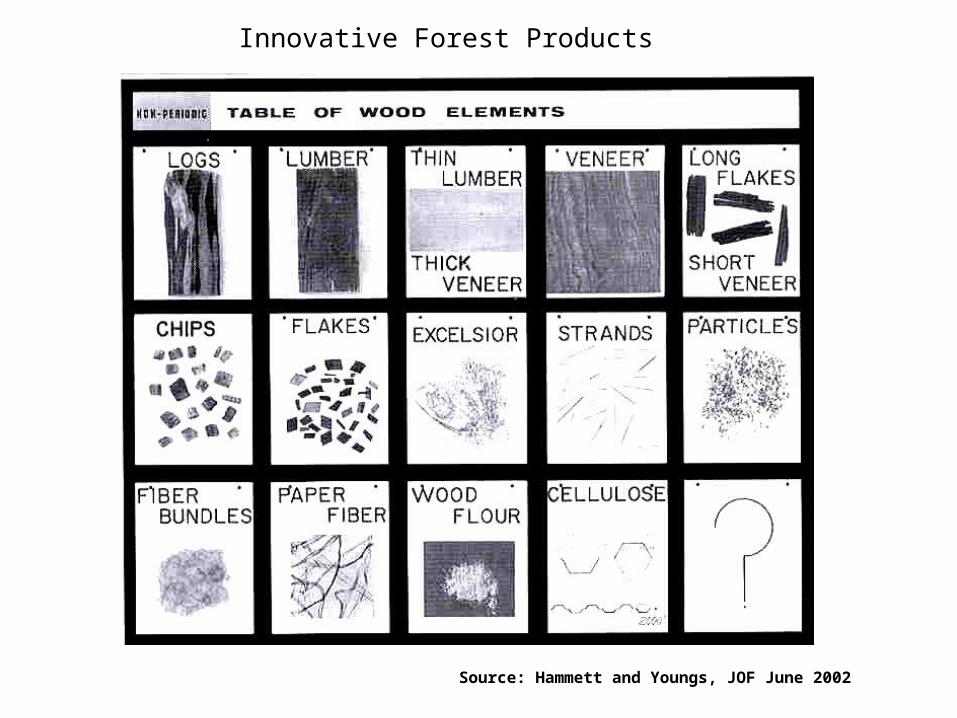
Source: Hammett and Youngs, JOF June 2002
Innovative Forest Products

Engineered Wood Products (EWP)
LVL
OSB
Wood I-Joist
Oriented Strand Lumber
LVL
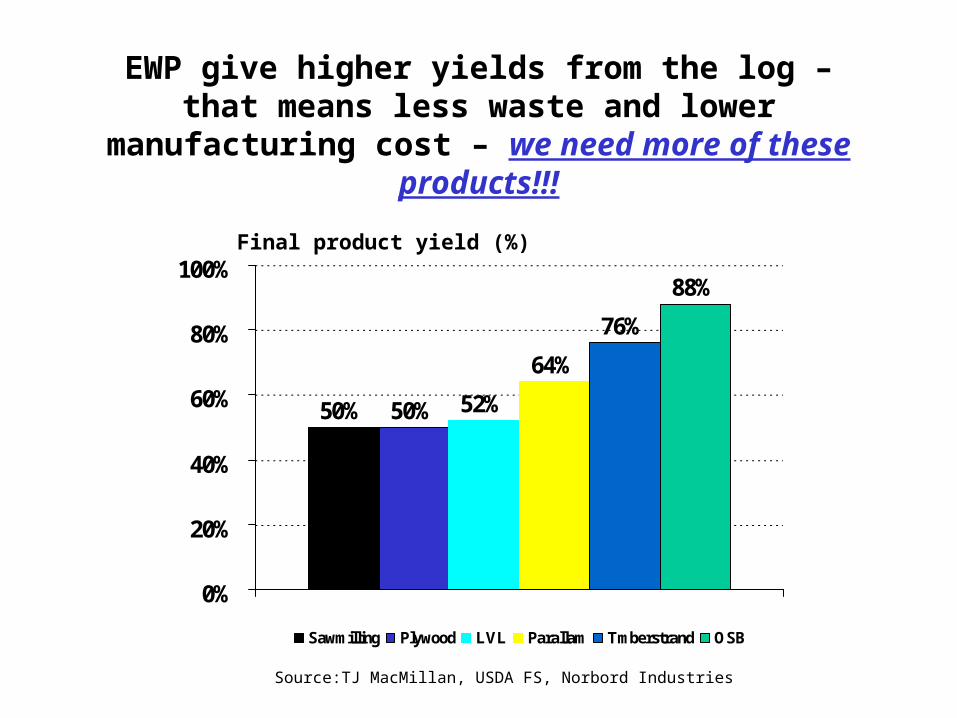
EWP give higher yields from the log – that means less waste and lower manufacturing cost – we need more of these products!!!
50% 50% 52%
64%
76%
88%
0%
20%
40%
60%
80%
100%
Sawmilling Plywood LVL Parallam Tmberstrand OSB
Final product yield (%)
Source:TJ MacMillan, USDA FS, Norbord Industries

Predictable Performance & non species dependentProducts via technology (I.e. performance based building codes)

Construction Market Issues: An Industry in Transition
Some issues/trends that are/will impact the business climate for the world’s wood
products industry!!!!
Need innovative solutions – new innovative wood products

Issue # 1 – Labor shortages
30%
40%
50%
60%
70%
1948 1952 1956 1960 1964 1968 1972 1976 1980 1984 1988 1992 1996 2000
16-34 year old
35-64 year old
Share of employed civilian labor force
Implications of a older labor force?More expensive labor!!! - Components (trusses, panelized wall systems, etc.)
Source: www.economagic.com/em-cgi/data.exe

Labor Cost Advantages for Manufactured Housing
0%
10%
20%
30%
40%
Direct Labor
Stick Built Modular Panelized
Source: Hallahan Associates, November 2000
Direct Labor share of costs (excl. finished lot and gross margins)

U.S. Lumber Component Industry Growth
$0
$2
$4
$6
$8
$10
$12
$14
1992 1998 2002 (E) 2006(E)
Roof Trusses Floor Trusses Wall Panels
Gross sales, US$ Billions
Source: WTCA – Structural Building Components trade journal, August 2001, May 2002
The industry is moving toward components that are made in a factory and delivered to the jobsite. Precision cut, no waste. Builders are learning to use components.
US$ Billion Sales
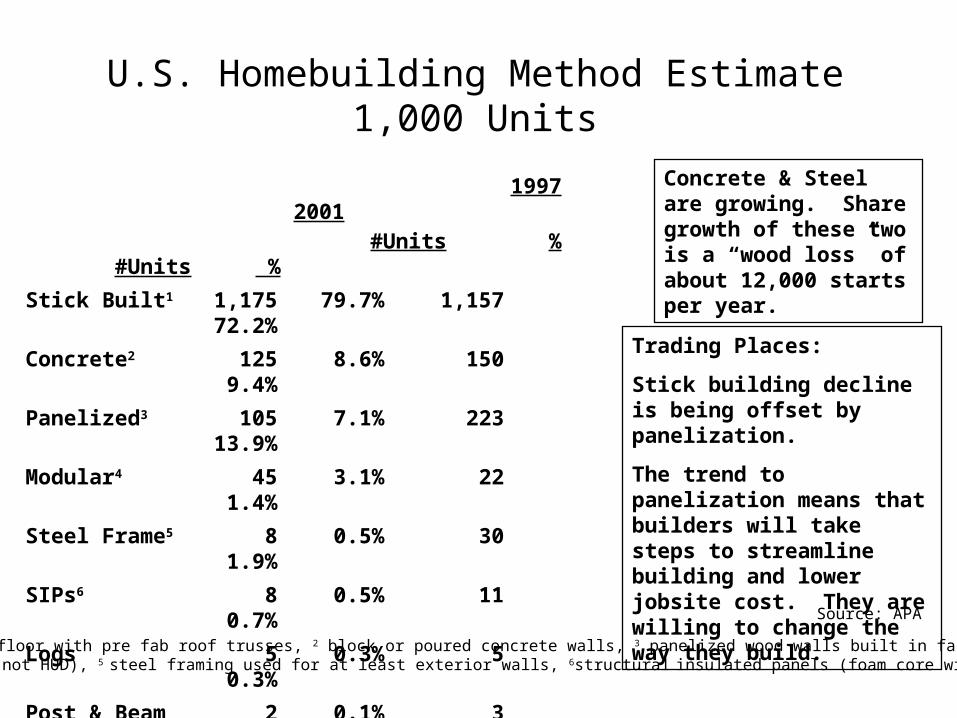
U.S. Homebuilding Method Estimate1,000 Units
1997 2001 #Units % #Units %
Stick Built1 1,175 79.7% 1,15772.2%
Concrete2 125 8.6% 1509.4%
Panelized3 105 7.1% 22313.9%
Modular4 45 3.1% 221.4%
Steel Frame5 8 0.5% 301.9%
SIPs6 8 0.5% 110.7%
Logs 5 0.3% 50.3%
Post & Beam 2 0.1% 30.2%
Other 1 0.1% 1 0.1%
TOTAL 1,474 100% 1,602 100%
Concrete & Steel are growing. Share growth of these two is a “wood loss” of about 12,000 starts per year.
Trading Places:
Stick building decline is being offset by panelization.
The trend to panelization means that builders will take steps to streamline building and lower jobsite cost. They are willing to change the way they build.
Source: APA
1 stick built walls and floor with pre fab roof trusses, 2 block or poured concrete walls, 3 panelized wood walls built in factory, 4 Factory built modules (not HUD), 5 steel framing used for at least exterior walls, 6structural insulated panels (foam core with structural panels)

World Demographic Profile - 1998
0%
20%
40%
0-19 20-44 45-64 65+
U.S. & Canada W. Europe Japan Mexico
Share of Population by Age
Source: U.S. Census, World Population Profile, WP/98
Europe and Japan are older thanNorth America – more impetus forFactory built housing/components
Japan has rapidly moved to pre-cut framing and wall panelization. They’ve gone there and we’re headed there.
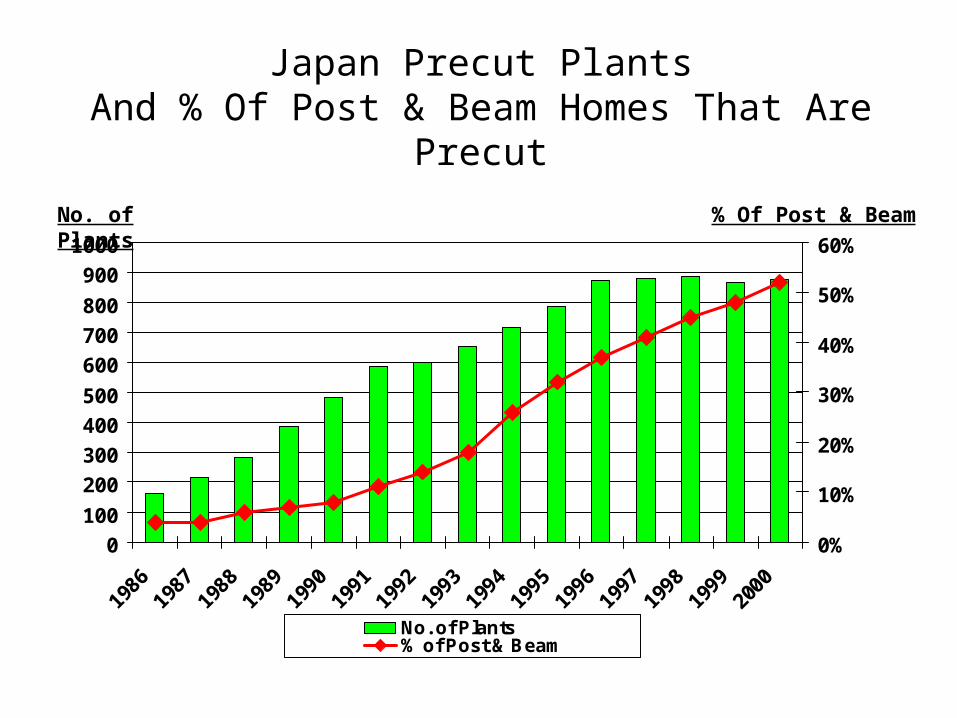
Japan Precut PlantsAnd % Of Post & Beam Homes That Are Precut
0
100
200
300
400
500
600
700
800
900
1000
1986
1987
1988
1989
1990
1991
1992
1993
1994
1995
1996
1997
1998
1999
2000
0%
10%
20%
30%
40%
50%
60%
No. of Plants% of Post & Beam
No. of Plants % Of Post & Beam

New and Innovative Building Productsand Engineered Systems
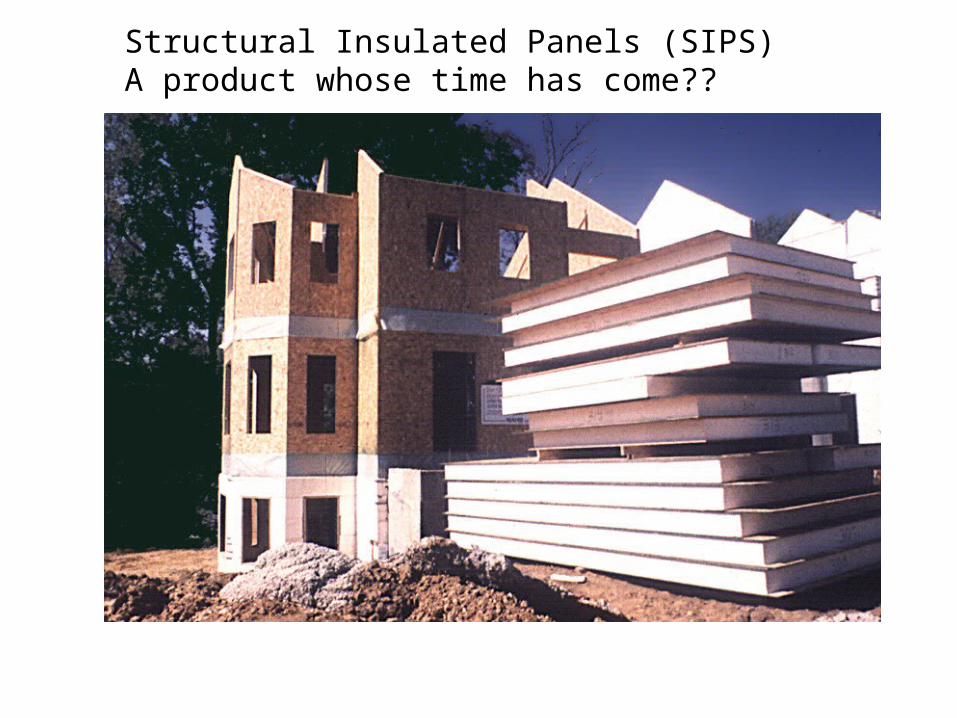
Structural Insulated Panels (SIPS) A product whose time has come??

SIPS

Modular Construction - 1
Source: Courtesy Cardinal Homes

Modular Construction – 2

Modular Construction – 3

LVL(Laminated Veneer Lumber) and OSBwall panels
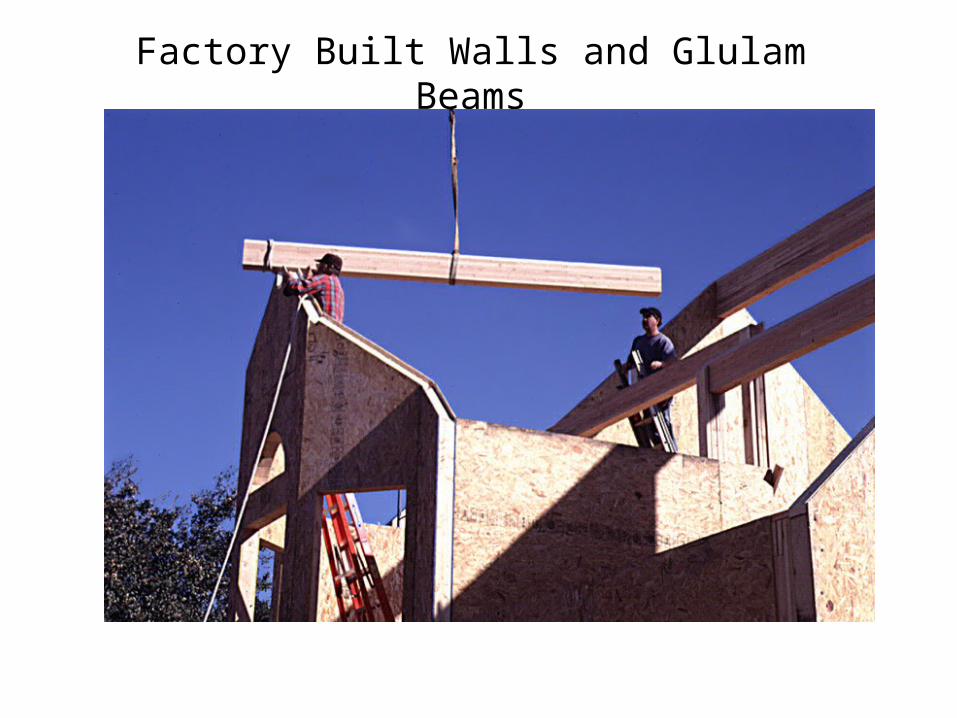
Factory Built Walls and Glulam Beams

Panelized Wall System for Modular Housing

Commercial Application – Glulam, I-JoistsAnd Parallam


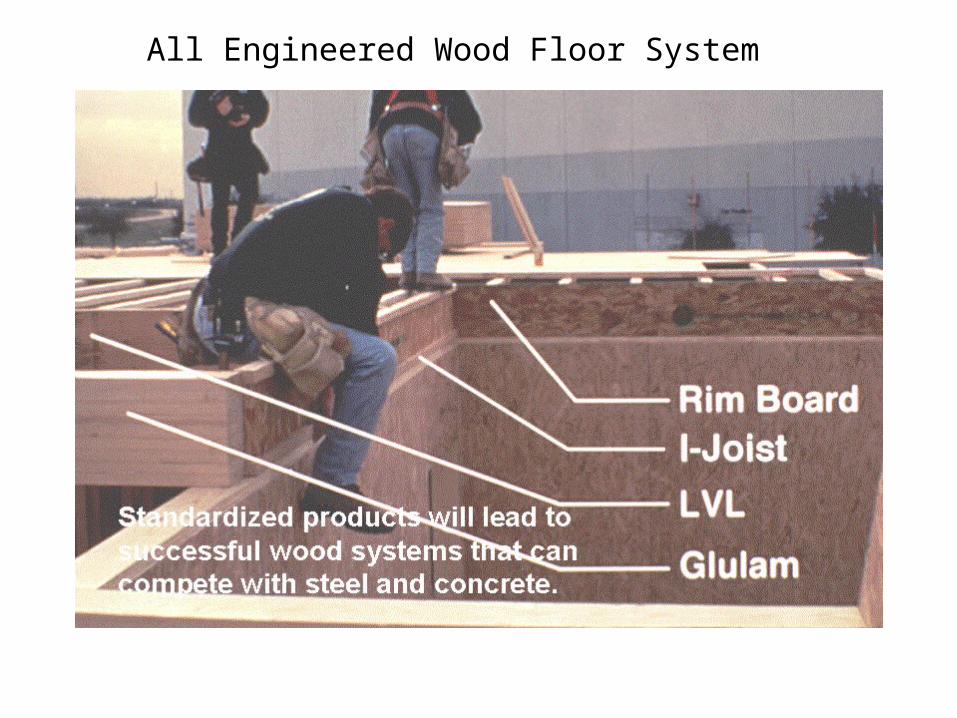
All Engineered Wood Floor System

Issue # 2 - Construction Site Waste
0
2000
4000
6000
8000
10000
Woo
d
Drywall
Cardb
oard
Met
alsViny
l
Mas
onry
othe
rTot
al
Pounds of waste for a 2000 Sq. Ft. Home in U.S.
Source: NAHB
8,000 pounds of waste per housing start

Waste from German Panelized Housing Project
Source: APA

Wood Fiber VolumePer Unit Floor Area – efficiencies with EWP’s
LVL flanged I-joist vs. Solid lumber joist:
Flooring applications:
46% less than lumber @ 16” OC (on center) vs.
I-joist @19.2” OC
36% less when both are at 16” OC
• Spelter & others. FPL-GTR-99. 1997.
Issue # 3 : Homebuilding Industry Consolidation
Rationale:Lower capital costs – important because 65% of builder’s assets tied up in inventoryOperating and O/H efficienciesLand control – land development costs exceed 25% of new homeBrand recognition – mobile society and some builders want to sell you your starter home, move up/custom, and retirement home – brand loyalty – consumer “lock in”Deeper pockets – larger builders have money for R&D, product development, etc.
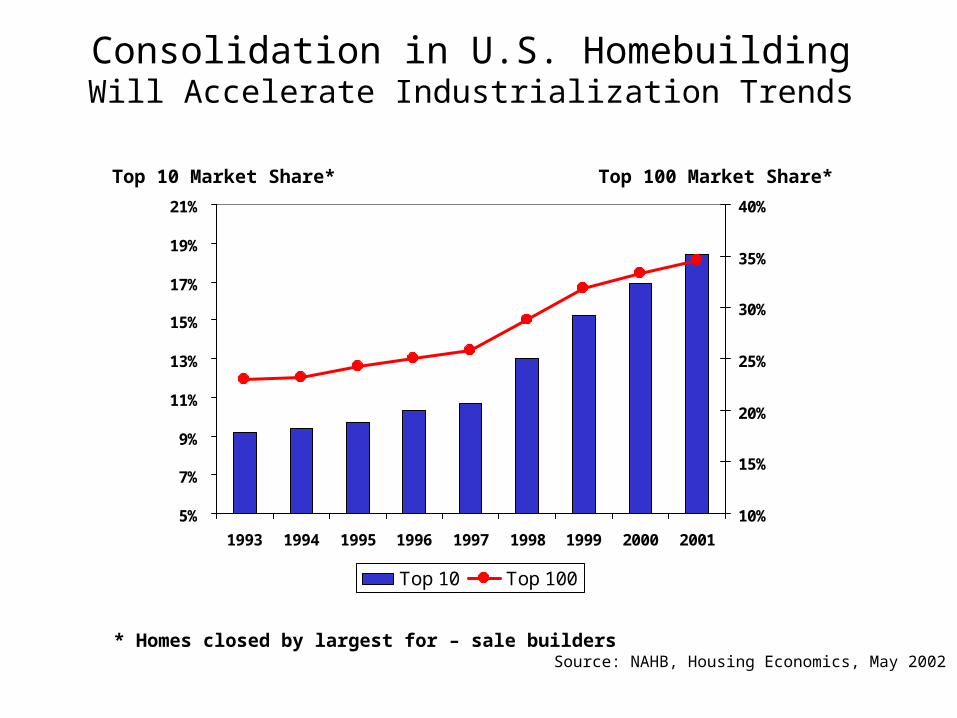
Consolidation in U.S. HomebuildingWill Accelerate Industrialization Trends
5%
7%
9%
11%
13%
15%
17%
19%
21%
1993 1994 1995 1996 1997 1998 1999 2000 2001
10%
15%
20%
25%
30%
35%
40%
Top 10 Top 100
Top 10 Market Share* Top 100 Market Share*
* Homes closed by largest for – sale buildersSource: NAHB, Housing Economics, May 2002

Issue # 4: Substitution
Many key conventional wood products are mature – losing market share to substitutes – steel, concrete, EWP’s, …
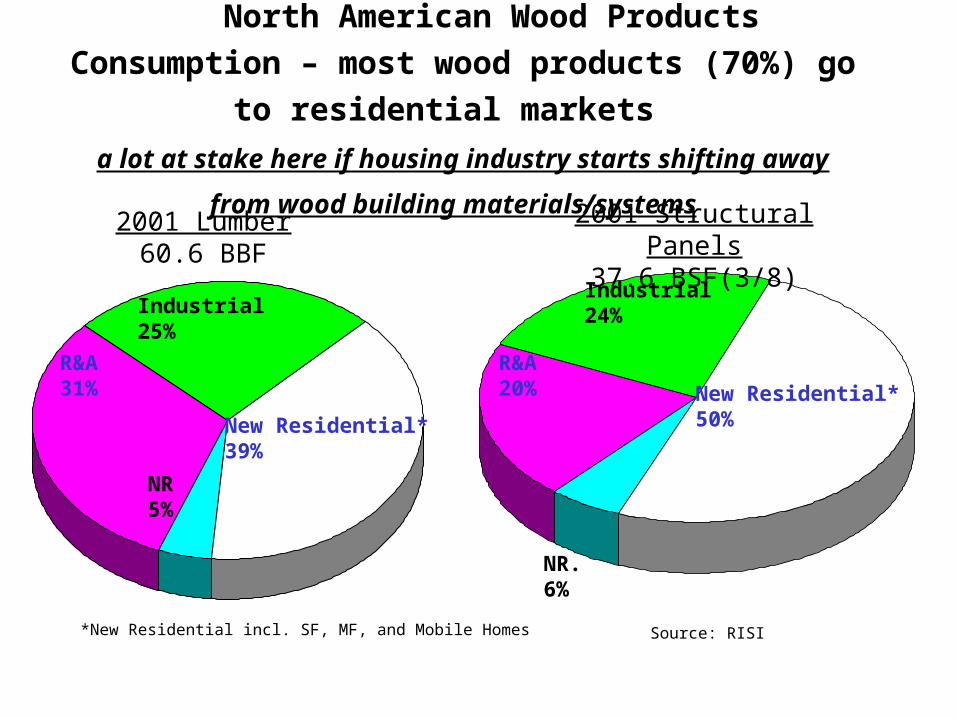
North American Wood Products Consumption –
most wood products (70%) go to residential markets
a lot at stake here if housing industry starts shifting away from
wood building materials/systems 2001 Lumber
60.6 BBF
Industrial25%
New Residential*39%
R&A31%
NR5%
2001 Structural Panels37.6 BSF(3/8)
New Residential*50%
Industrial24%
R&A20%
NR.6%
*New Residential incl. SF, MF, and Mobile Homes Source: RISI

Construction “Product Life Cycle”
0
100
Introduction Growth Maturity Decline
Pla
stic
Lu
mb
er
GF
B,
OS
L,
PS
L
En
gin
eere
d C
om
po
nen
ts
OS
B
LV
L &
I -
Jo
ists
Lam
inat
ed L
um
ber
- g
lula
m ?
Ind
us
tria
l P
lyw
oo
d
Ply
wo
od
Lu
mb
er
Au
tocl
aved
Co
ncr
ete
Source: USFS
Sal
es $
Time Horizon
MS
R L
um
ber
FJ
lum
ber
Ste
el S
tud
s Ro
of
Tru
ses
Co
nve
nti
on
al C
on
cret
e B
lock
Fo
am C
ore
P
anel
s
Alternatives to “mature” Lumber and Plywoodconventional wood expected to continue losing market share to materials with less maintenance, stronger, predictable performance, …
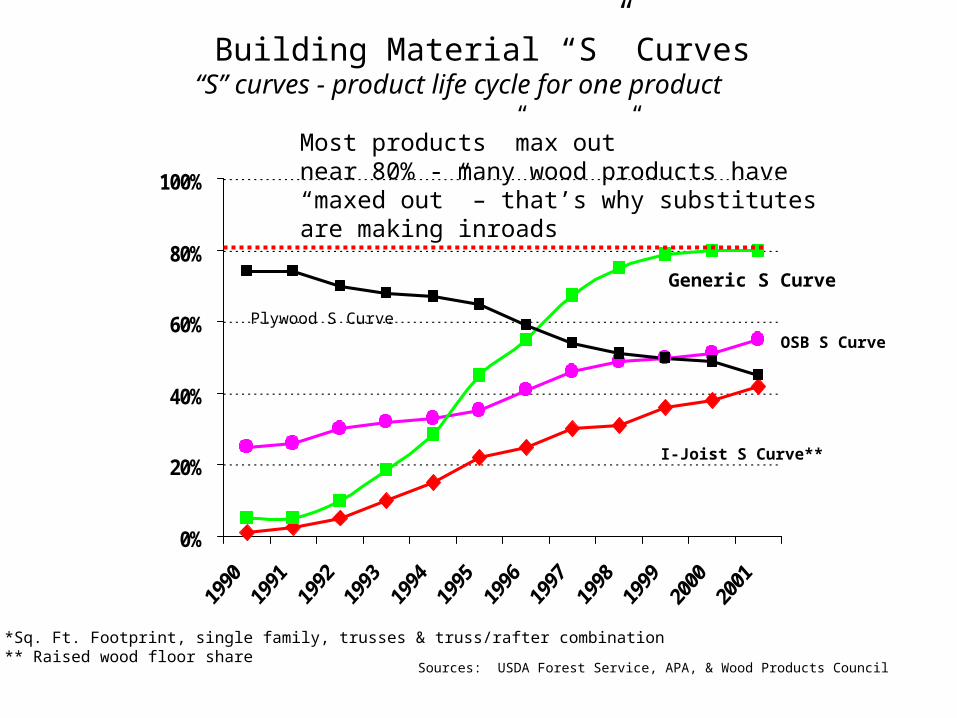
0%
20%
40%
60%
80%
100%
Generic S Curve
Market Share (%)
OSB S Curve
I-Joist S Curve**
Sources: USDA Forest Service, APA, & Wood Products Council
*Sq. Ft. Footprint, single family, trusses & truss/rafter combination ** Raised wood floor share
Building Material “S” Curves “S” curves - product life cycle for one product
Most products ”max out”near 80% - many wood products have“maxed out” – that’s why substitutes are making inroads
Plywood S Curve

Adoption of Technology (S – Curve) and Costs – Need R&D
New technology has to be competitive
0
10
2030
40
50
60
7080
90
100
Re
su
lts
(m
ark
et
sh
are
or
co
st)
Innovation Growth Maturity
Source: USFSTime Horizon
10%
90%
Cost Curve“New Products”
S – Curve for adoptionof “new products”

Interesting R & D Statistics
US Canada Sweden% Forest Sector GDP 1.6 3.0 3.7Commercial forest (000 Sq Km) 1956 2450 240Forestry R&D (US$ million) 471 113 65Forest Products R&D (US $ million) 1712 94 260
Sources: Forintek Canada Corporation, www.multex.com
Interesting annual R&D spending comparisons:Pfizer - $4.35 BillionMerck – $2.45 BIntel – $3.76 BIBM - $5.29 BWeyerhaeuser - $ 55 millionEntire U.S. Forest Products Industry - $1.72 Billion
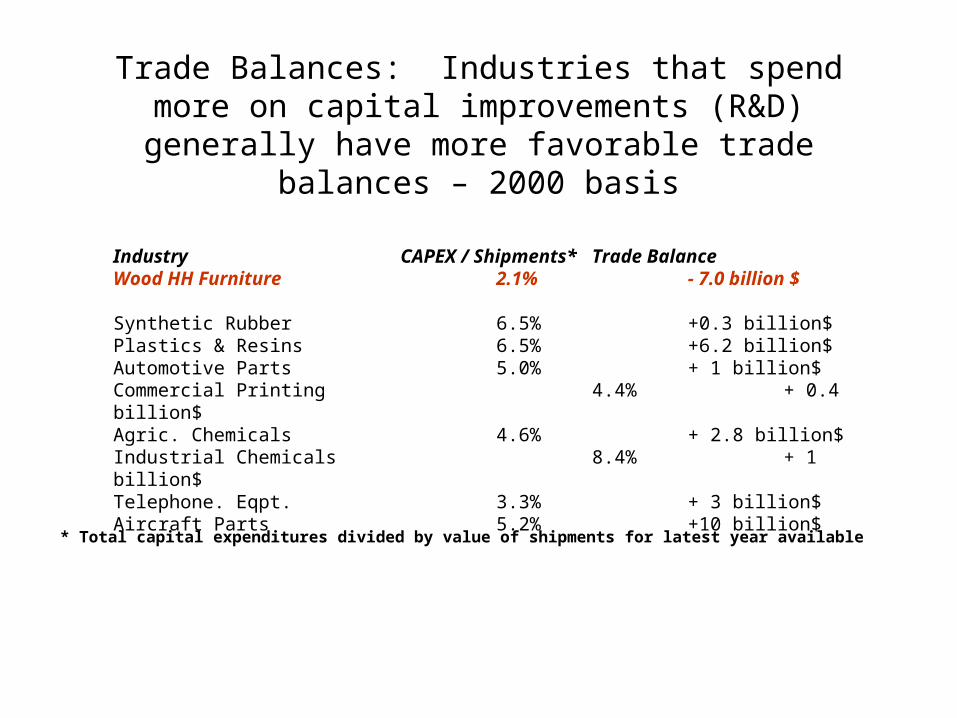
Trade Balances: Industries that spend more on capital improvements (R&D) generally have more favorable trade balances – 2000 basis
Industry CAPEX / Shipments* Trade BalanceWood HH Furniture 2.1% - 7.0 billion $
Synthetic Rubber 6.5% +0.3 billion$Plastics & Resins 6.5% +6.2 billion$Automotive Parts 5.0% + 1 billion$Commercial Printing 4.4% + 0.4 billion$Agric. Chemicals 4.6% + 2.8 billion$Industrial Chemicals 8.4% + 1 billion$Telephone. Eqpt. 3.3% + 3 billion$Aircraft Parts 5.2% +10 billion$
* Total capital expenditures divided by value of shipments for latest year available
Source: Hammett and Youngs, JOF June 2002
Innovative Forest ProductsWon’t happen unless we spend more on R & D
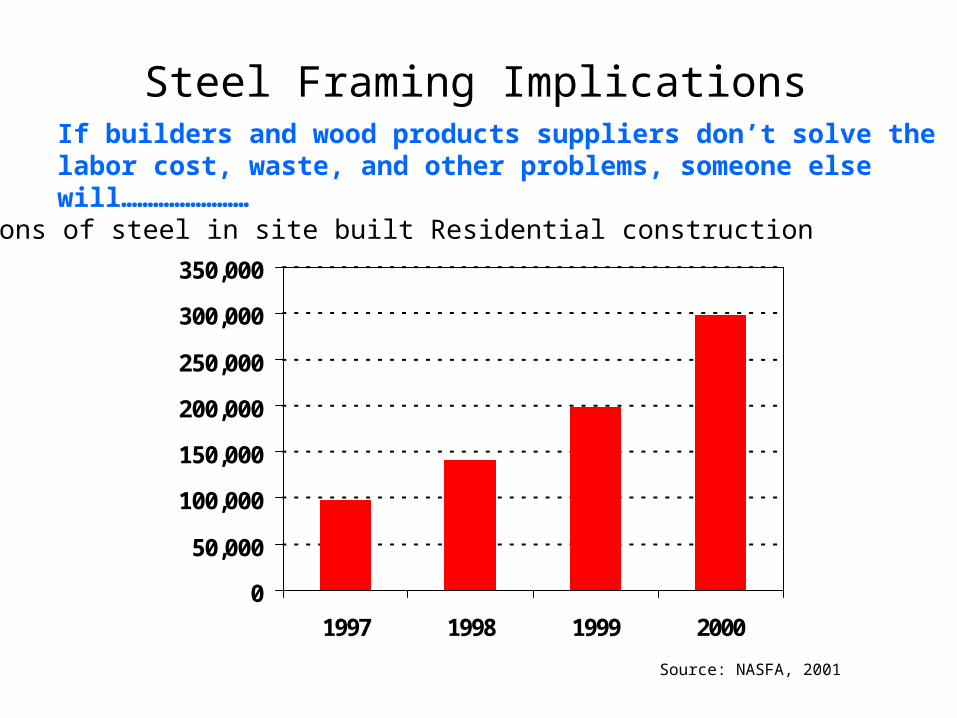
Steel Framing Implications
0
50,000
100,000
150,000
200,000
250,000
300,000
350,000
1997 1998 1999 2000
Tons of steel in site built Residential construction
Source: NASFA, 2001
If builders and wood products suppliers don’t solve the labor cost, waste, and other problems, someone else will……………………
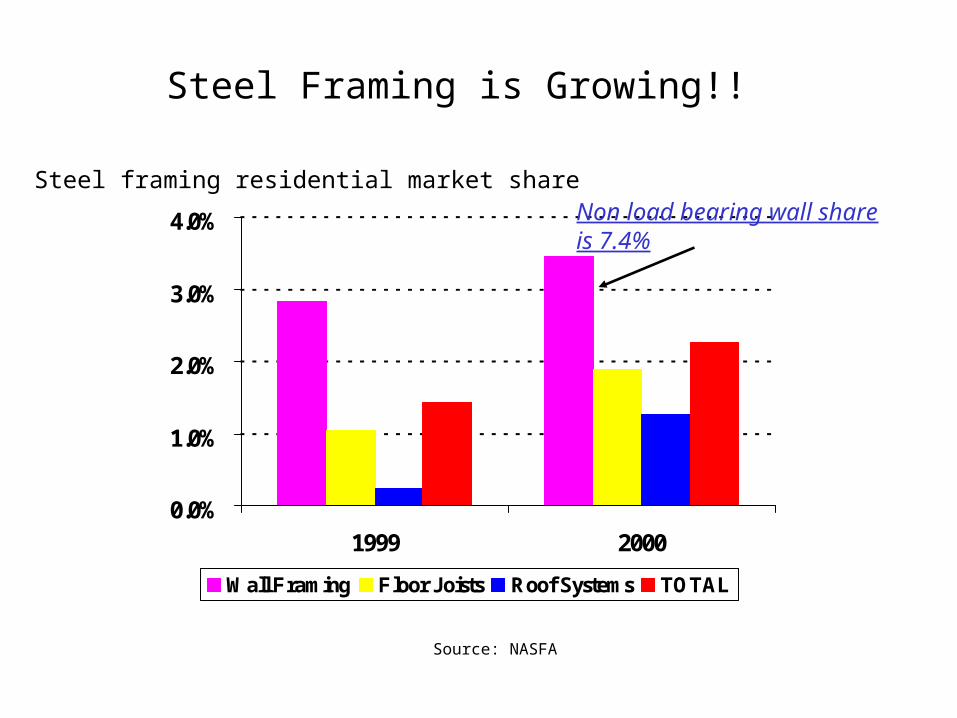
Steel Framing is Growing!!
0.0%
1.0%
2.0%
3.0%
4.0%
1999 2000
Wall Framing Floor Joists Roof Systems TOTAL
Steel framing residential market share
Source: NASFA
Non load bearing wall shareis 7.4%
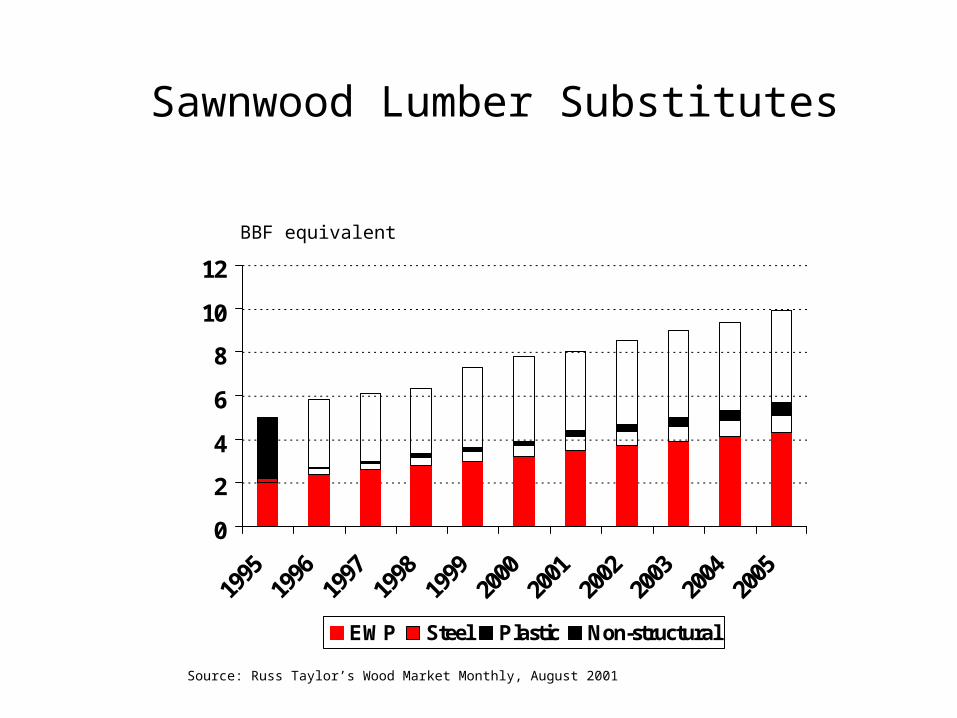
Sawnwood Lumber Substitutes
0
2
4
6
8
10
12
1995
1996
1997
1998
1999
2000
2001
2002
2003
2004
2005
EWP Steel Plastic Non-structural
BBF equivalent
Source: Russ Taylor’s Wood Market Monthly, August 2001

0%
20%
40%
60%
80%
100%
120%
Wall Framing Floors Roof Framing
1990 1998 2001
Roof trusses take market share
Lose share to I-Joists & Steel
Lose share to Steel & Concrete
Lumber market share
Lumber Losing Market Share
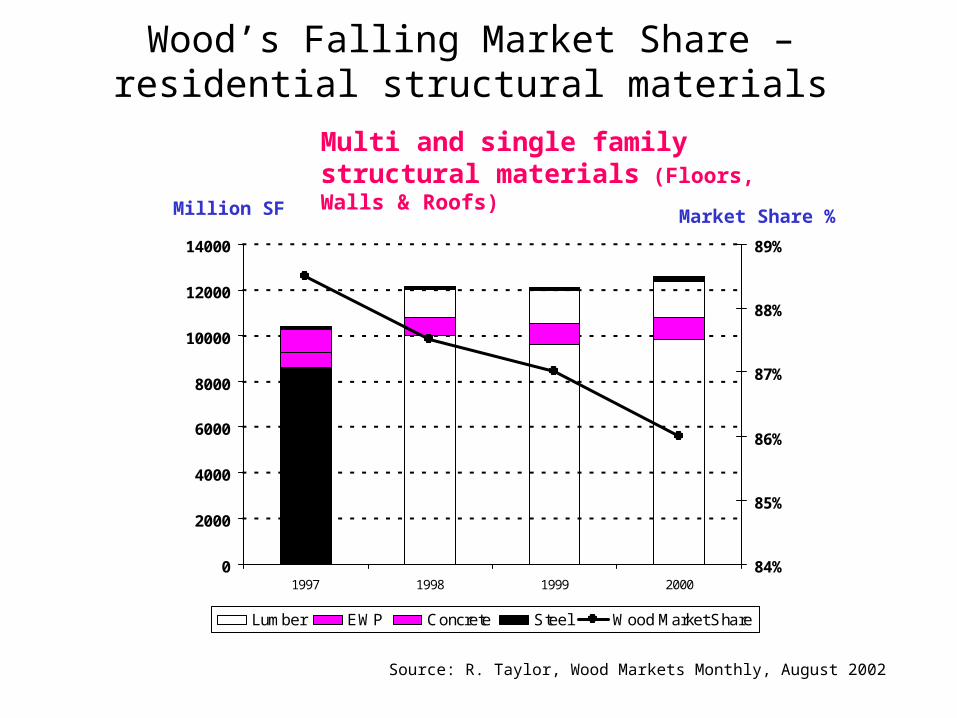
Wood’s Falling Market Share – residential structural materials
0
2000
4000
6000
8000
10000
12000
14000
1997 1998 1999 200084%
85%
86%
87%
88%
89%
Lumber EWP Concrete Steel Wood Market Share
Multi and single familystructural materials (Floors, Walls & Roofs)
Million SF Market Share %
Source: R. Taylor, Wood Markets Monthly, August 2002
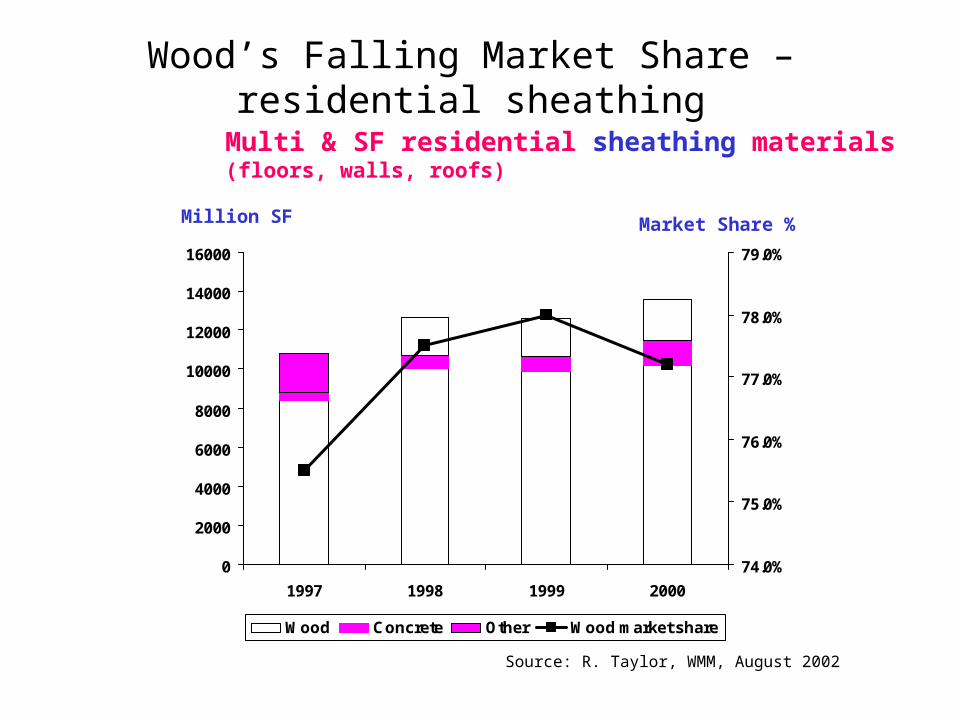
Wood’s Falling Market Share – residential sheathing
0
2000
4000
6000
8000
10000
12000
14000
16000
1997 1998 1999 2000
74.0%
75.0%
76.0%
77.0%
78.0%
79.0%
Wood Concrete Other Wood market share
Source: R. Taylor, WMM, August 2002
Million SF Market Share %
Multi & SF residential sheathing materials(floors, walls, roofs)

Wood’s Falling Market Share – Residential Floors
0
1000
2000
3000
4000
1997 1998 1999 200063%
65%
67%
69%
Lumber Joists EWP concrete Steel Wood Mkt share
Multi & SF residential structural materials(all floors)Million SF
% Market share
Source: R. Taylor, WMM, August 2002

Engineered Wood Products- more on the story -

North American Engineered Wood Products (EWP)
Now over 5% of Lumber supply
0
1000
2000
3000
4000
5000
1992
1993
1994
1995
1996
1997
1998
1999
2000
2001
2002
2003
2004
2005
2006
0
1000
2000
3000
4000
5000
Total LVL I-Joists Glulams
Source: APA, Report E68
Million BF Eqvt. (LVL: CF=16BF; I-Joists: LF=1.68 BF)
LVL+Glulam+I-Joists = 4.3%

EWP’s Plants in North America have Doubled in past Decade
3043
8
2116
43
0
20
40
60
80
100
120
1989 2001
Glulam LVL I-Joist
Source: APA

I-Joists are a North American Phenomenon Currently
0
100
200
300
North America Europe
Million Linear Meters Production, 1999 Basis
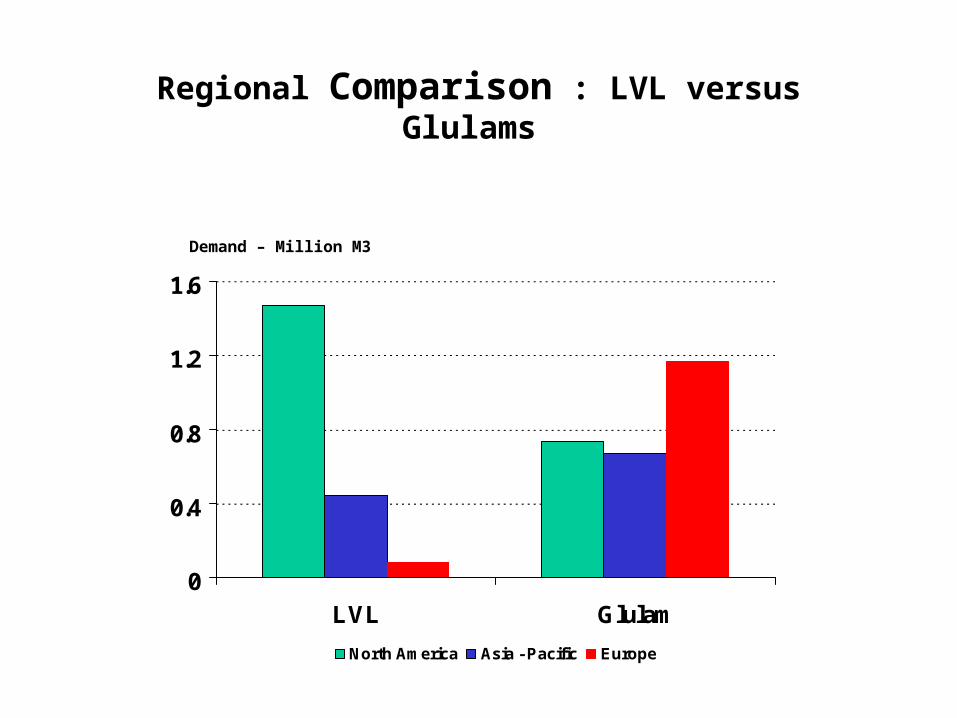
Regional Comparison : LVL versus Glulams
0
0.4
0.8
1.2
1.6
LVL Glulam
North America Asia - Pacific Europe
Demand – Million M3

Global Top Structural LVL Producers
Company Capacity 2001
Million CF
% Global Capacity
Planned Capacity 2002 Million CF
% Global Capacity
North American 73.5 86 81.9 69
Asian 6.5 8 29 24
European 5.8 7 8.6 7
Total 85.8 100 119.5 100
38% capacity increase planned for 2002
Source: Russ Taylor, 2002 Edition Wood Markets

Global OSB Capacity Large capacity increases in Europe as OSB follows the “North American model” (displace plywood),and “construction particleboard” applications European capacity increased by 1.28 BSF(3/8”) or 57%in 2001
Significance: Limits plywood and OSB export opportunities from North America to Europe
0
10
20
30
40
50
1994 95 96 97 98 99
2000 1 2 3 4 5
2006
US & Canada Other
BSF (3/8”)
Source: Taylor, Wood Markets Outlook 2002
Mostly Europe
Summary
Forest Sustainability won’t happen without new markets for forest products
90% of world’s forests are not utilized
Wood products seeing increasing competition – substitution!
Construction markets in transition
What’s needed? – Technology, Marketing, Research & Development to create new markets to better utilize world’s forests and compete with non wood building materials
Wood Products industry is getting the message that they need to compete