instructions for use - 北海道大学...instructions for use title modification of the electronic...
TRANSCRIPT

Instructions for use
Title Modification of the Electronic Properties of the TCNQ Anion Radical Salts by Cation Design and Carrier Doping
Author(s) 窪田, 啓之
Citation 北海道大学. 博士(理学) 甲第11915号
Issue Date 2015-03-25
DOI 10.14943/doctoral.k11915
Doc URL http://hdl.handle.net/2115/63041
Type theses (doctoral)
File Information Hiroyuki_Kubota.pdf
Hokkaido University Collection of Scholarly and Academic Papers : HUSCAP

Modification of the Electronic Properties of the TCNQ Anion Radical Salts by Cation Design and Carrier Doping
Thesis Submitted to the Graduate School of Chemical Sciences and Engineering
Hokkaido University
In Fulfillment of the Requirement for the Degree of Doctor of Science
Hiroyuki Kubota
March, 2015

Acknowledgement
I would like to express my gratitude to all the people who kindly support my study and my life as a doctoral course student of the Solid-State Chemistry Laboratory, Graduate School of Chemical Sciences and Engineering, Hokkaido University.
First of all, I wish to extend my sincere appreciation for Professor Tamotsu Inabe for accepting me, even though I once stopped my study. Without his supervision, I could not have finished my work. I am very glad that I was able to study under such a great, broad-minded professor.
Secondly, I would like to express my deep gratitude to Associate Professor Jun Harada, for giving much time for the X-ray crystal structural analysis, revising CIF file, and doing theoretical calculation.
I also appreciate Dr. Yukihiro Takahashi, for relieving me from many troubles, encouraging me when I felt down, giving me many important advices about the measurements, presentation, and the attitude to the study.
To Dr. Hiroyuki Hasegawa, thank you for giving your time for discussing my study, semiconductor meeting, and good leisure with other laboratory members. All of them are my precious experience.
I appreciate Professor Kazuki Sada, for giving important advices as sub-adviser and as
chief-examiner of my thesis. I remember your kind and considerate regard for individual students.
To Professor Takanori Suzuki, I would like to express my gratitude for your kind advice about the synthesis and about the development of my study, and for the important pointing out in the preliminary examination. I owe the improvement of my thesis to your encouragement.
To Professor Toshihiro Shimada, thank you for your understanding about my study, and for making a new apparatus for the IR measurement in high temperature region. Even though I regret not having successfully summarized the IR data, the unit for controlling the temperature will become useful in future works.
I tender my cordial thanks to Professor Yukio Hinatsu and Associate Professor Makoto
Wakeshima for the support of SQUID measurement. I would like to express a special thanks to Mr. Tetsuzo Habu, for processing glassware, to
Mr. Kazuhiko Matsudaira, Mr. Shingo Mukai, Mr. Yusuke Kawamura, for manufacturing and processing metal apparatus, and to Dr. Etsuo Kuramoto and his family members, for giving me a new PC and many kinds of convenient software for my study.

To my former and current mates, Dr. Derrick Ethelbhert Yu, Dr. Hiromi Minemawari, Dr. Manabu Ishikawa, Shingo Sasaki, Rena Obara, Ai Kukino, Hideyuki Sugawara, Masachika Nagare, Satoshi Yamashita, Yukari Yamada, Shigeki Sakamoto, Ryuta Ikeda, Akihiro Kakizaki, Sho Miyauchi, Tetsuro Miyahira, Kumpei Yamada, Kotaro Tajima, Ryora Ando, Yusuke Miki, Dr. Yukari Takahashi, Yukihisa Sakurada, Takahisa Sasaki, Yasuhiro Tanaka, Momoko Noda, Tatsuya Nakatsugawa, Marie Fukusaku. Saori Matsuo, Naoko Watanabe, Takahiro Takano, Kei hayakawa, Shinya Takao, Taku Ando, Masaaki Yokoyama, Dr. Jose Judy Fe Fernandez, Yu Kudo, Yuki Nakagawa, Sumire Kobayashi, Shunsuke Ashidate, Tsuyoshi Osaki, Yusuke Takita, Yuki Nakajima, Katsuya Takayama, and Ms. Shoko Demachi, Kazuki Ito, Shota Sato, Takafumi Shimojo, Tomohiro Mikasa, Masaki Otani, Hirotaka Kitahara, Masashi Kurokawa, Sarasa Matsuno, Atsuki Kimura, Hideaki Oyamaguchi, Keisuke Kobayashi, Takuro Shimada, Mika Takehisa, Azusa Oka, Tomomi Nakata, Rin Noutsuka, Naho Yoneyama, and Ms Yoshie Kosuge, I was very glad to share the laboratory life with you. I hope I can see you again the other day, in my next life stage.
To Dr. Giancarlo Soriano Lorena, thank you for talking to me in English every day. Owing to you, I was able to improve my English skill, and I believe I was able to exploit it in the international conference and writing my thesis.
To Seiya Yokokura, thank you for giving your time to help me when I was in trouble. Especially, in the initial term of my doctoral course, almost all the skill for physical measurements was lost. Your kind explanation about the instruments has lead to the recovery of my knowledge.
To my previous colleagues, Gaku Hijii, Jun Suzuki, Yousuke Watanabe, Yousuke
Kawakami, Taketo Ito, Hiroki Nakamata, thank you for your visiting Sapporo, and encouraging me. I owe what I am to you.
Finally, to my wife and our parents, thank you for permitting me to come back to Hokkaido
University, and for supporting my study life.
Hiroyuki Kubota

Contents -------------------------------------------------------------------------------------------------------------------
PAGE Chapter 1. General Introduction 1 1.1.Organic electronics 1
1.2. The guidelines for designing conducting organic crystals 1
1.3. Background of the study 9
1.4. The motivation and the aim of the study, and the advantages of anion radical salts
11
1.5. Outline of this study 21 Chapter 2.A series of TCNQ salts with size tunable dications 27 2.1. Introduction 27
2.2. Experimental 32
2.2.1. Synthesis and crystal growth of (CnBPy)(TCNQ)x salts 32
2.2.2. Crystal structure analyses 37
2.2.3. Electrical conductivity measurements 40
2.2.4. Magnetic susceptibility measurements 40
2.2.5. Calculation of the overlap integrals 41
2.3. Results and discussion 41
2.3.1. Crystal structures 41
2.3.2. Electrical properties 53
2.3.3. Magnetic properties 59
2.4. Summary and conclusion 73 Chapter 3. Carrier doping for anion radical TCNQ salts
By the contact method 80 3.1. Introduction 80
3.1.1. The background of the contact method 80 3.1.2. The original characteristics of K-TCNQ 89 3.2. Experimental 92

3.2.1. Crystal growth of K-TCNQ 92 3.2.2. The contact doping using F4TCNQ powder 92
3.2.3. Time dependence of the electrical conductivity 93 3.2.4. Optical measurements 93 3.2.5. The surface images of the interface 93 3.2.6. Electrical conductivity measurement at high temperature region 94 3.2.7. Current-Voltage characteristics measurement
at low temperature region 95
3.3. Results and discussion 95
3.3.1. Phenomena observed by the contact doping 95
3.3.2. The charge transport mechanism by the contact doping 99
3.3.3. Effects on the phase transition by the contact doping 102
3.3.4. Effects on the current-voltage characteristics by the contact doping 106
3.4. Summary and conclusion 108
Chapter 4. Overall summary and concluding remarks 111

1
Chapter 1. General Introduction 1.1. Organic electronics
Conventionally, it has been considered that electrical conductivity and magnetism
are inherent physical properties in metals, and that all the organic compounds are
insulators which do not possess such properties. In 1950’s, however, a highly
conductive charge transfer complex, composed of aromatic compound perylene and
bromine, was discovered by H. Akamatsu, H. Inokuchi, and Y. Matsunaga [1]. Owing
to this discovery, the established concept that regards organic materials are insulating
was exploded and the possibility of attaining metallic physical properties for even
organic materials was proposed. Since then, organic conductors and organic magnets
have been successively developed. As the investigation progressed, it proved that the
electronic functions of organic crystals can be modified from insulating to
superconductive, metallic or semiconducting, and that the spin function can be modified
from diamagnetic to paramagnetic, ferromagnetic, or antiferromagnetic [2-5].
Organic electronics is a discipline of designing, synthesizing, and applying the
organic compounds which own the charge transport electronic functions. Organic
compounds possess many advantages which are not observed for inorganic compounds;
flexibility, solubility in solvents, and feasibility of purification, and tuning of the
orientation of the component anisotropic molecules. If organic molecules can take the
place of inorganic electronics, low cost, light weight, and large area devices or products
will be feasible [6].
1.2. The guidelines for designing conducting organic crystals
To obtain a conductive organic crystal, it is necessary to understand why general

2
organic compounds are insulators. The reason will be explained by using the energy
band diagram. In the case of metal, the conduction band is partially occupied (Cu, for
example) or overlapped with the valence band (Zn and Pb, for example), as described in
Figure 1.2.1 [7]. Thus there is no band gap at the Fermi level. The electrons in partially
occupied conduction band or higher levels of the overlapped conduction band can easily
be promoted to the higher empty levels, therefore the current easily flows in metals. On
the other hand, there are two following principal reasons why organic crystals have
insulating behaviors.
(i) Since there is a rather large energy difference between the highest occupied
molecular orbital (HOMO) and the lowest unoccupied molecular orbital (LUMO) in
general organic compounds, the valence band composed of HOMOs and the conduction
band composed of LUMOs do not overlap at all. In addition, most of organic
compounds have closed-shell electronic structure. Thus the valence bands are filled with
electrons and there is no electron in the conduction bands, as described in Figure 1.2.2.
(ii) The intermolecular overlaps of the molecular orbitals are extremely small, i.e. the
width of the band which consists of these orbitals is narrow. This is because the
HOMOs of organic molecules are completely localized within the molecular framework.
(This is also the reason why the valence bands and the conduction bands do not
overlap.)

3
Figure 1.2.1. The energy band diagram of metals. The left one describes a partially occupied conduction band, and the right one describes a conduction band overlapped with the valence band.
Figure 1.2.2. The energy band diagram of organic crystal.
These two features must be changed to obtain a conductive organic crystal. Initially,
electrons in HOMO are required to move into LUMO in a certain way. To attain this for
single-component organic crystal, designing an open-shell electronic structure, i.e. a
neutral radical is considered to be effective. However, radical electrons tend to form
valence band
conduction band

4
s-bonds between adjacent two neutral radical molecules. If some bulky substituents are
introduced to prevent the extinction of the radicals, the degree of freedom of the radical
electrons will decrease, leading to a non-conducting state. To stabilize the neutral
radicals without bulky substituents, the neutral radicals with hetero atoms-included ring
structure and with both electron-donating substituent and electron-accepting substituent
were designed [8]. Even if these attempts go successfully, the repulsion energy will be
generated between an already-existed radical electron in a certain orbital and a
new-coming radical electron in the crystal. This energy is called on-site Coulomb
repulsion energy (U) [9], described in Figure 1.2.3. Since this repulsion is generally
larger than the transfer energy of electron for most of the general organic compounds.
As a result, metallic crystals have not been obtained by this method.
Figure 1.2.3. The model of the on-site Coulomb repulsion in an array of neutral radicals. The blue filled circles describe the electrons, and each horizontal line means the singly occupied molecular orbital (SOMO) of the single neutral radical. (a) The state before the electron transfer, and (b) the state after the electron transfer. The on-site Coulomb repulsion (U) operates between the two electrons occupied in the same molecular orbital, which requires extra energy for electron transfer.
(a)
(b)

As discussed above, it is quite difficult to attain
single-component organic crystals
effective for the design of conductors
interaction, and was initially
performed by the electron movement fr
former component is called (electron) donor, and the latter is called (electron) acceptor,
and the complex which consists of a donor component and an acceptor component
called a charge transfer (CT)
donor (or acceptor) molecules will be
of electron transportation between the same kind of molecules
(or acceptor) molecules are assembled in an array)
(Schemes1.1-3).
Scheme 1.1. Electron transportation between closed
5
As discussed above, it is quite difficult to attain a metallic
component organic crystals. Thus, two-component crystal design will be
the design of conductors. This method focuses on the charge transfer
initially proposed by R. S. Mulliken [10]. The charge transfer is
performed by the electron movement from one component to the other component. The
former component is called (electron) donor, and the latter is called (electron) acceptor,
and the complex which consists of a donor component and an acceptor component
(CT) complex. As a result of the CT complex formation, the
molecules will be (fractionally) charged or neutral. Possible patterns
between the same kind of molecules (for the case where donor
(or acceptor) molecules are assembled in an array) are described as following scheme
Electron transportation between closed-shell molecules
metallic state in
component crystal design will be more
This method focuses on the charge transfer
The charge transfer is
om one component to the other component. The
former component is called (electron) donor, and the latter is called (electron) acceptor,
and the complex which consists of a donor component and an acceptor component is
As a result of the CT complex formation, the
Possible patterns
(for the case where donor
are described as following schemes

Scheme 1.2. Electron transportation between radicals
Scheme 1.3. Electron transportation between closed
In the case of Scheme 1
from the HOMO of one molecule to energetically higher LUMO of another molecule. In
this case, transport of electrons costs large energy.
In the case of Scheme 1.2
transported from one HOMO (
Thus the orbital should be called singly occupied molecular orbital (SOMO)) to another
HOMO (SOMO). In this case, it becomes much
it is transportation between the same energy levels.
6
Electron transportation between radicals
Electron transportation between closed-shell molecule and radical
Scheme 1.1 (when the component is neutral), an electron must move
from the HOMO of one molecule to energetically higher LUMO of another molecule. In
transport of electrons costs large energy.
the case of Scheme 1.2 (when the component is fully charged)
from one HOMO (strictly speaking, there is only one electron in the orbital.
should be called singly occupied molecular orbital (SOMO)) to another
In this case, it becomes much easier to transport an electron
nsportation between the same energy levels. However, the Coulomb repulsion
shell molecule and radical
, an electron must move
from the HOMO of one molecule to energetically higher LUMO of another molecule. In
(when the component is fully charged), an electron is
there is only one electron in the orbital.
should be called singly occupied molecular orbital (SOMO)) to another
an electron because
However, the Coulomb repulsion

7
will be generated as described in Figure 1.2.3.
In the case of Scheme 1.3 (when the component is fractionally charged), the energy
states after the transportation is exactly the same as before, and no extra cost of on-site
Coulomb repulsion occurs. Thus the conductivity is expected to be the highest in this
case. Most of the obtained conductive organic crystals are the type of (3) and possessing
a fractional charge for each molecule [11].
Unlike neutral radicals, ion radicals of p-conjugated molecules can construct p-p
networks, and then allow the system to be stabilized easily. In planar p-electron
conjugated molecules, face-to-face stack is feasible, forming the conduction path.
Tetrathiafulvalene (TTF) and 7,7,8,8-tetracyanoquinodimethane (TCNQ) are a
representative planar donor and acceptor, respectively.
Figure 1.2.4. The structure of TTF. (a) The neutral charge state of TTF, (b) the TTF cation radical, (c) the dicationic state of TTF.
TTF does not have the stability derived from the aromaticity in the neutral state
(Figure 1.2.4 (a)). When the one-electron oxidation occurs, the electron system turns the
combination of 6p and 7p, which can keep the aromatic stability with replacing each
other (Figure 1.2.4 (b)). Even when two-electron oxidation occurs, the stability can be
maintained because of the 6p-6p electron system (Figure 1.2.4 (c)). In this way, TTF
has two different stably oxidized states.
(a) (b) (c)

8
Figure 1.2.5. The structure of TCNQ; (a) the neutral state of TCNQ, (b) the TCNQ anion radical..
On the other hand, TCNQ has the quinoid ring centered on the molecule which
turns benzenoid by one-electron reduction. Thus, TCNQ anion radical is also stable.
Four cyano groups in the TCNQ molecule attract the negative charge, which contributes
to the stabilization of the anionic state of TCNQ.
Figure 1.2.6. The crystal structure of TTF-TCNQ.
TTF-TCNQ, a CT complex consists of these donor and acceptor, is well known as
the first metallic organic crystal [12]. The crystal structure is shown in Figure 1.2.4. In
this crystal, TTF and TCNQ individually form face-to-face stacked columns. Since the
degree of charge transfer is 0.59, in both columns radicals and neutral molecules
co-exist. In this manner, both of the points (i) and (ii) were overcome. Thus, by
adopting charge transfer complexes as the objects, the guideline for designing the
(a) (b)

conductive organic crystals has been
1.3. Background of the study
As stated in 1.2, “fractional charge in each molecule
requirement for constructing conductive organic crystals, can be attained by using
charge transfer complexes. In addition, planar component m
face-to-face manner, resulting
all the charge transfer complexes
a metallic behavior. This is because donor components and acceptor components can
form mixed-stack structures. For mixed
adjacent molecules (HOMO of a donor and LUMO of an acceptor) contribute to the CT
interaction, leading to a completely
Figure 1.3.1. (a) The model of the mixeddifferent kinds of molecules (donors or acceptors). (b) mixed-stack structure. The left side is before the after the complex formation
(a)
(b)
9
conductive organic crystals has been greatly progressed.
. Background of the study
fractional charge in each molecule”, which is
for constructing conductive organic crystals, can be attained by using
charge transfer complexes. In addition, planar component molecules can stack in a
resulting in a large overlap of the molecular orbitals.
ge transfer complexes which consist of fractionally-charged molecules have
This is because donor components and acceptor components can
stack structures. For mixed-stack structures, different energy levels
molecules (HOMO of a donor and LUMO of an acceptor) contribute to the CT
completely filled energy band as described in Figure 1.3.1
The model of the mixed-stack structure. Different different kinds of molecules (donors or acceptors). (b) The energy
he left side is before the complex formation, the right side is complex formation.
, which is an important
for constructing conductive organic crystals, can be attained by using
olecules can stack in a
in a large overlap of the molecular orbitals. However, not
charged molecules have
This is because donor components and acceptor components can
stack structures, different energy levels of the
molecules (HOMO of a donor and LUMO of an acceptor) contribute to the CT
as described in Figure 1.3.1.
colors describe
energy state of the , the right side is

On the other hand, providing donor
columns separately, the energy levels of the adjacent molecules or radicals will be equal
to each other, forming incompletely occupied
Therefore, “forming segregated columns
crystals to become a conductor
Figure 1.3.2. (a) The model of the segregateddifferent kinds of molecules (donors or acceptors). (b) describes the energy state of the segregated-stack structure with the degree of charge transfer being 1/2before the complex formation
For the CT complexes, the stacking pattern
depend on various parameters; e. g., relative strength of the donor and acceptor,
(a)
(b)
10
providing donor components or acceptor components form
columns separately, the energy levels of the adjacent molecules or radicals will be equal
to each other, forming incompletely occupied bands, as described in Figure 1.3.2.
forming segregated columns” is another important condition for organic
become a conductor.
(a) The model of the segregated-stack structure. Differentdifferent kinds of molecules (donors or acceptors). (b) describes the energy state of the
with the degree of charge transfer being 1/2.complex formation, the right side is after the complex formation
For the CT complexes, the stacking patterns and the amount of the formal charge
various parameters; e. g., relative strength of the donor and acceptor,
components or acceptor components form
columns separately, the energy levels of the adjacent molecules or radicals will be equal
bands, as described in Figure 1.3.2.
other important condition for organic
Different colors describe different kinds of molecules (donors or acceptors). (b) describes the energy state of the
. The left side is omplex formation.
s and the amount of the formal charge
various parameters; e. g., relative strength of the donor and acceptor,

11
molecular shape, relative size, and the stoichiometry of the two components.
1.4. The motivation and the aim of the study, and the advantage of anion radical
salts
Considering above, in this study, what is emphasized on is not making new
conductive organic crystals, but what condition can affect the formal charge, and how
the stacking state and then the physical properties can be tuned under the given
stoichiometry. This type of study is significant for the fundamental study of the design
of the electronic function. For such investigation, the number of parameters which
influence the degree of charge transfer should be reduced, and the crystal structure must
be systematically modified, maintaining fractionally charged states. Radical ion salts are
considered to be desirable for the requirements above [13, 14].
In a broad sense, radical ion salts can be regarded as a kind of charge transfer
complex, and the fundamental properties are almost the same. The only difference is
that one of the two components is a closed-shell ion. This difference is quite important
in this study. Providing that the stoichiometry is other than 1:1, the fractionally charged
state can certainly be obtained. In addition, in general, the closed-shell ionic component
cannot interact with the counter donor or acceptor component by the overlap of the
orbitals. Namely, there is only a little possibility to form a mixed-stack structure.
Nevertheless, there exist radical salts with mixed-stack structure. These can be
classified into the following types. (In the following discussion, the term “mixed-stack
structure” will be used in a broad sense. In other word, it will describe the
non-segregated stack. Providing that the donor component and the acceptor component
(either one of which is a closed-shell ion) are indicated by D and A respectively, not
only DADA type but also DAAD and DAA are included in mixed-stack structure.)

12
(1) The size of the closed-shell ionic component is much larger than that of the
radical component, thus the crystal packing is dominated by the former component. In
particular, if the closed-shell ionic component has bulky substituents or is a polymer,
the stack of the radical component is often separated, leading to mixed-stack structure
[15-18], as shown in Figures 1.3.3 and 1.3.4.
Figure 1.3.3. Packing diagram for [Au(CH2PPh3)2](TCNQ) [15]. The cation component has bis(triphenylphosphine) structure, and is much larger than TCNQ, leading to the mixed-stack (DADA) structure.

13
Figure 1.3.4. The structural model of the TCNQ salt of a cation polymer {[M(dmb) 2]+}n, M = Ag and dmb = 1,8-diisocyano-p-menthane [17]. The cation component is 1-D chain polymer. The crystal structure seems to be dominated by the arrangement of the cation polymer. As a result, TCNQ anion cannot form segregated columns, but dimerized instead. Each TCNQ dimer is completely independent of others.
(2) p-p interaction between the closed-shell ionic component and the radical
component is possible. If both of the two components have aromatic rings, they can
interact each other by having their ring part face-to-face (with the aid of electrostatic
interactions) in some cases. Especially, both components are planar, mixed-stack
structure such as DADA can occur [19-23], as shown in Figures 1.3.5 and 1.3.6.

14
Figure1.3.5. The structural model of the 4,5,4’,5’-Dibenzo-3,3’-diethyloxacyanine- TCNQ [19]. The cation component is p-conjugated and planar. Thus it can interact with another cation on one side and can also interact with TCNQ anion on the other side, leading to the formation of TCNQ anion dimer and DDAA type stack.

15
Figure 1.3.6. The structural model of TMBTP-TCNQ (TMBTP = 2,2',6,6'-tetramethyl-Δ4,4'-bithiopyran) [20]. The cation component is highly planar, and the positive charge is considered to be delocalized. The mixed-stack structure may be the result of the stability derived from the electrostatic interaction.
(3) There exists hydrogen-bond network(s). Since hydrogen bond is much stronger
than p-p interaction, it is more dominant for crystal packing [24], as shown in Figure
1.3.7.

16
Figure 1.3.7. The structural model of S-Methylthiouronium-TCNQ [24]. The N atom in the TCNQ anion is connected with the H atom in the NH2 group included in the cation component. Probably this hydrogen bond network is prior to the p-p interaction between the TCNQ anions, resulting in the independently located TCNQ anion dimer.
These examples are rather exceptional, and the main possible interaction is
generally between donors or between acceptors, which are the counterpart of the
closed-shell ionic component. Therefore, if we properly select the closed-shell ionic
component, the segregated stack structure can be obtained automatically. Under an ideal
condition, the stoichiometry of the crystal can only be influenced by the relative size of
the closed-shell ionic component compared with the donor or acceptor.
The relationship between the size of the closed-shell ionic component and the
stoichiometry was focused on in several studies. One is BEDO-TTF cation radical salts
with tetracyanoallyl derivatives as the counter anions as shown in Figure 1.3.8 [26].

17
BEDO-TTF has a strong tendency to form 2-D p-p network systems. In this study, the
variation of the effect of the interaction between BEDO-TTF and the anion component
for the dimensionality was investigated by changing the anion size. The stoichiometry
of the crystals varied 9:4, 2:1, 5:2, depending on the anion size. However, the crystal
structures were analyzed only one of the four compounds, and the correlation between
the anion size and the crystal structure and the stoichiometry has not been disclosed.
Figure 1.3.8. The structure of BEDO-TTF (BO) and different size of tetracyanoallyl derivative anions.
Another is BTDA-TCNQ anion radical salts with various sizes of alkylammonium
cations (Figure 1.3.9 (a)) [27]. For BTDA-TCNQ, the S atom in the heteroring can
interact with the N atoms in adjacent BTDA-TCNQ, leading to the 2-D network
formation as shown in Figure 1.3.9 (b). The stoichiometry showed some tendency to
varying from 1:1 to 2:5 depending on the size of the alkylammonium cation, but only
the part of the crystal structures were analyzed. This may be because the cation size

18
varies in three-dimensional, and in some cases it made very difficult to crystallize
owing to the spatial requirement.
Figure 1.3.9. (a) The structure of BTDA-TCNQ and the ammonium cations. (b) The structural model of the BTDA-TCNQ salt with ethyltrimethylammonium cation [27]. The stoichiometry (cation : BTDA-TCNQ) is 1:1. Each S atom in the thiadiazole ring interacts with two N atoms of the adjacent BTDA anion, resulting in the formation of 2-D network (described as “ribbon-network” in the article).
In the above studies, radical salts with systematically varying the size of
closed-shell ionic components were successfully prepared. The reason why the radical
components form fractionally charged salts with closed-shell ionic components with
various size may result from that they have ability to form two-dimensionally extended
(a)
(b)

19
networks. This property provides a capacity for accommodating various size
closed-shell ionic components. Nevertheless, the structure analyses were possible only
for a part of the radical salts. For the systematic size change of the closed-shell ionic
component of the radical salts composed of donors or acceptors without ability to form
two-dimensional networks, it is considered to be better to design the closed-shell ionic
component with varying the length only along the one-dimensional direction. With such
closed-shell ionic component design, the systematical investigation of the correlation
between the crystal structure and the physical properties is expected to become possible.
For the counter donor or acceptor components, TTF or TCNQ is a good candidate
for the study of the effects of relative size of closed-shell ionic components on the
structure, stoichiometry, and properties of their radical salts, since they are excellent
components that give partially charged radical salts. Many charge transfer complexes
and cation radical salts using TTF analogues, especially ET (=BEDT,
bis-ethylenedithiotetrathiafulvalene) are known [28-32]. Similarly, charge transfer
complexes or anion radical salts of TCNQ are known [33, 34]. Considering the easiness
of the design of the closed-shell ionic component, a series of TCNQ anion radical salts
with the counter cation of which size is systematically modified are subjected to this
study. The crystal structure and the relationship between the cation size and the crystal
structure, the stoichiometry, and the physical properties are discussed in Chapter 2.
Even though the segregated stack structure and the fractional charge can
successfully be achieved, the charge transport behavior of the crystal becomes often
semiconducting instead of metallic. The main reason of this is as follows.
(1) There exists some lattice distortion in the segregated column, inducing the

20
multimerization such as dimerization or trimerization.
(2) The strong electron correlation operates, because the band width of the
conduction band is narrow. In a broad sense, the case of g = 1 is also involved in the
category.
In such a semiconductor, there exists no carrier because of well-defined band gap
in (1) and Coulomb repulsion energy in (2). Thus, they are an intrinsic semiconductor
(only the charge transportation induced from the thermal activation is possible). The
carrier transporting ability of the semiconductor can be improved if holes or electrons
are doped. This feature is quite important because it can be applied for the fabrication of
organic field effect transistors [35, 36].
For organic field effect transistors, the carriers (holes or electrons) are generally
injected through the electrodes. In such cases, however, the injection barrier is
generated between the electrodes and the semiconductors. In other words, the resistance
is generated at the carrier injection. This resistance is 105-108 times larger than that of
the carrier doping for inorganic semiconductors [37]. As a result, quite high applying
voltage is required for driving, leading to the noise and the instability of the conduction.
On the other hand, in recent years, a metallic interface derived from the charge
transfer by contacting TTF and TCNQ single crystals was reported by the research
group of A. F. Morpurgo [38]. This method (contact doping) makes it possible to
achieve an effective carrier doping in the semiconductor interface, and can be expected
to overcome the problem generated at the carrier injection. However, the necessary
conditions for the carrier doping of this method has not yet been fully disclosed. Thus,

21
more broad application of the contact doping is required. There are many
semiconductors and insulators in the TCNQ anion radical salts due to the reasons (1)
and (2), thus they are considered to be good objects for the study of contact doping.
On the basis of the viewpoints above, the carrier doping for the TCNQ anion
radical salts is set as the second subject, and is described in Chapter 3.
1.5. Outline of this study
Chapter 1 gives the general introduction related to this study. Section 1.1 is
devoted to the historical background and the significance of organic electronics. Section
1.2 describes the guidelines for designing conducting organic crystals by introducing
ion radicals and then charge transfer complexes. Section 1.3 is about the background of
the study. In Section 1.4 the motivation and the aim of this study and the advantage of
the TCNQ anion radical salts for the investigation are described. Section 1.5 gives a
general outline of this study.
Chapter 2 is focused on a series of the TCNQ anion radical salts with size-tunable
dications. Section 2.1 is devoted to a general background of crystal design for obtaining
organic conductors and the structural features of the dications. Section 2.2 is the
experimental section, which includes synthesis and crystal growth of
(C1BPy)(TCNQ)4CH3CN,(C2BPy)(TCNQ)3, a-(C3BPy)(TCNQ)4, b-(C3BPy)(TCNQ)4,
(C3BPy)(TCNQ)4, (C5BPy)(TCNQ)4, (C6BPy)(TCNQ)4, (C6BPy)(TCNQ)3 (the
structure of CnBPy is described in Figure 1.5), and crystal structure analyses of the
eight crystals, electrical conductivity measurements, magnetic susceptibility
measurements, and calculations of the overlap integrals. Section 2.3 talks about the

22
results and discussion. Section 2.4 summarizes Chapter 2.
N+
N+
(CH2)n
Figure 1.5. The structure of the dication, CnBPy.
In Chapter 3, carrier doping to the anion radical salt of K-TCNQ by the contact
method is discussed. Section 3.1 is devoted to the background of the contact method
and the original characteristics of K-TCNQ. Section 3.2 is the experimental sections
which includes synthesis, crystal growth of as-grown K-TCNQ, electrical conductivity
measurements, IR spectra measurements, the surface observation by SEM and AFM,
current-voltage characteristics measurements. Section 3.3 describes the results and
discussion, and Section 3.4 is the summary.
Chapter 4 describes the overall conclusion of the study as well as the future
prospect.

23
References
[1] Akamatsu, H.; Inokuchi, H.; Matsunaga, Y. Nature, 1954, 173, 168-169.
[2] Wickman, H. H.; Trozzolo, A. M.; Williams, H. J.; Hull, G. W.; Merritt, F. R. Phys.
Rev, 1967, 155, 563-566.
[3] Bray, J. W.; Hart, Jr, H. R.; Interrante, L. V.; Jacobs, I. S.; Kasper, J. S.; Watkins, G.
D.; Wee, S. H., Bonner, J. C. Phys. Rev. Lett, 1975, 35, 744-747.
[4] Jerome, D.; Mazaud, A.; Ribault, M.; Bechgaard, K. J. Physique Lett, 1980, 41,
95-98.
[5] Clark, W. G.; Hammann, J.; Sanny, J.; Tippie, L.C. Lecture Notes in Physics, 1979,
96, 255-264.
[6] Tang, C.W.; VanSlyke, S.A. Appl. Phys. Lett., 1987, 51, 913-915.
[7] Sze, S.M. Semiconductor Devices, Physics and Technology, 2nd ed., John Wiley &
Sons, Inc., New York, 2002; 33-34.
[8] Cordes, A. W.; Haddon, R. C.; Hicks, R. G.; Oakley, R. T.; Palstra, T. T. M.;
Schneemeyer, L. F.; Waszczak, J. V. J. Am. Chem. Soc, 1992, 114, 5000-5004.
[9] Itoh, K.; Itoh, H.; Naka, M.; Saito, S.; Hosako, I.; Yoneyama, N.; Ishihara, S.;
Sasaki, T.; Iwai, S. Phys. Rev. Lett, 2013, 110, 106401 (1-5).
[10] Mulliken, R. S. J. Am. Chem. Soc. 1952, 74, 811-824.
[11] Metzger, R. M.; Day, P. R.; Papavassiliou, G. C. Lower-Dimentional Systems and
Molecular Electronics, Springer Science & Business Media, 1990,10-14.
[12] Ferraris, J.; Cowan, D. O.; Walatka, V, Jr.; Peristein, J. H. J. Am. Chem. Soc. 1973,
95, 948-949.
[13] Inayoshi, T.; Komatsu, H.; Ono, I.; Matsumoto, S. Synthetic Metals, 2002, 128,
333-342.

24
[14] Bryan, C. D.; Cordes, A. W.; Haddon,R. C.; Hicks,R. G.; Kennepohl, D. K.;
MacKinnon, C. D.; Oakley, R. T.; Palstra, T. T. M.;Perel, A. S.; Scott, S. R.;
Schneemeyer, L. F.; Waszczaklb, J. V. J. Am. Chem. Soc. 1994, 116, 1205-1210.
[15] Cerrada, E.; Gimeno, M. C.; Laguna, A.; Laguna, M.; Orera, V.; Jones, P. G. J.
Organomet. Chem, 1996, 506, 203-210.
[16] Munoz, M. C.; Cano, J.; Ruiz, R.; Lloret, F.; Faus, J. Acta Crystallogr, 1995, C51,
873-876.
[17] Fortin, D.; Drouin, M.; Harvey, P. D.J. Am. Chem. Soc. 1998, 120, 5351-5352.
[18] Baird, P.; Bandy, J. A.; Green, M. L. H.; Hammett, A.; Marseglia, E.; Obertelli,
S.D.; Prout, K.; Qin, J. J. Chem. Soc. Dalton. Trans, 1991, 2377-2393.
[19] Grossel, M. C.; Evans, F. A.; Hriljac, J. A.; Prout, K.; Weston, S. C. Chemical
Communications, 1990, 1494-1495.
[20] Darocha, B. F.; Titus, D. D.; Sandman, D. J. Acta Crystallogr, 1979, B35,
2445-2448.
[21] Büchner, R .; Field, J. S.; Haines, R. J. J. Chem. Soc. Dalton Trans, 1997,
2403-2408.
[22] Ward, M. D.; Fagan, P. J.; Calabrese, J. C.; Johnson, D. C.; J. Am. Chem. Soc,
1989, 111, 1719-1732.
[23] Miller, J. S.; Zhang, J. H.; Reiff, W. M.; Dixon, D. A.; Preston, L. D.; Reis, Jr, A.
H.; Gebert, E.; Extine, M.; Troup, J.; Epstein, A. J.; Ward, M. D. J. Phys. Chem, 1987,
91, 4344-4360.
[24] Murphy, V. J.; O’Hare, D. Inorg. Chem, 1994, 33, 1833-1841.

25
[25] Abashev, G. G.; Vlasova, R. M.; Kartenko, N. F.; Kuzmin, A. M.;
Rozhdestvenskaya, I. V.; Senkin, V. N.; Usov, O. A.; Russkikh, V. S. Acta Crystallogr,
1987, C43, 1108-1112.
[26] Sekizaki, S.; Konsha, A.; Yamochi, H.; Saito, G. Mol. Cryst. Liq. Cryst, 2002, 376,
207-212.
[27] Suzuki, T.; Kabuto, C.; Yamashita, Y.; Mukai, T.; Miyashi, T.; Saito, G. Bull.
Chem. Soc. Jpn, 1988, 61, 483-493.
[28] Saito, G.; Enoki, T.; Toriumi, K.; Inokuchi, H, Solid State Commun, 1982, 42,
557-560.
[29] Yagubskii, E. B.; Shchegolev, I. F.; Laukhin, V. N.; Kononovich, P. A.; Kartsovnik, M.
V.; Zvarykina, A. V.; Buravov, L. I. JETP Lett,1984, 39, 12-16.
[30] Kobayashi, A.; Kato, R.; Kobayashi, H.; Moriyama, S.; Nishio, Y.; Kajita, K.;
Sasaki, W. Chem. Lett, 1986, 15, 2017-2020.
[31] Kobayashi, A.; Kato, R.; Kobayashi, H.; Moriyama, S.; Nishio, Y.; Kajita, K.;
Sasaki, W. Chem. Lett, 1987, 16, 459-462.
[32] Urayama, H.; Yamochi, H.; Saito, G.; Nozawa, K.; Sugano, T.; Kinoshita, M.; Sato,
S.; Oshima, K.; Kawamoto, A.; Tanaka, J. Chem. Lett, 1988, 17, 55-58.
[33] Bechgaard, K.; Kistenmacher, T. J.; Bloch, A. N.; Cowan, D. O.
ActaCrystallogr,1977, B33, 417-422.
[34] Zuppiroli, L.; Ardonceau, J.; Weger, M.; Bechgaard, K.; Weyl. C. J. Physique Lett,
1978, 39, 170-173.
[35] Horowitz, G. Adv. Mater, 1998, 10, 365-377.
[36] Koezuka, H.; Tsumura, A.; Ando, T. Synthetic Metals, 1987, 18, 699-704.

26
[37] Shibata, K.; Wada, H.; Ishikawa, K.; Takezoe, H.; Mori, T. Appl. Phys. Lett, 2007,
90, 193509 (1-4).
[38] Alves, H.; Molinari, A. S.; Xie. H.; Morpurgo. A. F. Nature Mater, 2008, 7,
574-580.

27
Chapter 2.A series of TCNQ salts with size tunable dications
2.1. Introduction
The guidelines for designing conducting organic crystals have been considerably
established. Structurally, molecules of the same type form p-p interaction networks in
the crystal, and electronically every molecule that forms a p-p network carries a
uniform fractional charge [1].To attain this electronic structure, not mixed stack
structures but segregated stack structures are required for the two-component system.
There are two candidates for the segregated stack structure; charge transfer complexes
and charge transfer salts (anion or cation radical salts). As mentioned in Chapter 1,
TTF-TCNQ is one of the most famous charge transfer complexes, in which both TTF
and TCNQ form segregated stacks with the amount of charge transfer 0.59, making its
physical property a metallic one. For charge transfer complexes, however, the mixed
stack structure would be possible. Compared with charge transfer complexes that
consist of donors and acceptors, anion or cation radical salts with closed-shell counter
ions are advantageous for constructing conducting organic crystals since there is much
less possibility to form mixed-stack structures when proper design of the counter ions is
performed as discussed in Chapter 1 [2]. Another important requirement to achieve
fractional charges is tuning the stoichiometry. However, controlling the stoichiometry is
still difficult at the present stage, though some information about the variation of the
stoichiometry can be obtained from several previous studies [3, 4].
The p radical anion or cation assemblies gain stabilization energy when the
open-shell p orbitals overlap effectively, resulting in self assembled p-p networks [5,
6].For the self-assemblies, planar molecules are favorable. This is because planar

28
molecules can easily attain parallel stack structures, leading to large overlaps of the
p-orbitals (i. e. large transfer integrals). TCNQ is one of the most favorable acceptor
molecules to gain a good organic conductor, since TCNQ has not only a planar structure
but also relatively high symmetry (the symmetrical shape also will contribute to the
good conducting behavior because it can provide a well-ordered molecular stack). The
magnitude of the overlap of the p-orbitals depends on the intermolecular distances or
the shift of molecules from the regular stack. These parameters are strongly affected by
the size and the conformation of the counter ions for the TCNQ-type anion radical salts.
In particular, the relative size of the counter ion plays an important role in achieving the
appropriate fractional charge [7]. In addition, the size of the counter ions regulates the
assembling morphology of the p-radical molecules, resulting in a critical effect on the
electronic states. To study how the size of the counter ions influences the stoichiometry
and the structure of the radical salts, systematic modification of the size of the counter
ions and investigations on both the crystal structures and physical properties of the salts
obtained is expected to be an effective method. In addition, considering that the
modification is applied to along one direction, the counter ions must be designed to
attain one-directional size modification (If the size variation of the closed-shell ions
were two-dimensional or three-dimensional, the arrangement of the radical component
could be greatly changed, and it could be difficult to perform a systematic study). In this
study, the TCNQ anion radical component is selected, and the size of the counter
organic close-shelled cations is systematically tuned. There are organic closed-shell
cations derived from heterocyclic aromatic compounds including N atoms, such as
pyridinium, quinolinium, acridinium. Additionally, cations with a linear substituent
bonded with N atoms, such as alkyl chain, can easily be synthesized by SN2 reaction.

29
When pyridinium derivatives with alkyl chains were utilized as closed-shell ions, any
mixed-stack type TCNQ anion radical salts have not been obtained as mentioned in
Chapter 1. Therefore such organic closed-shell cations are especially favorable for the
size-tuning study. For this study, 1,1'-(1,n-alkyl)bis-pyridinium (abbreviated by CnBPy)
was chosen as the target cations, as described in Scheme 2.1(a). The size of the cations
can be systematically tuned by changing the number of carbons in the intervening alkyl
chain. The following three points are important in crystal design:
i) Interdigitation of the alkyl chains rarely occurs. Tuning the size of an ion by the
carbon number of alkyl chains is also possible for the N-alkyl-pyridinium monocation
[8]. However, in this case the terminal chains of two of the cations can interact with
each other, leading to a decrease in the effective size (Scheme 2.1(b)).
ii) It is difficult for two adjacent pyridinium rings to overlap with each other. Since
pyridinium rings carry positive charges, having two pyridinium rings close together is
energetically unfavorable because of the Coulomb repulsions (Scheme 2.1(c)).
iii) Both ends of the dication were unified in pyridinium rings. If the terminal
groups were different, especially in the case of a NH+ terminal group, the packing of the
components was significantly altered by the hydrogen bonding. Thus, this was not
suitable for studying the correlation between the dication size and the crystal structures
or the electronic states. With regard to this point, the series of dications in this study
may minimize such extrinsic effects.

30
Scheme 2.1. (a) The structure of the target dication(s). (b) The possible model of an interdigitation by using the N-alkyl-pyridinium monocation. (c) The model of coulomb repulsion caused by having the two pyridinium rings close together.
Many TCNQ anion radical salts with various counter organic cations have been
reported [9-15]. In the 1970s and 1980s Ashwell investigated similar (dication)(TCNQ)x
series using dipyridinium salts, as indicated in Scheme 2.2 [16–25]. The most
remarkable salt among those studied is (DEPE)(TCNQ)4 (DEPE =
1,2-di(N-ethyl-4-pyridinium) ethylene). The conductivity of (DEPE)(TCNQ)4 is 150 –
2200 S cm−1 at room temperature and it shows metallic behavior down to 30 mK [14].
Unfortunately, its crystal structure was not disclosed. All of the other salts had
semiconducting behavior and their TCNQ columns were subjected to multimeric
distortion, corresponding to their stoichiometries. However, the influence of the dication
size on the systematical change of the crystal structure or the electronic states was not
mentioned. Some dications in our study (n = 3 and 4) were also investigated by Ashwell
from a structural point of view [26, 27], but they were not systematically compared with
other series of dications.

31
Scheme 2.2 Dications used in the Ashwell’s studies.
In 1971 Hadek, et al. investigated the TCNQ salts of ionene
{[-N+(CH3)2-(CH2)x-N+(CH3)2-(CH2)y-]n} polymers [28], in which the size of the
polymeric dications could be systematically altered by changing the number of CH2
groups between positively charged nitrogens. However, the crystal structure of each salt
was not disclosed, thus the correlation between the structure of the polymeric dications
and the physical properties of the TCNQ salts has not been elucidated.
The systematic change in the crystal structures and physical properties of the
TCNQ salts are studied where the alkyl chain lengths (n) in CnBPy are varied from 1 to
6. The size of the cations of the optimized structure in the isolated state is indicated in
Scheme 2.3.The length is calculated as the distance between the edges of the van der
Waals radii of the two hydrogen atoms located farthest in the dication. The length of the
cation changes from 11.184 Å to 18.344 Å. Although the alkyl chain length is a simple
parameter, there exist some polymorphs or different stoichiometries, in spite of the
molecule having the same n value, making the total system complicated. Nevertheless,
the size of the dication ranged from being smaller than to larger than that of the TCNQ

32
molecule. Especially, I succeeded to determine the crystal structures for a full series of
the TCNQ anion radical salts in this study. This is a significant feature for this series of
salts and may make it possible to examine the continuously varying crystal structures
and spin structures by tuning the dication size.
Scheme 2.3. The size of the cations of the optimized structure based on the Gaussian Revision C. 01 MP2/6-31G calculation in the isolated state.
2.2. Experimental
2.2.1. Synthesis and crystal growth of (CnBPy)(TCNQ)x salts
1,1'-(1,n-alkyl)bis-pyridiniumdiiodide [(CnBPy)I2] salts were prepared for the
synthesis of TCNQ anion radical salts for n = 1, 2, 3, 4, 5, 6. For each diiodide salts, the

33
synthesis was a simple SN2 reaction, and pyridine plays not only the reactant but also
the solvent. Then the product was mixed with TCNQ in a solvent to obtain TCNQ anion
radical salts by the reduction reaction by I-. The details are described as follows.
(C1BPy)(TCNQ)4CH3CN
1 mL (3.32 g, 12.4mmol) of diiodomethane (Tokyo Kasei Kogyo Co. Ltd.) and 10
mL (9.8 g, 0.124 mol) of pyridine (Wako chemical Co. Ltd.) were mixed in the 50 mL
egg-plant shaped flask, and then refluxed at 80˚C for 3 days. The chemicals were used
without further purification. Yellow powder 1,1'-(1,1-methyl) bis-pyridiniumdiiodide
[(C1BPy)I2] was obtained in a yield of 4.68 g, and the response rate was 88.7%. Then
19.9 mg (0.0467 mmol) of (C1BPy)I2 and 45.5 mg (0.223 mmol) of TCNQ(Wako
chemical Co. Ltd.) were dissolved in 15 mL and 25 mL of hot acetonitrile respectively,
and then the solutions were mixed. (C1BPy)I2 was used without further purification, and
TCNQ was used after the purification by recrystallization. Black, block single crystals
of (C1BPy)(TCNQ)4CH3CN were obtained by allowing the solution to stand for 3 days.
(C2BPy)(TCNQ)3
1.06g (3.76 mmol) of 1,2-diiodoethane (Wako chemical Co. Ltd.) and 5 mL (4.9 g,
0.062 mol) of pyridine (Wako chemical Co. Ltd.) and 45 mL of acetonitrile (Wako
chemical Co. Ltd.) were mixed in the 100 mL egg-plant shaped flask, and then refluxed
at 80˚C for 4 days. The chemicals were used without further purification. In this case,
E2 reaction preferentially occurs without acetonitrile. Therefore, acetonitrile was added
as the solvent to promote the SN2 reaction and get a higher yield. After the reflux, the
product was washed by ethanol and acetone to remove the impurities. Orange powder
1,1'-(1,2-ethyl)bis-pyridiniumdiiodide [(C2BPy)I2] was obtained in a yield of 46.4 mg,
and the response rate was 1.05 %. Then 11.2 mg (0.0254 mmol) of (C2BPy)I2 and 25.0

34
mg (0.122 mmol) of TCNQ (Wako chemical Co. Ltd.) were dissolved in 25 mL, 15 ml
of hot acetonitrile respectively, and then the solutions were mixed. (C2BPy)I2 was used
without further purification, and TCNQ was used after the purification by
recrystallization. Black, platelet single crystals of (C2BPy)(TCNQ)3 were obtained by
allowing the solution to stand for 3 days.
a-(C3BPy)(TCNQ)4
1 mL (2.52 g, 8.52 mmol) of 1,3-diiodopropane (Wako chemical Co. Ltd.) and 10
mL (9.8 g, 0.124 mol) of pyridine (Wako chemical Co. Ltd.) were mixed in the 50 mL
egg-plant shaped flask, and then refluxed at 85˚C for 6days. The chemicals were used
without further purification. Pale yellow powder 1,1'-(1,3-propyl)bis-
pyridiniumdiiodide[(C3BPy)I2] was obtained in a yield of 2.88 g, and the response rate
was 88.1%. Then 20.2 mg (0.0444mmol) of (C3BPy)I2 and 40.5 mg (0.198 mmol) of
TCNQ (Wako chemical Co. Ltd.) were dissolved in 15 mL, 25 mL of hot acetonitrile
respectively, and then the solutions were mixed. (C3BPy)I2 was used without further
purification, and TCNQ was used after the purification by recrystallization. Black, block
single crystals of a-(C3BPy)(TCNQ)4 were obtained by allowing the solution to stand
for 3 days.
b-(C3BPy)(TCNQ)4
25.8 mg (0.0568 mmol) of (C3BPy)I2 and 62.5 mg(0.306 mmol) of TCNQ (Wako
chemical Co. Ltd.) were dissolved in 15 mL, 25 mL of hot acetonitrile respectively, and
then the solutions were mixed. (C3BPy)I2 was used without further purification, and
TCNQ was used after the purification by recrystallization. Black, block single crystals
of b-(C3BPy)(TCNQ)4 were obtained by allowing the solution to stand for 1 day.
(C4BPy)(TCNQ)4

35
1 mL (2.37 g, 7.65mmol) of 1,4-diiodobuthane (Wako chemical Co. Ltd.) and 10
mL (9.8 g, 0.124 mol) of pyridine (Wako chemical Co. Ltd.) were mixed in the 50 mL
egg-plant shaped flask, and then refluxed at 85˚C for 7 days. The chemicals were used
without further purification. Pale yellow powder 1,1'-(1,4-buthyl)bis-pyridiniumdiiodide
[(C4BPy)I2] was obtained in a yield of 3.23 g, and the response rate was 90.2%. Then
28.3 mg (0.0605 mmol) of (C4BPy)I2 and 55.2 mg (0.270 mmol) of TCNQ (Wako
chemical Co. Ltd.) were dissolved in 15 mL of hot acetonitrile respectively, and then
the solutions were mixed. (C4BPy)I2 was used without further purification, and TCNQ
was used after the purification by recrystallization. Black, block single crystals of
(C4BPy)(TCNQ)4 were obtained by allowing the solution to stand for 1 day.
(C5BPy)(TCNQ)4
1 mL (2.20 g, 6.79 mmol) of 1,5-diiodopentane (Alfa Aesar, Shore Road, Lancs.,
imported by Wako Chemical Co. Ltd.) and 10 mL (9.8 g, 0.124 mol) of pyridine (Wako
chemical Co. Ltd.) were mixed in the 50 mL egg-plant shaped flask, and then refluxed
at 85˚C for 5 days. The chemicals were used without further purification. Pale yellow
powder 1,1'-(1,5-pentyl)bis-pyridiniumdiiodide[(C5BPy)I2] was obtained in a yield of
2.88 g, and the response rate was 88.1%. Then 30.0 mg (0.0622 mmol) of (C5BPy)I2
and 64.2 mg (0.314 mmol) of TCNQ (Wako chemical Co. Ltd.) were dissolved in 14
mL and 15 mL of hot acetonitrile respectively, and then the solutions were mixed.
(C5BPy)I2 was used without further purification, and TCNQ was used after the
purification by recrystallization. Black, block single crystals of (C5BPy)(TCNQ)4 were
obtained by allowing the solution to stand for 3 days.
(C6BPy)(TCNQ)4
1 mL (2.05 g, 6.06 mmol) of 1,6-diiodohexane (Lancaster, Eastgate, White Lund,

36
Morecambe, England.) and 10 mL (9.8 g, 0.124 mol) of pyridine (Wako chemical Co.
Ltd.) were mixed in the 50 mL egg-plant shaped flask, and then refluxed at 85˚C for 6
days. The chemicals were used without further purification. Pale yellow powder
1,1'-(1,6-hexyl)bis-pyridiniumdiiodide[(C6BPy)I2] was obtained in a yield of 2.83 g,
and the response rate was 94.0%. Then 20.0 mg (0.0402 mmol) of (C6BPy)I2 and 40.5
mg (0.198 mmol) of TCNQ (Wako chemical Co. Ltd.) were dissolved in 7 mL and 18
mL of hot acetonitrile respectively, and then the solutions were mixed. (C6BPy)I2 was
used without further purification, and TCNQ was used after the purification by
recrystallization. Black, block single crystals of (C6BPy)(TCNQ)4 were obtained by
allowing the solution to stand for 2 days.
(C6BPy)(TCNQ)3
25.2 mg (0.0507 mmol) of (C6BPy)I2 and 40.5 mg (0.198 mmol) of TCNQ (Wako
chemical Co. Ltd.) were dissolved in 20 mL of hot acetonitrile respectively, and then
the solutions were mixed. (C6BPy)I2 was used without further purification, and TCNQ
was used after the purification by recrystallization. Black, block single crystals of
(C6BPy)(TCNQ)3 were obtained by allowing the solution to stand for 2 days.
Two polymorphs were obtained for C3BPy. One of them, a-(C3BPy)(TCNQ)4, was
the same as that previously reported [26]. These two polymorphs could selectively be
grown by slightly changing the conditions (concentration and cooling rate) and they
could be distinguished from the appearance. (C4BPy)(TCNQ)4 was also the same as a
previously reported crystal [27]. For C6BPy, two different stoichiometries were
obtained under the same conditions, and they also could be distinguished from the
appearance. The majority of these two stoichiometries could be controlled by the
cooling rate. After careful examination of the presence of other polymorphs, a trace

37
amount of polymorphic byproducts were found to form for n = 2 and n = 5. However,
the byproducts were produced very rarely, and the bulk samples for the magnetic
measurements were confirmed not to contain any byproducts.
2.2.2. Crystal structure analyses
The X-ray diffraction intensity data for single crystals of the TCNQ salts were
obtained using an automated Rigaku R-Axis rapid X-ray diffractometer with graphite
monochromated MoKα radiation. The crystal structures were solved by employing the
direct methods of SIR2004 [29] and SHELX-97 [30] in the CrystalStructure4.0 [31]
crystallographic software package. The crystal data for the salts are summarized in
Table 1. Refinement of the structures was carried out using a full-matrix least squares
refinement on F2. All of the non-hydrogen atoms were refined anisotropically. The
hydrogen atoms were placed at the theoretically calculated ideal positions, related to
their respective parent atoms, with a riding model for the structure refinement.
Table2.1. Crystallographic data for the TCNQ salts
(C1BPy)-
(TCNQ)4CH3CN
(C2BPy)-
(TCNQ)3
a-(C3BPy)-
(TCNQ)4a
b-(C3BPy)-
(TCNQ)4
Formula C61H31N19 C48H26N14 C61H32N18 C61H32N18
Formula Weight 1030.04 798.83 1017.04 1017.04
Crystal System triclinic triclinic monoclinic triclinic
Space Group P P P21 P1
a /Å 13.1547(9) 8.0675(9) 7.7599(4) 7.792(3)
1 1

38
b /Å 13.6652(9) 8.0934(9) 25.3409(12) 12.715(4)
c /Å 15.5920(10) 15.5631(18) 13.0885(6) 13.100(4)
a / degree 105.4713(19) 83.1512(14) 86.007(14)
b / degree 100.898(2) 76.1582(14) 92.7802(13) 87.137(12)
g / degree 103.6797(18) 76.0042(14) 82.964(18)
V / Å3 2527.7(3) 955.34(19) 2570.7(2) 1283.9(7)
Z 2 1 2 1
Dcalc / g cm−3 1.353 1.389 1.314 1.315
m(Mo Ka) / cm-1 0.87 0.88 0.84 0.84
Temperature / K 293 153 296 273
No. of Unique Reflections
11285 4395 11570 9209
Rint 0.0405 0.0468 0.0303 0.0343
R1 [I> 2.0s(I)] 0.0534 0.0433 0.0365 0.0568
Rw (all reflections) 0.1783 0.1239 0.1053 0.1696
Goodness of fit indicator
1.095 1.030 0.951 1.022
aThe crystal is the same as that reported in ref. 26.
Table2.1(continued). Crystallographic data for the TCNQ salts
(C4BPy)-
(TCNQ)4b
(C5BPy)-
(TCNQ)4
(C6BPy)-
(TCNQ)4
(C6BPy)-
(TCNQ)3
Formula C62H34N18 C63H36N18 C64H38N18 C52H34N14
Formula Weight 1031.07 1045.10 1059.12 854.93

39
Crystal System triclinic triclinic triclinic triclinic
Space Group P P P P
a /Å 7.7633 (17) 7.7658(17) 7.6612(2) 7.8494(17)
b /Å 13.078(4) 13.274(4) 13.068(4) 9.803(3)
c /Å 13.081(4) 25.224(5) 14.039(4) 14.557(4)
a / degree 76.175(13) 93.634(13) 76.243(11) 76.285(10)
b / degree 88.07(2) 95.231(10) 76.680(16) 82.750(7)
g / degree 87.743(13) 90.757(10) 80.966(12) 81.523(11)
V / Å3 1288.2(7) 2583.6(11) 1320.6(6) 1071.5(5)
Z 1 2 1 1
Dcalc / g cm−3 1.329 1.343 1.332 1.325
m(Mo Ka) / cm-1 0.84 0.85 0.84 0.83
Temperature / K 123 153 153 153
No. of Unique Reflections
5707 11590 5921 4874
Rint 0.0311 0.0579 0.037 0.0363
R1 [I> 2.0s(I)] 0.0480 0.0707 0.0499 0.0445
Rw (all reflections) 0.1226 0.2250 0.1475 0.1314
Goodness of fit indicator
1.017 1.066 1.050 1.034
bThe crystal is the same as that reported in ref. 27.
2.2.3. Electrical conductivity measurements
The electrical resistivity was measured along the TCNQ stacking direction in a
1 1 1 1

40
single crystalline sample using a four-probe method. Gold paste (Tokuriki Chemical
Research Co. Ltd.) was used to connect two gold wires (ɸ = 20 μm) at opposite ends of
a plate crystal such that the cross section of the crystal was covered with paste. The
temperature dependence was measured using a closed cycle cryostat system in the
temperature range of 100–300 K.
2.2.4. Magnetic susceptibility measurements
Magnetic susceptibility measurements were performed on a Quantum Design
MPMS superconducting quantum interference device (SQUID) susceptometerwith a
static field of 1 T in the temperature range of 2–300 K for the randomly oriented
polycrystalline sample. For each crystal, the sample was set in the straw. The edge of
the straw was closed by cotton to prevent the sample from scattering outside. The
diamagnetic core contribution was estimated based on Pascal's constants described in
the Table 2.2 [32]. In some cases, the paramagnetic contribution was quantified by the
ESR signal intensity. The molar susceptibility was defined as susceptibility for the
(CnBPy)(TCNQ)4 or(CnBPy)(TCNQ)3 unit.

41
Table 2.2.Pascal’s diamagnetic susceptibilities (10-6 emu/mol)
2.2.5. Calculation of the overlap integrals
Orbital overlap integrals between two adjacent TCNQ molecules on each crystal in
the extended Hückel approximation [33, 34] were calculated using the CAESAR
program package [35].
2.3. Results and discussion
2.3.1. Crystal structures
As a result of the crystal structure analyses, there were two different stoichiometries
(dication : TCNQ), 1:3 and 1:4. Crystals with 1:3 stoichiometry were obtained only for
n = 2 and 6, while crystals with 1:4 stoichiometry were obtained n = 1, 3, 4, 5, 6. Of the
five 1:4 crystals, solvent molecules were involved only for n = 1. To obtain detailed
information about the size effect of the dications for the stoichiometry and crystal
packing, crystal structures of the 1:4 salts (for n = 3, 4, 5, 6) will be initially discussed.
Then, the n = 1 salt will be compared with the other 1:4 salts from the structural point of
view. Finally, crystal structure of 1:3 salts (for n = 2, 6) will be focused on, and then the
reason why they take this stoichiometry will be considered.
H -2.93
C -6.00
N (aromatic) -4.61
N (aliphatic) -5.57

42
Crystal structures of the 1:4 salts
The crystal structures for n = 3, 4, 5 and 6 are shown in Figure 2.3.1.
Figure 2.3.1. Perspective view of the unit cell for (a) a-(C3BPy)(TCNQ)4 (the structure is the same as that reported in ref. [26]), (b) b-(C3BPy)(TCNQ)4, (c) (C4BPy)(TCNQ)4 (the structure is the same as that reported in ref. [27]), (d) (C5BPy)(TCNQ)4, and (e) (C6BPy)(TCNQ)4.
For n = 3, two polymorphs were obtained. One of them (a-form) was identical to
that previously reported [26]. Interestingly, neither of the two polymorphs had a center
(a) (b) (c)
(d) (e)

43
of symmetry. This is because n was an odd number and packing occurs when there is no
center of symmetry between two adjacent dications. For the a-form, the two adjacent
dications were related by the 21 axis (Figure 2.3.1(a)), while the dications were related
by a simple translation in the b-form (Figure2.3.1(b)). This difference in the dication
arrangements led to a difference in TCNQ column formation, as shown in Figures
2.3.1(a) and 2.3.1(b). On the other hand, the overlap integrals (Table 2.3), which
indicates the overlap of the lowest unoccupied molecular orbitals between two adjacent
TCNQ molecules and is a measure of the intermolecular interactions, did not differ from
each other with both showing strong dimerization. In addition, the formal charge of
TCNQ, which was calculated from the TCNQ geometry [36] (Table 2.4.) did not display
any charge disproportionation and every TCNQ molecule had a charge of approximately
−1/2 for both polymorphs. For n = 4 (Figure 2.3.1(c)), only crystal obtained was the
same as one that has been previously reported [27]. For the dications with a center of
symmetry, it was located on the inversion center in the crystal, and TCNQ formed a 1-D
column with dimerized distortion. For n = 5 (Figure 2.3.1(d)), the dications had no
center of symmetry, but two adjacent dications were related to each other by the center
of symmetry in the crystals. A center of symmetry also existed in the TCNQ column.
Two types of tetramers were formed because of the periodicity of the overlap integral
(see Table 2.3). The formal charge in TCNQ was partly localized; in the CDD’C’
tetramer D and D’ were almost −1, and C and C’ were neutral, while in the BAA’B’
tetramer A and B had a charge of approximately −1/2 (Table 2.3). This charge
disproportionation was quite different from the other dication-TCNQ salts, resulting in
peculiar magnetic properties (vide infra).

44
Table 2.3. Formal charge of the TCNQ molecules and the overlap integral between the
lowest unoccupied molecular orbitals of the neighboring TCNQ molecules
Compound Overlap integral Formal charge (g)
(C1BPy)(TCNQ)4 AB 0.0172 A 0.40
BC 0.0121 B 0.76
CD 0.0176 C 0.29
DA 0.0148 D 0.58
(C2BPy)(TCNQ)3 AB 0.0215 A 0.58
BA’ 0.0215 B 0.58
A’A 0.0044
a-(C3BPy)(TCNQ)4 AB 0.0200 A 0.58
BC 0.0039 B 0.54
CD 0.0193 C 0.46
DA 0.0067 D 0.58
b-(C3BPy)(TCNQ)4 AB 0.0213 A 0.58
BC 0.0042 B 0.54
CD 0.0199 C 0.51
DA 0.0053 D 0.58
(C4BPy)(TCNQ)4 AB 0.0208 A 0.42
BB’ 0.0038 B 0.51
B’A’ 0.0208
A’A 0.0041

45
(C5BPy)(TCNQ)4 AA’ 0.0191 A 0.67
AB 0.0220 B 0.46
BC 0.0019 C 0.21
CD 0.0193 D 0.96
DD’ 0.0176
(C6BPy)(TCNQ)4 AB 0.0008 A 0.54
BB’ 0.0212 B 0.54
B’A’ 0.0008
A’A 0.0204
(C6BPy)(TCNQ)3 AB 0.0229 A 0.88
BA’ 0.0229 B 0.58
A’A 0.0038

46
Table 2.4. Geometry of TCNQ and derived formal charges (g) aa ba ca da db g
(C1BPy)(TCNQ)4
A 1.349(4) 1.435(4) 1.389(4) 1.426(5) 0.485 0.40 B 1.358(5) 1.427(4) 1.405(4) 1.416(5) 0.494 0.76 C 1.346(4) 1.439(4) 1.385(4) 1.429(5) 0.483 0.29 D 1.357(4) 1.430(4) 1.399(4) 1.425(5) 0.490 0.58
(C2BPy)(TCNQ)3 A 1.359(2) 1.432(3) 1.400(2) 1.425(3) 0.490 0.58 B 1.356(2) 1.430(5) 1.398(2) 1.422(5) 0.490 0.58
a-(C3BPy)(TCNQ)4
A 1.353(3) 1.432(3) 1.401(3) 1.425(3) 0.490 0.58 B 1.352(3) 1.435(3) 1.398(3) 1.424(3) 0.489 0.54 C 1.354(3) 1.435(3) 1.393(3) 1.427(3) 0.487 0.46 D 1.351(3) 1.432(3) 1.399(3) 1.423(3) 0.490 0.58
b-(C3BPy)(TCNQ)4
A 1.351(4) 1.435(4) 1.403(4) 1.430(7) 0.490 0.58 B 1.354(4) 1.437(7) 1.400(4) 1.428(7) 0.489 0.54 C 1.358(4) 1.434(17) 1.398(4) 1.429(22) 0.488 0.51 D 1.350(7) 1.433(6) 1.400(4) 1.427(7) 0.490 0.58
(C4BPy)(TCNQ)4 A 1.352(2) 1.440(5) 1.394(3) 1.431(7) 0.486 0.42 B 1.351(2) 1.437(8) 1.400(2) 1.432(4) 0.488 0.51
(C5BPy)(TCNQ)4
A 1.362(8) 1.426(6) 1.404(4) 1.425(20) 0.492 0.67 B 1.349(12) 1.434(10) 1.393(5) 1.425(18) 0.487 0.46 C 1.351(4) 1.439(16) 1.381(4) 1.435(26) 0.481 0.21 D 1.359(6) 1.425(4) 1.418(6) 1.419(9) 0.499 0.96
(C6BPy)(TCNQ)4 A 1.353(2) 1.432(5) 1.398(2) 1.429(5) 0.489 0.54 B 1.355(2) 1.433(7) 1.400(2) 1.428(8) 0.489 0.54
(C6BPy)(TCNQ)3 A 1.358(2) 1.423(2) 1.411(2) 1.416(2) 0.497 0.88 B 1.350(2) 1.427(6) 1.394(2) 1.420(6) 0.490 0.58
aAveraged bond lengths under D2h symmetry. Values in parentheses are maximum standard deviation or maximum difference from the averaged value. bd = c / (b + d).
ab
c d

47
For n = 6 (Figure 2.3.1(e)), the dication maintained its center of symmetry in the
crystal. However, the alkyl chain did not take on the trans configuration and was
strongly distorted. TCNQ formed 1-D columns with a dimeric distortion and the center
of symmetry was located at the midpoint of the TCNQ dimer. As a result, the
interactions between two adjacent dimers were uniform. The charge of the TCNQ
molecule was almost uniform, but the molecular planes between two adjacent dimers
greatly slide and the planes were not parallel, leading to a small overlap integral
between the dimers. This slide of the dimers was induced by the strongly distorted alkyl
chain of the dication.
The five crystals mentioned above had similar TCNQ column structures, even
though the size of their dications varied. The crystal structures can be summarized with
the concept of the ‘effective dication length’. This corresponds to the distance between
the centers of two adjacent dications. These results are presented in Figure 2.3.2, which
shows that the effective dication length had no correlation with the value of n, falling
within a narrow range from 13.2 to 15.4 Å.
Figure 2.3.2. Effective dication lengths in the 1:4 salts for n = 3, 4, 5, and 6.
The length of the individual dications in the crystal represented following the style
n = 6 n = 5 n = 4 n = 3 (b-form) n = 3 (a-form)

48
adopted for Scheme 2.3 is shown in Scheme 2.4. The length is not so much different
from that in the calculated isolated state except n = 6. The length is somewhat different
from the “effective dication length”, indicating molecular packing is important for the
“effective dication length”.
Scheme 2.4. The size of the cations in the TCNQ anion radical crystals.
Taking the above into consideration, the n = 1 salt will now be discussed. The
crystal structure is shown in Figure 2.3.3(a). Since n was an odd number, the dication
occupied a general position. CH3CN was involved as the crystal solvent and it aligned
alternately with the dication in one dimension. TCNQ formed 1-D columns with a
tetrameric period, where the overlap integrals were fairly uniform. Every TCNQ
molecule had a formal charge of approximately −1/2 (Table 2.3). The effective dication
length is shown in Figure 2.3.3(b) and was in the range that was found for the five
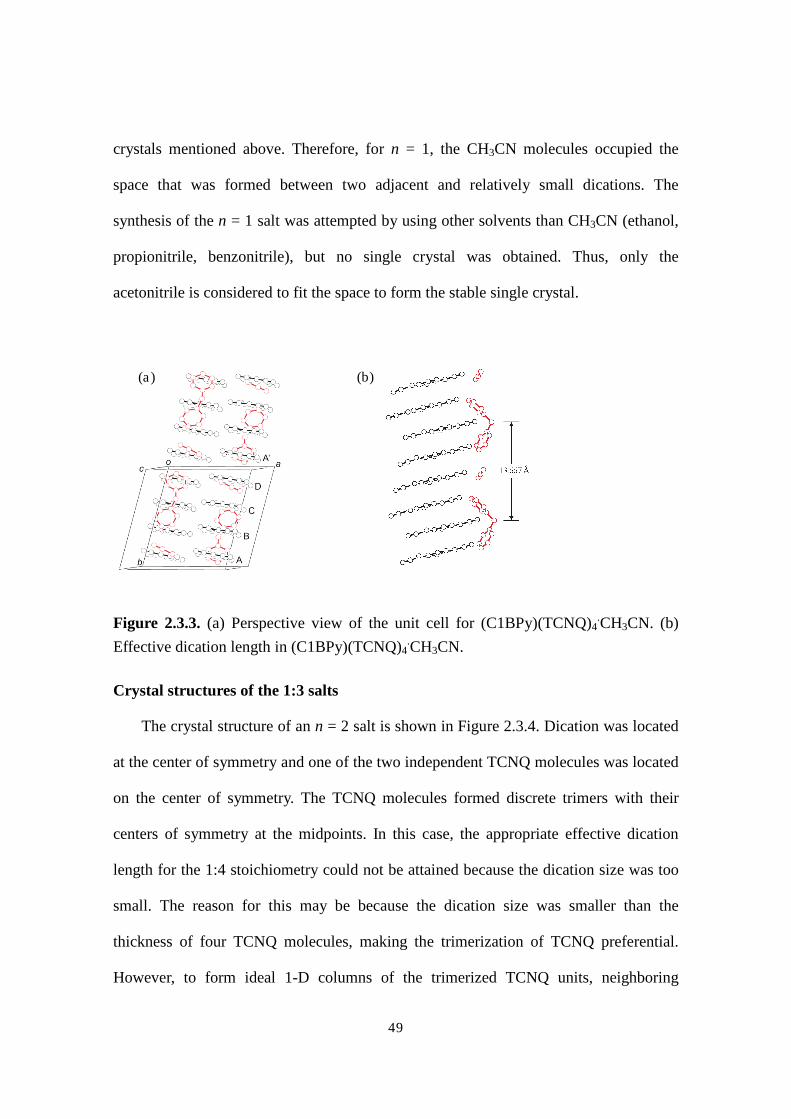
49
crystals mentioned above. Therefore, for n = 1, the CH3CN molecules occupied the
space that was formed between two adjacent and relatively small dications. The
synthesis of the n = 1 salt was attempted by using other solvents than CH3CN (ethanol,
propionitrile, benzonitrile), but no single crystal was obtained. Thus, only the
acetonitrile is considered to fit the space to form the stable single crystal.
Figure 2.3.3. (a) Perspective view of the unit cell for (C1BPy)(TCNQ)4.CH3CN. (b)
Effective dication length in (C1BPy)(TCNQ)4.CH3CN.
Crystal structures of the 1:3 salts
The crystal structure of an n = 2 salt is shown in Figure 2.3.4. Dication was located
at the center of symmetry and one of the two independent TCNQ molecules was located
on the center of symmetry. The TCNQ molecules formed discrete trimers with their
centers of symmetry at the midpoints. In this case, the appropriate effective dication
length for the 1:4 stoichiometry could not be attained because the dication size was too
small. The reason for this may be because the dication size was smaller than the
thickness of four TCNQ molecules, making the trimerization of TCNQ preferential.
However, to form ideal 1-D columns of the trimerized TCNQ units, neighboring
(b) (a)

pyridinium rings must be touching. This is why the TCNQ stack was largely distorted.
Figure 2.3.4. (a) Perspective view of the unit cell for (C2BPy)(TCNQ)
view.
The crystal structure for an
on the center of symmetry and one of the two independent TCNQ molecules was also
located on the center of symmetry. The TCNQ molecules formed discrete trimers with
the center of symmetry at the midpoint. These characteristics were t
the n = 2 salt. The 1:4 salt was also given by the
the dications were quite different from each other (the 1:3 and 1:4 salts). Namely,
all-trans configuration was maintained and the dications w
the 1:3 salt. The reason for this is as follows: if the
direction with a completely trans configuration, the dication length was too long for the
appropriate effective dication length
dication length had to be shortened to form the 1:4 salt, which is energetically
unfavorable. As a compromise, there were two choices; one was to break the all
configuration, decreasing the effective dicati
(a)
50
touching. This is why the TCNQ stack was largely distorted.
(a) Perspective view of the unit cell for (C2BPy)(TCNQ)
The crystal structure for an n = 6 salt is shown in Figure 2.3.5. Dication was located
on the center of symmetry and one of the two independent TCNQ molecules was also
located on the center of symmetry. The TCNQ molecules formed discrete trimers with
the center of symmetry at the midpoint. These characteristics were the same as those for
= 2 salt. The 1:4 salt was also given by the n = 6 dication, but the configurations of
the dications were quite different from each other (the 1:3 and 1:4 salts). Namely,
trans configuration was maintained and the dications were not further shortened in
the 1:3 salt. The reason for this is as follows: if the n = 6 dication aligned along one
direction with a completely trans configuration, the dication length was too long for the
appropriate effective dication length for the 1:4 stoichiometry. Accordingly, the effective
dication length had to be shortened to form the 1:4 salt, which is energetically
unfavorable. As a compromise, there were two choices; one was to break the all
configuration, decreasing the effective dication length to form the 1:4 salt, and the other
(b)
touching. This is why the TCNQ stack was largely distorted.
(a) Perspective view of the unit cell for (C2BPy)(TCNQ)3 and (b) its side
5. Dication was located
on the center of symmetry and one of the two independent TCNQ molecules was also
located on the center of symmetry. The TCNQ molecules formed discrete trimers with
he same as those for
= 6 dication, but the configurations of
the dications were quite different from each other (the 1:3 and 1:4 salts). Namely,
ere not further shortened in
= 6 dication aligned along one
direction with a completely trans configuration, the dication length was too long for the
4 stoichiometry. Accordingly, the effective
dication length had to be shortened to form the 1:4 salt, which is energetically
unfavorable. As a compromise, there were two choices; one was to break the all-trans
on length to form the 1:4 salt, and the other

51
was to shift the dication alignment from a simple 1-D arrangement while keeping an
all-trans configuration accompanied by a large distortion of the TCNQ stack, leading to
the formation of the 1:3 salt. This level of flexibility in the composition resulted from
the configurational flexibility, owing to the long alkyl chain for the n = 6 dication.
Figure 2.3.5. Perspective view of the unit cell for (C6BPy)(TCNQ)3.
The sum of the formal charges in the (CnBPy)(TCNQ)x (x = 3 or 4) unit was found
to be in a range between -1.74 and -2.34 (Table 2.5), which was rather close to the ideal
value of -2. Considering the accuracy of the formal charge determined from the
molecular geometry, the results were rather good. Therefore, it is safe to discuss the
charge uniformity based on these data.

52
Table 2.5. Sum of the formal charges of TCNQ in the (CnBPy)(TCNQ)x (x = 3 or 4) unit.
The sum of the formal charges (C1BPy)(TCNQ)4 2.03 (C2BPy)(TCNQ)3 1.74
a-(C3BPy)(TCNQ)4 2.16 b-(C3BPy)(TCNQ)4 2.21 (C4BPy)(TCNQ)4 1.86 (C5BPy)(TCNQ)4 2.30 (C6BPy)(TCNQ)4 2.16 (C6BPy)(TCNQ)3 2.34
From the information above, the range of the variation of the stoichiometry in the
present system will be discussed. At first the stoichiometry (dication:TCNQ) was
expected to vary widely depending on the dication size. However, the obtained
stoichiometries were only 1:4 and 1:3. In particular, the salts with 1:4 stoichiometry
were obtained for every n value except for n = 2, and their conformations resemble each
other. Thus, the 1:4 stoichiometry is considered to be prior to any other conditions for
the crystal growth. In this stoichiometry, an averaged charge of each TCNQ is -1/2, and
the stabilization by the delocalized electrons is considered to be most effectively
attained. This stabilization will still be effectively attained in case of 1:3 stoichiometry,
in which the averaged charge of each TCNQ is -2/3, close to -1/2. It is considered that
the periodicity of two or three molecules in which one or two electrons are
accommodated is relatively easily attained. If the periodicity becomes larger than four
molecules, the lattice strain may exceed the electron delocalization energy. Therefore, it
was difficult to form salts of (dication)(TCNQ)x with x > 5.
On the other hand, if the relationship between the effective dication lengths and the
state of the TCNQ columns are focused on, the TCNQ molecular plane tilts more

53
significantly in the crystal with a longer effective dication length. Assuming the angle
between the stacking direction and the TCNQ molecular plane to be f, f= 90° for
a-(C3BPy)(TCNQ)4, in which the effective dication length is relatively short (13.222Å).
On the contrary, f = 51.5° for (C4BPy)(TCNQ)4, in which the effective dication length
is the longest of the series (15.340Å). For a longer effective dication length, the tilted
TCNQ molecular plane allows the dication to be the all-trans conformation, resulting in
the formation of the favorable 1:4 stoichiometry. For too much tilted molecular plane,
the overlap of the p-orbital between the adjacent TCNQ molecules cannot be assured,
thus the all-trans conformation was not able to attained for (C6BPy)(TCNQ)4.
Nevertheless, the tilting ability makes it possible for the crystals to have some range of
the effective dication length required for the 1:4 stoichiometry.
2.3.2. Electrical properties
The temperature dependence of the single-crystal resistivity for the CnBPy TCNQ
salts is shown in Figure 2.3.6.

54
Figure 2.3.6.Temperature dependence of the single-crystal resistivity for the CnBPy TCNQ salts.
The n = 1 salt had the lowest resistivity (22 W cm) among all the salts studied. For
all of these crystals, the temperature dependence of the resistivity was thermally
activated. This was considered as follows: Even though the formal charges were nearly
uniform, the overlap integrals were not uniform. Thus, the behavior of the resistivity
reflected the multimeric structural characteristics to some extent. The n = 6 salt (1:4
stoichiometry) had the smallest overlap integral between two adjacent dimers, which
reflected the significant slide between the dimers, leading to the lowest conductivity
among this series of TCNQ salts. For the n = 1 salt, the relatively uniform overlap
integrals in the TCNQ column resulted in the highest conductivity. In this manner, a

55
correlation was observed between the conductivity and the overlap integrals between
the TCNQ molecules, to some extent. The room temperature resistivities and the
activation energies of these salts are summarized in Table 2.6. The activation energy
was nearly 0.2 eV in all the salts. Compared to the variation of the conductivity, the
variation of the activation energy is not so obvious. Therefore, it is very difficult to find
the correlation between the conductivity and the activation energy. Nevertheless, taking
the overlap integrals (Table 2.3) into account, the correlation between them can be
discussed to some extent. From the band structural point of view, the energy of the band
gap is twice the amount of the activation energy, and corresponds to the difference
between transfer energies in the dimer (t) and between the dimers (t’) (Scheme 2.5). The
band bap is dominated by the overlap of the p-orbitals in the TCNQ dimer. For almost
all the salts, the overlap integrals in the multimer are around 0.02. Probably this is the
reason why the resistivity and the activation energy is not so much different among all
the TCNQ salts. Another factor which affects the activation energy is the lattice defects.
The lattice defects may act both the source of carriers and a trap for charge transport. In
addition, the effects of the lattice defects will stronger if the TCNQ stack is closer to an
ideal 1-D column. This can be affected by the degree of the slip between the TCNQ
multimer and the difference of the stoichiometry. Therefore, the activation energy of the
n = 6 salt (1:4 stoichiometry) is not so much high in spite of the high resistivity, while
the activation energy of the n = 6 salt (1:3 stoichiometry) is relatively larger in spite of
the low resistivity. The optical absorption band with the lowest energy in these salts
occurred in the infrared region with a broad peak at 0.4-0.5eV (Figure 2.3.7). This
indicates that they are band insulators with a band gap between the valence and
conduction bands. Considering that the segregated column structures and the fractional

56
charge of the TCNQ molecules were attained principally in all the crystals, these
semiconducting behaviors are considered to be derived from the uneven stack in the
TCNQ columns (dimerized, trimerized or tetramerized) and the strong electron
correlations
Table 2.6. Resistivity at room temperature (RT) and the activation energy for conduction in the CnBPy TCNQ salts.
Resistivity at RT [W cm] Activation energy [eV]
n = 1 22 0.16
n = 2 2.0×10³ 0.20
n = 3(a) 1.1×10³ 0.19
n = 3(b) 3.3×10³ 0.13
n = 4 3.4×10³ 0.16
n = 5 4.9×10³ 0.14
n = 6(1:4) 6.2×10⁴ 0.20
n = 6(1:3) 50 0.25
Scheme 2.5. The band structural model of the 1/4-filled TCNQ column.

57
(a)
(b)
(c)
Figure 2.3.7. Optical spectra of (a) (C4BPy)(TCNQ)4, (b) (C6BPy)(TCNQ)3, and (c) (C6BPy)(TCNQ)4. For each compound, the left-side panel indicates the IR spectrum, and the right-side panel indicates the diffuse reflectance spectrum (nearIR-vis-UV region) converted to the Kubelka-Munk function, f(R), corresponding to the absorption. Optical spectra of other (CnBPy)(TCNQ)x salts are practically the same as those shown above.

58
The conductivity of this series will be evaluated referring to the guideline for
designing the conductive organic crystals. If the condition described in 2.1.1 are applied
for the dication-TCNQ salts, segregated TCNQ columns and fractionally charged
TCNQ molecules are required to obtain good conductivities. The former was attained
for all salts, and the latter was also attained for almost all salts except for n = 5.
Nevertheless, the electric behavior of them was not metallic but semiconducting. This is
because the TCNQ columns take multimeric structures in the crystals. Namely, the
overlap of the LUMO decreases periodically, and then the electronic transportation is
hampered. This means that the band widths were not successfully spread. This
multimerization are obvious except for n = 1. It is because the packing of the dications
are prior to TCNQ stack. This effect will be greater as the size of the dications gets
larger. On the other hand, alkyl chains do not have strong chemical interaction with
TCNQ, which is favorable for obtaining uniform TCNQ columns. However, even if an
alkyl chain takes the all-trans conformation, it cannot be a complete linear chain,
leading to obstruction of a uniform stack of TCNQ column from the spatial point of
view. The effect of the steric hindrance derived from the alkyl chain will be greater as
the size of the dication become larger, and more it will be if the dication cannot take the
an all-trans conformation. These effects are reflected in the multimerization of the
TCNQ column for n = 3, 4, 5, 6, where the size of the dication is relatively larger than
that of TCNQ. Therefore a smaller size of dication is required to improve the
conductivity of the crystal. For n = 2, another problem occurred; an appropriate dication
length cannot be obtained to achieve 1:4 stoichiometry, which forces the stoichiometry
to be 1:3. For n = 1, most of the obstacles mentioned above were alleviated. An
extremely short alkyl chain contributes the decrease of the steric hindrance for the

59
uniform TCNQ stack. The steric hindrance is reduced also by the insertion of the
solvent acetonitrile. Moreover, due to the small size of the dication itself, the
self-assembly of the TCNQ can be prior to the conformation of the dication, leading to
the relatively uniform TCNQ stack. As a result, a wide band width was successfully
obtained, and the highest conductivity was achieved in this series of the TCNQ salts.
2.3.3. Magnetic properties
Although the series of the TCNQ salts exhibited a variety of structures, the charge
transport did not show dramatic change by the difference in the p-p stacking patterns.
Since the charge transport exhibited rather localized charge features in all the salts, their
magnetic properties were expected to be a sensitive probe of the electronic structure in
these TCNQ anion radical salts. Magnetic susceptibility derived from the unpaired
electron has a variety of temperature-dependence owing to the difference in the
interaction between the adjacent spins. These magnetic behaviors have been studied for
inorganic materials, and they have been succeedingly applied for organic materials. In
most cases, inorganic materials consist of metal atoms or their oxides, and the magnetic
properties reflect the overall three-dimensional crystal structures. On the other hand,
organic compounds consist of anisotropic shaped molecules. Thus, spin-spin interaction
will become also anisotropic, resulting in the limited directional magnetic networks.
These organic magnets are useful as models of low-dimensional magnets, and for the
verification of the theory. If the magnetic properties of organic crystals can be
controlled by modifying the crystal structures, it will be possible to generate desired
magnetic properties by crystal design. Therefore systematic control of the magnetic
property can lead to multiple applications such as the development of new switching

60
devices, manifestation of photomagnetic effects, and for controlling spin cross over.
However, it has been very difficult to precisely control the magnetic properties by
modifying the crystal structures. This is because the intermolecular interactions are very
weak for organic magnets, and the crystal packing can greatly vary by only a slight
change of structural parameters. For all of the TCNQ anion radical salts obtained in this
study, segregated 1-D TCNQ columns were attained. Thus, the problem described
above is overcome, and with these crystals it is possible to investigate systematically the
variation of the magnetic properties by changing the intermolecular interactions. The
magnetic susceptibility of each crystal was examined not only for confirming the
multimerization but also for understanding the electronic structures through the
magnetic interaction in the multimeric 1-D chain.
Magnetic susceptibility of (C1BPy)(TCNQ)4CH3CN
The result of the magnetic susceptibility measurement for
(C1BPy)(TCNQ)4CH3CN is shown in Figure. 2.3.8.
Figure 2.3.8.Magnetic susceptibility of (C1BPy)(TCNQ)4CH3CN. The crosses are the observed values, and the solid lines are the best results of fitting.
For the n = 1 salt, singlet-triplet magnetic behavior was observed from room

61
temperature to around 50 K and the contribution from the Curie component became
visible below 50 K, as shown in Figure 2.3.8. The magnetic susceptibility was fitted to
the summation of the thermally activated component and the Curie component [37-40].
Fitting function is as follows:
where N stands for the number of the spins, which corresponds to twice of the
Avogadro’s number (one spin per TCNQ dimer), and C is the Curie constant, 0.375 emu
K mol-1, g is the g-factor, b is the Bohr magneton, J is the exchange magnetic
interaction between two adjacent spins, k is the Boltzmann constant, x is a fraction of
the thermally activated component, and q is the Weiss temperature. As a result of fitting,
|J|/k = 510 K, x = 0.986 (q = -2.5 K).
According to the values of the overlap integrals, it was suggested that TCNQ
columns were not significantly dimerized. Because of this, the n = 1 salt had the highest
conductivity among this series of TCNQ salts studied. The reproduction of the magnetic
behavior with the singlet-triplet model meant that a spin dimer was formed in the
ground state. Furthermore, the value of |J| was considerably high for this salt. The
activation energy of the conduction (0.16 eV) suggested that there was a large charge
gap. This was consistent with the large |J| and the semiconducting behavior. The spin
model for the n = 1 salt is described in Scheme 2.6.
c =2Ng2b2
kT 3 + exp J /kT( )[ ]x +
CT - q
1 - x( )

62
Scheme 2.6. Singlet-triplet type spin model for n = 1. Each green parallelogram surrounds the configurational repeating unit of the TCNQ column, in which the spins form a singlet pair.
Magnetic susceptibility of (C2BPy)(TCNQ)3
For the n = 2 salt, the magnetic susceptibility was almost equal to zero in the whole
temperature region (2-300 K). As described in structural discussion, the TCNQ column
was trimerized, and each TCNQ molecule had -2/3 charge. Thus it is considered that
two spins are shared by three TCNQ molecules, and the two spins are cancelled their
magnetic moments with each other, leading to the extinction of the magnetic moment
and non-magnetic behavior.
Magnetic susceptibility of a-(C3BPy)(TCNQ)4
The result of the magnetic susceptibility measurement for a-(C3BPy)(TCNQ)4 is
shown in Figure. 2.3.9.

63
Figure 2.3.9.Magnetic susceptibility of a-(C3BPy)(TCNQ)4. The crosses are the observed values, and the solid lines are the best results of fitting.
In this salt, the TCNQ column is dimerized and the formal charge is almost -1/2 for
each TCNQ molecule. Thus, it is considered that one spin is shared by two TCNQ
molecules. According to the crystal structure, there is no center of symmetry between
two adjacent TCNQ dimers. Therefore the interactions between two adjacent dimers
were alternatingly different, so were the exchange interactions between the spins. The
spin model could be described using Scheme 2.7. The magnetic susceptibility was fitted
to the function of an alternating chains model with the alternating parameter a ≤ 0.4for
antiferromagnetically coupled S= 1/2 spins [37, 41].
where .
J is the exchange magnetic interaction between two adjacent spins, k is the Boltzmann
constant, b is the Bohr magneton, N stands for the number of the spins, which
corresponds to twice of the Avogadro’s number (one spin per TCNQ dimer),and
A = 0.25,
c =Ng2b2
kTA + Bx + Cx2
1+ Dx + Ex2 + Fx3
x =Jk

64
B = -0.062935 + 0.11376a
C = 0.0047778 – 0.033268a + 0.12742a2 – 0.32918a3 + 0.25203a4
D = 0.053860 + 0.70960a
E = -0.00071302 − 0.1058a + 0.54883a2- 0.20603a3
F = 0.047193 – 0.0083778a + 0.87256a2 – 2.7098a3 + 1.9798a4.
As a result from fitting, a = 0.17 and |J|/k = 47.8 K.
Scheme 2.7. Alternating chain type spin model. The red arrows are S = 1/2 spin in the dimeric unit, the blue solid curves are the one kind of exchange interactions (J), and the dashed curves are the other kind of exchange interactions (aJ).
Magnetic susceptibility of b-(C3BPy)(TCNQ)4
The result of the magnetic susceptibility measurement for b-(C3BPy)(TCNQ)4 is
shown in Figure 2.3.10.
Figure 2.3.10. Magnetic susceptibility of b-(C3BPy)(TCNQ)4. The crosses are the observed values, and the solid lines are the best results of fitting.
J aJ J aJ

65
In this salt, the TCNQ column is dimerized and the formal charge is almost -1/2 for
each TCNQ molecule. Thus, it is considered that one spin is shared by two TCNQ
molecules. According to the crystal structure, there is no center of symmetry between
two adjacent TCNQ dimers. Therefore the interactions between two adjacent dimers
were alternatingly different, so were the exchange interactions between the spins. The
spin model could be described just the same as a-(C3BPy)(TCNQ)4, using Scheme 3.
The magnetic susceptibility was fitted to the function of an alternating chains model
with the alternating parameter a ≤ 0.4for antiferromagnetically coupled S= 1/2 spins
described for a-(C3BPy)(TCNQ)4. As a result from fitting (Figure 2.3.10), a = 0.12 and
|J|/k = 51.6 K.
Magnetic susceptibility of (C4BPy)(TCNQ)4
The result of the magnetic susceptibility measurement for (C4BPy)(TCNQ)4 is
shown in Figure 2.3.11.
Figure 2.3.11.Magnetic susceptibility of (C4BPy)(TCNQ)4. The crosses are the observed values, and the solid lines are the best results of fitting.

66
In this salt, the TCNQ column is dimerized and the formal charge is almost -1/2 for
each TCNQ molecule. Thus, it is considered that one spin is shared by two TCNQ
molecules. According to the crystal structure, there is no center of symmetry between
two adjacent TCNQ dimers. Therefore the interactions between two adjacent dimers
were alternatingly different, so were the exchange interactions between the spins. The
spin model could be described just the same as a-(C3BPy)(TCNQ)4 and
b-(C3BPy)(TCNQ)4using Scheme 6. The magnetic susceptibility was fitted to the
function of an alternating chains model with the alternating parameter a ≤ 0.4for
antiferromagnetically coupled S= 1/2 spins described previously. As a result from fitting
(Figure 2.3.11), a = 0.03 and |J|/k = 80.6 K.
Magnetic susceptibility of (C5BPy)(TCNQ)4
The result of the magnetic susceptibility measurement for (C5BPy)(TCNQ)4 is
shown in Figure 2.3.12.
Figure 2.3.12.Magnetic susceptibility of (C5BPy)(TCNQ)4. The crosses are the observed values, and the solid lines are the best results of fitting.
As described in the structural discussion, two types of tetramers were arranged

67
alternately. In one of the tetramers (CDD’C’), the charges were localized on the two
middle molecules (D, D’) and the two spins are cancelled each other, leading to the
extinction of the magnetic moment resulting in a spin singlet in this part. From this
future, the two spins that were accommodated in the other tetramer (BAA’B’) were
isolated, leading to singlet-triplet type magnetic behavior (Scheme 2.8) in which
one-half of the formal TCNQ dimers contributed to the paramagnetism (N becomes just
the Avogadro’s number). The fitting was performed using the equation used for
(C1BPy)(TCNQ)4CH3CN. As a result of fitting in Figure 2.3.12, |J|/k = 353 K, x =
0.905 (q = 1.0 K).
Scheme 2.8. Singlet-triplet type spin model for n = 5.The green dashed line surrounds a pair of the TCNQ dimers that contribute to the singlet-triplet type paramagnetism.
Magnetic susceptibility of (C6BPy)(TCNQ)4
The result of the magnetic susceptibility measurement for (C6BPy)(TCNQ)4 is
shown in Figure 2.3.13.
J

68
Figure 2.3.13.Magnetic susceptibility of (C6BPy)(TCNQ)4. The crosses are the observed values, and the solid lines are the best results of fitting.
In this salt, the TCNQ column is dimerized and the formal charge is almost -1/2 for
each TCNQ molecule. Thus, it is considered that one spin is shared by two TCNQ
molecules. According to the crystal structure, there is a center of symmetry between two
adjacent TCNQ dimers, leading to a uniform exchange interactions between them. The
spin model for antiferromagnetically coupled S= 1/2 spins could be described using
Scheme 2.9 and the susceptibility was fitted to:
where , and N stands for the number of the spins, which corresponds to twice of
the Avogadro’s number [35, 40-42].
As a result of fitting (Figure 2.3.13), |J|/k = 7.2 K.
Scheme 2.9. Antiferromagnetic 1-D chain (Bonner-Fisher type) spin model. The red arrows are S = 1/2 spin in the dimeric unit, and all the blue solid curves represent the same scale of exchange interaction (J).
32
222
757825.0172135.09931.00.1075235.0074975.025.0
xxxxx
kTNg
+++++
=bc
x =Jk
J J J

69
Magnetic susceptibility of (C6BPy)(TCNQ) 3
For the (C6BPy)(TCNQ) 3, the magnetic susceptibility was almost equal to zero in
the whole temperature region (2-300 K). As described in structural discussion, the
TCNQ column was trimerized, and each TCNQ molecule had -2/3 charge. Thus it is
considered that two spins are shared by three TCNQ molecules, and the two spins are
cancelled each other, leading to the extinction of the magnetic moment and
non-magnetic behavior.
The temperature dependence of the susceptibility is classified into four types;
namely, alternating chain, Bonner-Fisher, singlet-triplet, and spin singlet ones.
Alternating chain type salts. The n = 3 (a-form), n = 3 (b-form) and n = 4 salts are
classified as alternating chain type salts. In these salts, the TCNQ column is composed
of TCNQ dimer units. Since the interactions between two adjacent dimers were
alternatingly different, so were the exchange interactions between the spins, each of
which were accommodated in the dimer.
Antiferromagnetic 1-D chain (Bonner-Fisher type) salts. The n = 6 (1:4) salt is a
Bonner-Fisher type salt. The 1-D chain was composed of TCNQ dimer units and the
center of symmetry was located on the midpoint of each dimer unit (AA’ and BB’).
Consequently, the exchange interactions between two adjacent dimers were uniform.
Singlet-triplet type salts. The n = 1 and n = 5 salts are singlet-triplet type salts. For

70
both of them, the magnetic susceptibilities of the two salts were fitted to the summation
of the thermally activated component and the Curie component [37, 42–45]. However,
the spin model is different between these two salts. For the n = 1 salt, the spin dimer
was formed in the ground state, but the dimerization was not significant from the
structural point of view. In the case of an antiferromagnet, the magnetic susceptibility
does not become zero at the lowest temperature. For the n = 1 salt, the ground state is
singlet, which means that the dimerization between the TCNQ dimers (each
accommodates one spin) is rather strong (at least, the dimerization of the spins should
become strong at the lower temperature). This behavior is inconsistent with the good
conductivity, but the details have not been clarified. However, this feature of the spin
structure in the n = 1 salt was reflected on the electric behavior (high conductivity but
semiconducting with large activation energy).
On the other hand, for the n = 5 salt, singlet-triplet type magnetic behavior was
derived from the long distance between the two-spin dimers owing to the absence of the
magnetic moment because of the spin cancellation. For the n = 5 salt, the distribution of
the Curie component is much larger (Figure 2.3.14). This is probably because of the
lattice defect or the not-fully dimerized spin (D, D’ described in Figure 2.3.1 (d)) due to
the poorer crystallinnity than other crystals of this series.

71
Figure 2.3.14. Magnetic susceptibility of (a) (C1BPy)(TCNQ)4 and (b) (C5BPy)(TCNQ)4. The crosses are the observed values, the red dotted lines are the thermally activated components, the blue dotted lines are the Curie components, and the solid red lines are the best fit of the summation of the thermally activated and Curie components.
Spin singlet type salts. The n = 2 and n = 6 salts (1:3 stoichiometry) are spin singlet
type salts. The two spins were accommodated in the TCNQ trimer and the
antiferromagnetic interactions between the two spins in the trimer were considerably
strong, leading to non-magnetic behavior (Scheme 2.10).
Scheme 2.10. Spin singlet type spin model
(a)
(b)

72
As mentioned above, the magnetic behavior of this series of TCNQ salts depended
on the value of n. These magnetic behaviors can be explained by the spin models where
the spins were accommodated in the TCNQ and were classified into several types. If
these spin models were arranged according to the change of n and stoichiometry, there
was an interesting relationship between the size change of the dications and the
variations in the spin structures, as summarized in Figure 2.3.15.
Figure 2.3.15. Correlations between the variations in the magnetic behavior and the size of the dication.
Taking the concept of the effective dication length into account, it can be presumed
that the appropriate dication sizes for forming 1:4 TCNQ salts were achieved when n =
3 and 4. In this case, significant dimerization of the TCNQ column appeared,
corresponding to alternating chain-type magnetic behavior. If the n value was further
increased, the dication size became too big. Therefore, the TCNQ molecules were
73
required to arrange in an energetically disadvantageous manner, resulting in different
spin structures from that of n = 3 and 4 salts. Now the n = 5 and n = 6 (1:4) salts will be
compared with the n = 3 and 4 salts. In the n = 6 case, the |J| value between the TCNQ
dimers greatly decreased, reflecting the decline in the molecular planes in the two
adjacent TCNQ dimers, accompanied with the dication transformation. The dimerized
TCNQ column was similar to that in the n = 3 and 4 salts, therefore the magnetic
behavior of the n = 6 (1:4) salt was rather similar to those of the n = 3 and 4 salts. On
the contrary, for the n = 5 salts, the magnetic behavior was quite different from that of
the n = 3, 4 and 6 salts, reflecting the charge localization. This large change in the
magnetic behavior was likely derived from the parity of n for the crystal packing.
For the n = 1 or 2 cation, it was difficult to take the 1:4 stoichiometry because of
the small size of the dication. For n = 2, the stoichiometry changed into 1:3, leading to
spin singlet type magnetic behavior. For n = 1, there was a relatively uniform TCNQ
stack, owing to the introduction of solvent molecules, which may have resulted in
different magnetic behavior from that of the n = 3 and 4 salts. As stated above,
variations in the spin structures with different dication sizes can be rationalized by
introducing the concept of the effective dication length.
2.4. Summary and conclusion
By using size tunable dications a series of TCNQ salts, (CnBPy)(TCNQ)x were
fabricated. For all of these crystals, the TCNQ molecules stacked in a face-to-face
manner, thus the segregated conducting columns were attained. The stoichiometry did
not vary much with a change in the dication size, taking only two stoichiometries, either
1:3 or 1:4. This meant that the stoichiometries of the TCNQ salts in this study were

74
dominated by the preferential charge in TCNQ and the dications flexibly adjusted their
lengths over a certain range to achieve the desired stoichiometry. For either of the two
stoichiometries, each TCNQ molecule had fractional charge in principle. Therefore, this
series of TCNQ salts met both the structural and electronic requirements for conducting
organic crystals. However, all of the salts demonstrated semiconducting behavior. This
was because the non-uniform overlap of the LUMO between the TCNQ molecules
prevented the column TCNQ from obtaining sufficient band widths to have the valence
bands and conduction bands overlap. There was a correlation between the conductivity
and the overlap integrals in the TCNQ columns. The smallest overlap integral was
found for n = 6 salt (1:4 stoichiometry), resulting in the lowest conductivity of this
series. On the contrary, there was not a significant alternation of the overlap integrals
for n = 1 salt owing to the relatively small dication and inserted solvent molecules,
leading to the highest conductivity of this series. Therefore one effective attitude to
improve the conductivity was able to be proposed. Another proposal about crystal
design for the improvement of the conductivity could be carried out. Now the disarray
of the TCNQ stack proved to be a hindrance to high conductivity and it derives from the
flexibility of the alkyl chains of the dication. Thus the hindrance would be reinforced by
using a rigid alkene or alkyne as the organic spacer instead of alkyl chains. If such
TCNQ salts are successfully designed, the conductivity can be higher than that of n = 1
salt, giving further information about the design of conductors with size tunable counter
ions.
Of the possible two stoichiometries, the dominant one was 1:4, but it could shift to
1:3 depending on the dication size. Considering the effective dication length, the TCNQ
stacking state and the formal charge, the 1:4 stoichiometry was preferred when n = 3 or

75
4. When n was increased above these values, some load was applied to form a 1:4 salt.
This effect appeared as a charge localization for the n = 5 salt and as a severe distortion
of the dication molecules or a stoichiometry change for the n = 6 salt. On the contrary,
the 1:3 stoichiometry occurred when n = 2. Insertion of solvent molecules occurred
when n = 1, caused by their short lengths.
The different assembling states resulted in variations in the spin states, and their
magnetic properties were investigated by classifying the temperature dependence of the
susceptibility and by modeling the spin structure based on the crystal structure. Since
this study is the first example in which single crystals of a full series of TCNQ anion
radical salts with a size-tunable cation were successfully prepared and the details of
their charge transport and magnetic properties were determined, the results described in
the chapter is quite valuable. From the knowledge about structure-property correlation
obtained from this study of the series of TCNQ salts, one can estimate the magnetic
properties to some extent if only the crystal structure is known. This estimation may be
applied for the other charge transfer salts or charge transfer complexes with p-stacks.
Therefore, this series of TCNQ salts can be one good prototype for designing the
organic crystals with desired magnetic properties.

76
References
[1] Saito, G.; Ferraris, J. P. Bull. Chem. Soc. Jpn., 1980, 53, 2141-2145.
[2] Torrance, J. B. Acc. Chem. Res., 1979, 12, 79-86.
[3] Sekizaki, S.; Konsha, A.; Yamochi, H.; Saito, G. Mol. Cryst. Liq. Cryst, 2002, 376,
207-212.
[4] Suzuki, T.; Kabuto, C.; Yamashita, Y.; Mukai, T.; Miyashi, T.; Saito, G. Bull. Chem.
Soc. Jpn, 1988, 61, 483-493.
[5] Ferraris, J.; Cowan, D. O.; Walatka, V.; Perlstein, J. H. J. Am. Chem. Soc., 1973, 95,
948-949.
[6] Fahrenbach, A. C.; Sampath, S.; Late, D. J.; Barnes, J. C.; Kleinman, S. L.; Valley,
N.; Hartlieb, K. J.; Liu, Z.; Dravid, V. P.; Schatz, G. C.; Duyne, R. P. V.; Stoddart, J.
F. ACS NANO, 2012, 6, 9964-9971.
[7] Berr, S.; Jones, R. R. M.; Johnson, J. S. J. Phys. Chem., 1992, 96, 5611-5614.
[8] Konno, M.; Saito, Y. Acta Crystallogr. B, 1981, 37, 2034-2043.
[9] Rizkallah, P. J.; Wallwork, S. C.; Graja, A. Acta Crystallogr. C, 1983, 39, 128-131.
[10] Malatesta, V.; Millini, R.; Montanari, L. J. Am. Chem. Soc., 1995, 117,
6258-6264.
[11] Takagi, S.; Nakao, K.; Nakatsu, K. J. Phys. Soc. Jpn., 1994, 63, 271-282.
[12] Takagi, S.; Nakatsu, K.; Date, M. J. Phys. Soc. Jpn., 1988, 57, 2154-2161.
[13] Mathieu, F. Acta Crystallogr. C, 1986, 42, 1169-1172.
[14] Ashwell, G. J.; Allen, D. W.; Kennedy, D. A.; Nowell, I. W. Acta Crystallogr. B,
1982, 38, 2525-2528.
[15] Filhol, A.; Zeyen, C. M. E.; Chenavas, P.; Gaultier, J.; Delhaes, P. Acta
Crystallogr. B, 1980, 36, 2719-2726.
77
[16] Ashwell, G. J.; Eley, D. D.; Wallwork, S. C.; Willis, M. R. Nature, 1976, 259,
201-202.
[17] Ashwell, G. J.; Eley, D. D.; Fleming, R. J.; Wallwork, S. C.; Willis, M. R. Acta
Crystallogr. B, 1976, 32, 2948-2952.
[18] Ashwell, G. J. Phys. Stat. Sol. A, 1984, 83, 669-673.
[19] Ashwell, G. J.; Eley, D. D.; Harper, A.; Torrance, A. C.; Wallwork, S. C.; Willis,
M. R. Acta Crystallogr. B, 1977, 33, 2258-2263.
[20] Ashwell, G. J.; Allen, J. G.; Goodings, E. P.; Kennedy, D. A.; Nowell, I. W.
Phys. Stat. Sol. A, 1983, 75, 663-667.
[21] Ashwell, G. J.; Nowell, I. W. Phys. Stat. Sol. A, 1984, 83, 39-45.
[22] Ashwell, G. J.; Eley, D. D.; Wallwork, S. C.; Willis, M. R.; Welch, G. D.;
Woodward, J. Acta Crystallogr. B, 1977, 33, 2252-2257.
[23] Ashwell, G. J.; Eley, D. D.; Drew, N. J.; Wallwork, S. C.; Willis, M. R. Acta
Crystallogr. B, 1977, 33, 2598-2602.
[24] Ashwell, G. J.; Eley, D. D.; Drew, N. J.; Wallwork, S. C.; Willis, M. R. Acta
Crystallogr. B, 1978, 34, 3608-3612.
[25] Ashwell, G. J. Phys. Stat. Sol. B, 1978, 86, 705-715.
[26] Ashwell, G. J.; Bartlett, V. E.; Davies, J. K.; Eley, D. D.; Wallwork, S. C.;
Willis, M. R.; Harper, A.; Torrance, A. C. Acta Crystallogr. B, 1977, 33, 2602-2607.
[27] Waclawek, W.; Wallwork, S. C.; Ashwell, G. J.; Chaplain, E. J. Acta
Crystallogr. C, 1983, 39, 131-134.
[28] Hadek, V.; Noguchi, H.; Rembaum, A. Macromolecules, 1971, 4(4), 494-499.

78
[29] SIR 2004. Burla, M. C.; Caliandro, R.; Camalli, M.; Carrozzini, B.; Cascarano,
G. L.; De Caro,L.; Giacovazzo, C.; Polidori, G.; Spagna, R. J. Appl. Crystallogr.,
2005, 38, 381-388.
[30] SHELX97. Sheldrick, G. M. 1997.
[31] CrystalStructure4.0™: Crystal Structure Analysis Package, Rigaku Corporation
(2000-2010). Tokyo 196-8666, Japan.
[32] Bain, G. A.; Berry, J. F. J. Chem. Educ., 2008, 85, 532-536.
[33] Hoffmann, R. J. Chem. Phys. 1963, 39, 1397-1412.
[34] Whangbo, M. -H.; Hoffmann, R.; Woodward, R. B. Proc. R. Soc. London, Ser.
A 1979, 366, 23-46.
[35] Ren, J.; Liang, W.; Whangbo, M.-H. CAESAR; Prime-Color Software, Inc.:
Raleigh, NC, 1998.
[36] Kistenmacher, T. J.; Emge, T. J.; Bloch A. N.; Cowan, D. O. Acta Crystallogr.
B, 1982, 38, 1193-1199.
[37] Kahn, O. In Molecular Magnetism; VCH Publishers, Inc.: New York, 1993.
[38] Nomura, M.; Fourmigue, M. New J. Chem., 2007, 31, 528-534.
[39] Iwase, K.; Yamaguchi, H.; Ono, T.; Shimokawa, T.; Nakano, H.; Matsuo, A.;
Kindo, K.; Nojiri, H.; Hosokoshi, Y. J. Phys. Soc. Jpn., 2013, 82, 074719.
[40] Bleaney, B.; Bowers, K. D. Proc. R. Soc. London, Ser. A, 1952, 214, 451-465.
[41] Hall, J. W.; Marsh, W. E.; Weller, R. R.; Hatfield, W. E. Inorg. Chem., 1981, 20,
1033-1037.
[42] Mukherjee, P. S.; Dalai, S.; Mostafa, G.; Lu, T. H.; Rentschler, E.; Chaudhuri,
N. R. New J. Chem., 2001, 25, 1203-1207.
[43] Bonner, J. C.; Fisher, M. E. Phys. Rev. A, 1964, 135, 640-658.

79
[44] Estes, W. E.; Gavel, D. P.; Hatfield, W. E.; Hodgson, D. Inorg. Chem., 1978, 17,
1415-1421.

80
Chapter 3. Carrier doping to the TCNQ anion radical salts by the
contact method
3.1. Introduction
3.1.1. The background of the contact method
Thus far, the guideline to design new conductive organic crystals by synthesis has
been introduced. Based on the guideline, the specific components have been selected,
and the correlation between the crystal structure and their physical properties has been
discussed. In this chapter, by the contact method introduced in Chapter1, carrier
injection to organic crystals and the improvement of the conductivity induced by the
modification of the electronic structure are described. In this section, previously
performed studies are described. From these studies, the mechanism of the contact
doping is speculated. Along the mechanism proposed, the perspective view and the
objects of this study are described. Then, the effects of the carrier doping are evaluated
and discussed by several physical measurements.
The carrier doping by the contact method was at first demonstrated by H. Alves et
al. in 2008 [1]. In that study, TTF single crystal and TCNQ single crystal were
contacted with each other (Figure 3.1.1(a)).
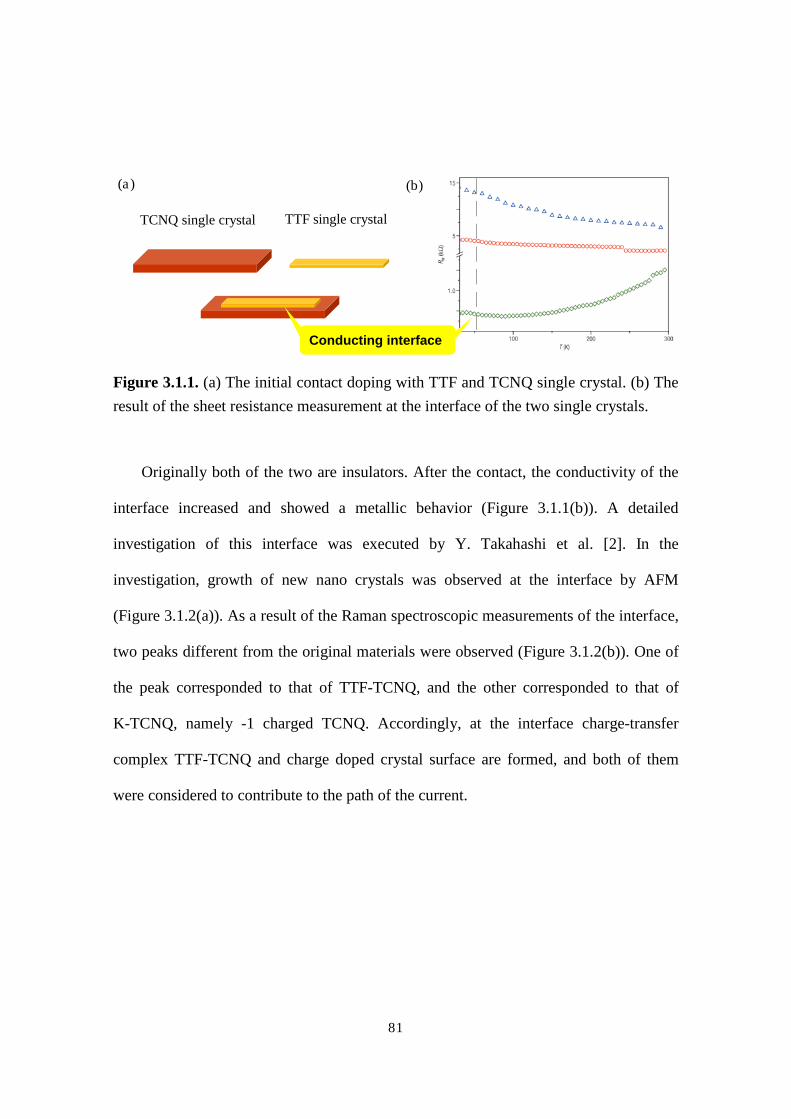
81
Figure 3.1.1. (a) The initial contact doping with TTF and TCNQ single crystal. (b) The result of the sheet resistance measurement at the interface of the two single crystals.
Originally both of the two are insulators. After the contact, the conductivity of the
interface increased and showed a metallic behavior (Figure 3.1.1(b)). A detailed
investigation of this interface was executed by Y. Takahashi et al. [2]. In the
investigation, growth of new nano crystals was observed at the interface by AFM
(Figure 3.1.2(a)). As a result of the Raman spectroscopic measurements of the interface,
two peaks different from the original materials were observed (Figure 3.1.2(b)). One of
the peak corresponded to that of TTF-TCNQ, and the other corresponded to that of
K-TCNQ, namely -1 charged TCNQ. Accordingly, at the interface charge-transfer
complex TTF-TCNQ and charge doped crystal surface are formed, and both of them
were considered to contribute to the path of the current.
TTF single crystal TCNQ single crystal
(a) (b)
Conducting interface

82
Figure 3.1.2. The AFM image (a) and the Raman scattering spectra (b) of the TCNQ crystal surface after the removal of the TTF powder.
In this manner, the contact method makes it possible to dope carrier to the object
very easily, so that it is an effective way to improve the conductivity of semiconductors
or insulators and to obtain metallic surfaces. There are two approaches to extend the
application of the contact method.
(i) Either “complexes generated on the interface” or “carrier doped interface” can
individually contribute to the increase of the conductivity. Only the latter would be
1350 1400 1450 1500
TTF-TCNQ
KTCNQ
Raman Shift /cm-1
TCNQ
Inte
nsity
(a)
(b)
TCNQ crystal surface after the removal of TTF
(a)
83
realized when the combination would not give any charge transfer complexes, leading
to pure carrier doping to organic semiconductors.
(ii) In the first attempt demonstrated for a combination of TTF and TCNQ, both of
them were single component crystals. It might be applicable to the two-component
systems, in other words, charge transfer complexes. The doping variation of this method
will be greatly increased.
As an example of (i), the combination of nickel-phthalocyanine (NiPc) and
2,5-difuluoro-tetracyanoquinodimethane (F2TCNQ) was investigated as an object of the
contact method (Figure 3.1.3(a)) [3]. It is already known that these two components do
not form a charge transfer complex. Nevertheless, the conductivity of the interface was
found to be increased after the contact (Figure 3.1.3(b)). Based on this observation, the
carrier doping at the contact interface was proved to occur for the proper combination.

84
Figure 3.1.3. (a) The contact of NiPc and F2TCNQ single crystal. (b) The current increase at the interface of the two crystals.
With regard to (ii), carrier doping to the ionic charge transfer complex of
ET-F2TCNQ was performed by contacting TTF on its surface (Figure 3.1.4(a)) [4]. In
this experiment, electron doping occurs on the ET-F2TCNQ crystal surface since TTF is
a stronger donor molecule than ET, which is the donor component of the substrate. This
is accompanied by the extraction of the F2TCNQ, leading to the generation of charge
transfer complex TTF-F2TCNQ. Since TTF-F2TCNQ is an insulator as well as
1 mm
Ni(Pc) F2TCNQ
(a)
(b)

85
ET-F2TCNQ, carrier doped interface is considered to contribute to the increase of the
conductivity (Figure 3.1.4(b)).
Figure 3.1.4. (a) The contact of ET-F2TCNQ and TTF single crystal. (b) The current increase at the interface of the two crystals.
Based on these investigations, the mechanism of the carrier doping by the contact
method for two-component system can be discussed as follows. Depending on the
degree of charge transfer, charge transfer complexes are classified into neutral
complexes and ionic complexes.
For neutral complexes, donor components (D) and acceptor components (A) are
(a)
(b)
TTF single crystal ET-F2TCNQ
single crystal

86
regarded to be neutral (described as D0, A0, respectively, in this chapter). In such cases,
only mixed-stack structures of D0 and A0 are obtained, since no cohesive force operates
in the segregated-stack structures. For the purpose of the electron doping, the extrinsic
donor molecule (Dex) is required to be a stronger one (D<Dex). When the electron
doping occurs, no other component in the substrate can receive electron than
A0.Therefore, in this case, Dex turns Dex+, and A0 turns A-1. In general, a new complex is
formed at the interface; A-1is extracted to the crystal surface to form an ionic complex
of DexA (Figure 3.1.5). On the other hand, carrier doping without forming ionic CT
complexes may not occur, since no stabilization energy is gained by incorporating ionic
A- in the original mixed stack.
Figure 3.1.5. The electron-doping process for charge transfer complexes with a neutral ground state.

87
For ionic complexes, donor components and acceptor components are regarded to
be ionic states (D+ and A-, respectively). In this case, the donor and acceptor
components may take either mixed-stack or segregated-stack structures. The electron
doping occurs when a stronger donor Dex is contacted on the surface. Since the acceptor
components are already ionized (A-1) in the substrate, D+ will receive the electron. Thus,
Dex0 turns Dex
+, and D+ turns D0 as a result of the carrier doping. If a new complex is
formed, A-1 is extracted to the crystal surface to form DexA (Figure 3.1.6). Carrier
doping without forming DexA complex might occur for the segregated-stack structure.
Figure 3.1.6. The electron-doping process for an ionic charge transfer complex.
According to the discussion above, the strength of the donor is important to attain
the electron doping. However, it was found that in some cases the electron doping did

88
not occur even if this condition is fulfilled. Since the contact doping is a novel method
for the carrier doping, there are many other parameters to be clarified. To establish
systematical conditions for contact doping, it is important to expand its application.
In order to confirm the conditions, a new object for the contact doping was
designed in this study. The following points were focused on.
(i) The electron doping to the two-component systems has been attained by contacting
strong donor of TTF. However, the hole-doping to the two-component systems has not
been attained. If it is shown that the hole-doping is feasible by contacting an extrinsic
acceptor, the application of the contact method can widely be expanded.
(ii) The carrier doping for two-component system has been attained only for the
complexes with mixed-stack structure so far. There is no example of the carrier doping
for the complex with segregated-stack structure.
Based on (i) and (ii), both “the hole doping to the two-component system” and “the
carrier doping to the crystal with segregated-stack structure” became the objective of
this study. TCNQ anion radical salts are again suitable for this investigation. It is
considered that the hole-doping is possible if a stronger acceptor than TCNQ, such as
2,3,5,6-tetrafuluoro-tetracyanoquinodimethane (F4TCNQ), is conjugated on the surface
of the TCNQ anion radical salts. In addition, anion radical salts have segregated-stack
structure without any exception, thus they fit the point (ii). At first the TCNQ salts with
dications described in Chapter 2 were considered as the candidates. This is because the
crystal structures have been disclosed and the direction of TCNQ column can easily be
distinguished owing to their clear crystal habit. Additionally, systematical modification
of the change in the TCNQ stack was expected to be possible. However, the electrical
properties of the dication-TCNQ salts did not changed at all when F4TCNQ was

89
conjugated on their surface, therefore no effect of the hole-doping was obtained. As a
result of searching appropriate TCNQ anion radical salts, the effect of the hole-doping
was observed when K-TCNQ was used as the substrate crystal. In this chapter, the
hole-doping for K-TCNQ by F4TCNQ contact is described. In the next section, the
original characteristics of K-TCNQ are explained. Then, the effects of the hole-doping
by contacting F4TCNQ in this study are described, in which the results of AFM, SEM,
IR, and conductivity measurements are discussed.
3.1.2. The original characteristics of K-TCNQ
K-TCNQ is a completely-charge transferred anion radical salt, in which the
stoichiometry of the potassium ion and TCNQ anion is 1:1. Thus, the initial charge state
of TCNQ is fully ionized, which means that the conduction band is half-filled. The
crystal structure and the structural phase transition around 395K of K-TCNQ were
reported by M. Konno in 1977 [5]. The phase below 395K is called low temperature
(LT) phase, where two independent TCNQ molecules individually form segregated
columns, and both of the two columns are dimerized (Figure 3.1.7(a), space group:
P21/n, Z = 8). This dimerization is verified by the alternating inter-planar distances and
the overlap integrals. (In the reference [5], the dimerization is assessed only by the
inter-planar distances. In this thesis the overlap integrals were calculated using the CIF
crystal data reported.) Owing to this dimerization, a band gap is formed, and the electric
behavior of K-TCNQ is insulating. Thus, the LT phase is a band insulator. On the other
hand, the TCNQ column becomes uniform stack above 395 K (high temperature (HT)
phase, Figure 3.1.7(b), space group: P21/c, Z = 2). This is confirmed by the symmetry of
the crystal. In this phase, in spite of the uniform TCNQ stack the electric behavior is

insulating because of the on
insulator. The inter-planar
respective phases are shown in
Figure 3.1.7. The crystal structure of K(a), the red and green dotted square describe two independent TCNQ columns. For (b), the blue wavy line means the TCNQ stack is uniform.
A
A’
A’
(a)
(b)
90
insulating because of the on-site Coulomb repulsion. Thus, the HT phase is a Mott
planar spacing and the overlap integrals of adjacent TCNQ for
are shown in Table 3.1.1.
The crystal structure of K-TCNQ for (a) LT phase and (b) HTand green dotted square describe two independent TCNQ columns. For (b),
the blue wavy line means the TCNQ stack is uniform.
B’
B’
B
oulomb repulsion. Thus, the HT phase is a Mott
and the overlap integrals of adjacent TCNQ for
and (b) HT phase. For and green dotted square describe two independent TCNQ columns. For (b),

91
Table3.1.1. The interplanar spacing and the overlap integrals of K-TCNQ for LT phase and HT phase
Inter-planar spacing (Ǻ) Overlap Integral
LT phase
(Stack 1)
AA’ 3.240 0.0217
A’A 3.554 0.0085
LT phase
(Stack 2)
BB’ 3.234 0.0222
B’B 3.580 0.0081
HT phase 3.479 0.0128
Another important property of K-TCNQ is the non-linear current-voltage (I-V)
characteristics, i.e. negative differential resistance characteristics. This is a phenomenon
that the resistance rapidly decreases above a certain applying voltage. The negative
differential resistance characteristics of K-TCNQ were discovered by R. Kumai in 1999
(Figure 3.1.8) [6].
Figure 3.1.8. The negative differential resistance characteristics of K-TCNQ at
different temperatures (curve a, 300 K; curve b, 280 K; curve c, 230 K; curve d, 180 K; curve e, 180 K).
92
If the hole-doping for K-TCNQ occurs, these characteristics will be changed. Thus,
in this study, the modification of the electrical properties by the contact doping is
investigated.
3.2. Experimental
3.2.1. Crystal growth of K-TCNQ
Potassium iodide was commercially obtained and used without further purification.
TCNQ was also commercially obtained and used after the purification by
recrystallization. 38 mg of potassium iodide (Wako chemical Co. Ltd.) and 30mg of
TCNQ (Wako chemical Co. Ltd.) were each dissolved in 20 mL of hot acetonitrile and
then the solutions were mixed. 2 or 3 days later, red purple block crystals of K-TCNQ
were obtained. All the steps were performed in the ambient conditions.
3.2.2. Contact doping using F4TCNQ powder
F4TCNQ was commercially obtained and used without further purification. For the
contact doping, powder F4TCNQ was conjugated on the surface of the K-TCNQ single
crystal. This state was kept for a couple of days in an incubator with setting the
temperature at 313 K. After that the powder F4TCNQ was removed by an air duster, and
then the hole-doped crystal surface was obtained. The sheet resistance was measured
along the TCNQ stacking direction in a hole-doped crystal surface using a two-probe
method. Gold paste (Tokuriki Chemical Research Co. Ltd.) was used to connect two
gold wires (ɸ = 20 μm) at opposite ends of a plate crystal surface. The resistance was
measured by KEITHLEY 6487 PICOAMMETER/VOLTAGE SOURCE. The

93
temperature dependence was measured using a closed cycle cryostat system.
3.2.3. Time dependence of the electrical conductivity
The time dependence of the current was measured in an incubator keeping the
F4TCNQ conjugated on the surface of the K-TCNQ single crystal, setting the
temperature at 313 K. The sheet resistance was measured along the TCNQ stacking
direction using a two-probe method. Gold paste (Tokuriki Chemical Research Co. Ltd.)
was used to connect two gold wires (ɸ = 20 μm) at opposite ends of a plate crystal
surface. The resistance was measured by KEITHLEY 6487
PICOAMMETER/VOLTAGE SOURCE.
3.2.4. Optical measurements
Accompanied by the hole-doping, a new complex can be generated on the surface
of the K-TCNQ crystal. According to 3.1.1, the complex could be K-F4TCNQ. To
confirm this, IR spectra were measured at room temperature using a Spectrum One
FT-IR spectrometer (Perkin Elmer Instruments) for five samples; neutral TCNQ, neutral
F4TCNQ, K-TCNQ, the mixture of K-TCNQ and F4TCNQ (this corresponds to the
contacted states of the two components), and K-F4TCNQ.
3.2.5. The surface images of the interface
The surface SEM images were scanned by a JSM-6700FT field emission
microscope. The samples were mounted on a sample holder using adhesive carbon tape.
An accelerating voltage 5.0 kV was applied during the observations. An as-grown
K-TCNQ surface and a hole-doped surface were compared to each other. The

94
hole-doped surface was fabricated in the same way as described in section 3.2.2. Using
AFM (Nanocute, SII Co. Ltd.) equipped with an ARTCAM-300MI-HHS-WOM unit
(ARTRAY Co. Ltd.), the conductivity of the hole-doped surface was measured. The
method for the measurement is described in Fig. 3.3.6. At first, a F4TCNQ single crystal
was contacted on the surface of a K-TCNQ crystal, and then it was removed after about
15 minutes. Since the F4TCNQ single crystal is smaller than the K-TCNQ, both the
as-grown surface and the hole-doped surface can be observed, and the boundary is
easily distinguished. Crossing the boundary, the current was measured. The applied
voltage was 0.01V.
3.2.6. Electrical conductivity measurement at high temperature
To investigate the effects of the hole-doping on the structural phase transition, the
sheet resistance was measured in the high temperature region of 300-420 K using a
home-made thermostat system along the TCNQ stacking direction in a hole-doped
crystal surface using a two-probe method. Gold paste (Tokuriki Chemical Research Co.
Ltd.) was used to connect two gold wires (ɸ = 20 μm) at opposite ends of a plate crystal
surface.
3.2.7. Current-Voltage characteristics measurement at low temperature region
To investigate the effects of the hole-doping on the negative differential resistance
characteristics, the current-voltage (I-V) characteristics were measured with a load
resistor of 2 MW connected in series with KEITHLEY 6487 PICOAMMETER /
VOLTAGE SOURCE as a voltage source and a current detector along the TCNQ
stacking direction in a hole-doped crystal surface using a two-probe method at 300 K,

95
260 K, 240 K, respectively in a closed cycle cryostat system. Gold paste (Tokuriki
Chemical Research Co. Ltd.) was used to connect two gold wires (ɸ = 20 μm) at
opposite ends of a plate crystal surface.
3.3. Results and discussion
3.3.1. Phenomena observed by the contact doping
The results of the conductivity measurement performed as described in 3.2.2 are
shown in Figure 3.3.1.
Figure 3.3.1. The current measurement of the K-TCNQ surface before and after the F4TCNQ powder contact.
Before F4TCNQ contact
After F4TCNQ contact

96
Figure 3.3.2. The time dependence of the current of the K-TCNQ surface after the F4TCNQ contact.
After the F4TCNQ powder contact, the sheet resistance of the K-TCNQ surface
became one order of magnitude smaller than that of the as-grown K-TCNQ. Thus, the
increase of the conductivity by the F4TCNQ powder contact was confirmed. Keeping
the powder of F4TCNQ contacted on the surface of K-TCNQ, the time-dependence of
the current was measured at 313 K, applying 1 V. The results are shown in Figure 3.3.2.
Soon after the conjugation of the F4TCNQ powder, the current of the interface got
rapidly increased, and then gradually increased. As described in 3.1.1, when the
acceptor is contacted, in some cases the complex with the contacted acceptor is formed
at the interface, while in other cases is not. If the complex with the contacted acceptor
was not formed, the current would increase instantly because it would not take any time
for the carrier injection. Figure 3.3.2 indicates that the current increase requires a certain
period of time, suggesting the complex formation. Therefore, in this case it is

97
considered that a new complex is generated on the K-TCNQ surface. In addition, the
current was not decreased after the F4TCNQ powder was removed. This also supports
the complex formation.
Figure 3.3.3. The IR spectra of TCNQ0, F4TCNQ0, K-TCNQ, the mixture of the K-TCNQ and F4TCNQ, and K-F4TCNQ.
The complex formation was confirmed by measuring the IR spectra. Figure 3.3.3
shows five spectra of neutral TCNQ, neutral F4TCNQ, K-TCNQ, the mixture of
K-TCNQ and F4TCNQ, which corresponds to F4TCNQ-contacted K-TCNQ, and
synthesized K-F4TCNQ. For TCNQ and F4TCNQ, the CN stretching vibrational peak is
located around 2200 cm-1, and the position shifts depending on the charge of molecule
[7, 8]. Thus, the spectra around 2200 cm-1 were focused on. For the spectrum of the
mixture of K-TCNQ and F4TCNQ, a new peak appears at ca. 2215 cm-1, which is
different from either that of K-TCNQ or that of neutral F4TCNQ. Since this peak was
found to be identical with that of K-F4TCNQ, it was confirmed that the hole-doping to
K-TCNQ by contacting F4TCNQ accompanied by the formation of K-F4TCNQ.

98
Figure 3.3.4. The SEM images of the K-TCNQ surface; (a) before the F4TCNQ contact, (b) after the F4TCNQ contact.
The SEM images of the surface state of the K-TCNQ were obtained before and
after the F4TCNQ powder contact, as shown in Figure 3.3.4. The left image is before
F4TCNQ contact, and the right one is after the F4TCNQ powder contact. For the latter,
fine crystals exist with random orientations. Among these crystals K-F4TCNQ must be
included, but the crystals of neutral F4TCNQ may co-exist, which could not be
completely removed by an air duster. Taking a closer look at the K-TCNQ crystal
surface of the right image, lines along the specific direction can be seen. This direction
corresponds to the TCNQ stacking direction. One possible explanation of the formation
of the aligned needle crystals on the surface of K-TCNQ is that K-F4TCNQ is formed
along the TCNQ stacking direction.
Based on the above data, the mechanism of the hole-doping can be described as
Figure. 3.3.5. The hole-doping occurs by means of the electron transport from TCNQ-1
to neutral F4TCNQ. As a result, hole doped TCNQ anion turns neutral. In this region K+
lose their counterpart and then are pulled toward F4TCNQ- at the surface of the
(b)
(a) (b)

K-TCNQ, leading to the formation of K
Figure 3.3.5. The mechanism of the holeF4TCNQ for TCNQ-1. (b) As a result of generated. (c) K+ is extracted to the surface, leading to the formation of K
3.3.2. The charge transport mechanism by
Secondly, let us consider about
contact. For F4TCNQ contacted K
“K-F4TCNQ formed on the K
Since when K-F4TCNQ was prepared individually
(a)
(b)
(c)
99
TCNQ, leading to the formation of K-F4TCNQ (Figure 3.3.5).
mechanism of the hole-doping for K-TCNQ. (a) The hole. (b) As a result of hole-doping, TCNQ0 and F
is extracted to the surface, leading to the formation of K
The charge transport mechanism by the contact doping
Secondly, let us consider about the enhancement of the conductivity
TCNQ contacted K-TCNQ surface, the path of the current
TCNQ formed on the K-TCNQ surface” or “Charge-doped K-TCNQ surface
TCNQ was prepared individually the crystallinity of K
(a) The hole-doping by and F4TCNQ-1 are
is extracted to the surface, leading to the formation of K-F4TCNQ.
ment of the conductivity by F4TCNQ
TCNQ surface, the path of the current can be
TCNQ surface”.
the crystallinity of K-F4TCNQ was
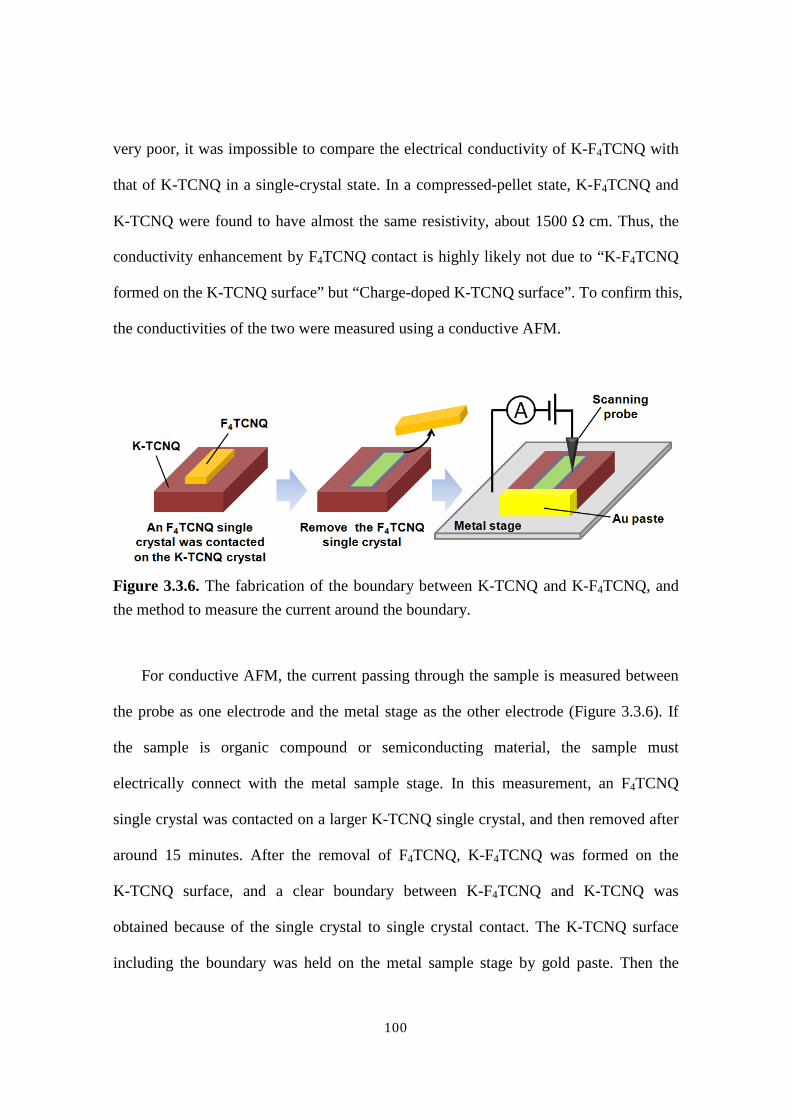
100
very poor, it was impossible to compare the electrical conductivity of K-F4TCNQ with
that of K-TCNQ in a single-crystal state. In a compressed-pellet state, K-F4TCNQ and
K-TCNQ were found to have almost the same resistivity, about 1500 W cm. Thus, the
conductivity enhancement by F4TCNQ contact is highly likely not due to “K-F4TCNQ
formed on the K-TCNQ surface” but “Charge-doped K-TCNQ surface”. To confirm this,
the conductivities of the two were measured using a conductive AFM.
Figure 3.3.6. The fabrication of the boundary between K-TCNQ and K-F4TCNQ, and the method to measure the current around the boundary.
For conductive AFM, the current passing through the sample is measured between
the probe as one electrode and the metal stage as the other electrode (Figure 3.3.6). If
the sample is organic compound or semiconducting material, the sample must
electrically connect with the metal sample stage. In this measurement, an F4TCNQ
single crystal was contacted on a larger K-TCNQ single crystal, and then removed after
around 15 minutes. After the removal of F4TCNQ, K-F4TCNQ was formed on the
K-TCNQ surface, and a clear boundary between K-F4TCNQ and K-TCNQ was
obtained because of the single crystal to single crystal contact. The K-TCNQ surface
including the boundary was held on the metal sample stage by gold paste. Then the

101
surface current was measured from the K-F4TCNQ region to K-TCNQ region, across
the boundary. The applied voltage was 0.01 V.
Figure 3.3.7. The AFM images of the height and the current across the boundary between K-F4TCNQ and K-TCNQ (described as a white line in the current image).
The results of the measurements are shown in Fig. 3.3.7. The left image represents
the height, in which brighter region is higher region. The higher region and the lower
region are obviously separated by the boundary, thus the former is considered to
correspond to the newly formed K-F4TCNQ crystals and the latter corresponds to the
flat as-grown K-TCNQ surface. The right image represents the amount of current
passing between the probe and the Au paste through the surface of the sample, in which
brighter region represents higher current region. According to this image, it is clear that
the current did not flow in the K-F4TCNQ region, but flow mainly at the boundary. The
increased current at the boundary is also described in the graph below, in which the

102
height and the current along the white lines in the images are plotted across the
boundary. From these data, “Charge-doped K-TCNQ surface” is proved to be the path
of the current.
3.3.3. Effects on the phase transition by the contact doping
On the charge-doped K-TCNQ surface, not only the conductivity but also the
original physical properties can be modified. As described in 3.1.2, K-TCNQ has
structural phase transition at 395 K, and shows the negative differential resistance
characteristics in the low temperature region. Therefore, the corresponding physical
properties were investigated in this study.
First of all, the effect of the hole-doping for the structural phase transition is
discussed. The hole-doping by F4TCNQ contact is performed only on the surface of
K-TCNQ. Thus it is impossible to compare the hole-doped crystal structure with the
as-grown. An alternative method is required to estimate the hole-doping effect. For
as-grown K-TCNQ, the overlap integral between LUMOs of TCNQ in low temperature
region is different from that in high temperature region. This difference corresponds to
the change of the band gap between the valence band and the conduction band, i.e. the
change of the activation energy for conduction. The activation energy can be calculated
from the slope of the plot of ln R vs. 1 / T [8]. Therefore it is expected that the slope of
the plot will be different between low temperature region and high temperature region.
If the overlap integrals in the TCNQ column change at the transition point, it can be
detected by the resistivity or sheet resistance measurement. Thus the temperature
dependence of the sheet resistance was measured for the F4TCNQ contacted K-TCNQ
surface and as-grown K-TCNQ surface.

103
Figure 3.3.8. The sheet resistance of the K-TCNQ surface before and after the F4TCNQ contact.
The results of the measurements are shown in Figure 3.3.8. For the surface of
as-grown K-TCNQ, a peak was found at 395 K, and the slope of the plot changed at the
peak. This clearly reflects the change of the band gap at the structural phase transition
point. On the other hand, for the surface of K-TCNQ after the contact of F4TCNQ, the
peak which existed before F4TCNQ contact disappeared, and the slope became constant.
Based on these data, it is considered that the structural phase transition does not occur
for the hole-doped surface.
The reason for the extinction of the phase transition will be discussed using the spin
model of the TCNQ column. For as-grown TCNQ, the structural phase transition from a
dimerized TCNQ structure to a uniform one occurs due to that the lattice vibration
energy exceeds the on-site Coulomb repulsion energy by increasing temperature [9].
395 K

104
From the opposite point of view, i.e. if the structural phase transition is considered to be
from the high temperature to low temperature, the lattice changes because of the
transformation of TCNQ column from a uniform structure to a dimerized one. In this
case, the energy gain for the spin dimerization exceeds the energy loss for the lattice
transformation, leading to the structural phase transition. This type of phase transition is
called spin-Peierls transition [10]. The hole-doping by the F4TCNQ contact is
performed for the low temperature phase, in which the TCNQ column dimerizes. Under
such conditions, some TCNQ anions change to neutral, which may become a kink in the
dimerized lattice. The neutral TCNQ at the kink can receive an electron from the
adjacent TCNQ anion dimer, and in that case the position of the neutral TCNQ and the
TCNQ anion will turn around. Providing this phenomenon continuously occurs, the
neutral TCNQ can be regarded as a soliton [11], which is propagated through the TCNQ
column, as described in Fig. 3.3.9. As a result, the lattice elastic energy gained by
transformation to the uniform column is considered to be no longer dominant, thus the
structural phase transition to the uniform column will not occur.

105
Figure 3.3.9. The effects of the hole-doping for the TCNQ column in K-TCNQ.

106
3.3.4. Effects on the current-voltage characteristics by the contact doping
Secondly, the effects of the hole-doping for the current-voltage characteristics at the
low temperature region will be discussed. The results of the current-voltage
measurements before and after the F4TCNQ contact are shown in Fig. 3.3.10. For these
two graphs, the same color indicates the results of the measurements at the identical
temperature. Compared with the as-grown K-TCNQ, the negative differential resistance
characteristics appear at the lower applying voltage after the F4TCNQ contact.
Figure 3.3.10. The negative differential resistance characteristics of the K-TCNQ surface before and after the F4TCNQ contact.
This phenomenon will be discussed with the spin model of the TCNQ column, in
the same way as the discussion about the conducting behavior at the high temperature
region (Figure 3.3.11). At the low temperature region, TCNQ column is dimerized and
each TCNQ molecule possesses one spin before the hole-doping. The negative
differential resistance characteristics of the K-TCNQ can be explained as a result of
Before the F4TCNQ contact After the F4TCNQ contact
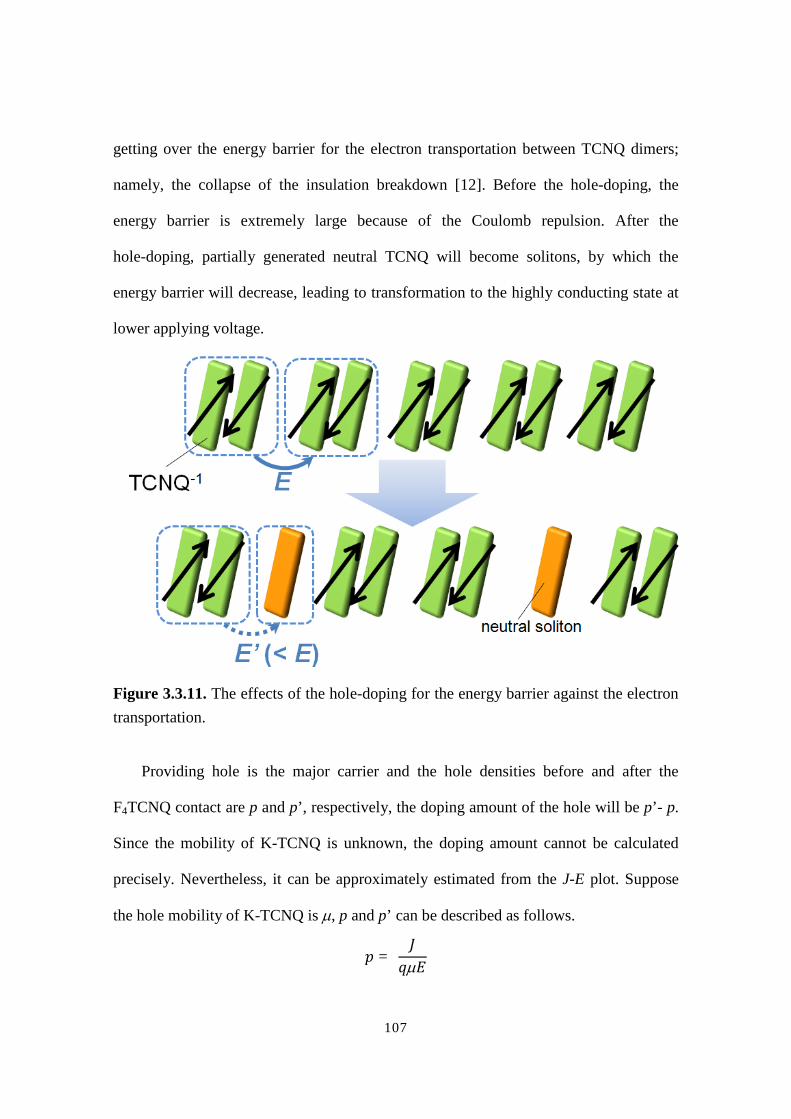
107
getting over the energy barrier for the electron transportation between TCNQ dimers;
namely, the collapse of the insulation breakdown [12]. Before the hole-doping, the
energy barrier is extremely large because of the Coulomb repulsion. After the
hole-doping, partially generated neutral TCNQ will become solitons, by which the
energy barrier will decrease, leading to transformation to the highly conducting state at
lower applying voltage.
Figure 3.3.11. The effects of the hole-doping for the energy barrier against the electron transportation.
Providing hole is the major carrier and the hole densities before and after the
F4TCNQ contact are p and p’, respectively, the doping amount of the hole will be p’- p.
Since the mobility of K-TCNQ is unknown, the doping amount cannot be calculated
precisely. Nevertheless, it can be approximately estimated from the J-E plot. Suppose
the hole mobility of K-TCNQ is m, p and p’ can be described as follows. = m

108
’ = ’ m ’
where J and E are the current density and the electric field before the F4TCNQ contact,
and J’ and E’ are the current density and the electric field after the F4TCNQ contact [14].
Therefore, the doping amount of the hole can be described as follows. ’ − = 1m
( ’ ’ − )
Considering only the linear part of individual J-E plot, J/E and J’/E’ corresponds to the
slope of the plot (s), and the values were 9.36×10⁻⁶ and 4.26×10⁻⁵ S cm-1, respectively.
From these calculations, the doping amount of the hole is 11.602 × 10 × m(4.26 × 10 − 9.36 × 10 ) = 2.07 × 10
m(cm ).
For K-TCNQ, the electron density is the same as the number of TCNQ anions per 1 cm3,
and the value is 3.56×1021 cm-3. If one assume m = 1.0 cm2 V-1 s-1, the doping level is
estimated to be 5.8×10⁻⁶ %.
3.4. Summary and conclusion
As a method for modifying the electric conductivity by changing the electronic
structure of the organic material with already-known crystal structure, the contact
doping is novel, simple, and effective for the carrier injection. In this study, the
hole-doping for the TCNQ anion radical salt, K-TCNQ, was performed by F4TCNQ
contact. As a result, the sheet resistance of the surface of K-TCNQ decreased one order.
From the SEM image and the IR spectra, K-F4TCNQ was found to generate on the
surface of K-TCNQ after the F4TCNQ contact. On the basis of these results, the
mechanism of the hole-doping was discussed. There existed two candidates for the
current path; carrier doped K-TCNQ surface and K-F4TCNQ generated on the contact
interface. According to the conductive AFM data, current did not flow through the

109
K-F4TCNQ, but through the surface of the carrier doped K-TCNQ.
Originally K-TCNQ has characteristic physical properties; the structural phase
transition from band insulator to Mott insulator at 395 K, and the negative differential
resistance characteristics in the low temperature region. The hole-doping by F4TCNQ
contact also affected these physical properties. On the hole-doped surface of K-TCNQ,
the structural phase transition did not occur and the negative differential resistance
characteristics appeared with lower applying voltage. This is because the neutral TCNQ
molecules generated in the K-TCNQ surface after the hole-doping behave as solitons,
through which the electron transportation becomes feasible. As described above, both
the hole-doping for the two-component ionic system and the carrier doping for the
crystal with segregated stack structure were accomplished for the first time, and then the
modification of the electron transporting property at the contact interface after the
hole-doping was discussed in detail.

110
References
[1] Alves, H.; Molinari, A. S.; Xie. H.; Morpurgo. A. F. Nature mater, 2008, 7,
574-580.
[2] Takahashi, Y.; Hayakawa, K.; Naito, T.; Inabe, T. J. Phys. Chem. C, 2012, 116,
700-703.
[3] Takahashi, Y.; Hayakawa, K.; Takayama, K.; Yokokura, S.; Harada, J.; Hasegawa,
H.; Inabe, T. Chem. Mater, 2014, 26, 993-998.
[4] Takahashi, Y.; Nakagawa, Y.; Hayakawa, K.; Inabe, T.; Naito, T. Appl. Phys. Lett,
2012, 101, 103303.
[5] Konno, M.; Ishii, T.; Saito, Y. Acta Crystallogr, 1977, B33, 763-780.
[6] Kumai, R.; Okimoto, Y., Tokura, Y. Science, 1999, 284, 1645-1647.
[7] Okamoto, H.; Tokura, Y.; Koda, T. Phys. Rev. B, 1987, 36, 3858-3867.
[8] Chappell, J. S.; Bloch, A. N.; Bryden, W. A.; Maxfield, M.; Poehler, T. O.; Cowan,
D.O. J. Am. Chem. Soc, 1981, 103, 2442-2443.
[9] Yasuzuka, S.; Murata, K.; Arimoto, T.; Kato, R.J. Phys. Soc. Jpn, 2007, 76, 033701
(1-4).
[10] Itoh, K.; Itoh, H.; Naka, M.; Saito, S.; Hosako, I.; Yoneyama, N.; Ishihara, S.;
Sasaki, T.; Iwai, S.Phys. Rev. Lett, 2013, 110, 106401 (1-5).
[11] Hase, M.; Terasaki, I.; Uchinokura, K. Phys. Rev. Lett, 1993, 70, 3651-3654.
[12] Ikezi, H.; Taylor, R. J.; Baker, D. R.Phys. Rev. Lett, 1970, 25, 11-14.
[13] Sze, S.M. Semiconductor Devices, Physics and Technology, 2nd ed., John Wiley &
Sons, Inc., New York, 2002; 117-124.
[14] Sze, S.M. Semiconductor Devices, Physics and Technology, 2nd ed., John Wiley &
Sons, Inc., New York, 2002; 53-54.

111
Chapter 4.Overall summary and concluding remarks
In this study, controlling the electronic structure of the TCNQ anion radical salts
was performed by two different approaches. One was the structural approach by
modifying the size of the component, and the other was the electronic structure control
by carrier injection. For the former, in Chapter 1, it was stated that the relative size of
the components was considered to give some influence on the stoichiometry for
two-component system. Thus, a series of the crystals in which the size of the
components was systematically tunable was subjected to the study. As the candidate,
TCNQ anion radical salts with dication components were selected. For the second
approach, as mentioned in Chapter 1, the injection barrier, which has been the problem
for the conventional carrier doping was pointed out. As an alternating method, the
contact doping was proposed for the carrier doping. TCNQ Anion radical salts were
again selected candidate as the object of the study.
Of the two approaches mentioned above, the former was described in Chapter 2.
Initially, the features and the validity of the designed dications were explained. The
variation of the stoichiometries and the degree of the overlap integrals of the TCNQ
columns by the systematical size change of the dications were investigated and
discussed. The stoichiometry was found to be changed from the more favorable 1:4 to
an alternative 1:3 depending on the size of the dication. To explain the change of the
stoichiometry, the concept of the “effective dication length” was proposed. Namely, a
certain range of the effective dication length existed to form the stoichiometry of 1:4. In
the case of too large or too small dication, the stoichiometry could change from 1:4 to
1:3.

112
Focusing on the dication-TCNQ salts with the same 1:4 stoichiometry, the more
disadvantageous conformation of the dication occurred when the salts contained the
larger dication, leading to the more obvious distortion of the TCNQ column. The
diversity of the multimerization of the TCNQ columns was reflected in the magnetic
behaviors. On the other hand, the decrease of the dication size induced the change of the
stoichiometry (to 1:3) and the inclusion of the solvent. For the solvent-included salt,
(C1BPy)(TCNQ)4CH3CN, the distortion of the TCNQ column was not obvious owing
to its small dication size, resulting in the highest conductivity in this series. For more
increase of the conductivity, a more uniform and a greater magnitude of overlap in the
TCNQ column were required, thus the dication with more rigid alkyl chain was
proposed for future works.
In Chapter 3, the contact doping was performed as a novel approach for the
modification of the conductivity of the organic crystals. First of all, the concept and the
previous studies of the contact doping were described, and then the possibility of the
hole-doping for the two-component system and the carrier doping for the segregated
structure, which has not been demonstrated, were discussed. To attain both of them, the
hole-doping for K-TCNQ by contacting F4TCNQ was carried out.
As a result, the increase of the conductivity was observed on the K-TCNQ crystal
surface after the F4TCNQ contact. In this case, both the carrier injection and the
complex-formation occurred, and the carrier injected K-TCNQ surface was proved to be
the conduction path from the conductive AFM image. Therefore, the hole-doping was
confirmed and its mechanism can be elucidated. Owing to this hole-doping, some
TCNQ anions changed to neutral TCNQ molecules. The neutral TCNQ molecules were
considered to propagate through the TCNQ columns as solitons, causing the extinction

113
of the structural phase transition and the negative differential resistance characteristics
at the lower applying voltage. At the present stage, the doping amount was not clarified,
and no strategy of the control of the doping level was proposed. If the doping level
could be systematically controlled in future, the electronic functionality of organic
materials would be more valuable and more widely applicable.
Overall, the modification of the electronic properties of TCNQ anion radical salts
was achieved by the structural design and the carrier doping. Thus TCNQ anion radical
salts can be regarded as good objects of organic electronics and can be applied for a
variety of research.