inventory vehicle routing
DESCRIPTION
Inventory Vehicle Routing. Adapted from…. Ann Campbell Lloyd Clarke Martin Savelsbergh Industrial & Systems Engineering Georgia Institute of Technology. Vehicle Routing Decisions. Based on customers’ orders Which plant serves each customer Which vehicle makes the delivery - PowerPoint PPT PresentationTRANSCRIPT

Inventory Vehicle Routing
Adapted from….Ann CampbellLloyd ClarkeMartin Savelsbergh
Industrial & Systems EngineeringGeorgia Institute of Technology

Vehicle Routing Decisions
Based on customers’ ordersWhich plant serves each customerWhich vehicle makes the deliveryWhat route the vehicle travels?

Vendor Managed Inventory
Customers do not place ordersVendor monitors customers’ use of
productVendor controls customers’
inventory Determines when to deliver Determines how much to deliver

4
Advantages
For vendor more opportunities for savings however, problem becomes more
difficultFor customer
one less worry if you trust your vendor

OHIO
MICHIGANLAKE ERIEDetroit
Cleveland
Conventional Inventory Management -- Day 1

OHIO
MICHIGANLAKE ERIEDetroit
Cleveland
Conventional Inventory Management -- Day 2

7
Vendor Managed InventoryCustomer
trusts the vendor to manage the inventory
Vendor monitors customers’
inventorycustomers call/fax/e-mailremote telemetry unitsset levels to trigger call-in
controls inventory replenishment & decides
when to deliverhow much to deliverhow to deliver

OHIO
MICHIGANLAKE ERIEDetroit
Cleveland
Vendor Managed Inventory -- Day 1

OHIO
MICHIGANLAKE ERIEDetroit
Cleveland
Vendor Managed Inventory -- Day 2

Inventory Routing
Chemical Industry air products distribution
Petrochemical industry gas stations
Automotive Industry parts distribution
11
Praxair’s Business
Not an airline!
Air products “harvest the sky”
produce nitrogen, oxygen, argon, hydrogen, helium, etc.
OxygenOxygen
NitrogenNitrogen
ArgonArgon

12
Praxair’s Business Plants worldwide
44 countries
USA 70 plants
South America 20 plants
Product classes packaged products
bulk products
lease manufacturing equipment
Distribution 1/3 of total cost attributed to
distribution

13
Praxair’s BusinessBulk products
Distribution 750 tanker trucks
100 rail cars
1,100 drivers
drive 80 million miles per year
Customers 45,000 deliveries/month to 10,000 customers
Variation 4 deliveries/customer/day to
1 delivery/customer/2 months
Routing varies from day to day

14
VMI Implementation at Praxair
Convince management and employees of new methods of doing business
Convince customers to trust vendor to do inventory management
Pressure on vendor to perform - Trust easily shaken
Praxair currently manages 80% of bulk customers’ inventories
Demonstrate benefits

15
VMI Implementation at Praxair
Praxair receives inventory level data via telephone calls: 1,000 per day fax: 500 per day remote telemetry units: 5,000 per day
Forecast customer demands based on historical data customer production schedules customer exceptional use events
Logistics planners use decision support tools to plan whom to deliver to when to deliver how to combine deliveries into routes how to combine routes into driver schedules

16
Benefits of VMI at Praxair
Before VMI, 96% of stockouts due to customers calling when tank was already empty or nearly empty
VMI reduced customer stockouts
0
5
10
Ja
n
Ma
r
Ma
y
Ju
ly
Se
pt
No
vafter 2 yrs
17
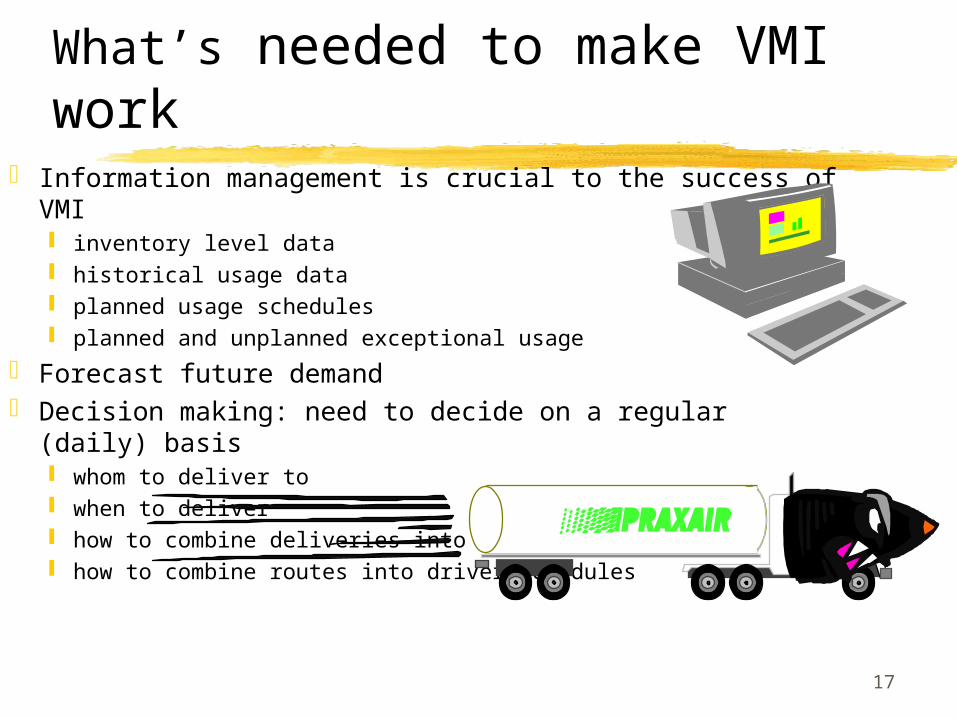
What’s needed to make VMI work
Information management is crucial to the success of VMI inventory level data historical usage data planned usage schedules planned and unplanned exceptional usage
Forecast future demand Decision making: need to decide on a regular (daily)
basis whom to deliver to when to deliver how to combine deliveries into routes how to combine routes into driver schedules

18
Separately stock each customer
The every d-day policyp(j) = probability a stock out first occurs on
day jDoes this make sense?p = p(1) + p(2) + … + p(d-1) The
probability of stock outS = cost to serve in case of stock out
(expedited service)c = cost to serve otherwise

19
How often to serve?
Average daily cost of d-day policypS + (1-p)c
p(1) + 2p(2) + … dp(d)
p(d) = 1-p

20
Average Cost per Day40.000
20.769
14.386
11.216
9.333
8.0957.227
6.591 6.111 5.742 5.455 5.230 5.055 4.921 4.821 4.750 4.706 4.689 4.714 4.686
-
5.000
10.000
15.000
20.000
25.000
30.000
35.000
40.000
1 2 3 4 5 6 7 8 9 10 11 12 13 14 15 16 17 18 19 20
Days between deliveries

Example I
Delivery vehicle capacity - 1200 m3
Customer A capacity 1500 m3
usage 12 m3/hr delivery every 100 hrs (~4 days)
Customer B capacity 800 m3
usage 8 m3/hr delivery every 100 hrs (~4 days)

Example I
300 hour periodChoices:
deliver customers separately
deliver customers together
depot
A B5 miles
10 miles
10 miles
Example I
Combined customer usage 20 m3/hr delivery every 60 hr (~2.5 days)

Example I
300 hour periodCustomers separate
3 deliveries each customer
60 miles each customer 120 miles total
Customers combined 5 deliveries total 25 miles each delivery 125 miles total
depot
A B5 miles
10 miles
10 miles

Example I
300 hour periodChoices:
deliver customers separately
deliver customers together
depot
A B2 miles
10 miles
10 miles
26
Long Term Objectives
Avoid outagesMinimize transportation costsPerformance measures
$/mile $/volume volume/mile outage/delivery

Short Term Decisions
Today, deliver to customers that need a delivery
Tomorrow, may not have enough capacity

Short Term Decisions
Today, deliver to customers in needAlso, deliver to anyone near by and
“top-off” the customer’s inventory space

Using Customer Information
Reactive Approach Customer inventory space Customer current inventory
Proactive Approach Customer usage rate