investor presentation
TRANSCRIPT
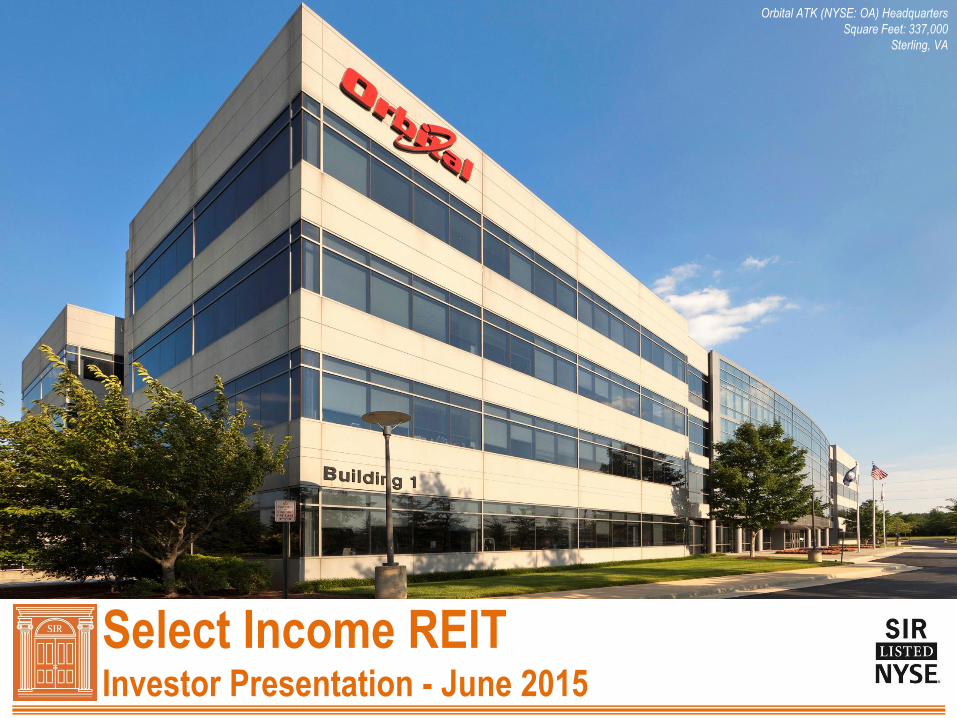
Select Income REIT Investor Presentation - June 2015
Orbital ATK (NYSE: OA) Headquarters
Square Feet: 337,000
Sterling, VA
Select Income REIT
Disclaimer.
2
THIS PRESENTATION CONTAINS FORWARD LOOKING STATEMENTS WITHIN THE MEANING OF THE PRIVATE SECURITIES
LITIGATION REFORM ACT OF 1995 AND OTHER SECURITIES LAWS. ALSO, WHENEVER WE USE WORDS SUCH AS "BELIEVE,"
"EXPECT," "ANTICIPATE," "INTEND," "PLAN," "ESTIMATE," OR SIMILAR EXPRESSIONS, WE ARE MAKING FORWARD LOOKING
STATEMENTS. THESE FORWARD LOOKING STATEMENTS ARE BASED UPON OUR PRESENT INTENT, BELIEFS OR
EXPECTATIONS. FORWARD LOOKING STATEMENTS ARE NOT GUARANTEED TO OCCUR AND MAY NOT OCCUR. ACTUAL
RESULTS MAY DIFFER MATERIALLY FROM THOSE CONTAINED IN OR IMPLIED BY OUR FORWARD LOOKING STATEMENTS AS A
RESULT OF VARIOUS FACTORS, WHICH INCLUDE THOSE THAT ARE DETAILED IN OUR FORM 10-K FOR THE YEAR ENDED
DECEMBER 31, 2014 AND SUBSEQUENT FILINGS WITH THE SECURITIES AND EXCHANGE COMMISSION. YOU SHOULD NOT
PLACE UNDUE RELIANCE UPON ANY FORWARD LOOKING STATEMENT. EXCEPT AS REQUIRED BY APPLICABLE LAW, WE
UNDERTAKE NO OBLIGATION TO UPDATE OR REVISE ANY FORWARD LOOKING STATEMENT AS A RESULT OF NEW
INFORMATION, FUTURE EVENTS OR OTHERWISE.
WE COMPUTE ADJUSTED EARNINGS BEFORE INTEREST, TAX, DEPRECIATION AND AMORTIZATION, OR ADJUSTED EBITDA, AS
NET INCOME PLUS INTEREST EXPENSE, TAXES AND DEPRECIATION AND AMORTIZATION. WE ADJUST FOR ACQUISITION
RELATED COSTS, GAIN OR LOSS ON SALE OF PROPERTIES, GAIN OR LOSS ON EARLY EXTINGUISHMENT OF DEBT, GENERAL
AND ADMINISTRATIVE EXPENSES PAID IN COMMON SHARES, AND IMPAIRMENT OF ASSETS, IF ANY.
FFO IS CALCULATED ON THE BASIS DEFINED BY THE NATIONAL ASSOCIATION OF REAL ESTATE INVESTMENT TRUSTS, OR
NAREIT, WHICH IS NET INCOME, CALCULATED IN ACCORDANCE WITH GAAP, PLUS REAL ESTATE DEPRECIATION AND
AMORTIZATION AND THE DIFFERENCE BETWEEN NET INCOME AND FFO ALLOCATED TO NONCONTROLLING INTEREST, AS
WELL AS CERTAIN OTHER ADJUSTMENTS CURRENTLY NOT APPLICABLE TO US. OUR CALCULATION OF NORMALIZED FFO
DIFFERS FROM NAREIT’S DEFINITION OF FFO BECAUSE WE INCLUDE ESTIMATED BUSINESS MANAGEMENT INCENTIVE FEES,
IF ANY, ONLY IN THE FOURTH QUARTER VERSUS THE QUARTER THEY ARE RECOGNIZED AS EXPENSE IN ACCORDANCE WITH
GAAP AND WE EXCLUDE ACQUISITION RELATED COSTS, GAINS AND LOSSES ON EARLY EXTINGUISHMENT OF DEBT AND
NORMALIZED FFO FROM NONCONTROLLING INTEREST.
Note: Unless otherwise noted, data is presented as of March 31, 2015.

Select Income REIT
OVERVIEW
3
Select Income REIT
Why invest in SIR?
4
• Best-in-class single tenant net lease office and industrial assets.
• High occupancy, long term leases, strong tenant base.
• Solid organic cash flow growth.
• Strong credit profile, disciplined balance sheet management.
• Compelling entry point with a conservative dividend payout ratio and
yield exceeding 8%(1).
(1) As of close of market on June 1, 2015.
Select Income REIT
Business Strategy
To create secure and growing cash flows by:
• Acquiring and owning high quality U.S. mainland office and industrial properties that are net
leased to single tenants; and
• Increasing cash flows organically through mainland rent bumps as well as Hawaii rent resets and
new/renewal leasing.
Recent Accomplishments
• Earned investment grade ratings from Moody’s (Baa2) and S&P (BBB-) with stable outlooks.
• Enhanced all key metrics through the accretive acquisition of Cole Corporate Income Trust
(CCIT).
• Issued $1.45 billion of well laddered (3, 5, 7, 10 year) inaugural senior unsecured notes,
substantially reducing SIR’s percentage of floating rate debt.
• Extended maturities and lowered interest rate margins by refinancing SIR’s unsecured revolving
credit facility and unsecured term loan.
• Grew same property cash basis NOI by more than 4% year over year for 1Q15.
Business strategy and recent accomplishments.
5
Select Income REIT
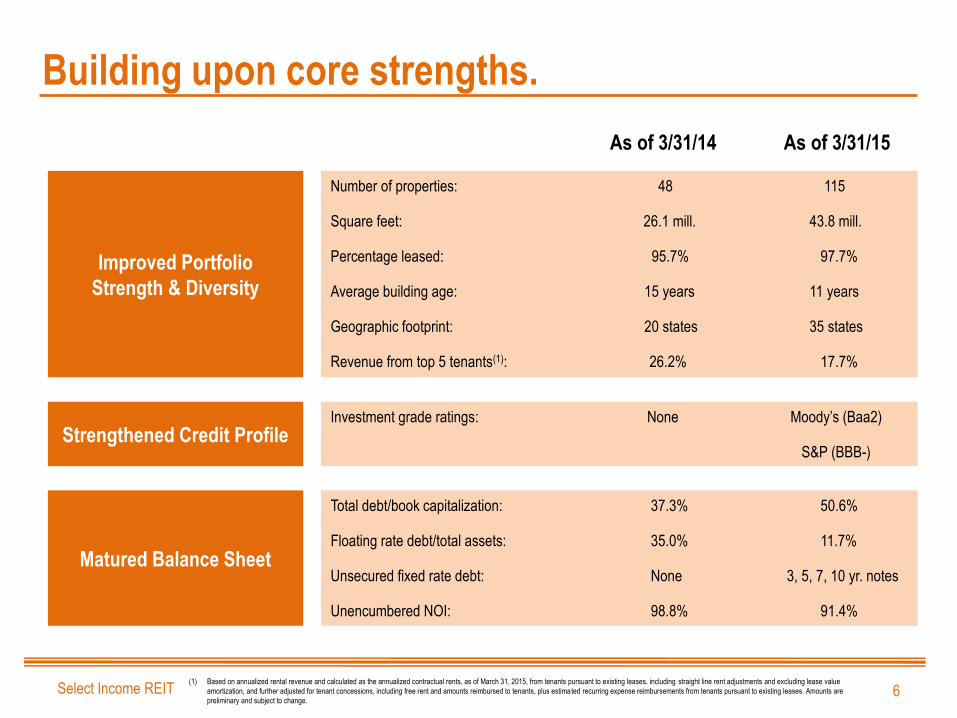
Building upon core strengths.
6
As of 3/31/14
Number of properties: 48 115
Square feet: 26.1 mill. 43.8 mill.
Percentage leased: 95.7% 97.7%
Average building age: 15 years 11 years
Geographic footprint: 20 states 35 states
Revenue from top 5 tenants(1): 26.2% 17.7%
Total debt/book capitalization: 37.3% 50.6%
Floating rate debt/total assets: 35.0% 11.7%
Unsecured fixed rate debt: None 3, 5, 7, 10 yr. notes
Unencumbered NOI: 98.8% 91.4%
Investment grade ratings: None Moody’s (Baa2)
S&P (BBB-)
As of 3/31/15
Improved Portfolio
Strength & Diversity
Strengthened Credit Profile
Matured Balance Sheet
(1) Based on annualized rental revenue and calculated as the annualized contractual rents, as of March 31, 2015, from tenants pursuant to existing leases, including straight line rent adjustments and excluding lease value
amortization, and further adjusted for tenant concessions, including free rent and amounts reimbursed to tenants, plus estimated recurring expense reimbursements from tenants pursuant to existing leases. Amounts are
preliminary and subject to change.
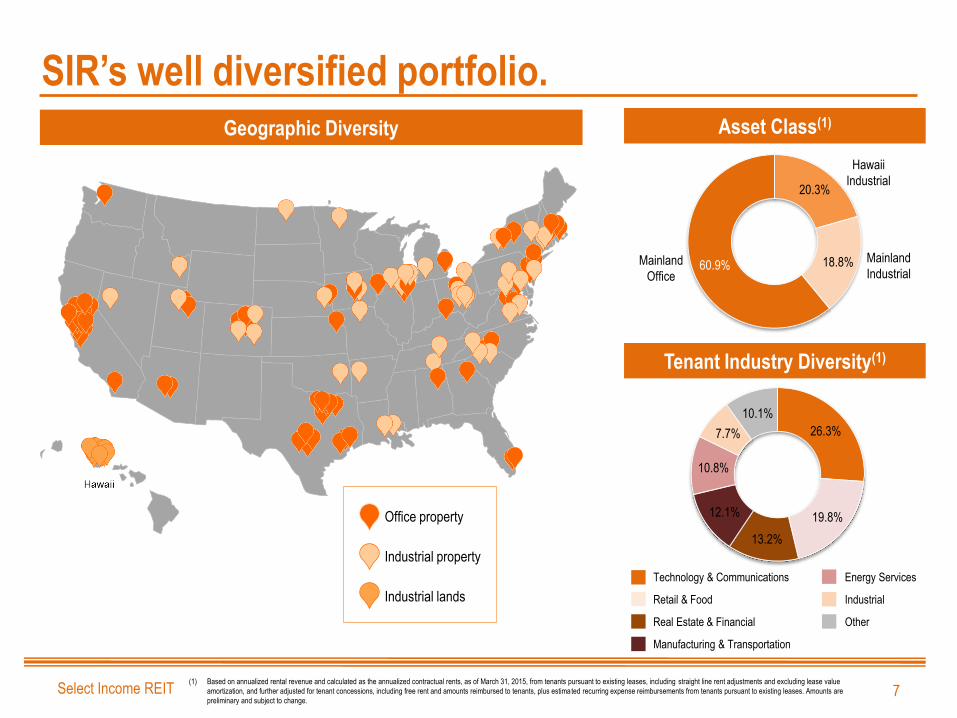
Select Income REIT
20.3%
18.8% 60.9%
26.3%
19.8%
13.2%
12.1%
10.8%
7.7%
10.1%
SIR’s well diversified portfolio.
7
Technology & Communications Energy Services
Retail & Food Industrial
Real Estate & Financial Other
Manufacturing & Transportation
Tenant Industry Diversity(1)
(1) Based on annualized rental revenue and calculated as the annualized contractual rents, as of March 31, 2015, from tenants pursuant to existing leases, including straight line rent adjustments and excluding lease value
amortization, and further adjusted for tenant concessions, including free rent and amounts reimbursed to tenants, plus estimated recurring expense reimbursements from tenants pursuant to existing leases. Amounts are
preliminary and subject to change.
Geographic Diversity
Office property
Industrial property
Industrial lands
Asset Class(1)
Mainland
Office
Mainland
Industrial
Hawaii
Industrial
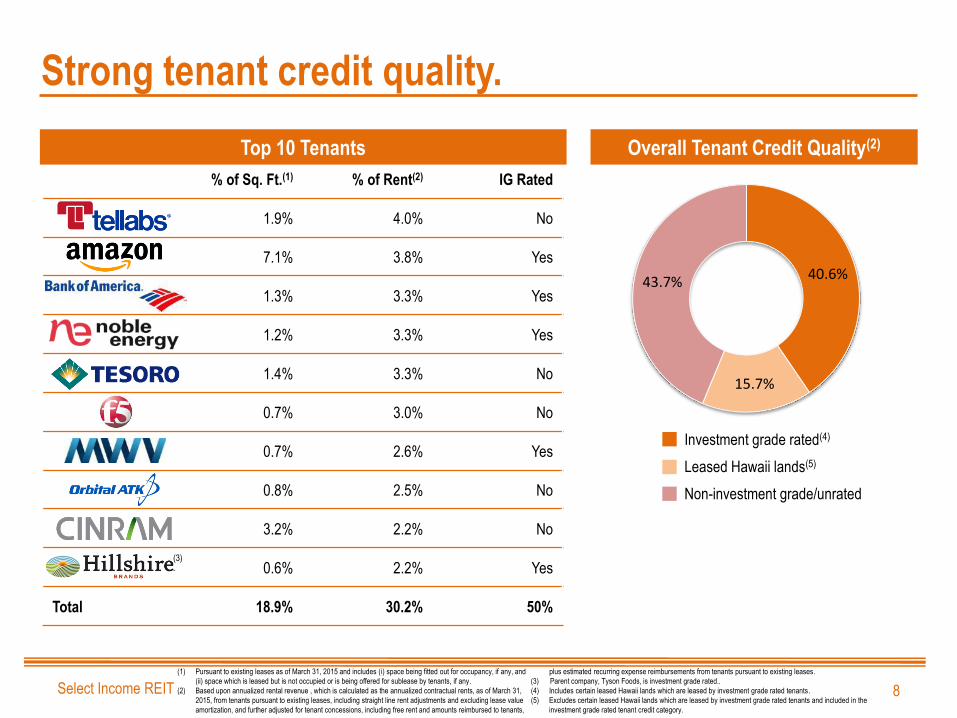
Select Income REIT
40.6%
15.7%
43.7%
% of Sq. Ft.(1) % of Rent(2) IG Rated
1.9% 4.0% No
7.1% 3.8% Yes
1.3% 3.3% Yes
1.2% 3.3% Yes
1.4% 3.3% No
0.7% 3.0% No
0.7% 2.6% Yes
0.8% 2.5% No
3.2% 2.2% No
0.6% 2.2% Yes
Total 18.9% 30.2% 50%
Strong tenant credit quality.
8
(1) Pursuant to existing leases as of March 31, 2015 and includes (i) space being fitted out for occupancy, if any, and
(ii) space which is leased but is not occupied or is being offered for sublease by tenants, if any.
(2) Based upon annualized rental revenue , which is calculated as the annualized contractual rents, as of March 31,
2015, from tenants pursuant to existing leases, including straight line rent adjustments and excluding lease value
amortization, and further adjusted for tenant concessions, including free rent and amounts reimbursed to tenants,
plus estimated recurring expense reimbursements from tenants pursuant to existing leases.
(3) Parent company, Tyson Foods, is investment grade rated..
(4) Includes certain leased Hawaii lands which are leased by investment grade rated tenants.
(5) Excludes certain leased Hawaii lands which are leased by investment grade rated tenants and included in the
investment grade rated tenant credit category.
Overall Tenant Credit Quality(2)
Investment grade rated(4)
Leased Hawaii lands(5)
Non-investment grade/unrated
Top 10 Tenants
(3)
Select Income REIT
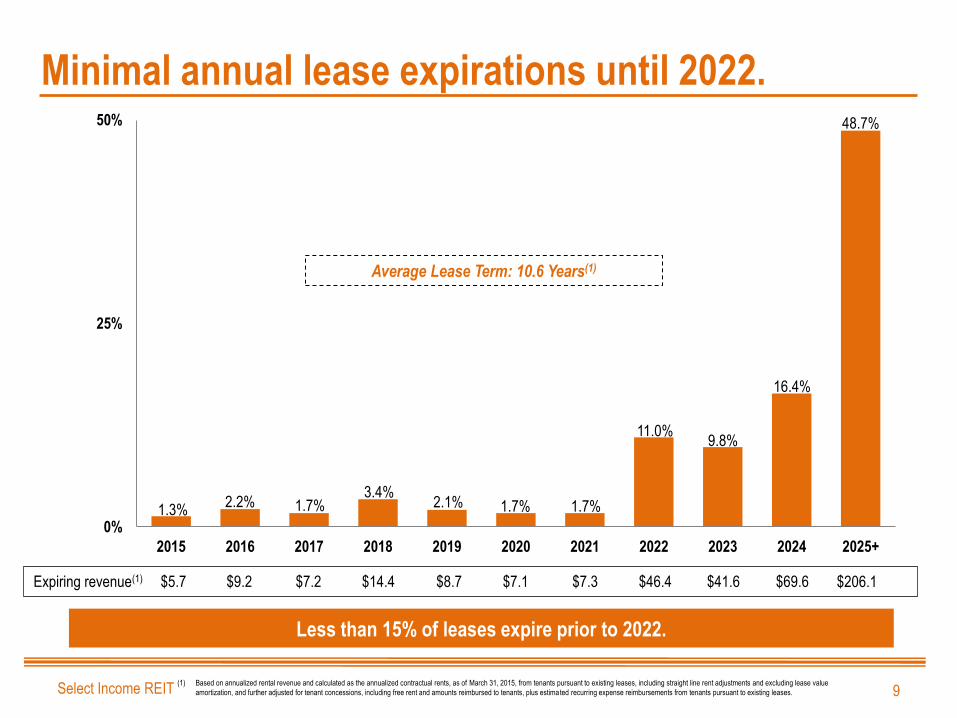
0%
25%
50%
2015 2016 2017 2018 2019 2020 2021 2022 2023 2024 2025+
Minimal annual lease expirations until 2022.
9
Average Lease Term: 10.6 Years(1)
Less than 15% of leases expire prior to 2022.
Expiring revenue(1) $5.7 $9.2 $7.2 $14.4 $8.7 $7.1 $7.3 $46.4 $41.6 $69.6 $206.1
(1) Based on annualized rental revenue and calculated as the annualized contractual rents, as of March 31, 2015, from tenants pursuant to existing leases, including straight line rent adjustments and excluding lease value
amortization, and further adjusted for tenant concessions, including free rent and amounts reimbursed to tenants, plus estimated recurring expense reimbursements from tenants pursuant to existing leases.
1.3% 2.2% 1.7%
3.4% 2.1% 1.7% 1.7%
11.0% 9.8%
16.4%
48.7%

Select Income REIT
PORTFOLIO
10
Select Income REIT
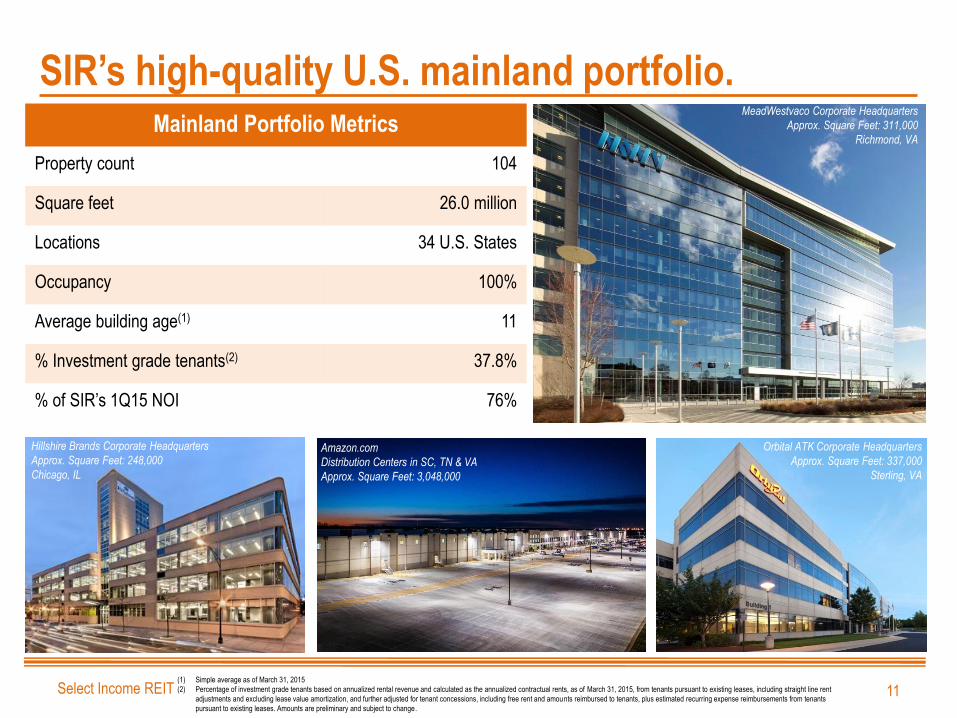
SIR’s high-quality U.S. mainland portfolio.
11
Amazon.com
Distribution Centers in SC, TN & VA
Approx. Square Feet: 3,048,000
Hillshire Brands Corporate Headquarters
Approx. Square Feet: 248,000
Chicago, IL
Orbital ATK Corporate Headquarters
Approx. Square Feet: 337,000
Sterling, VA
(1) Simple average as of March 31, 2015
(2) Percentage of investment grade tenants based on annualized rental revenue and calculated as the annualized contractual rents, as of March 31, 2015, from tenants pursuant to existing leases, including straight line rent
adjustments and excluding lease value amortization, and further adjusted for tenant concessions, including free rent and amounts reimbursed to tenants, plus estimated recurring expense reimbursements from tenants
pursuant to existing leases. Amounts are preliminary and subject to change.
MeadWestvaco Corporate Headquarters
Approx. Square Feet: 311,000
Richmond, VA Mainland Portfolio Metrics
Property count 104
Square feet 26.0 million
Locations 34 U.S. States
Occupancy 100%
Average building age(1) 11
% Investment grade tenants(2) 37.8%
% of SIR’s 1Q15 NOI 76%
Select Income REIT
Targeting:
• Single tenant office and industrial properties that are
strategic to tenants, such as:
Corporate headquarters,
Build-to-suit facilities,
Strategic distribution hubs, and
Other buildings in which tenants have invested a significant
amount of their own capital.
• Net lease structures in which tenants are financially
responsible for all – or virtually all – operating expenses.
• Fully occupied properties with avg. remaining lease terms
in excess of 10 yrs. for industrial and 7 yrs. for office.
Track Record:
• Excluding CCIT, SIR has acquired 31 buildings covering
6.4 million sq. ft. at a weighted average cap rate of 8.8%
and with a weighted average remaining lease term of more
than 12 years since its IPO.
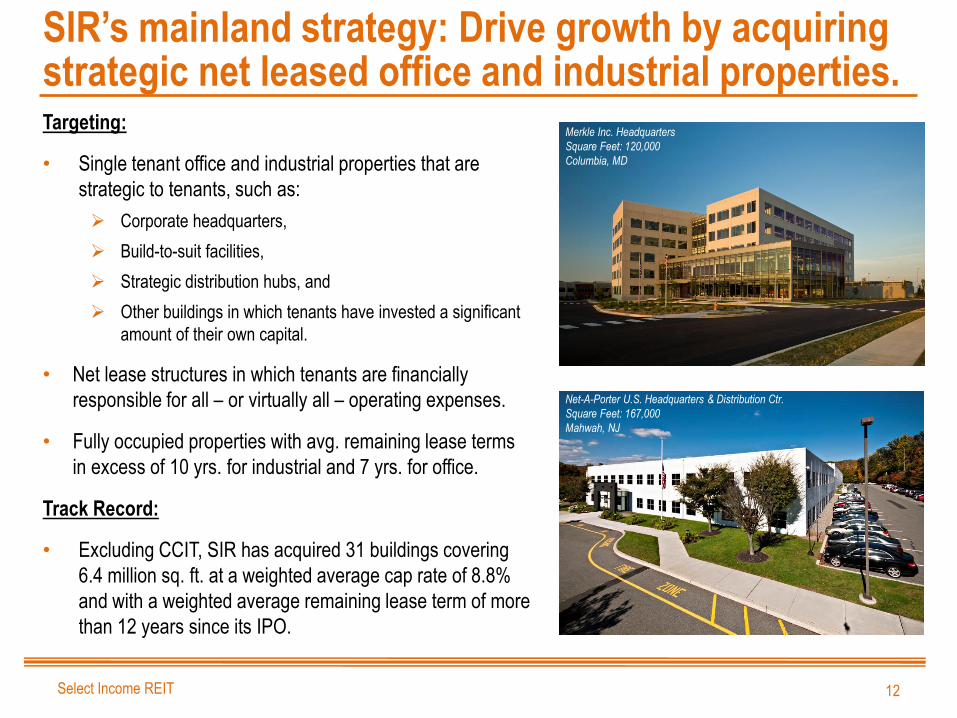
SIR’s mainland strategy: Drive growth by acquiring strategic net leased office and industrial properties.
Net-A-Porter U.S. Headquarters & Distribution Ctr.
Square Feet: 167,000
Mahwah, NJ
Merkle Inc. Headquarters
Square Feet: 120,000
Columbia, MD
12
Select Income REIT
With 17.8 million sq. ft. of lands in Oahu, SIR is
Hawaii’s largest industrial land owner.
17.2 million sq. ft. of SIR’s land has been subdivided into
smaller lots and leased to more than 160 tenants.
13 buildings containing 0.6 million sq. ft. of space are
leased to more than 60 tenants.
More than 80% of SIR’s Hawaii revenue and NOI
is generated from the former Damon Estate, which
is ideally situated on the seaport, between
Honolulu’s CBD and airport.
SIR’s lands are primarily long term leased to
tenants who have built and maintain the
improvements on the land. Many tenants have
subordinated leasehold mortgages on their
buildings, meaning SIR could recover the value of
improvements upon default.
SIR’s unique and diversified Hawaiian portfolio.
13
Portion of the Former Damon Estate
Approximate Square Feet: 9,600,000
Honolulu, HI
OAHU
Former Campbell
Estate Properties
Former Damon
Estate Properties
Honolulu
Intl. Airport
Honolulu
CBD
Select Income REIT 14
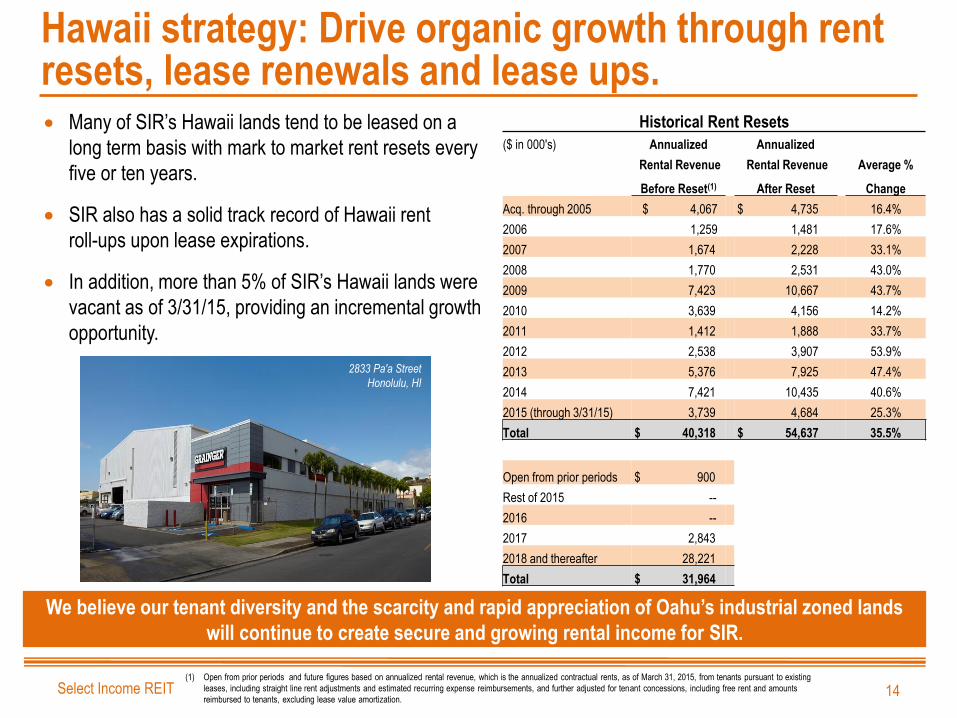
Many of SIR’s Hawaii lands tend to be leased on a
long term basis with mark to market rent resets every
five or ten years.
SIR also has a solid track record of Hawaii rent
roll-ups upon lease expirations.
In addition, more than 5% of SIR’s Hawaii lands were
vacant as of 3/31/15, providing an incremental growth
opportunity.
Hawaii strategy: Drive organic growth through rent resets, lease renewals and lease ups.
2833 Pa'a Street
Honolulu, HI
(1) Open from prior periods and future figures based on annualized rental revenue, which is the annualized contractual rents, as of March 31, 2015, from tenants pursuant to existing
leases, including straight line rent adjustments and estimated recurring expense reimbursements, and further adjusted for tenant concessions, including free rent and amounts
reimbursed to tenants, excluding lease value amortization.
We believe our tenant diversity and the scarcity and rapid appreciation of Oahu’s industrial zoned lands
will continue to create secure and growing rental income for SIR.
Historical Rent Resets
($ in 000's) Annualized Annualized
Rental Revenue Rental Revenue Average %
Before Reset(1) After Reset Change
Acq. through 2005 $ 4,067 $ 4,735 16.4%
2006 1,259 1,481 17.6%
2007 1,674 2,228 33.1%
2008 1,770 2,531 43.0%
2009 7,423 10,667 43.7%
2010 3,639 4,156 14.2%
2011 1,412 1,888 33.7%
2012 2,538 3,907 53.9%
2013 5,376 7,925 47.4%
2014 7,421 10,435 40.6%
2015 (through 3/31/15) 3,739 4,684 25.3%
Total $ 40,318 $ 54,637 35.5%
Open from prior periods $ 900
Rest of 2015 --
2016 --
2017 2,843
2018 and thereafter 28,221
Total $ 31,964

Select Income REIT
FINANCIALS
15
Select Income REIT
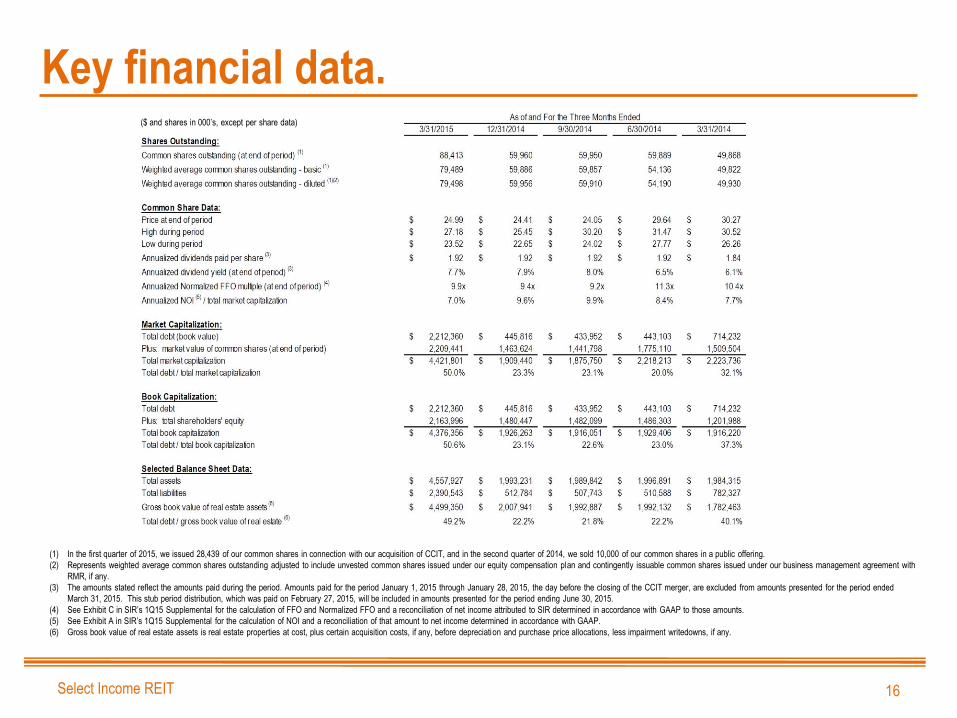
Key financial data.
16
($ and shares in 000’s, except per share data)
(1) In the first quarter of 2015, we issued 28,439 of our common shares in connection with our acquisition of CCIT, and in the second quarter of 2014, we sold 10,000 of our common shares in a public offering.
(2) Represents weighted average common shares outstanding adjusted to include unvested common shares issued under our equity compensation plan and contingently issuable common shares issued under our business management agreement with
RMR, if any.
(3) The amounts stated reflect the amounts paid during the period. Amounts paid for the period January 1, 2015 through January 28, 2015, the day before the closing of the CCIT merger, are excluded from amounts presented for the period ended
March 31, 2015. This stub period distribution, which was paid on February 27, 2015, will be included in amounts presented for the period ending June 30, 2015.
(4) See Exhibit C in SIR’s 1Q15 Supplemental for the calculation of FFO and Normalized FFO and a reconciliation of net income attributed to SIR determined in accordance with GAAP to those amounts.
(5) See Exhibit A in SIR’s 1Q15 Supplemental for the calculation of NOI and a reconciliation of that amount to net income determined in accordance with GAAP.
(6) Gross book value of real estate assets is real estate properties at cost, plus certain acquisition costs, if any, before depreciation and purchase price allocations, less impairment writedowns, if any.
Select Income REIT
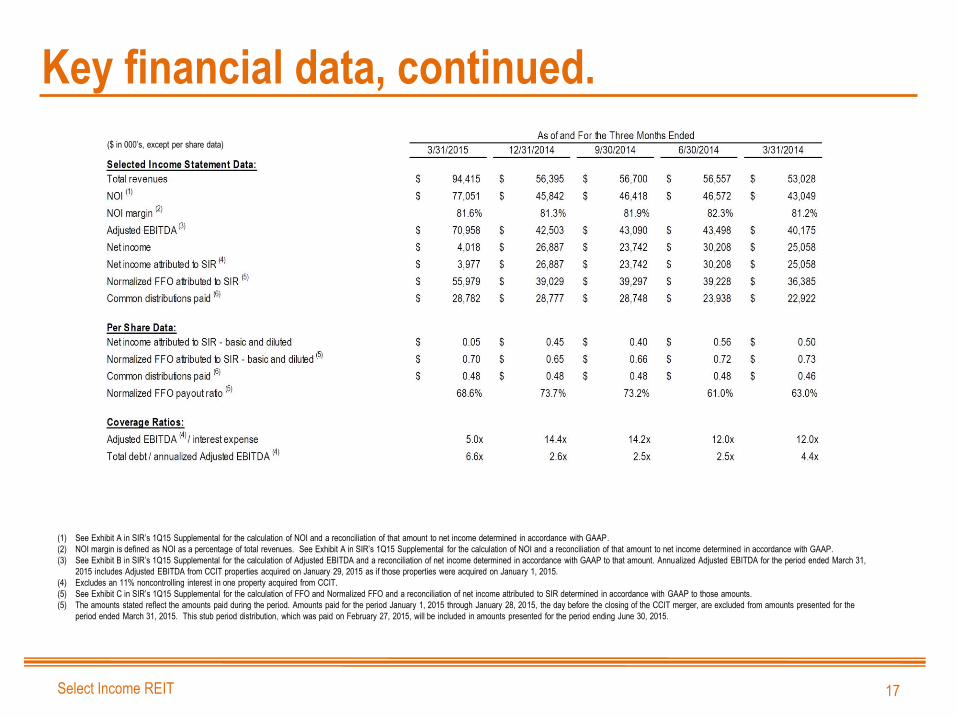
Key financial data, continued.
17
($ in 000’s, except per share data)
(1) See Exhibit A in SIR’s 1Q15 Supplemental for the calculation of NOI and a reconciliation of that amount to net income determined in accordance with GAAP.
(2) NOI margin is defined as NOI as a percentage of total revenues. See Exhibit A in SIR’s 1Q15 Supplemental for the calculation of NOI and a reconciliation of that amount to net income determined in accordance with GAAP.
(3) See Exhibit B in SIR’s 1Q15 Supplemental for the calculation of Adjusted EBITDA and a reconciliation of net income determined in accordance with GAAP to that amount. Annualized Adjusted EBITDA for the period ended March 31,
2015 includes Adjusted EBITDA from CCIT properties acquired on January 29, 2015 as if those properties were acquired on January 1, 2015.
(4) Excludes an 11% noncontrolling interest in one property acquired from CCIT.
(5) See Exhibit C in SIR’s 1Q15 Supplemental for the calculation of FFO and Normalized FFO and a reconciliation of net income attributed to SIR determined in accordance with GAAP to those amounts.
(5) The amounts stated reflect the amounts paid during the period. Amounts paid for the period January 1, 2015 through January 28, 2015, the day before the closing of the CCIT merger, are excluded from amounts presented for the
period ended March 31, 2015. This stub period distribution, which was paid on February 27, 2015, will be included in amounts presented for the period ending June 30, 2015.
Select Income REIT
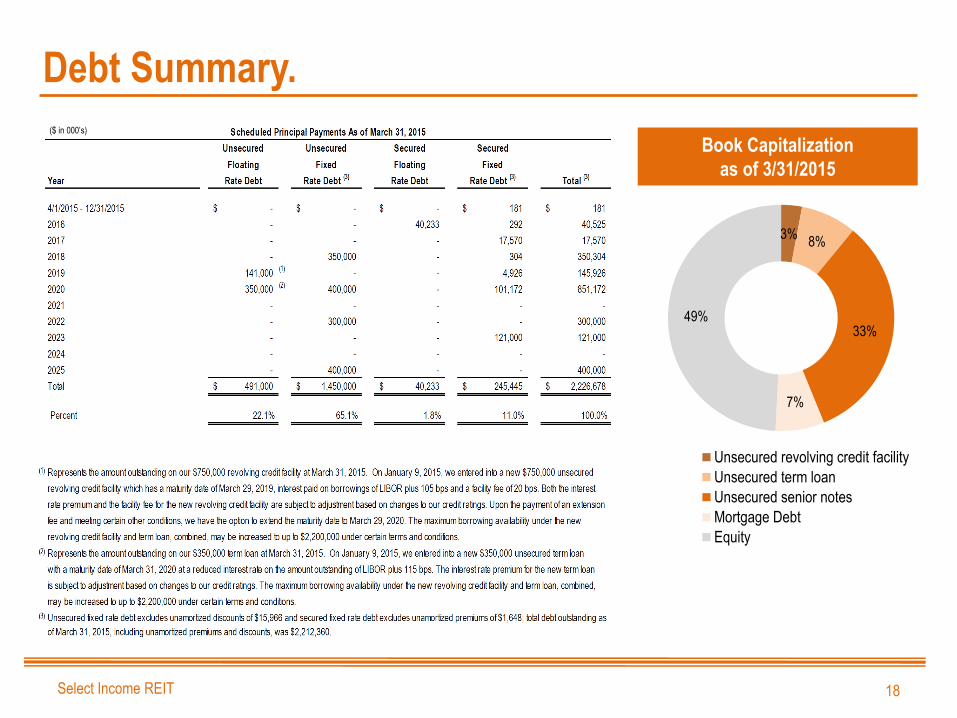
3% 8%
33%
7%
49%
Unsecured revolving credit facility
Unsecured term loan
Unsecured senior notes
Mortgage Debt
Equity
Debt Summary.
18
Book Capitalization
as of 3/31/2015
($ in 000’s)
Select Income REIT
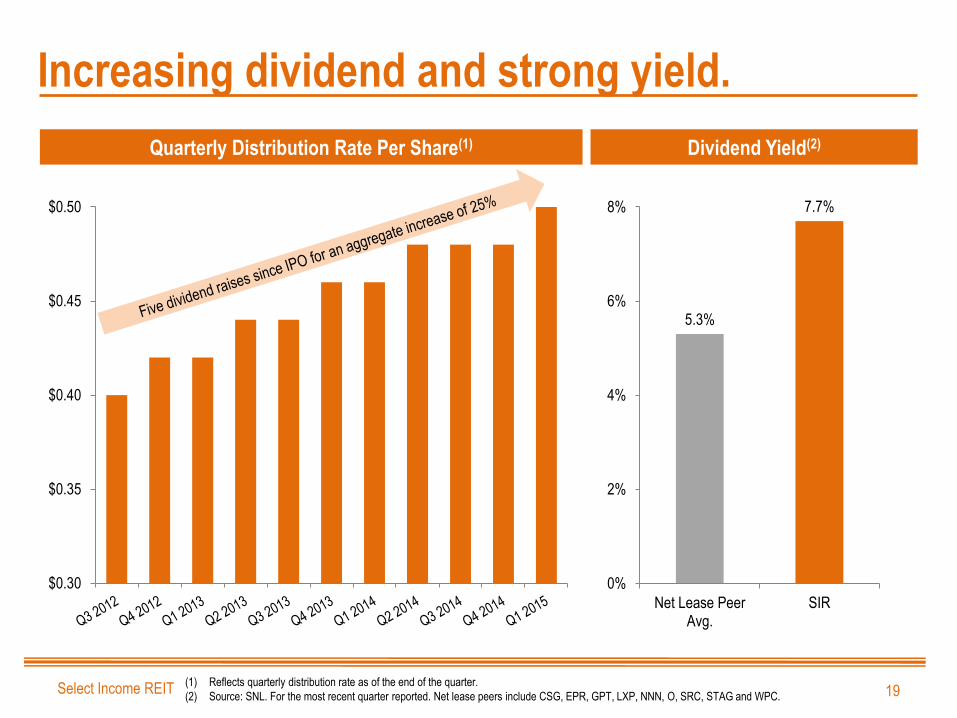
Increasing dividend and strong yield.
19
(1) Reflects quarterly distribution rate as of the end of the quarter.
(2) Source: SNL. For the most recent quarter reported. Net lease peers include CSG, EPR, GPT, LXP, NNN, O, SRC, STAG and WPC.
$0.30
$0.35
$0.40
$0.45
$0.50
Quarterly Distribution Rate Per Share(1) Dividend Yield(2)
5.3%
7.7%
0%
2%
4%
6%
8%
Net Lease PeerAvg.
SIR

Select Income REIT Investor Presentation – June 2015
Orbital ATK (NYSE: OA) Headquarters
Square Feet: 337,000
Sterling, VA