keybanc capital markets investor meetings september...
TRANSCRIPT
KeyBanc Capital MarketsInvestor Meetings
September 26-27, 2007

The forward-looking statements in this presentation are
made pursuant to the safe-harbor provisions of the
Private Securities Litigation Reform Act of 1995.
Forward-looking statements may be significantly
impacted by certain risks and uncertainties described in
Papa John’s Annual Report on form 10-K and Papa
John’s Quarterly Reports on form 10-Q as filed with the
Securities and Exchange Commission.
Safe-Harbor Statement

Papa John’s Representatives
David FlanerySr. VP and Chief Financial Officer
Amber McNewDirector of Financial Reporting &
Investor Relations

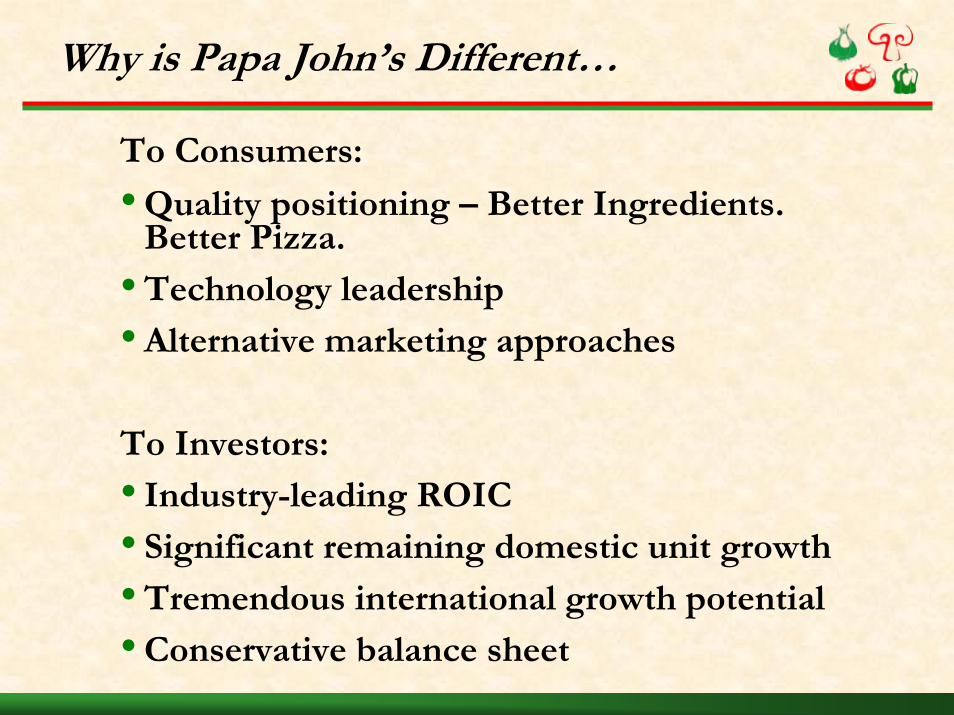
Why is Papa John’s Different…
To Consumers:
• Quality positioning – Better Ingredients. Better Pizza.
• Technology leadership
• Alternative marketing approaches
To Investors:
• Industry-leading ROIC
• Significant remaining domestic unit growth
• Tremendous international growth potential
• Conservative balance sheet
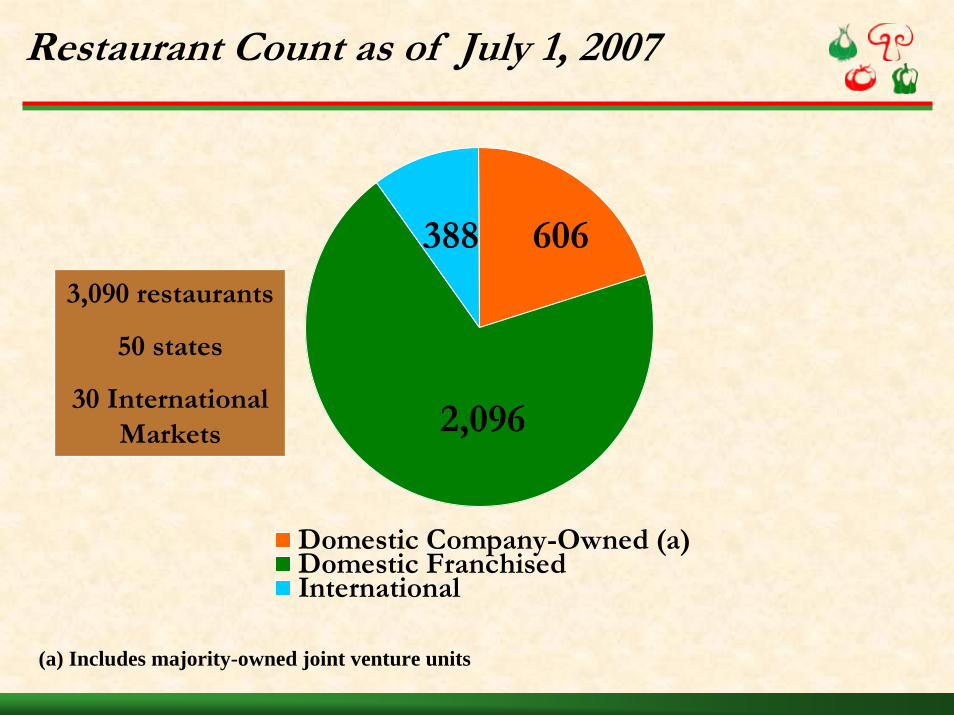
Restaurant Count as of July 1, 2007
Domestic Company-Owned (a)Domestic FranchisedInternational
2,096
606388
3,090 restaurants
50 states
30 InternationalMarkets
(a) Includes majority-owned joint venture units
Domestic Restaurant Mix
• Current domestic mix is 22% company-owned and 78% franchised
• Acquired 73 domestic Papa John’s restaurants from franchisees during the last 13 months for various strategic reasons
• Significant additional franchise acquisitions are not likely at this time (Company-owned market fill-in opportunities only)
• Company-owned domestic restaurant mix will most likely decline as new unit openings are weighted toward franchise units in the next few years
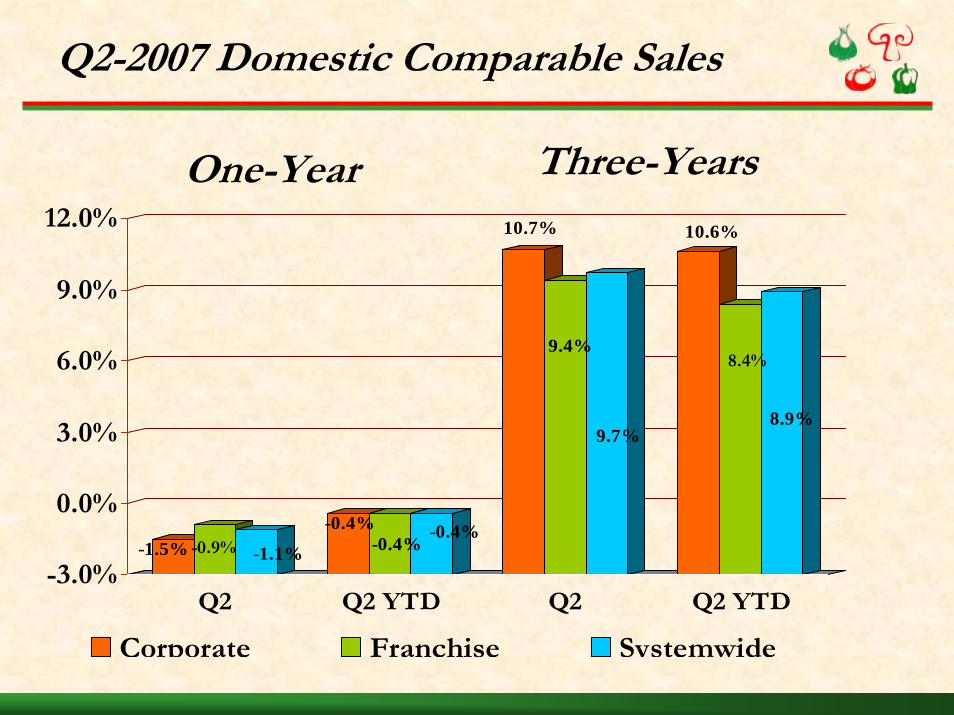
-1.5% -0.9% -1.1%
-0.4%-0.4%
-0.4%
10.7%
9.4%
9.7%
10.6%
8.4%
8.9%
-3.0%
0.0%
3.0%
6.0%
9.0%
12.0%
Q2 Q2 YTD Q2 Q2 YTD
Corporate Franchise Systemwide
Q2-2007 Domestic Comparable Sales
One-Year Three-Years
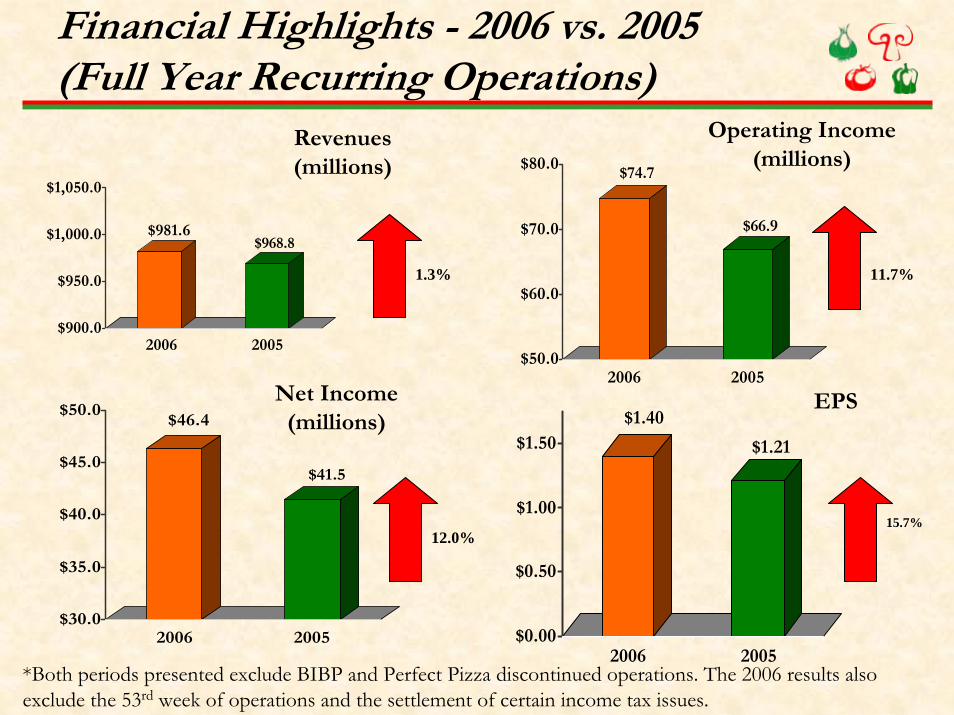
Financial Highlights - 2006 vs. 2005(Full Year Recurring Operations)
$981.6$968.8
$900.0
$950.0
$1,000.0
$1,050.0
2006 2005
$74.7
$66.9
$50.0
$60.0
$70.0
$80.0
2006 2005
$46.4
$41.5
$30.0
$35.0
$40.0
$45.0
$50.0
2006 2005
$1.40
$1.21
$0.00
$0.50
$1.00
$1.50
2006 2005
Revenues (millions)
Operating Income (millions)
Net Income (millions)
EPS
*Both periods presented exclude BIBP and Perfect Pizza discontinued operations. The 2006 results also exclude the 53rd week of operations and the settlement of certain income tax issues.
1.3% 11.7%
12.0%15.7%
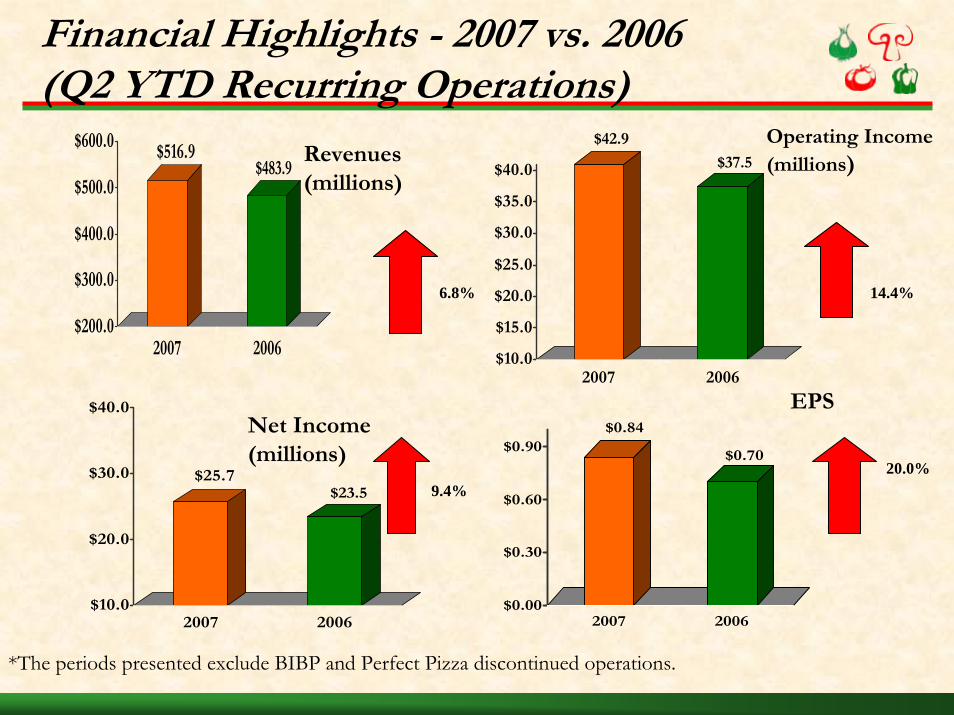
Financial Highlights - 2007 vs. 2006(Q2 YTD Recurring Operations)
$516.9$483.9
$200.0
$300.0
$400.0
$500.0
$600.0
2007 2006
$42.9
$37.5
$10.0
$15.0
$20.0
$25.0
$30.0
$35.0
$40.0
2007 2006
$25.7$23.5
$10.0
$20.0
$30.0
$40.0
2007 2006
$0.84
$0.70
$0.00
$0.30
$0.60
$0.90
2007 2006
Revenues (millions)
Operating Income (millions)
Net Income (millions)
EPS
*The periods presented exclude BIBP and Perfect Pizza discontinued operations.
6.8% 14.4%
9.4%20.0%
Focus on Cash Flow
• Strong Operating Cash Flow from Continuing Operations (excludes BIBP)
– Over $140 million in last two years combined; $34.9 million YTD Q2 2007
• Franchise System – Franchise Capital Fuels Growth
• Two Main Franchise-based Income Streams -Royalty and Commissary
• Excellent Corporate Store Unit Economics Domestically
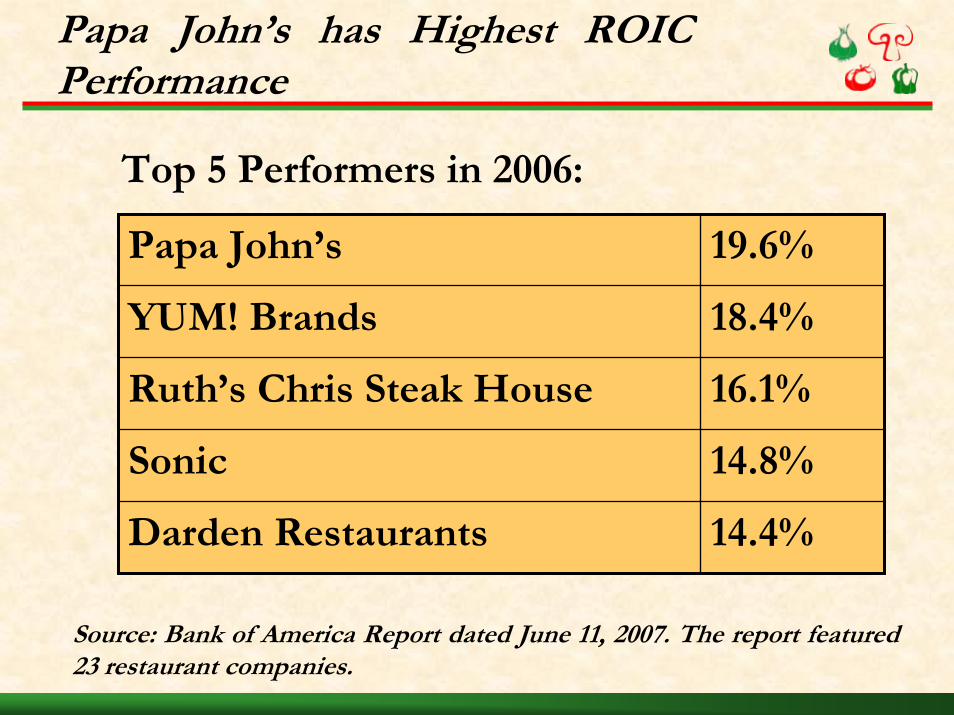
Papa John’s has Highest ROIC Performance
Papa John’s 19.6%
YUM! Brands 18.4%
Ruth’s Chris Steak House 16.1%
Sonic 14.8%
Darden Restaurants 14.4%
Top 5 Performers in 2006:
Source: Bank of America Report dated June 11, 2007. The report featured 23 restaurant companies.

Conservative Balance Sheet
• EBITDA (excluding BIBP) of $100 million in 2006; $58.4 million YTD Q2 2007
• Debt of $96.5 million at end of 2006 (0.9x EBITDA); increased to $116 million at end of Q2-2007
• Q2 YTD-07 cash flow included $22.5 million for share repurchases (net of option exercise proceeds and tax benefit)
Share Repurchase Program
• Share repurchase authorization of $675 million through December 30, 2007
• Repurchased $645 million of stock through August 1, 2007
• Actual shares outstanding of 29.9 million as of August 1, 2007
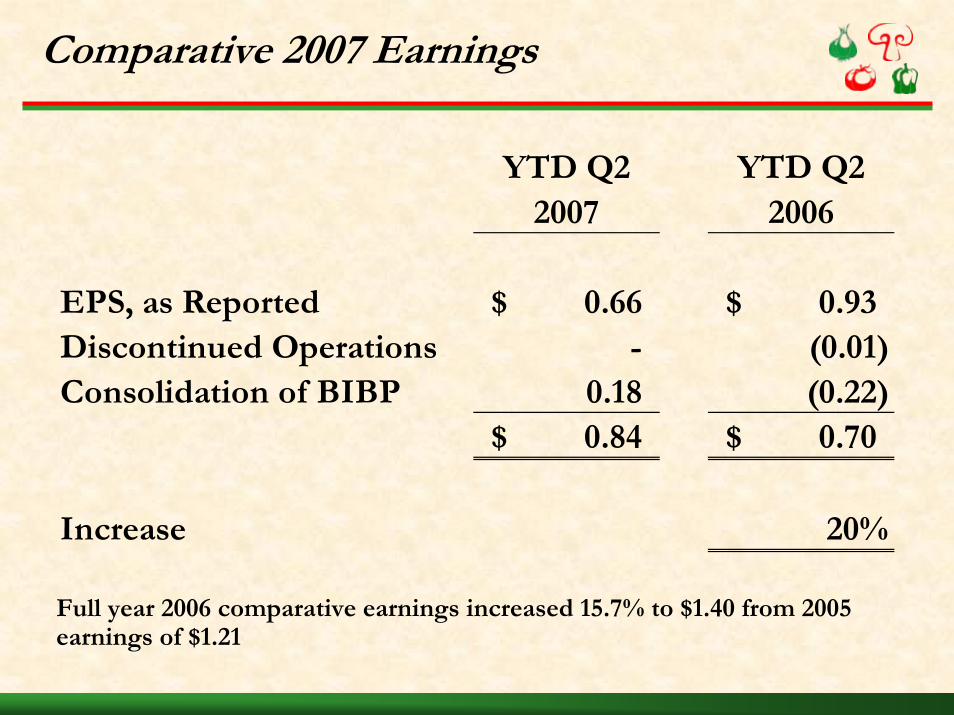
Comparative 2007 Earnings
YTD Q2 YTD Q22007 2006
EPS, as Reported 0.66$ 0.93$ Discontinued Operations - (0.01) Consolidation of BIBP 0.18 (0.22)
0.84$ 0.70$
Increase 20%
Full year 2006 comparative earnings increased 15.7% to $1.40 from 2005 earnings of $1.21
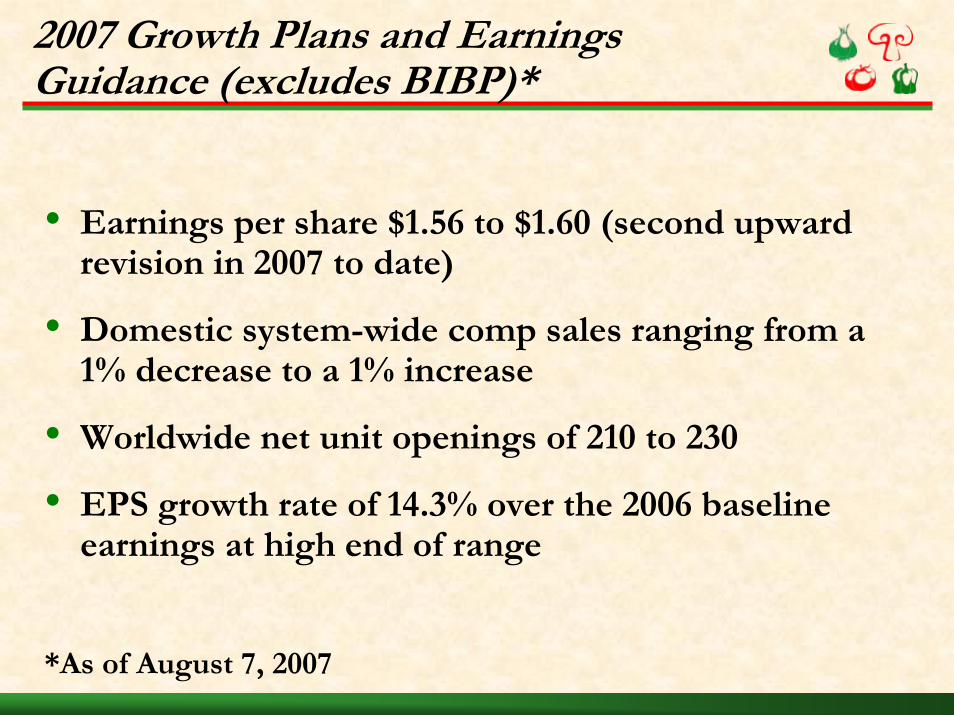
2007 Growth Plans and Earnings Guidance (excludes BIBP)*
• Earnings per share $1.56 to $1.60 (second upward revision in 2007 to date)
• Domestic system-wide comp sales ranging from a 1% decrease to a 1% increase
• Worldwide net unit openings of 210 to 230
• EPS growth rate of 14.3% over the 2006 baseline earnings at high end of range
*As of August 7, 2007
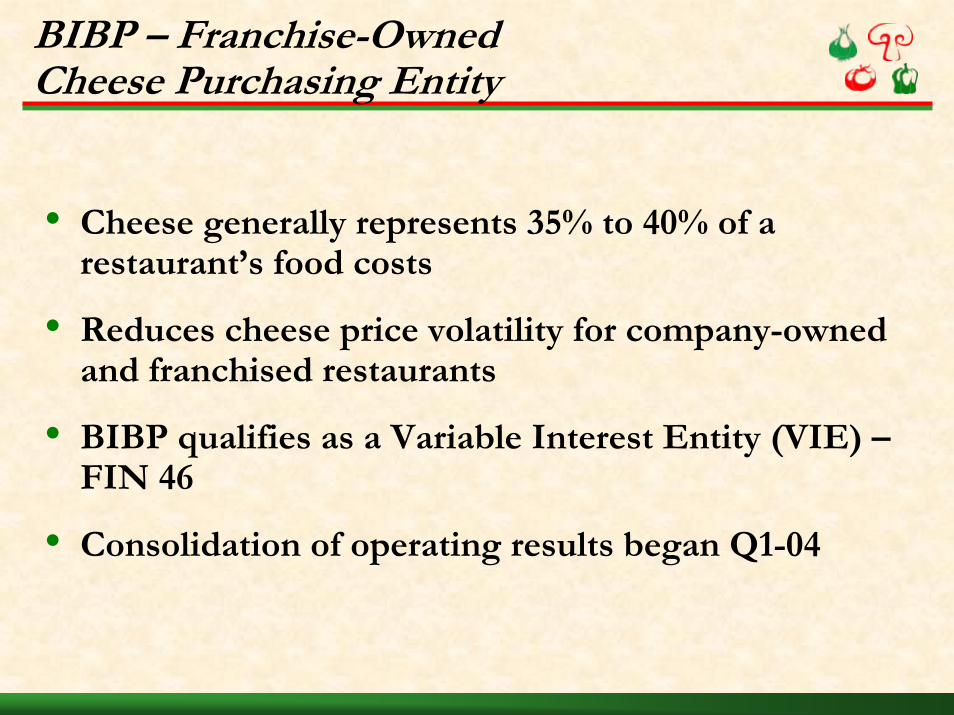
BIBP – Franchise-Owned Cheese Purchasing Entity
• Cheese generally represents 35% to 40% of a restaurant’s food costs
• Reduces cheese price volatility for company-owned and franchised restaurants
• BIBP qualifies as a Variable Interest Entity (VIE) –FIN 46
• Consolidation of operating results began Q1-04
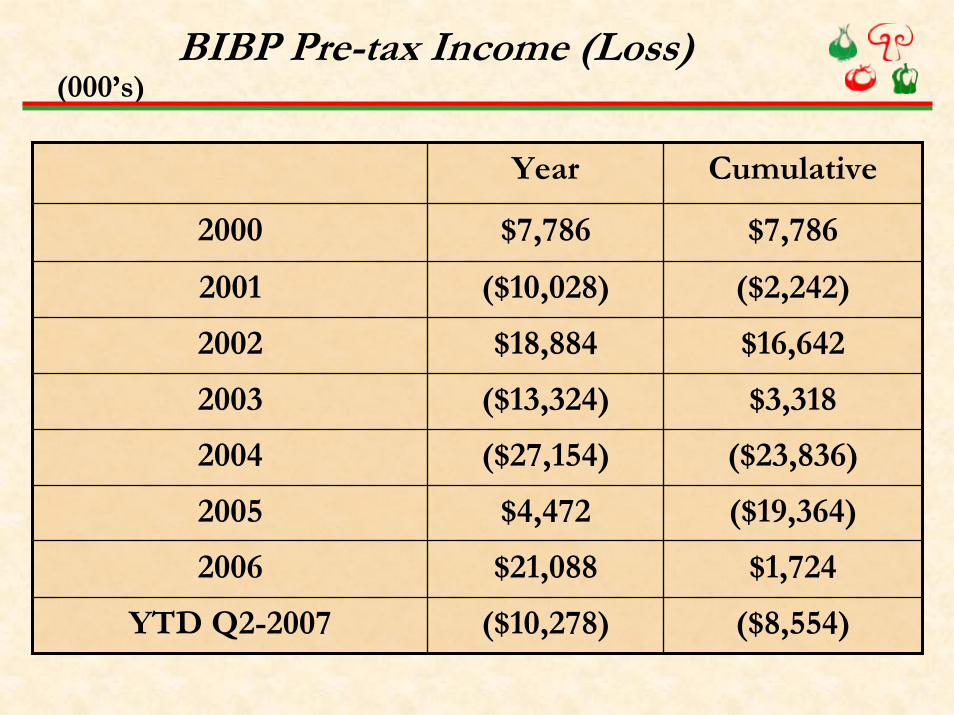
BIBP Pre-tax Income (Loss) (000’s)
Year Cumulative
2000 $7,786 $7,786
2001 ($10,028) ($2,242)
2002 $18,884 $16,642
2003 ($13,324) $3,318
2004 ($27,154) ($23,836)
2005 $4,472 ($19,364)
2006 $21,088 $1,724
YTD Q2-2007 ($10,278) ($8,554)
Why is Papa John’s Different…
To Consumers:
• Quality positioning – Better Ingredients. Better Pizza.
• Technology leadership
• Alternative marketing approaches
To Investors:
• Industry-leading ROIC
• Significant remaining domestic unit growth
• Tremendous international growth potential
• Conservative balance sheet
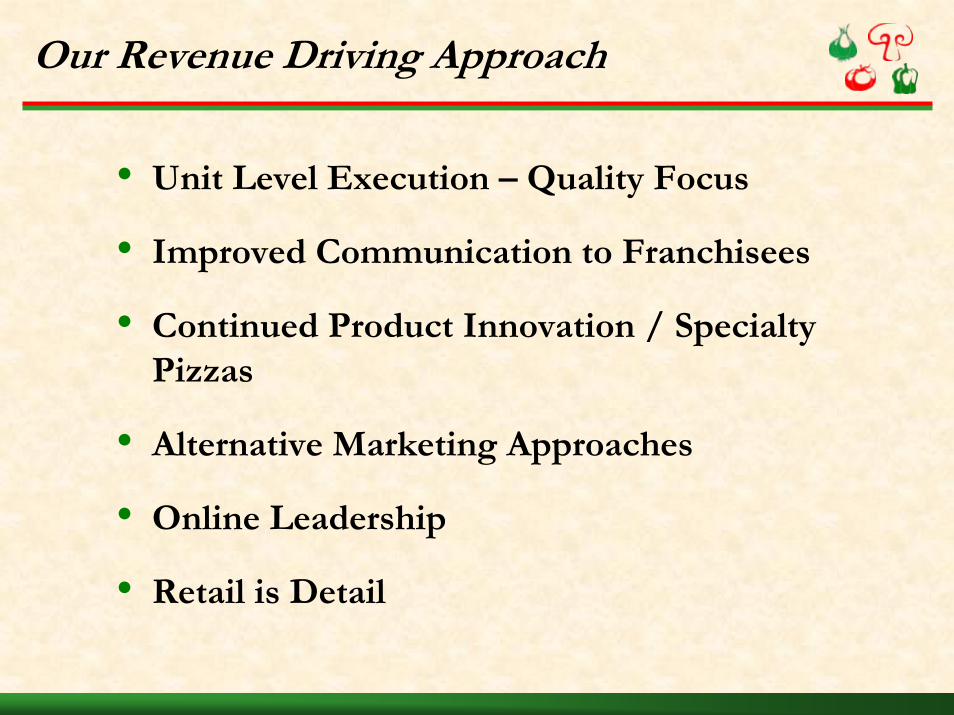
Our Revenue Driving Approach
• Unit Level Execution – Quality Focus
• Improved Communication to Franchisees
• Continued Product Innovation / Specialty Pizzas
• Alternative Marketing Approaches
• Online Leadership
• Retail is Detail
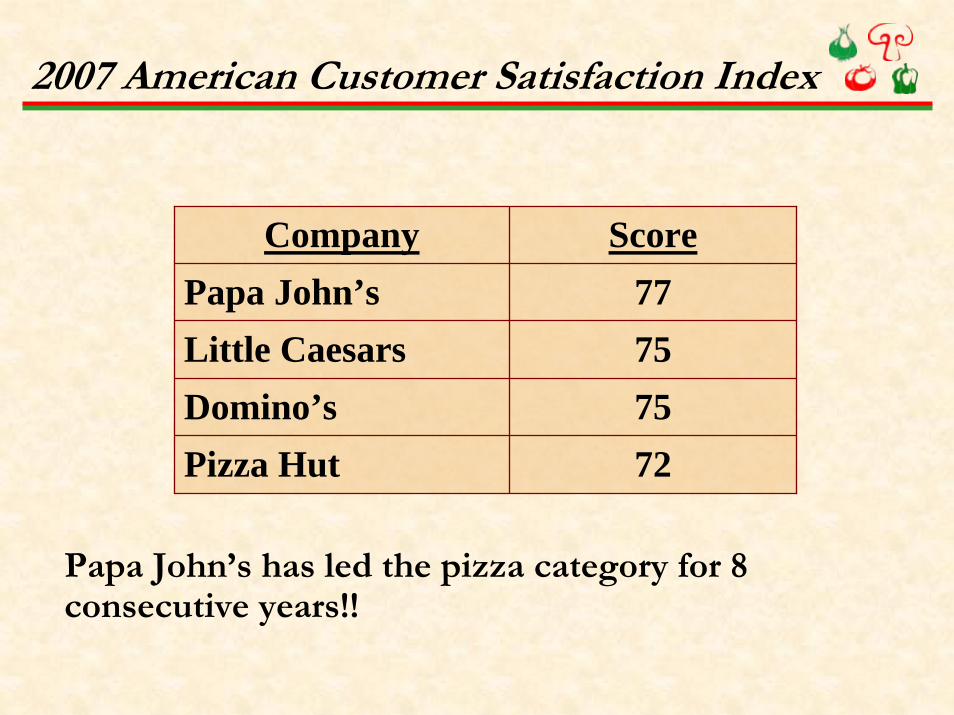
Company ScorePapa John’s 77Little Caesars 75Domino’s 75Pizza Hut 72
2007 American Customer Satisfaction Index
Papa John’s has led the pizza category for 8 consecutive years!!
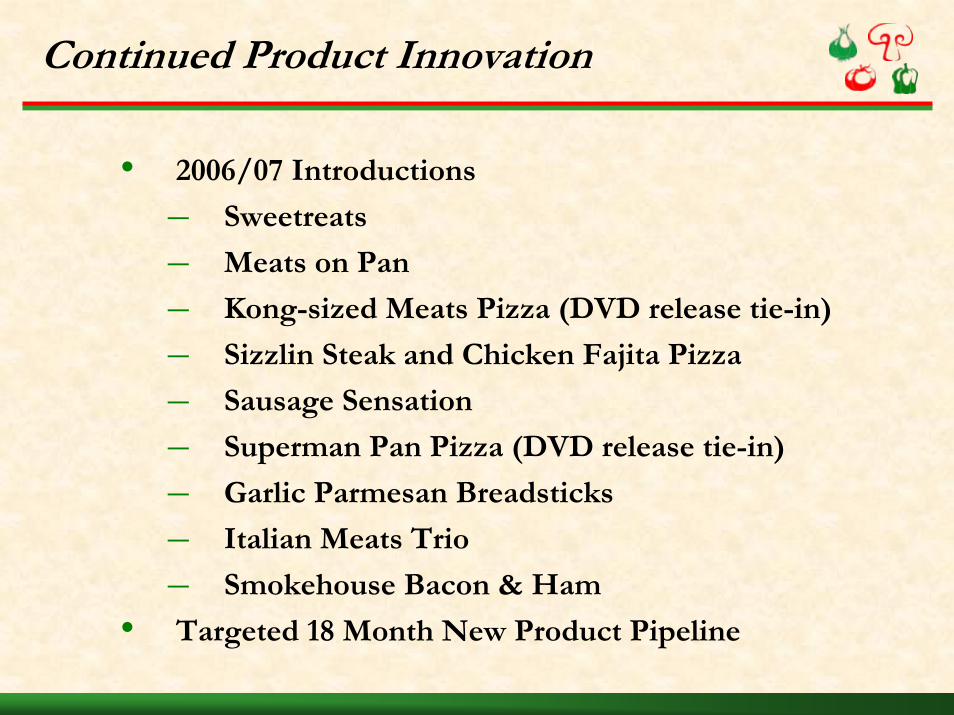
Continued Product Innovation
• 2006/07 Introductions
– Sweetreats
– Meats on Pan
– Kong-sized Meats Pizza (DVD release tie-in)
– Sizzlin Steak and Chicken Fajita Pizza
– Sausage Sensation
– Superman Pan Pizza (DVD release tie-in)
– Garlic Parmesan Breadsticks
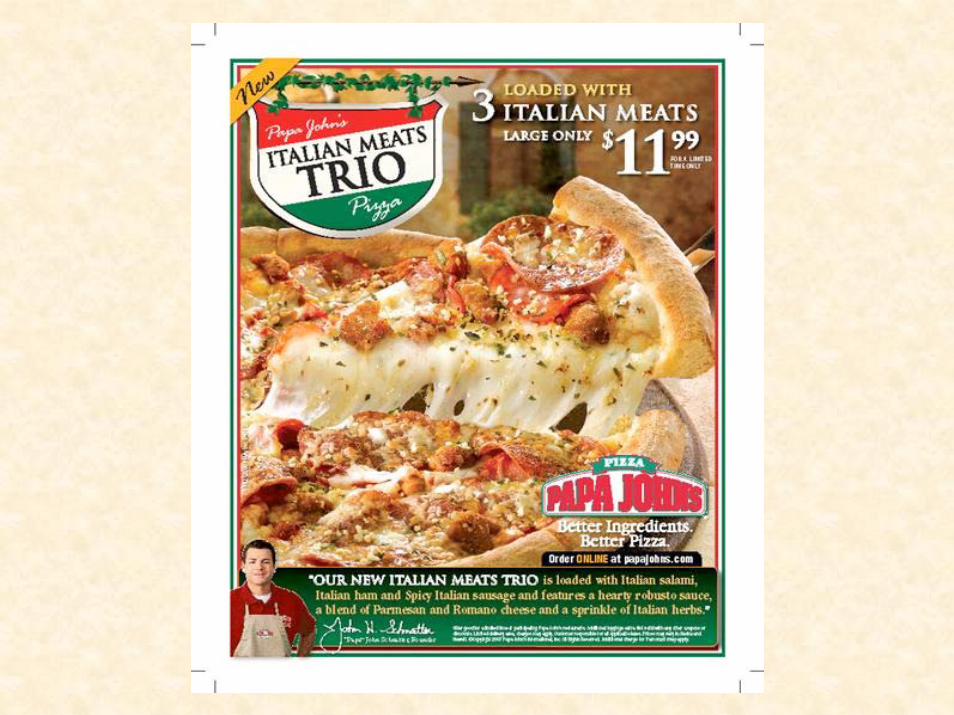
– Italian Meats Trio
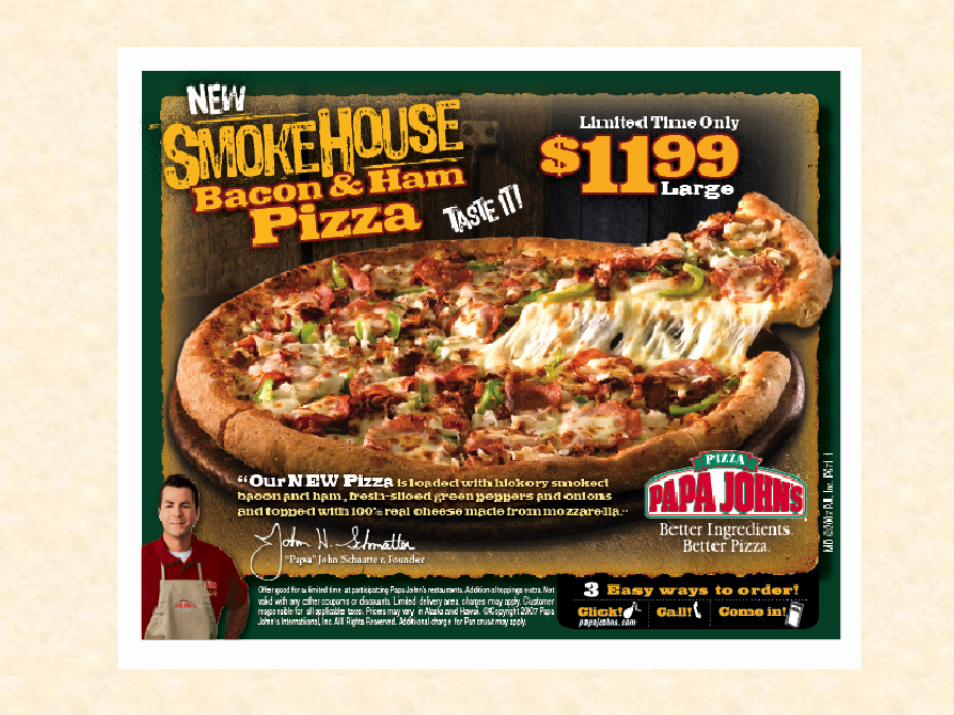
– Smokehouse Bacon & Ham
• Targeted 18 Month New Product Pipeline

Alternative Marketing
• Emphasis on Coordinated PR Campaigns
• Online Registrations – Email Marketing
• Direct Mail / Data Base Marketing
• Non-traditional/LSM Coordination
• Increasing Papa Card usage
• Six Flags Sponsorship Agreement
• Live Nation Sponsorship and Marketing Agreement
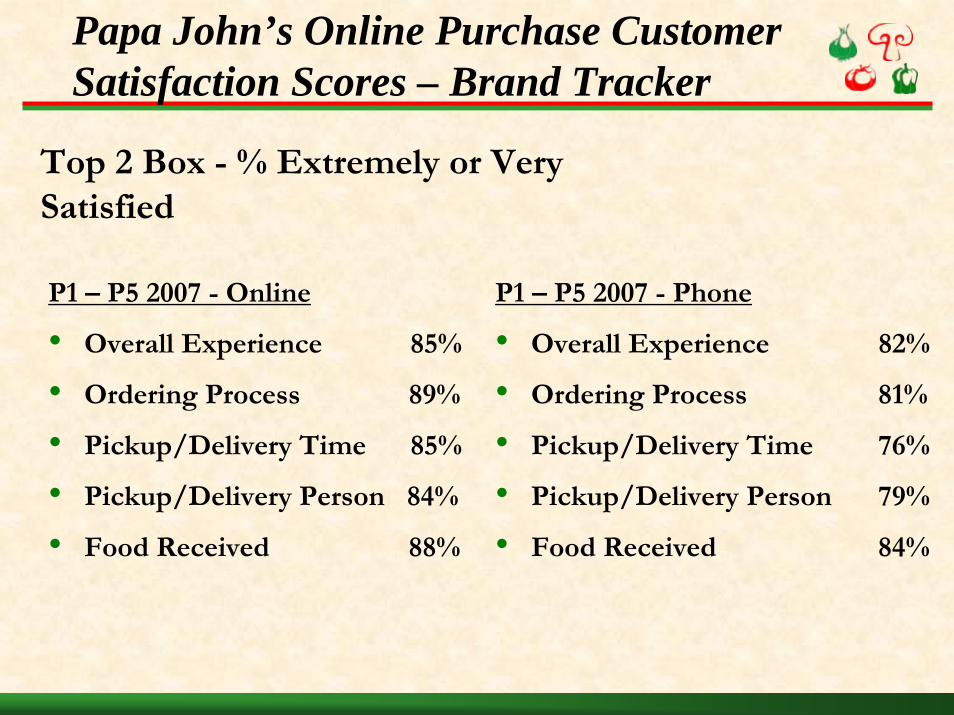
Papa John’s Online Purchase Customer Satisfaction Scores – Brand Tracker
P1 – P5 2007 - Online
• Overall Experience 85%
• Ordering Process 89%
• Pickup/Delivery Time 85%
• Pickup/Delivery Person 84%
• Food Received 88%
P1 – P5 2007 - Phone
• Overall Experience 82%
• Ordering Process 81%
• Pickup/Delivery Time 76%
• Pickup/Delivery Person 79%
• Food Received 84%
Top 2 Box - % Extremely or Very Satisfied
Focus on Development
• Consistent comparable sales growth
• Continue to improve unit economics and reduce investment
• Focus on increasing penetration and market awareness
• Utilization of buy & build strategy
• Drive non-traditional growth
• Address emerging market issues via unique models (e.g., Blockbuster store-in-store)
• Urban development – diversity focus
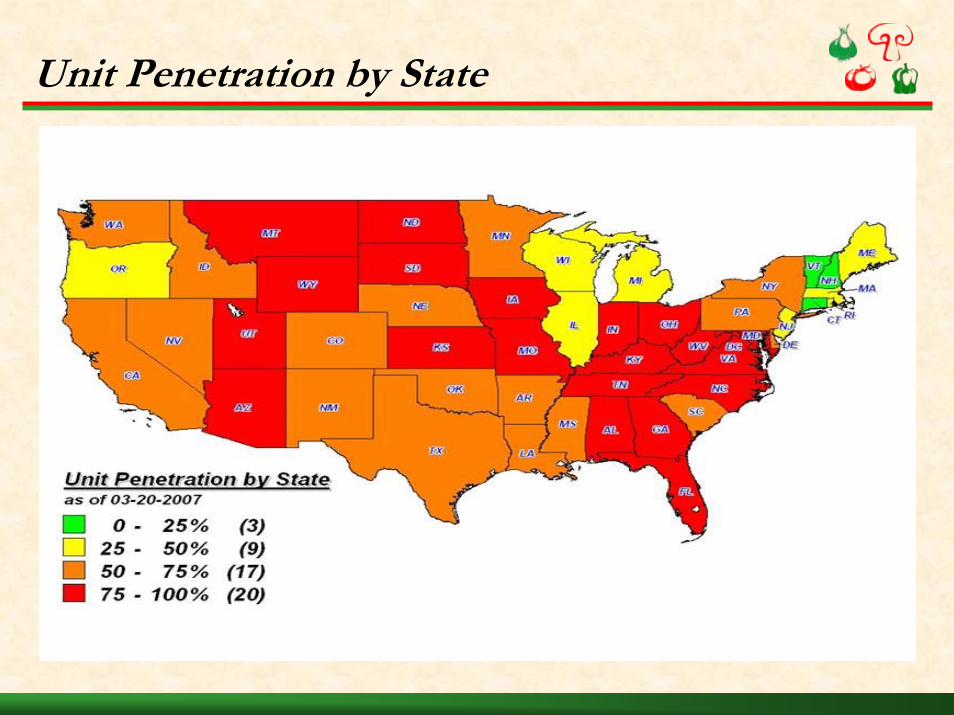
Unit Penetration by State
Domestic Development Potential
• Approximately 1,000 traditional units remain to be built (35%+ growth) mostly in under-penetrated markets/regions
• Infrastructure is in place to support this unit growth without requiring significant additional capital investment in PJ Food Service (existing 10 facilities have capacity to service approximately 4,000 units)
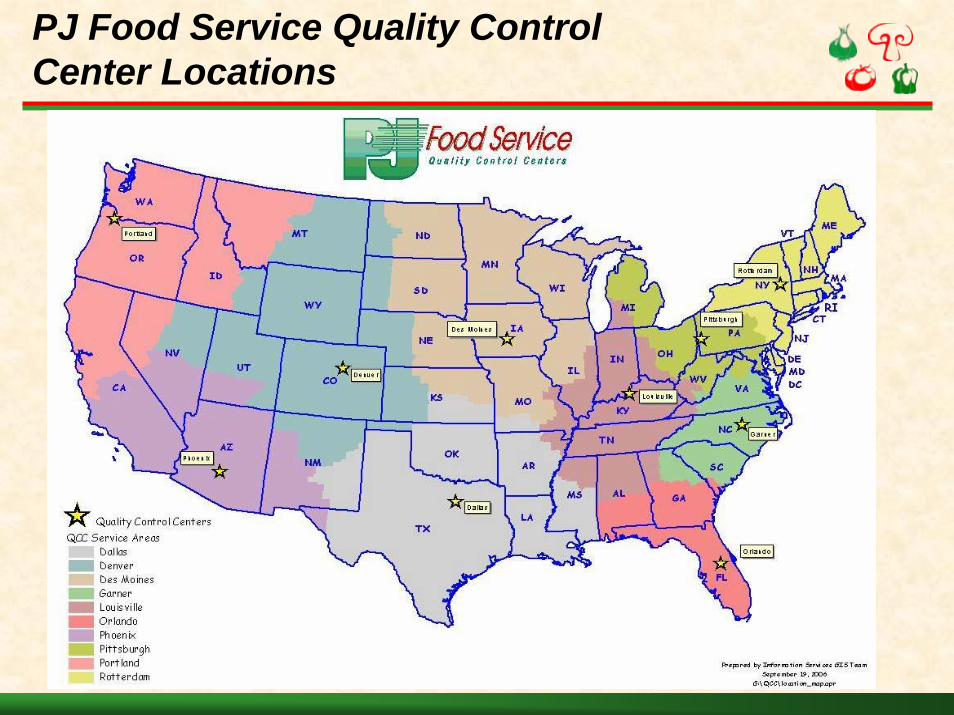
PJ Food Service Quality Control Center Locations
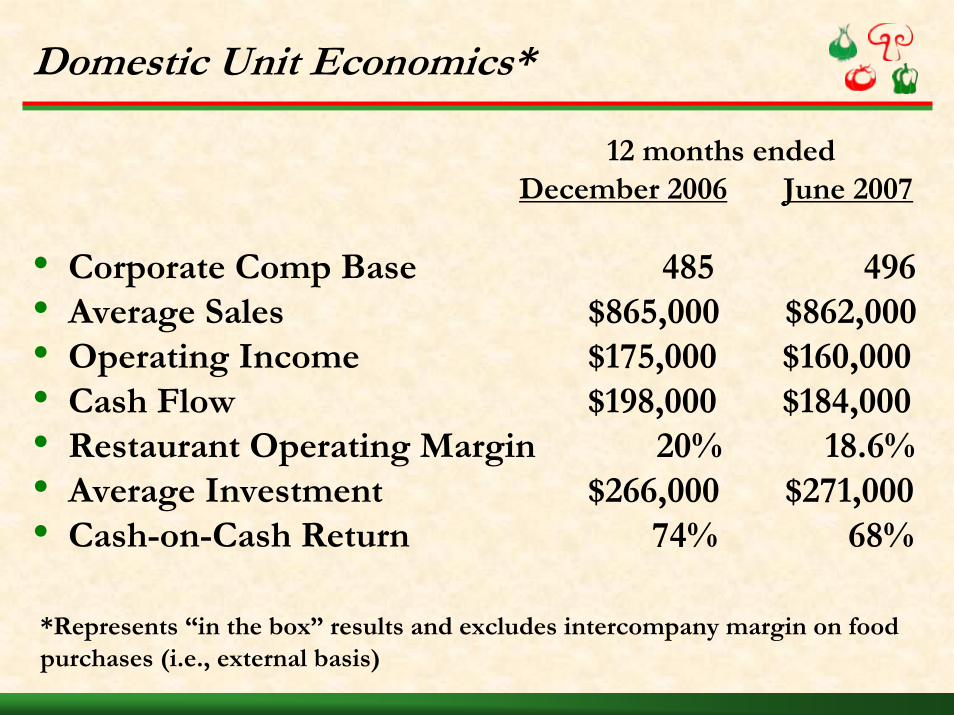
Domestic Unit Economics*
• Corporate Comp Base 485 496• Average Sales $865,000 $862,000• Operating Income $175,000 $160,000• Cash Flow $198,000 $184,000• Restaurant Operating Margin 20% 18.6%• Average Investment $266,000 $271,000• Cash-on-Cash Return 74% 68%
*Represents “in the box” results and excludes intercompany margin on foodpurchases (i.e., external basis)
12 months endedDecember 2006 June 2007
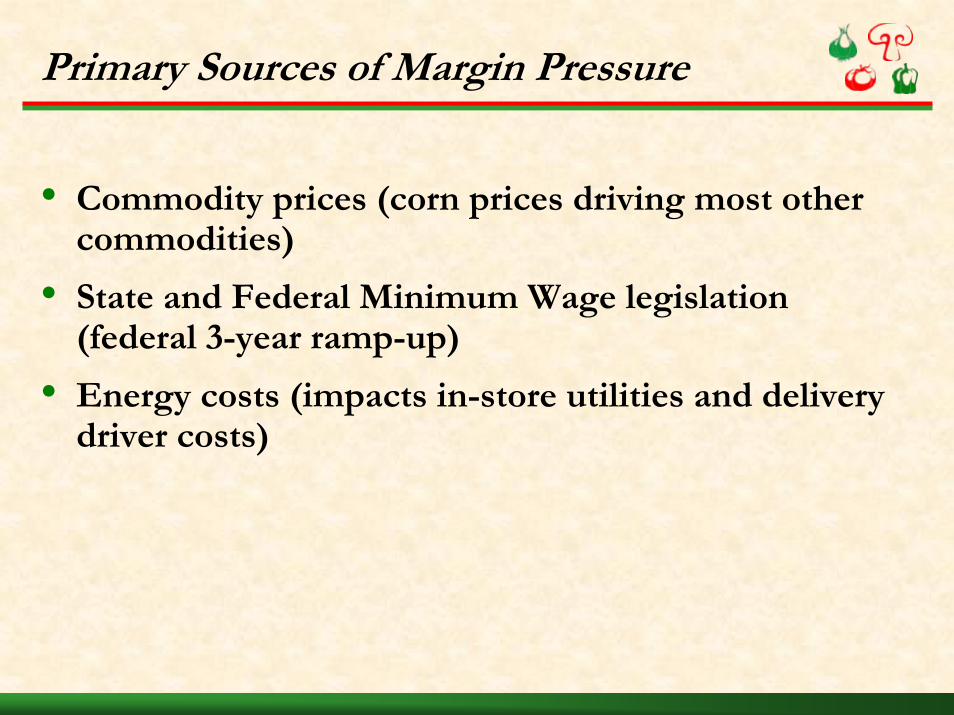
Primary Sources of Margin Pressure
• Commodity prices (corn prices driving most other commodities)
• State and Federal Minimum Wage legislation (federal 3-year ramp-up)
• Energy costs (impacts in-store utilities and delivery driver costs)
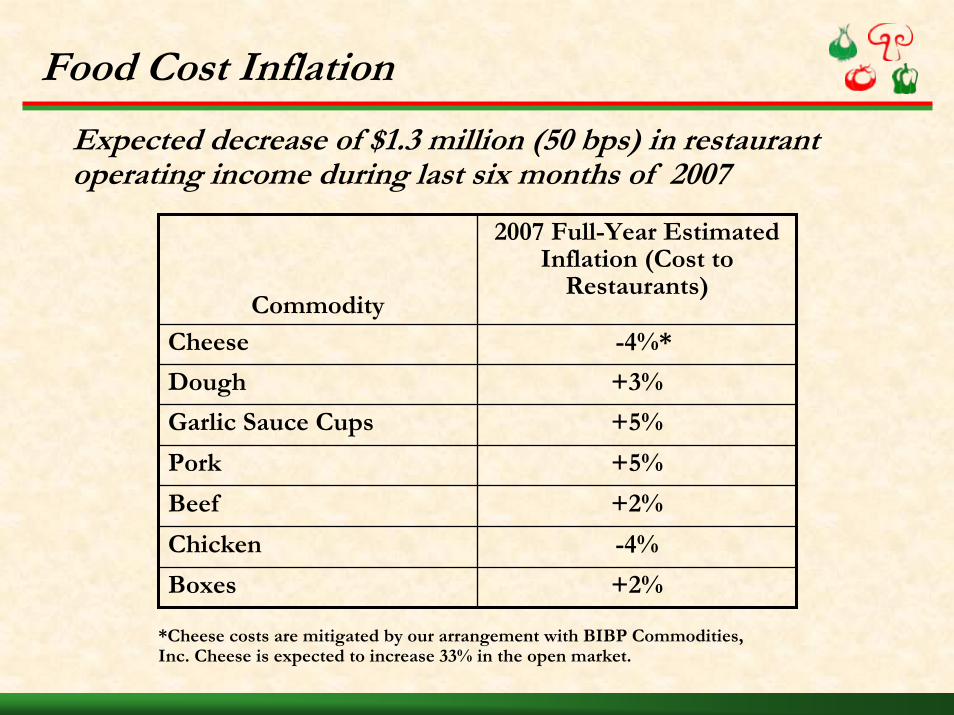
Food Cost Inflation
Commodity
2007 Full-Year Estimated Inflation (Cost to
Restaurants)
Cheese -4%*
Dough +3%
Garlic Sauce Cups +5%
Pork +5%
Beef +2%
Chicken -4%
Boxes +2%
*Cheese costs are mitigated by our arrangement with BIBP Commodities, Inc. Cheese is expected to increase 33% in the open market.
Expected decrease of $1.3 million (50 bps) in restaurant operating income during last six months of 2007
Responses to Margin Pressure
• Drive top-line revenues (numerous initiatives)
• In-store productivity improvements (e.g., increase in online order mix, intelligent driver routing, etc.)
• Unit growth to achieve more scale (particularly important to improving marketing efficiency – more contributions to national marketing fund, etc.)
• PJFS productivity opportunities (e.g., distribution and warehousing efficiencies)
• Corporate cost containment
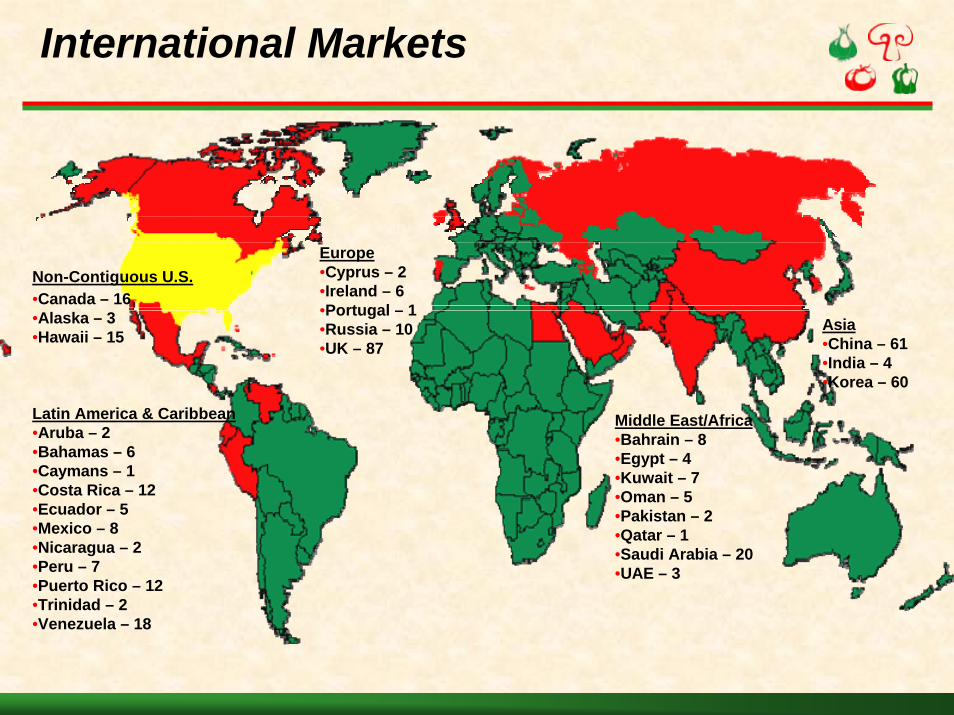
International Markets
Asia•China – 61•India – 4•Korea – 60
•Canada – 16 •Alaska – 3 •Hawaii – 15
Latin America & Caribbean•Aruba – 2 •Bahamas – 6 •Caymans – 1•Costa Rica – 12•Ecuador – 5•Mexico – 8•Nicaragua – 2•Peru – 7•Puerto Rico – 12•Trinidad – 2•Venezuela – 18
Non-Contiguous U.S.
Middle East/Africa•Bahrain – 8•Egypt – 4•Kuwait – 7•Oman – 5•Pakistan – 2•Qatar – 1•Saudi Arabia – 20•UAE – 3
Europe•Cyprus – 2•Ireland – 6•Portugal – 1•Russia – 10•UK – 87
International Opportunities
• Virtually all countries are below critical mass
• Added experienced International management
• Build presence in key markets (China, UK/Ireland, Korea, Mexico, Russia and India) and important regions (Latin/Central America, Middle East and Eastern Europe)
• 800 units under contractual commitment for development over the next 9 years
• Consider direct investment/joint ventures to accelerate growth, such as Beijing opportunity
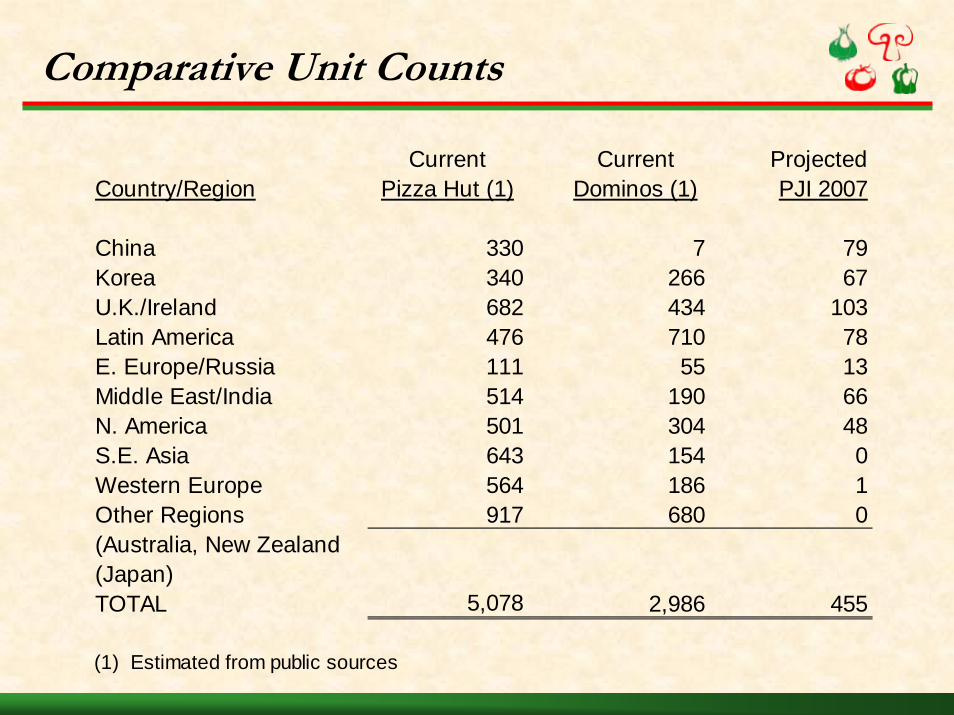
Comparative Unit Counts
Current Current ProjectedCountry/Region Pizza Hut (1) Dominos (1) PJI 2007
China 330 7 79Korea 340 266 67U.K./Ireland 682 434 103Latin America 476 710 78E. Europe/Russia 111 55 13Middle East/India 514 190 66N. America 501 304 48S.E. Asia 643 154 0Western Europe 564 186 1Other Regions 917 680 0(Australia, New Zealand(Japan)TOTAL 5,078 2,986 455
(1) Estimated from public sources
Economic Model Can Vary by Country
• Food cost can be an issue depending upon in-country supply chain sophistication
• Labor rates very low in many countries (e.g., Latin America countries) but facing substantial pressures in others (e.g., China and India)
• Rental costs can be challenging in certain countries due to availability (e.g., United Kingdom) or demand (e.g, China)
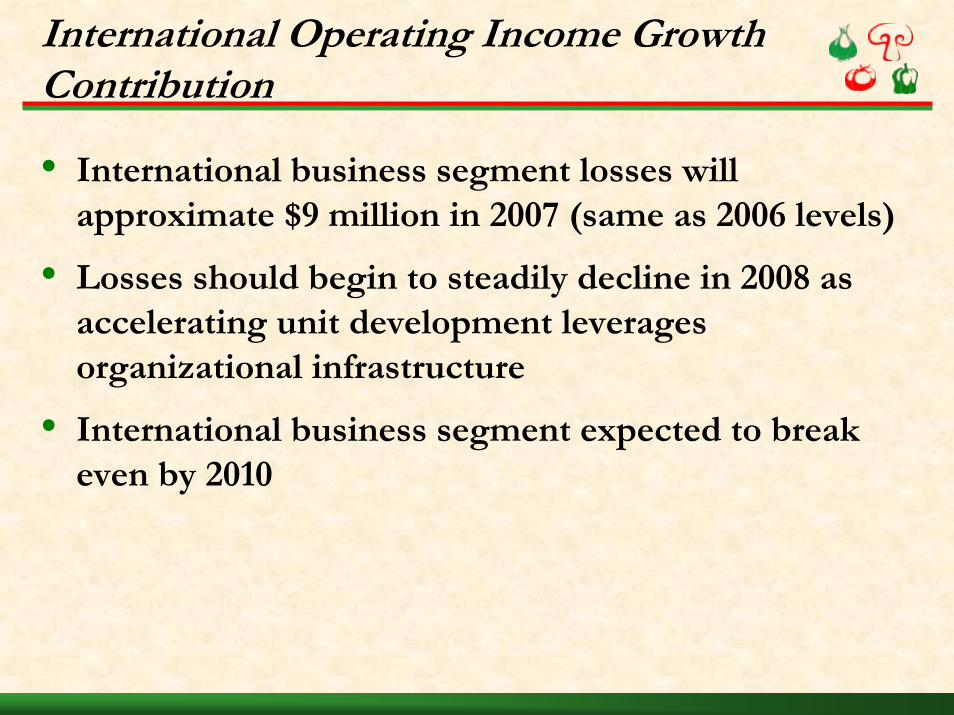
International Operating Income Growth Contribution
• International business segment losses will approximate $9 million in 2007 (same as 2006 levels)
• Losses should begin to steadily decline in 2008 as accelerating unit development leverages organizational infrastructure
• International business segment expected to break even by 2010
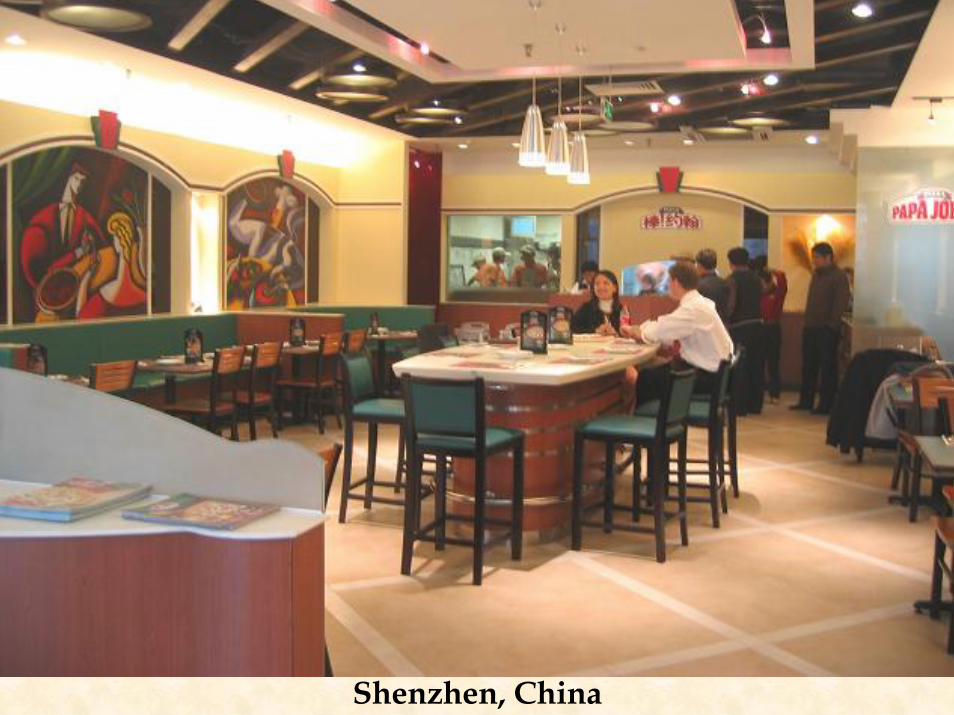
Shenzhen, China
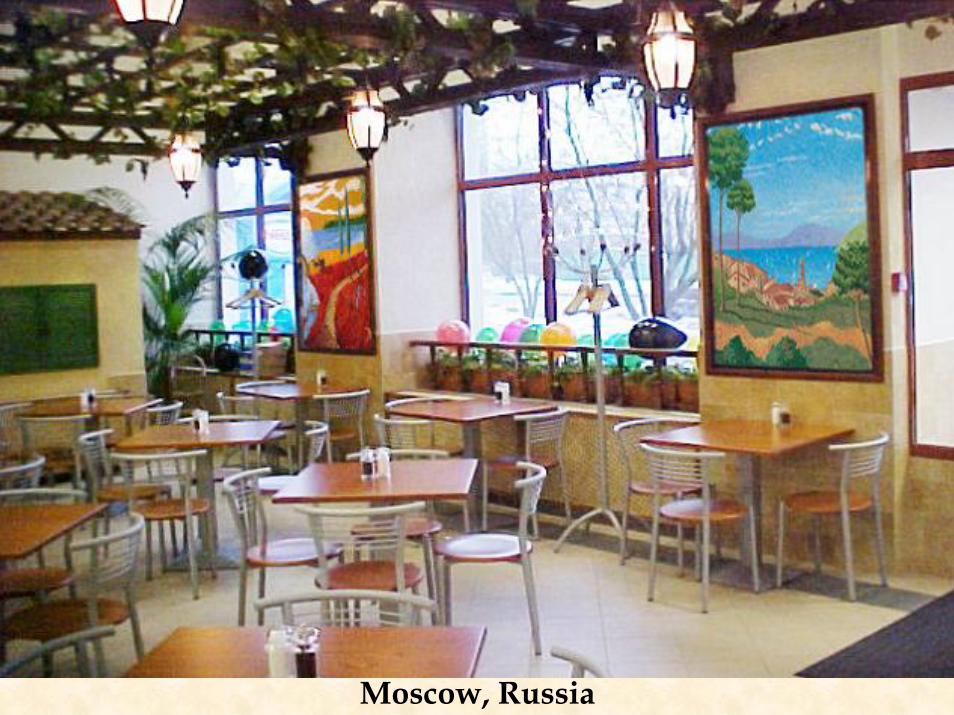
Moscow, Russia
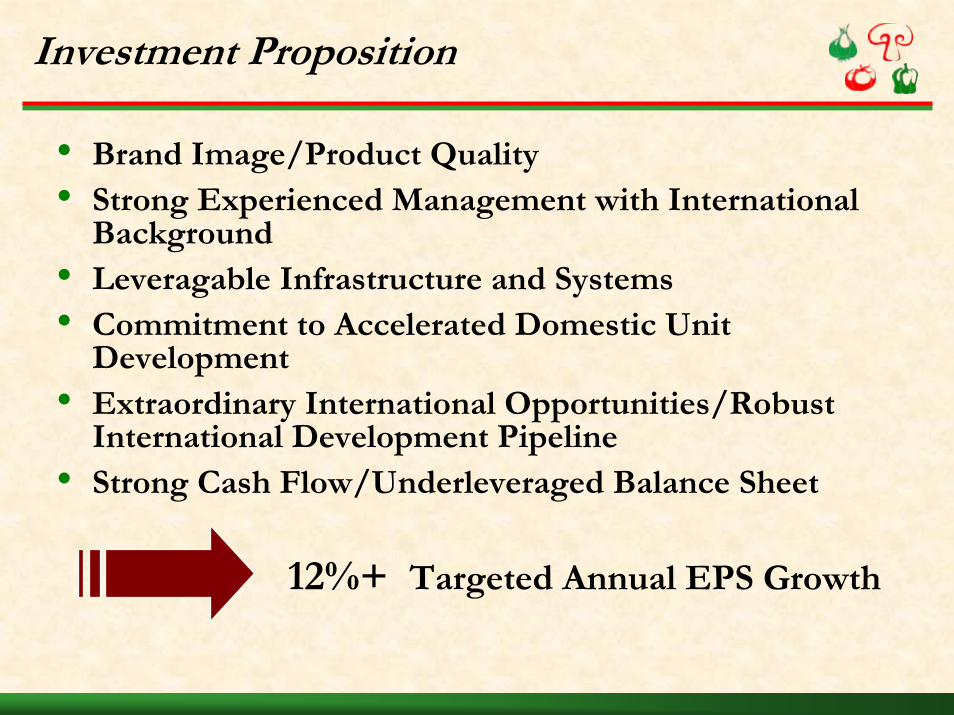
• Brand Image/Product Quality• Strong Experienced Management with International
Background• Leveragable Infrastructure and Systems• Commitment to Accelerated Domestic Unit
Development• Extraordinary International Opportunities/Robust
International Development Pipeline• Strong Cash Flow/Underleveraged Balance Sheet
Investment Proposition
12%+ Targeted Annual EPS Growth