kilde report 130
TRANSCRIPT

7/23/2019 Kilde Report 130
http://slidepdf.com/reader/full/kilde-report-130 1/6
Acoustics 2008 1
Acoustics 2008Geelong, Victoria, Australia 24 to 26 November 2008
Acoustics and Sustainability:
How should acoustics adapt to meet future
demands?
Comparison of Kilde Report 130 Rail Noise ModellingPredictions for SoundPLAN 4.2 and 6.5
Mark Batstone (1), Rhys Brown (2) and Jennifer Uhr (3)
(1) Network Systems & Capability, QR Network Pty Ltd, Brisbane, Australia
(2) Bassett Acoustics, part of AECOM, Brisbane, Australia
(3) Heggies Pty Ltd, Brisbane, Australia
ABSTRACT
Rail noise predictions in Queensland have historically been undertaken using a DOS-based implementation of the
SoundPLAN program. Rail noise levels modelled using this DOS program have been validated with measured noise
levels throughout the history of its use. This DOS package has been superseded by Windows-based implementations
of SoundPLAN. Queensland Rail Network has commissioned a study to compare the modelling results between the
currently accepted DOS-based version of SoundPLAN and the latest Windows-based implementation. The outcomes
of the study contained in this paper demonstrate why QR Network is now able to accept Windows SoundPLAN re-
sults for rail noise prediction projects within Queensland. Equivalent confidence in the modelled noise levels reduces
the amount of noise monitoring required at affected properties, leading to a more efficient and sustainable use of
available acoustical resources in Queensland. Such reliable noise modelling results therefore enable more efficient
delivery of mitigation measures to sensitive areas than can be achieved with reliance upon measurement results.
INTRODUCTION
Historically Queensland Rail (QR) has required rail noise
modelling in Queensland to be undertaken using the 1984
Nordic Rail Prediction Method - Kilde Report 130 (Ringheim
1984) as implemented in SoundPLAN 4.2 (a DOS-based soft-
ware package). Since its adoption as the preferred rail noise
modelling software by QR, it has been consistently validated
against rail noise measurements with an accuracy threshold of
± 2 dBA for Queensland locations typically within 100 metres
of the rail alignment (Heggies, 2007 & ERM, 2001).
In more recent years, Windows-based versions of Sound-PLAN have been released and supported rather than the previ-
ous DOS-based versions. Neither SoundPLAN’s manufac-
turer nor suppliers have provided support for SoundPLAN 4.2
since the year 2000. Communications with these companies
has suggested that no quality control process was in place to
ensure consistency and/or accuracy between the SoundPLAN
versions (certainly, for at least the Kilde Report 130 algo-
rithms). From these discussions, it was clear that the respon-
sibility for validating the new SoundPLAN versions lay with
the respective railway manager and/or environmental regula-
tor. It was for this reason that QR Network initiated the inves-
tigations presented in this paper.
The implementation of the Kilde Report 130 within the Win-
dows-based versions of SoundPLAN has never been formallyvalidated for rail applications in Australia. In order for rail
noise modelling to be undertaken within Queensland in the
most efficient manner, a process of validation was required for
the latest Windows-based SoundPLAN implementation of
Kilde Report 130 for Queensland conditions.
Rail noise modelling results from SoundPLAN 4.2 and
SoundPLAN 6.5 have been calculated and compared by two
independent acoustic consultancies with the aim of validating
SoundPLAN 6.5 for use on rail projects within Queensland.
The effect of various modelling techniques, inputs and as-
sumptions has also been investigated as part of this compari-
son study.
MODELLING METHODOLOGY
General
The Nordic Rail Traffic Noise prediction method - Kilde Re-
port 130 (Ringheim 1984) is the current QR endorsed rail
noise modelling method. The Kilde Report 130 is the earliest
standard in the series of Nordic rail noise modelling methods.
It was superseded in Scandinavian countries by NMT96
(Ringheim 1996) and Nord2000 (Jonasson 2001).
The Kilde Report 130 method enables both LAeq,24hour and
LAmax noise levels for rail movements to be predicted. In
Queensland, current legislative planning (“target”) levels are
based on both parameters.
For the purpose of this study a small test section was extractedfrom an existing SoundPLAN rail model for a current rail
upgrade project. The extracted section was trimmed to ap-
proximately 100 metres either side of the rail line. The section
was approximately 600 metres long and contained 33 noise-
7/23/2019 Kilde Report 130
http://slidepdf.com/reader/full/kilde-report-130 2/6
24-26 November 2008, Geelong, Australia Proceedings of ACOUSTICS 2008
2 Acoustics 2008
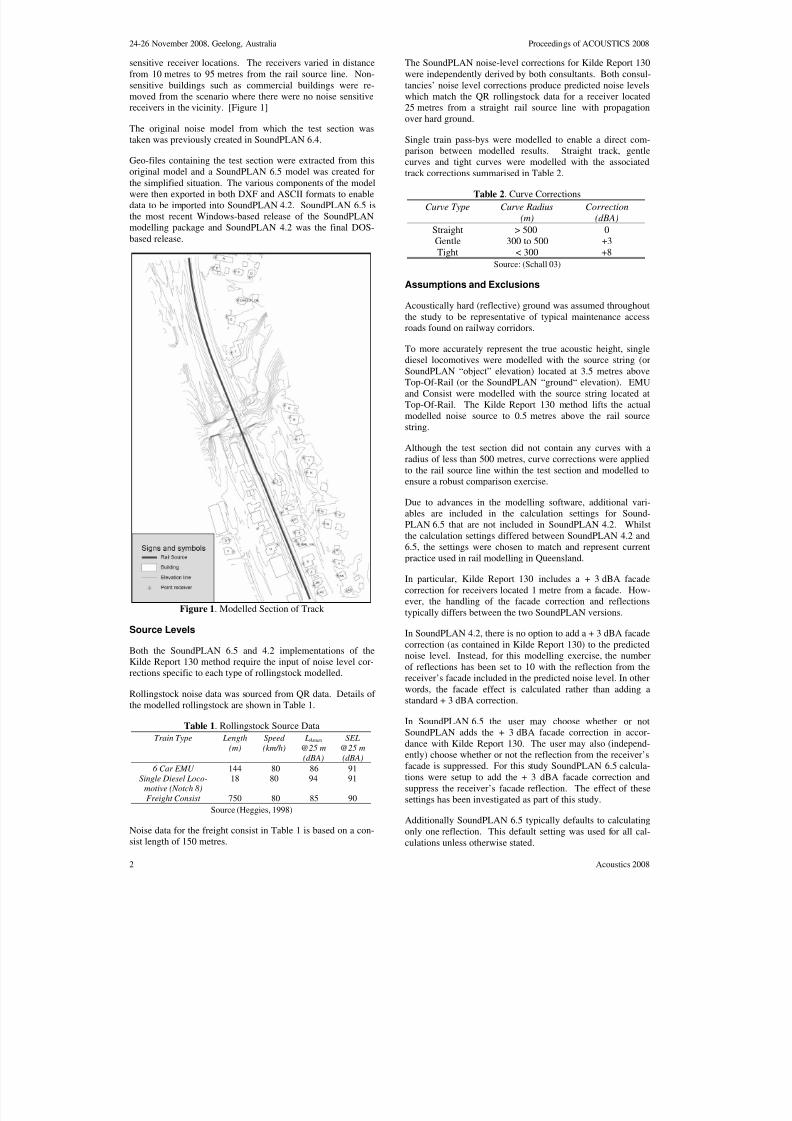
sensitive receiver locations. The receivers varied in distance
from 10 metres to 95 metres from the rail source line. Non-
sensitive buildings such as commercial buildings were re-
moved from the scenario where there were no noise sensitive
receivers in the vicinity. [Figure 1]
The original noise model from which the test section was
taken was previously created in SoundPLAN 6.4.
Geo-files containing the test section were extracted from thisoriginal model and a SoundPLAN 6.5 model was created for
the simplified situation. The various components of the model
were then exported in both DXF and ASCII formats to enable
data to be imported into SoundPLAN 4.2. SoundPLAN 6.5 is
the most recent Windows-based release of the SoundPLAN
modelling package and SoundPLAN 4.2 was the final DOS-
based release.
Figure 1. Modelled Section of Track
Source Levels
Both the SoundPLAN 6.5 and 4.2 implementations of the
Kilde Report 130 method require the input of noise level cor-
rections specific to each type of rollingstock modelled.
Rollingstock noise data was sourced from QR data. Details of
the modelled rollingstock are shown in Table 1.
Table 1. Rollingstock Source Data
Train Type Length
(m)
Speed
(km/h)
L Amax
@25 m
(dBA)
SEL
@25 m
(dBA)
6 Car EMU 144 80 86 91
Single Diesel Loco-
motive (Notch 8)
18 80 94 91
Freight Consist 750 80 85 90Source (Heggies, 1998)
Noise data for the freight consist in Table 1 is based on a con-
sist length of 150 metres.
The SoundPLAN noise-level corrections for Kilde Report 130
were independently derived by both consultants. Both consul-
tancies’ noise level corrections produce predicted noise levels
which match the QR rollingstock data for a receiver located
25 metres from a straight rail source line with propagation
over hard ground.
Single train pass-bys were modelled to enable a direct com-
parison between modelled results. Straight track, gentle
curves and tight curves were modelled with the associatedtrack corrections summarised in Table 2.
Table 2. Curve Corrections
Curve Type Curve Radius
(m)
Correction
(dBA)
Straight > 500 0
Gentle 300 to 500 +3
Tight < 300 +8
Source: (Schall 03)
Assumptions and Exclusions
Acoustically hard (reflective) ground was assumed throughout
the study to be representative of typical maintenance accessroads found on railway corridors.
To more accurately represent the true acoustic height, single
diesel locomotives were modelled with the source string (or
SoundPLAN “object” elevation) located at 3.5 metres above
Top-Of-Rail (or the SoundPLAN “ground“ elevation). EMU
and Consist were modelled with the source string located at
Top-Of-Rail. The Kilde Report 130 method lifts the actual
modelled noise source to 0.5 metres above the rail source
string.
Although the test section did not contain any curves with a
radius of less than 500 metres, curve corrections were applied
to the rail source line within the test section and modelled to
ensure a robust comparison exercise.
Due to advances in the modelling software, additional vari-
ables are included in the calculation settings for Sound-
PLAN 6.5 that are not included in SoundPLAN 4.2. Whilst
the calculation settings differed between SoundPLAN 4.2 and
6.5, the settings were chosen to match and represent current
practice used in rail modelling in Queensland.
In particular, Kilde Report 130 includes a + 3 dBA facade
correction for receivers located 1 metre from a facade. How-
ever, the handling of the facade correction and reflections
typically differs between the two SoundPLAN versions.
In SoundPLAN 4.2, there is no option to add a + 3 dBA facade
correction (as contained in Kilde Report 130) to the predictednoise level. Instead, for this modelling exercise, the number
of reflections has been set to 10 with the reflection from the
receiver’s facade included in the predicted noise level. In other
words, the facade effect is calculated rather than adding a
standard + 3 dBA correction.
In SoundPLAN 6.5 the user may choose whether or not
SoundPLAN adds the + 3 dBA facade correction in accor-
dance with Kilde Report 130. The user may also (independ-
ently) choose whether or not the reflection from the receiver’s
facade is suppressed. For this study SoundPLAN 6.5 calcula-
tions were setup to add the + 3 dBA facade correction and
suppress the receiver’s facade reflection. The effect of these
settings has been investigated as part of this study.
Additionally SoundPLAN 6.5 typically defaults to calculating
only one reflection. This default setting was used for all cal-
culations unless otherwise stated.

7/23/2019 Kilde Report 130
http://slidepdf.com/reader/full/kilde-report-130 3/6
Proceedings of ACOUSTICS 2008 24-26 November 2008, Geelong, Australia
Acoustics 2008 3
The search radius for the SoundPLAN 6.5 calculations was
limited to 500 metres.
These modelling parameters and assumptions have been cho-
sen to reflect the modelling technique considered to be the
most common and are consistent with legislation applied in
Queensland (Environmental Protection (Noise) Policy,
EPP(Noise) 1997). The EPP(Noise) states that railway noise
shall be assessed 1 metre from the most exposed façade of the
sensitive place.
RESULTS
The noise modelling results for both SoundPLAN 4.2 and 6.5
from the two consultancies were compared for consistency.
For both SoundPLAN 4.2 and 6.5, the predicted noise levels
produced by each consultant were comparable and showed
good agreement.
A comparison of the SoundPLAN 4.2 and 6.5 predictions
showed the prediction differences for all but one (1) receiver
were within ± 2 dBA for both consultants’ results. Further-
more, more than half of the receivers had prediction differ-
ences within ± 1 dBA.
A brief analysis of the prediction differences is shown for
three scenarios in Tables 3, 4 and 5.
Table 3. EMU Straight Track Prediction Differences
Consultant 1 Consultant 2Statistical
Parameter L Aeq,24hr
(dBA)
L Amax
(dBA)
L Aeq,24hr
(dBA)
L Amax
(dBA)
Arithmetic Average: + 0.8 + 0.4 + 0.8 + 0.4
Standard Deviation: 0.6 0.9 0.6 0.9
Minimum: - 0.7 - 1.8 - 0.6 - 1.8Maximum: + 2.4 + 2.7 + 2.4 + 2.7
No. within ± 1 dBA 23 24 23 25
No. within ± 2 dBA 32 32 32 32
Sample Size: 33 33 33 33
Note: Average, Standard Deviation, Minimum and Maximum in dBA.A positive value indicates SoundPLAN 6.5 prediction higher than
SoundPLAN 4.2.
Table 4. Locomotive Straight Track Prediction Differences
Consultant 1 Consultant 2Statistical
Parameter L Aeq,24hr
(dBA)
L Amax
(dBA)
L Aeq,24hr
(dBA)
L Amax
(dBA)
Arithmetic Average: + 1.2 + 0.8 + 1.2 + 0.8
Standard Deviation: 0.5 0.6 0.5 0.6Minimum: + 0.6 - 1.0 + 0.6 - 1.0
Maximum: + 2.6 + 3.2 + 2.7 + 3.2
No. within ± 1 dBA 19 26 20 27No. within ±2 dBA 31 32 32 32
Sample Size: 33 33 33 33
Note: Average, Standard Deviation, Minimum and Maximum in dBA.
A positive value indicates SoundPLAN 6.5 prediction higher thanSoundPLAN 4.2.
Table 5. Consist Straight Track Prediction Differences
Consultant 1 Consultant 2Statistical
Parameter L Aeq,24hr
(dBA)
L Amax
(dBA)
L Aeq,24hr
(dBA)
L Amax
(dBA)
Arithmetic Average: + 0.8 + 0.7 + 0.8 + 0.7
Standard Deviation: 0.7 0.7 0.6 0.6
Minimum: - 0.8 - 0.9 - 0.7 - 0.7
Maximum: + 2.4 + 2.2 + 2.4 + 2.3No. within ±1 dBA 23 25 23 26
No. within ±2 dBA 32 32 32 32
Sample Size: 33 33 33 33
Note: Average, Standard Deviation, Minimum and Maximum in dBA.
A positive value indicates SoundPLAN 6.5 prediction higher than
SoundPLAN 4.2.
Earlier comparison exercises between DOS and Windows-
based versions of SoundPLAN identified possible modelling
discrepancies in the vicinity of curved track sections. For this
reason, curved-track corrections were applied to both the
EMU and Consist scenarios to test that the corrections were
similarly added in both versions of SoundPLAN.
The resultant prediction differences between SoundPLAN 4.2
and 6.5 were identical to those for the straight track scenarios.
As expected, this indicates that the predicted noise levels in
both versions were simply increased by the value of the curve
correction addition.
No track corrections were modelled for Locomotives, as the
wheel/rail interaction is not the dominant noise source for this
type of rollingstock.
The results show that generally SoundPLAN 6.5 will give a
slightly higher prediction than SoundPLAN 4.2 and is there-
fore likely to produce a slightly more conservative result than
the traditional DOS modelling.
OTHER OUTCOMES
LAmax Source Corrections
The Kilde Report 130 describes two separate components for
predicting LAmax noise levels: -
•
a point source to represent the locomotive engine; and
• a finite line source to represent the entire train set.
The two components are then added together logarithmically
to derive the overall LAmax level. Accordingly, the source
input dialogue for the Kilde Report 130 method within
SoundPLAN contains two LAmax correction options: –
• an “engine” LAmax (point source); and
•
a “wagon” LAmax (finite line source).
An investigation into the predicted noise levels using each of
these correction options for a simple straight track section with
receivers at 10, 15 and 25 metres was undertaken.
The predicted noise levels indicated that the “engine” LAmax
calculated the attenuation with distance as approximately
36 log10(d2 /d1). In comparison, the “wagon” correction pre-
dicted the distance attenuation as 18 log10(d2 /d1) for a model
over flat, hard ground.
It must be noted the formulae contained within Kilde Report
130 are semi-empirical. They were partially derived from rail
noise measurements undertaken in Finland. Due to opera-
tional and safety constraints there are no QR endorsed rolling-
stock measurements closer than 25 metres from the source for
Queensland rollingstock. Accordingly, it was deemed inap-
propriate to model rollingstock attenuation levels higher than
that of basic acoustic principles (i.e. 20 log10(d2 /d1) for a pointsource).
Based on these findings, all modelling for the comparison
study has used the “wagon” LAmax correction.
Split Rail Source Strings
During the comparison process, it was discovered that the
SoundPLAN 4.2 and SoundPLAN 6.5 implementation of
Kilde Report 130 handles split source strings differently when
predicting LAmax levels.
When a track is modelled using multiple strings (i.e. source
strings that are not one continuous source string from start to
end) SoundPLAN 6.5 was found to underpredict the LAmax noise levels by up to 2.5 dBA compared to the same section of
track modelled using a continuous string. The LAeq,24hour pa-
rameter was not affected.

7/23/2019 Kilde Report 130
http://slidepdf.com/reader/full/kilde-report-130 4/6
24-26 November 2008, Geelong, Australia Proceedings of ACOUSTICS 2008
4 Acoustics 2008
The SoundPLAN 4.2 implementation did not demonstrate this
behaviour and predicted the same LAmax levels for both a con-
tinuous and split string. This phenomenon was tested for the
extracted section of track [Figure 2] and for a simple straight
track section [Figure 3].
Figure 2. Split Rail Source Line and Receivers Affected bySplit String
Figure 3. Continuous (Top) and Split (Bottom) Rail Source
Lines – SoundPLAN 6.5 - LAmax
It is believed that SoundPLAN 6.5 calculates LAmax levels for
each rail string separately and at the start of a new rail string
does not include contributions from the full train length. This
behaviour was observed using the SoundPLAN animated gridmap function.
On this basis, SoundPLAN 6.5 is likely to underpredict L Amax
noise levels at a receiver directly adjacent to a split in a rail
source line by up to 3 dBA.
Therefore when using the SoundPLAN 6.5 implementation of
Kilde Report 130, care must be taken to avoid using split
source strings when modelling LAmax noise levels.
Noise Barriers
A comparison of modelled noise levels with the inclusion of a
noise barrier was undertaken. A 2.1 metre high noise barrier
was added to the straight track test scenario for the EMU and
Consist sources in both SoundPLAN 4.2 and 6.5. The barrier
was approximately 90 metres long and located at a distance of
6 metres from the rail source line. It provided noise mitigation
to 11 receivers.
The predicted attenuation from the barrier for SoundPLAN 4.2
was on average 1.3 dBA higher than the attenuation predicted
by SoundPLAN 6.5.
A 4.5 metre high barrier was similarly modelled for the loco-
motive to ensure that the barrier broke line-of-sight with the
elevated source line.
A brief analysis of the prediction differences for the barriers is
shown in Tables 6, 7 and 8.
Table 6. EMU Noise Barrier Attenuation Differences
Statistical
Parameter
L Aeq,24hr
(dBA)
L Amax
(dBA)
Arithmetic Average: + 1.3 + 1.3Standard Deviation: 0.9 0.9
Minimum: 0.0 - 0.1
Maximum: + 2.7 + 2.5No. within ± 1 dBA 4 4
No. within ± 2 dBA 9 8
Sample Size: 11 11
Note: Average, Standard Deviation, Minimum and Maximum in dBA.A positive value indicates SoundPLAN 6.5 prediction higher than
SoundPLAN 4.2.
Table 7. Locomotive Noise Barrier Attenuation Differences
Statistical
Parameter
L Aeq,24hr
(dBA)
L Amax
(dBA)
Arithmetic Average: + 0.4 + 0.4
Standard Deviation: 0.4 0.9
Minimum: - 0.2 - 0.8Maximum: + 1.2 + 2.1
No. within ± 1 dBA 10 9
No. within ± 2 dBA 11 10Sample Size: 11 11
Note: Average, Standard Deviation, Minimum and Maximum in dBA.
A positive value indicates SoundPLAN 6.5 prediction higher than
SoundPLAN 4.2.
Table 8. Consist Noise Barrier Attenuation Differences
Statistical
Parameter
L Aeq,24hr
(dBA)
L Amax
(dBA)
Arithmetic Average: + 1.4 + 1.3
Standard Deviation: 0.9 0.9Minimum: - 0.1 - 0.1
Maximum: + 2.8 + 2.7No. within ± 1 dBA 4 4
No. within ± 2 dBA 9 9
Sample Size: 11 11
Note: Average, Standard Deviation, Minimum and Maximum in dBA.
A positive value indicates SoundPLAN 6.5 prediction higher than
SoundPLAN 4.2.
Based on prediction differences in Tables 6, 7 and 8, it is con-
cluded SoundPLAN 6.5 produces conservative predictions for
barrier attenuation compared to SoundPLAN 4.2.
7/23/2019 Kilde Report 130
http://slidepdf.com/reader/full/kilde-report-130 5/6
Proceedings of ACOUSTICS 2008 24-26 November 2008, Geelong, Australia
Acoustics 2008 5
It is noteworthy that the closest agreement was demonstrated
in Table 7 for Locomotive Engines. Locomotive engine noise
typically drives noise barrier design heights to achieve Queen-
sland legislative target levels. Therefore this close agreement
is a welcome outcome.
Facade Correction and Reflections
As previously discussed facade corrections and reflections are
generally handled differently between SoundPLAN 4.2 and6.5.
To investigate this further the SoundPLAN 6.5 predictions
were repeated using reflection calculation settings more simi-
lar to those used for the SoundPLAN 4.2 modelling.
A Reflection Order of 10 was selected along with a Reflection
Depth of 0. The + 3 dBA facade correction was omitted from
the predicted noise levels. Instead, the reflection of the re-
ceiver’s facade was included to calculate the facade effect.
An analysis of the prediction differences using these settings
showed there was typically still one receiver with a prediction
difference outside ± 2 dBA. Most of the receivers had predic-
tion differences within ± 1 dBA.
A brief analysis of the prediction differences is shown in Ta-
bles 9, 10 and 11 for comparison with the previous results.
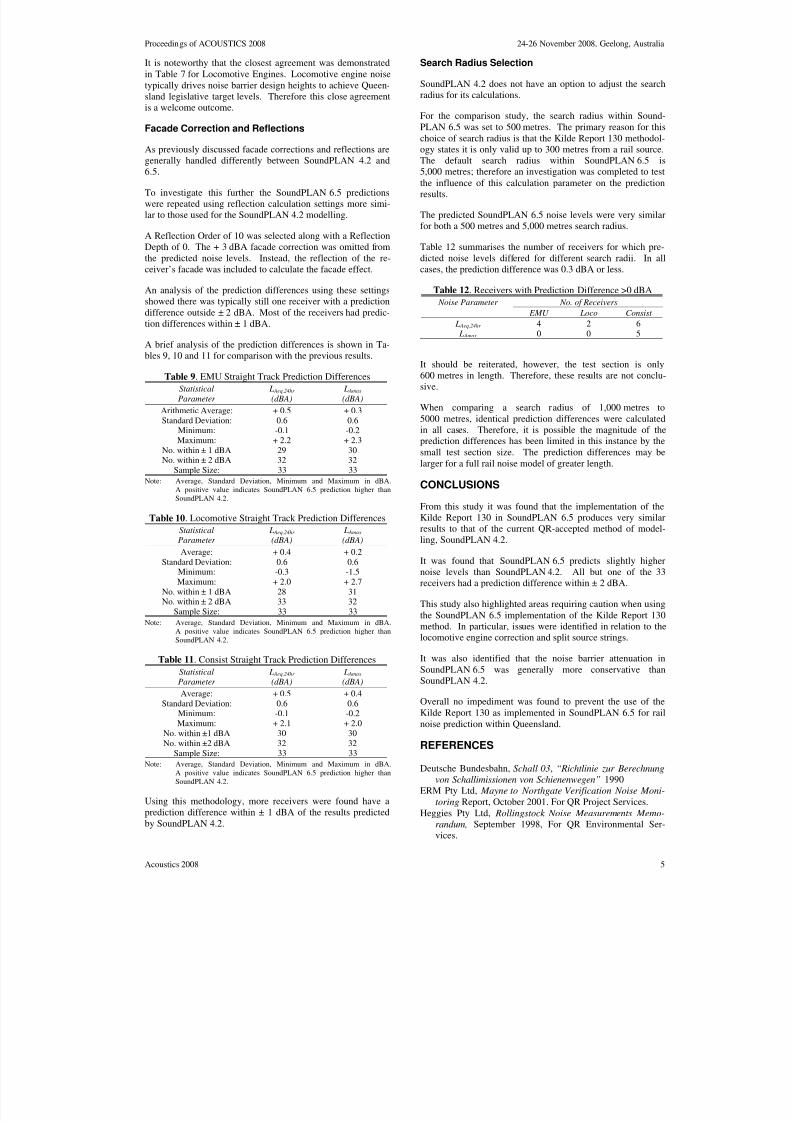
Table 9. EMU Straight Track Prediction Differences
Statistical
Parameter
L Aeq,24hr
(dBA)
L Amax
(dBA)
Arithmetic Average: + 0.5 + 0.3
Standard Deviation: 0.6 0.6Minimum: -0.1 -0.2
Maximum: + 2.2 + 2.3
No. within ± 1 dBA 29 30No. within ± 2 dBA 32 32
Sample Size: 33 33
Note: Average, Standard Deviation, Minimum and Maximum in dBA.A positive value indicates SoundPLAN 6.5 prediction higher than
SoundPLAN 4.2.
Table 10. Locomotive Straight Track Prediction Differences
Statistical
Parameter
L Aeq,24hr
(dBA)
L Amax
(dBA)
Average: + 0.4 + 0.2
Standard Deviation: 0.6 0.6Minimum: -0.3 -1.5
Maximum: + 2.0 + 2.7
No. within ± 1 dBA 28 31No. within ± 2 dBA 33 32
Sample Size: 33 33
Note: Average, Standard Deviation, Minimum and Maximum in dBA.
A positive value indicates SoundPLAN 6.5 prediction higher than
SoundPLAN 4.2.
Table 11. Consist Straight Track Prediction Differences
Statistical
Parameter
L Aeq,24hr
(dBA)
L Amax
(dBA)
Average: + 0.5 + 0.4
Standard Deviation: 0.6 0.6Minimum: -0.1 -0.2
Maximum: + 2.1 + 2.0
No. within ±1 dBA 30 30
No. within ±2 dBA 32 32
Sample Size: 33 33
Note: Average, Standard Deviation, Minimum and Maximum in dBA.
A positive value indicates SoundPLAN 6.5 prediction higher than
SoundPLAN 4.2.
Using this methodology, more receivers were found have aprediction difference within ± 1 dBA of the results predicted
by SoundPLAN 4.2.
Search Radius Selection
SoundPLAN 4.2 does not have an option to adjust the search
radius for its calculations.
For the comparison study, the search radius within Sound-
PLAN 6.5 was set to 500 metres. The primary reason for this
choice of search radius is that the Kilde Report 130 methodol-
ogy states it is only valid up to 300 metres from a rail source.
The default search radius within SoundPLAN 6.5 is5,000 metres; therefore an investigation was completed to test
the influence of this calculation parameter on the prediction
results.
The predicted SoundPLAN 6.5 noise levels were very similar
for both a 500 metres and 5,000 metres search radius.
Table 12 summarises the number of receivers for which pre-
dicted noise levels differed for different search radii. In all
cases, the prediction difference was 0.3 dBA or less.
Table 12. Receivers with Prediction Difference >0 dBA
No. of Receivers Noise Parameter
EMU Loco Consist
L Aeq,24hr 4 2 6
L Amax 0 0 5
It should be reiterated, however, the test section is only
600 metres in length. Therefore, these results are not conclu-
sive.
When comparing a search radius of 1,000 metres to
5000 metres, identical prediction differences were calculated
in all cases. Therefore, it is possible the magnitude of the
prediction differences has been limited in this instance by the
small test section size. The prediction differences may be
larger for a full rail noise model of greater length.
CONCLUSIONS
From this study it was found that the implementation of the
Kilde Report 130 in SoundPLAN 6.5 produces very similar
results to that of the current QR-accepted method of model-
ling, SoundPLAN 4.2.
It was found that SoundPLAN 6.5 predicts slightly higher
noise levels than SoundPLAN 4.2. All but one of the 33
receivers had a prediction difference within ± 2 dBA.
This study also highlighted areas requiring caution when using
the SoundPLAN 6.5 implementation of the Kilde Report 130
method. In particular, issues were identified in relation to the
locomotive engine correction and split source strings.
It was also identified that the noise barrier attenuation in
SoundPLAN 6.5 was generally more conservative than
SoundPLAN 4.2.
Overall no impediment was found to prevent the use of the
Kilde Report 130 as implemented in SoundPLAN 6.5 for rail
noise prediction within Queensland.
REFERENCES
Deutsche Bundesbahn, Schall 03, “Richtlinie zur Berechnung
von Schallimissionen von Schienenwegen” 1990
ERM Pty Ltd, Mayne to Northgate Verification Noise Moni-
toring Report, October 2001. For QR Project Services.Heggies Pty Ltd, Rollingstock Noise Measurements Memo-
randum, September 1998, For QR Environmental Ser-
vices.

7/23/2019 Kilde Report 130
http://slidepdf.com/reader/full/kilde-report-130 6/6
24-26 November 2008, Geelong, Australia Proceedings of ACOUSTICS 2008
6 Acoustics 2008
Heggies Pty Ltd, Ipswich Line (Dinmore to Ipswich) Noise
Monitoring Study, November 2007. For QR Project Ser-
vices.
Jonasson, H and Storeheir , S, Nord2000. New Nordic Predic-
tion Method for Rail Traffic Noise, 2001 Swedish National
testing and Research Institute, Boras
Office of the Queensland Parliamentary Counsel, Environ-
mental Protection (Noise) Policy 1997.
Ringheim, M, KILDE Report 130, 1984, Stockholm
Ringheim, M, Railway Traffic Noise – The Nordic Prediction Method, 1996, Copenhagen