kmefic research the petrochemical sector in saudi s 5 forces on the petrochemical industry ......
TRANSCRIPT
Source: Reuters
Expected rate of return on equity in GCC
KMEFIC Research
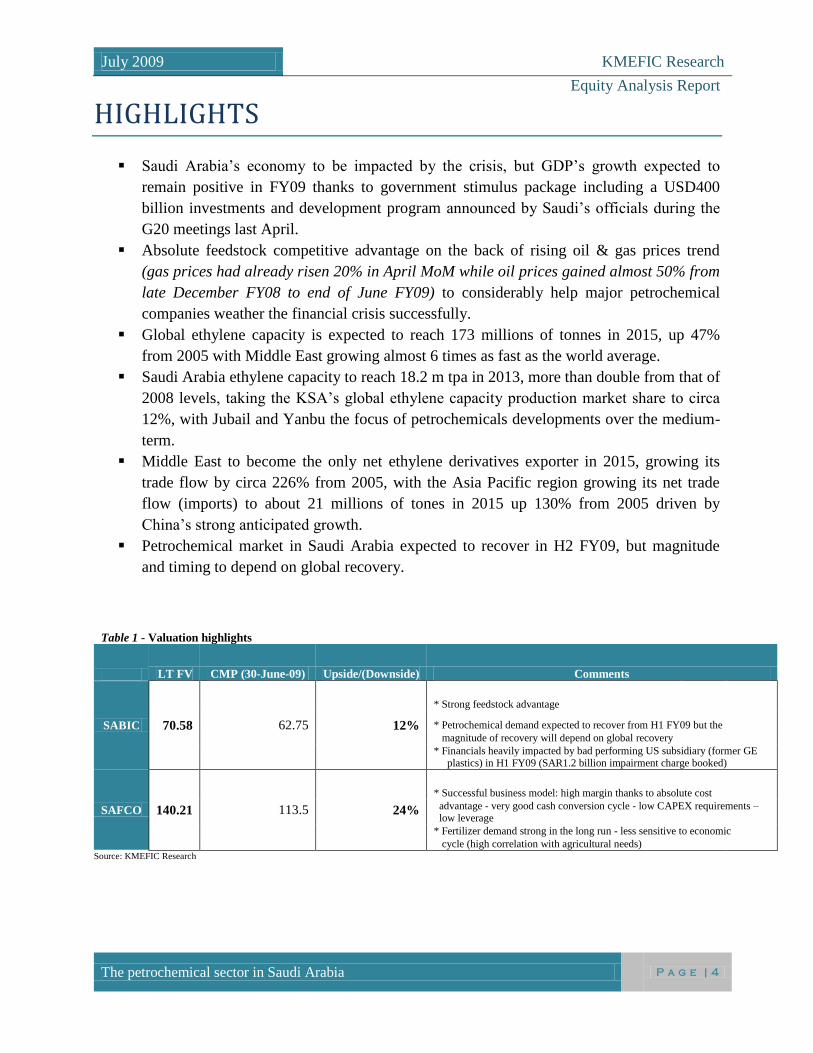
The petrochemical sector in Saudi Arabia:
An understanding of the industry and review of its
prospects, including investment opinions on 2 key
sector players: SABIC and SAFCO.
July 2009
KMEFIC Research Department
م .ك.م.شركة الكويت والشرق األوسط لإلستثمارالمالي ش
Kuwait and Middle East Financial Investment Company K.S.C.C
INTRODUCTION........................................................................................................................................................ 3
HIGHLIGHTS ............................................................................................................................................................. 4
PETROCHEMICAL INDEX VS. TADAWUL ......................................................................................................... 5
PORTER’S 5 FORCES ON THE PETROCHEMICAL INDUSTRY .................................................................... 6
THREAT OF NEW ENTRANTS ................................................................................................................................... 7 SUPPLIERS POWER .................................................................................................................................................... 7 THREAT OF SUBSTITUTES ....................................................................................................................................... 7 BUYERS POWER ......................................................................................................................................................... 7 BUSINESS RIVALRY .................................................................................................................................................. 7
BASIC PRODUCTION FLOW .................................................................................................................................. 9
PETROCHEMICAL ...................................................................................................................................................... 9 FERTILIZER ................................................................................................................................................................. 9
MACROECONOMIC OVERVIEW ........................................................................................................................ 11
GROSS DOMESTIC PRODUCT & KEY GROWTH INDICATORS......................................................................... 11 OIL VULNERABILITY .............................................................................................................................................. 13 THE GLOBAL FINANCIAL CRISIS .......................................................................................................................... 13
OIL & GAS OUTLOOK ........................................................................................................................................... 15
MARKET DYNAMICS ............................................................................................................................................... 15 OIL OUTLOOK ........................................................................................................................................................... 16 GAS OUTLOOK .......................................................................................................................................................... 17
FEEDSTOCK COST ADVANTAGE ...................................................................................................................... 18
CAPACITY AND INFRASTRUCTURES............................................................................................................... 19
SAUDI BASIC INDUSTRIES CORPORATION (SABIC) .................................................................................... 21
COMPANY & BUSINESS OVERVIEW .................................................................................................................... 22 FINANCIAL PERFORMANCE & VALUATION ...................................................................................................... 22 PROJECTS, STRATEGY ............................................................................................................................................ 23
SAUDI ARABIAN FERTILIZER COMPANY (SAFCO) ..................................................................................... 24
COMPANY & BUSINESS OVERVIEW .................................................................................................................... 25 FINANCIAL PERFORMANCE & VALUATION ...................................................................................................... 25 PROJECTS, STRATEGY ............................................................................................................................................ 26
APPENDIXES ............................................................................................................................................................ 27
SABIC BALANCE SHEETS ....................................................................................................................................... 27 SABIC INCOME STATEMENTS ............................................................................................................................... 27 SABIC CASH FLOW STATEMENTS ........................................................................................................................ 28 SAFCO BALANCE SHEETS ...................................................................................................................................... 28 SAFCO INCOME STATEMENTS .............................................................................................................................. 29 SAFCO CASH FLOW STATEMENTS ....................................................................................................................... 29
July 2009 KMEFIC Research
Equity Analysis Report
The petrochemical sector in Saudi Arabia
P a g e | 3
INTRODUCTION
As the world tries to anticipate and looks out for potential signs of recovery, attention is
unavoidably drawn to basic commodities such as oil and gas whose availability and prices partly
shape the world growth. This has become even more relevant to petrochemical companies in the
Middle East whose competitive advantage lies in the feedstock of their activities and whose
profitability is therefore highly conditioned to oil and gas prices. Among GCC countries, one in
particular, thanks to its abundant natural resources, has gained prominence on the global
petrochemical scene. In less than a few decades, Saudi Arabia has become the largest producer of
petrochemical products in the Middle East, accounting for about 6% of the global ethylene
capacity in 2007 or 7 million tonnes, up 600% from 20041. Indeed, the gulf country which
possesses around 20% of the world’s proven oil reserves (or 266.7 billion barrels2) and enjoys the
fourth largest natural gas reserves in the world (258.4 trillion cubic feet2) in 2008 (year end) has
long provided its successful home companies with an undisputable and sustainable strategic
competitive advantage. Basic chemical products prices being highly correlated with oil and gas
prices, the petrochemical industry in Saudi Arabia has displayed strong growth and high
profitability since 2000. But this golden growth unexpectedly stopped in H2 2008 as oil prices
fell dramatically from a record USD147 per barrel in July 2008 to about USD40 per barrel at
2008 year end, with most petrochemical prices going down subsequently amid worldwide
equities meltdown. Though oil prices recovered higher levels in H1 2009, the global crisis has
posed challenging questions regarding the expected growth and profitability of the petrochemical
sector. This report provides an overall understanding of the petrochemical industry in Saudi
Arabia, addresses some key factors to its prospects and presents valuation of two leading Saudi
companies in their industry: Saudi Basic Industries Corporation, SABIC (petrochemicals) and
Saudi Arabian Fertilizer Company, SAFCO (fertilizers).
1 Energy International Administration, 2008
2 Oil & Gas Journal, 2009
July 2009 KMEFIC Research
Equity Analysis Report
The petrochemical sector in Saudi Arabia
P a g e | 4
HIGHLIGHTS
Saudi Arabia’s economy to be impacted by the crisis, but GDP’s growth expected to
remain positive in FY09 thanks to government stimulus package including a USD400
billion investments and development program announced by Saudi’s officials during the
G20 meetings last April.
Absolute feedstock competitive advantage on the back of rising oil & gas prices trend
(gas prices had already risen 20% in April MoM while oil prices gained almost 50% from
late December FY08 to end of June FY09) to considerably help major petrochemical
companies weather the financial crisis successfully.
Global ethylene capacity is expected to reach 173 millions of tonnes in 2015, up 47%
from 2005 with Middle East growing almost 6 times as fast as the world average.
Saudi Arabia ethylene capacity to reach 18.2 m tpa in 2013, more than double from that of
2008 levels, taking the KSA’s global ethylene capacity production market share to circa
12%, with Jubail and Yanbu the focus of petrochemicals developments over the medium-
term.
Middle East to become the only net ethylene derivatives exporter in 2015, growing its
trade flow by circa 226% from 2005, with the Asia Pacific region growing its net trade
flow (imports) to about 21 millions of tones in 2015 up 130% from 2005 driven by
China’s strong anticipated growth.
Petrochemical market in Saudi Arabia expected to recover in H2 FY09, but magnitude
and timing to depend on global recovery.
Table 1 - Valuation highlights
LT FV CMP (30-June-09) Upside/(Downside) Comments
SABIC 70.58 62.75 12%
* Strong feedstock advantage
* Petrochemical demand expected to recover from H1 FY09 but the
magnitude of recovery will depend on global recovery
* Financials heavily impacted by bad performing US subsidiary (former GE plastics) in H1 FY09 (SAR1.2 billion impairment charge booked)
SAFCO 140.21 113.5 24%
* Successful business model: high margin thanks to absolute cost
advantage - very good cash conversion cycle - low CAPEX requirements – low leverage
* Fertilizer demand strong in the long run - less sensitive to economic
cycle (high correlation with agricultural needs) Source: KMEFIC Research
July 2009 KMEFIC Research
Equity Analysis Report
The petrochemical sector in Saudi Arabia
P a g e | 5
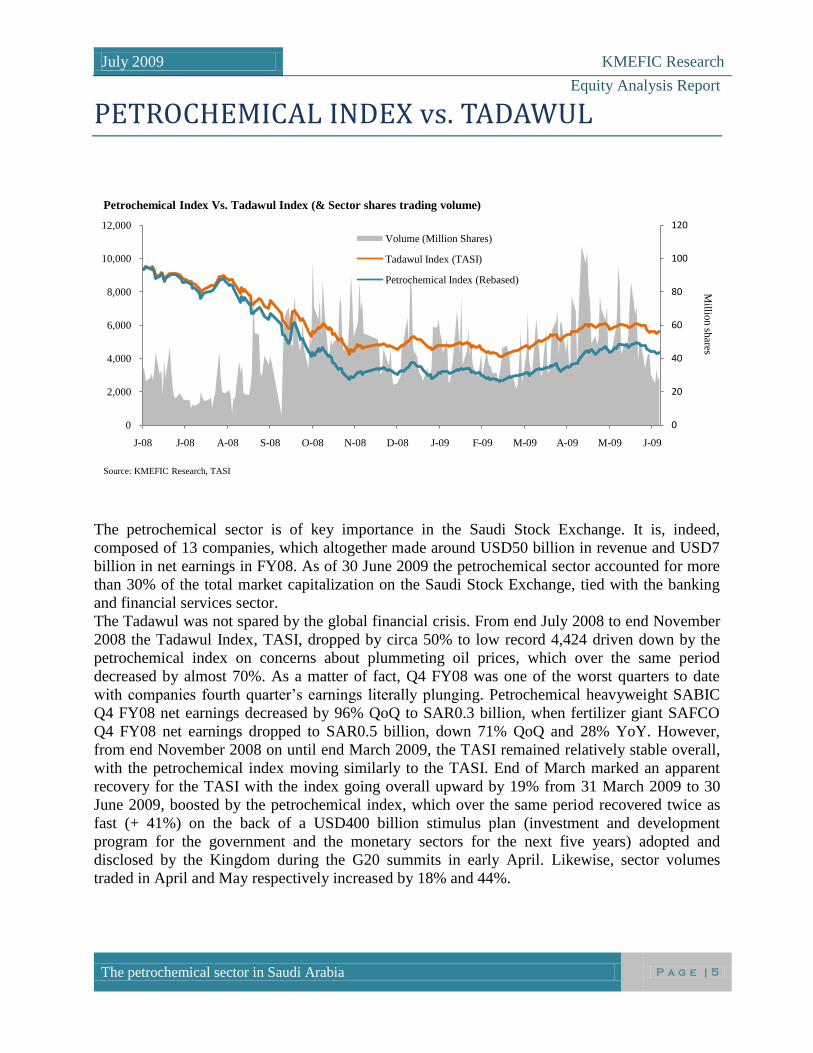
PETROCHEMICAL INDEX vs. TADAWUL
The petrochemical sector is of key importance in the Saudi Stock Exchange. It is, indeed,
composed of 13 companies, which altogether made around USD50 billion in revenue and USD7
billion in net earnings in FY08. As of 30 June 2009 the petrochemical sector accounted for more
than 30% of the total market capitalization on the Saudi Stock Exchange, tied with the banking
and financial services sector.
The Tadawul was not spared by the global financial crisis. From end July 2008 to end November
2008 the Tadawul Index, TASI, dropped by circa 50% to low record 4,424 driven down by the
petrochemical index on concerns about plummeting oil prices, which over the same period
decreased by almost 70%. As a matter of fact, Q4 FY08 was one of the worst quarters to date
with companies fourth quarter’s earnings literally plunging. Petrochemical heavyweight SABIC
Q4 FY08 net earnings decreased by 96% QoQ to SAR0.3 billion, when fertilizer giant SAFCO
Q4 FY08 net earnings dropped to SAR0.5 billion, down 71% QoQ and 28% YoY. However,
from end November 2008 on until end March 2009, the TASI remained relatively stable overall,
with the petrochemical index moving similarly to the TASI. End of March marked an apparent
recovery for the TASI with the index going overall upward by 19% from 31 March 2009 to 30
June 2009, boosted by the petrochemical index, which over the same period recovered twice as
fast (+ 41%) on the back of a USD400 billion stimulus plan (investment and development
program for the government and the monetary sectors for the next five years) adopted and
disclosed by the Kingdom during the G20 summits in early April. Likewise, sector volumes
traded in April and May respectively increased by 18% and 44%.
0
20
40
60
80
100
120
0
2,000
4,000
6,000
8,000
10,000
12,000
J-08 J-08 A-08 S-08 O-08 N-08 D-08 J-09 F-09 M-09 A-09 M-09 J-09
Volume (Million Shares)
Tadawul Index (TASI)
Petrochemical Index (Rebased)
Source: KMEFIC Research, TASI
Petrochemical Index Vs. Tadawul Index (& Sector shares trading volume)
Millio
n sh
ares
July 2009 KMEFIC Research
Equity Analysis Report
The petrochemical sector in Saudi Arabia
P a g e | 6
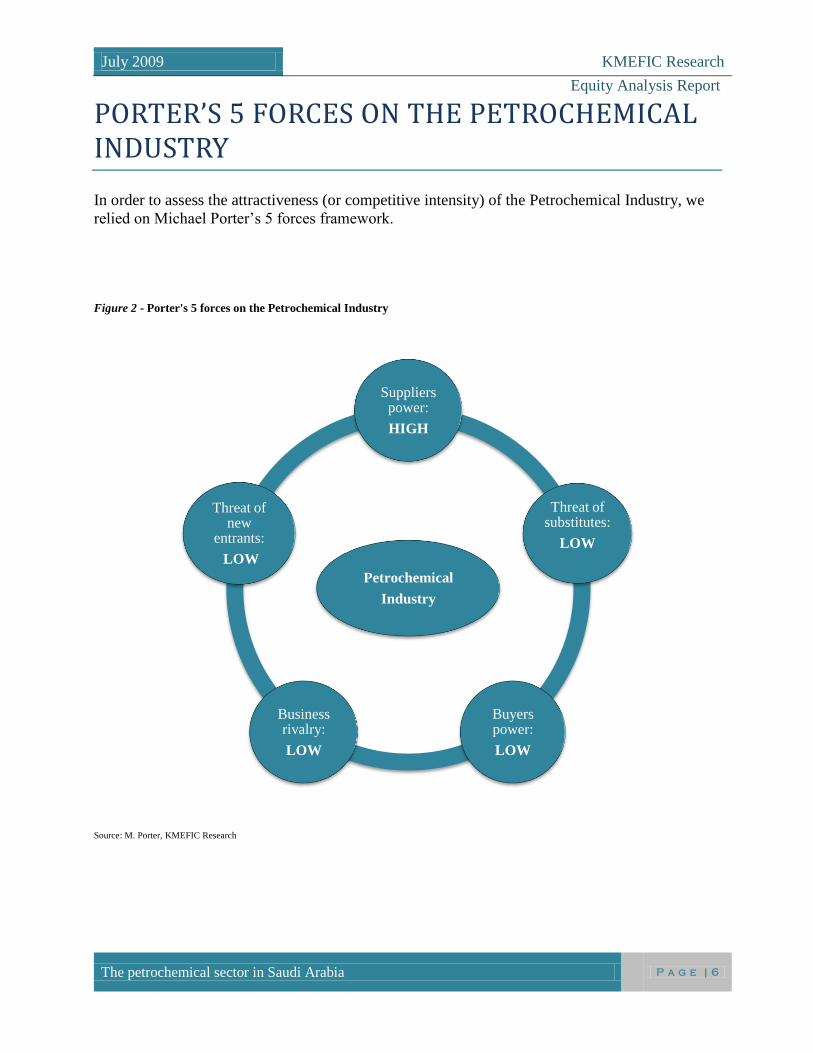
PORTER’S 5 FORCES ON THE PETROCHEMICAL INDUSTRY
In order to assess the attractiveness (or competitive intensity) of the Petrochemical Industry, we
relied on Michael Porter’s 5 forces framework.
Figure 2 - Porter's 5 forces on the Petrochemical Industry
Source: M. Porter, KMEFIC Research
Petrochemical
Industry
Suppliers power:
HIGH
Threat of substitutes:
LOW
Buyers power:
LOW
Business rivalry:
LOW
Threat of new
entrants:
LOW
July 2009 KMEFIC Research
Equity Analysis Report
The petrochemical sector in Saudi Arabia
P a g e | 7
THREAT OF NEW ENTRANTS We considered the threat of new entrants to be low because barriers to entry include high capital
cost, economies of scale, distribution channels, proprietary technology, environmental regulation
and geopolitical factors. Furthermore, high levels of industry expertise are needed to be
competitive at all levels in the petrochemical field. In addition, fixed cost levels are high for
upstream, downstream, and chemical products. It is therefore very hard for new players to enter
this market.
SUPPLIERS POWER Suppliers bargaining power can be considered as high since the Organization of Petroleum
Exporting Countries (OPEC) controls around 50% of the world’s supply of oil and owns about
two thirds of the world oil reserves (EIA, 2007). This consequently gives this organization a
strong influence over oil prices. OPEC’s influence on oil prices can thus be considered as a threat
for companies which use oil & gas as feedstock as it can exert a considerable degree of
uncertainty over the company’s chemical production costs. In fact, as it will be elaborated further
in the section entitled “The feedstock cost advantage”, abundant natural resources in the Middle
East countries in general (and Saudi Arabia in particular) has given the region a strategic position
for key players in the petrochemical industry.
THREAT OF SUBSTITUTES The threat of substitutes and new processes in the short term (next 20 years) can be regarded as
low. The petrochemical industry produces materials such as plastics, synthetic rubbers, fibers and
solvents which are indispensable to our everyday life products (in the form of packaging,
clothes, computers, furniture, etc). Often these products generate energy savings during their use
which by far outweigh the energy used to produce them.
In fact, the petrochemical industry accounts for 30% of total global industrial final energy use and
about 8% of world oil consumption (EIA, 2007). Besides, more than half of the energy used by
the chemical industry is stored as feedstock in its product. Because of the high share of feedstock
energy, the process energy efficiency using substitutes is quite limited, at least in the short term.
Biomass feedstock could help to reduce CO2 emission and fossil fuel independence, but most
experts argue this would be an option in the longer term, as its efficiency levels have yet to be
proven competitive to oil and gas resources.
BUYERS POWER Buyers can either be industrials or consumers. In both cases their power is quite limited due to the
nature (necessity) of the petrochemical products. However, the continuous search for price
reductions and higher margins has led more and more companies to settle their operations in
Middle East countries to benefit from low cost feedstock.
BUSINESS RIVALRY Due to tight regulations and high capital requirements, rivalry has been relatively low even while
July 2009 KMEFIC Research
Equity Analysis Report
The petrochemical sector in Saudi Arabia
P a g e | 8
the industry has been growing quite fast (in average 2 or 3% more than countries Gross Domestic
Products). Indeed, the biggest share of the market is still split between a few major companies
which have extended their operations from upstream to downstream and petrochemical activities.
The petrochemical sector in Saudi Stock Exchange is composed of 13 listed companies, SABIC
and SAFCO respectively amounting for 89% and 2.5% of market shares in 2008 (revenues for all
public petrochemical companies).
July 2009 KMEFIC Research
Equity Analysis Report
The petrochemical sector in Saudi Arabia
P a g e | 9
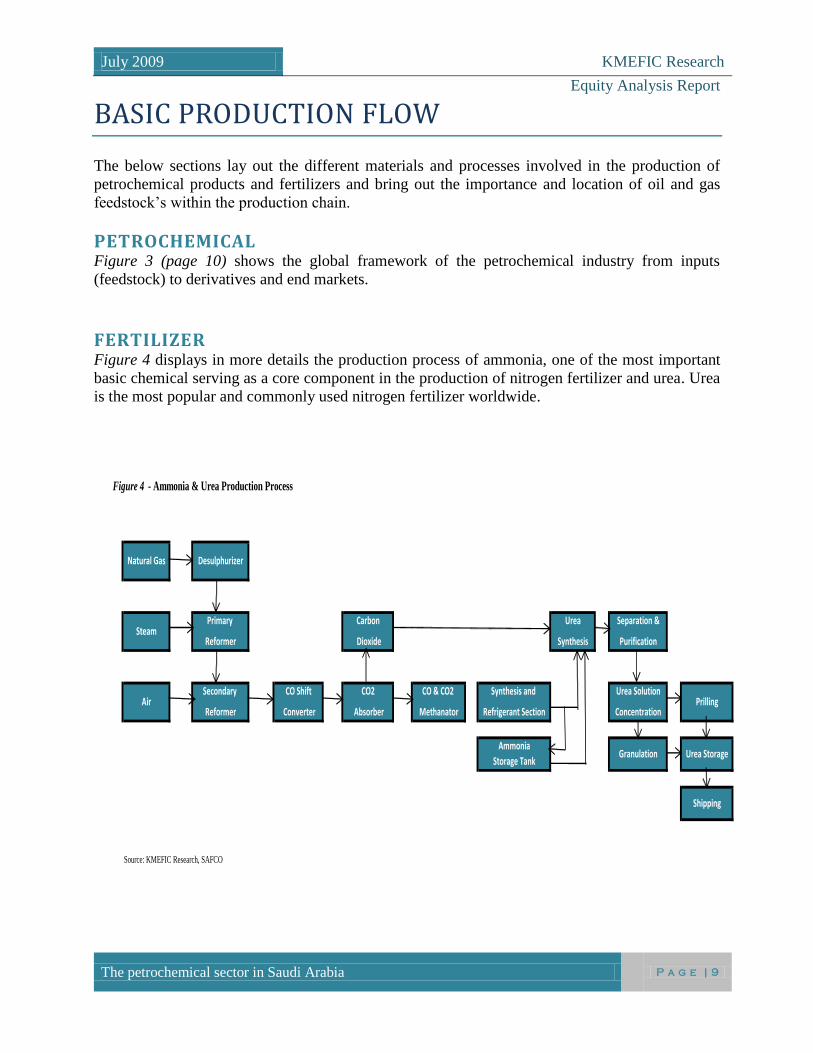
BASIC PRODUCTION FLOW
The below sections lay out the different materials and processes involved in the production of
petrochemical products and fertilizers and bring out the importance and location of oil and gas
feedstock’s within the production chain.
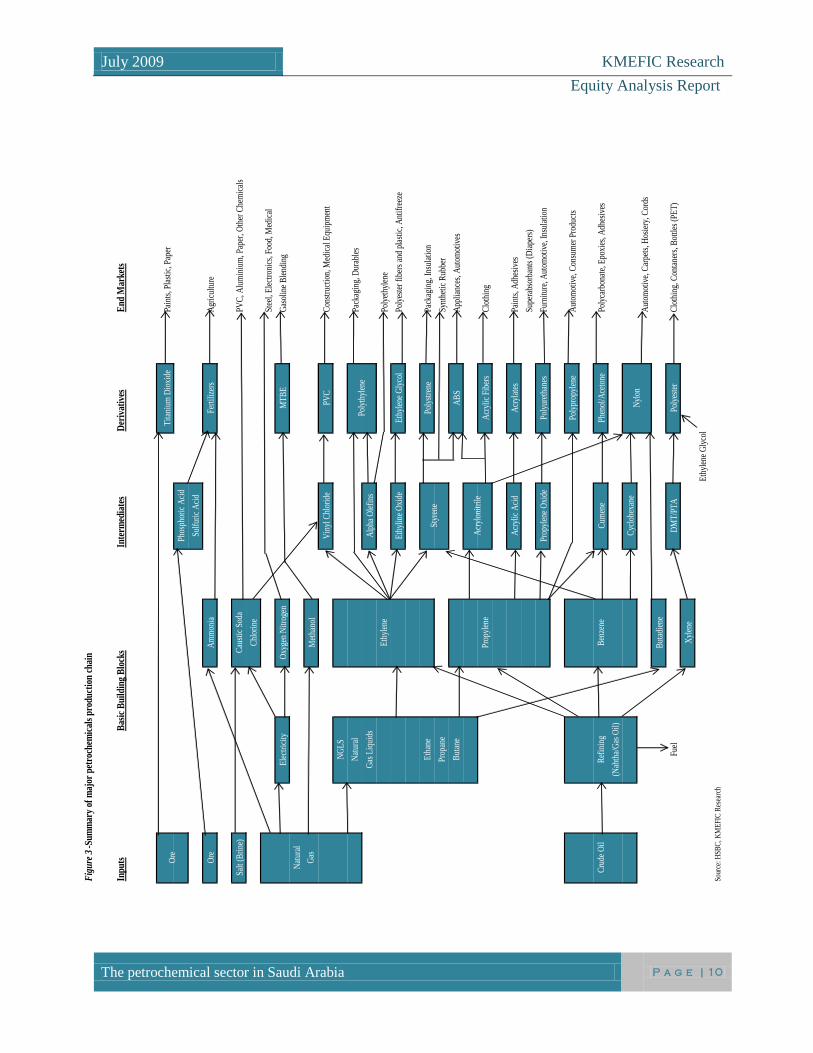
PETROCHEMICAL Figure 3 (page 10) shows the global framework of the petrochemical industry from inputs
(feedstock) to derivatives and end markets.
FERTILIZER Figure 4 displays in more details the production process of ammonia, one of the most important
basic chemical serving as a core component in the production of nitrogen fertilizer and urea. Urea
is the most popular and commonly used nitrogen fertilizer worldwide.
Figure 4 - Ammonia & Urea Production Process
Primary Carbon Urea Separation &
Reformer Dioxide Synthesis Purification
Secondary CO Shift CO2 CO & CO2 Synthesis and Urea Solution
Reformer Converter Absorber Methanator Refrigerant Section Concentration
Ammonia
Storage Tank
Source: KMEFIC Research, SAFCO
Shipping
Steam
Natural Gas
Air
Desulphurizer
Granulation
Prilling
Urea Storage
July 2009 KMEFIC Research
Equity Analysis Report
The petrochemical sector in Saudi Arabia
P a g e | 10
Fig
ure
3-S
um
mar
y of
maj
or p
etro
chem
ical
s p
rod
uct
ion
ch
ain
Inp
uts
Inte
rmed
iate
sD
eriv
ativ
esE
nd
Mar
kets
Tit
aniu
m D
ioxi
dePa
ints
, Pla
stic
, Pap
er
Phos
phor
ic A
cid
Sulf
uric
Aci
d
Ore
Am
mon
iaFe
rtili
zers
Agr
icul
ture
Salt
(Bri
ne)
Cau
stic
Sod
aPV
C, A
lum
iniu
m, P
aper
, Oth
er C
hem
ical
s
Chl
orin
e
Stee
l, E
lect
roni
cs, F
ood,
Med
ical
Ele
ctri
city
Oxy
gen
Nit
roge
nM
TB
EG
asol
ine
Ble
ndin
g
Nat
ural
Gas
Met
hano
l
Vin
yl C
hlor
ide
PVC
Con
stru
ctio
n, M
edic
al E
quip
men
t
NG
LS
Nat
ural
Pack
agin
g, D
urab
les
Gas
Liq
uids
Alp
ha O
lefi
ns
Eth
ylen
ePo
lyet
hyle
ne
Eth
ylin
e O
xide
Eth
ylen
e G
lyco
lPo
lyes
ter
fibe
rs a
nd p
last
ic, A
ntif
reez
e
Eth
ane
Poly
stre
nePa
ckag
ing,
Insu
lati
on
Prop
ane
Synt
heti
c R
ubbe
r
But
ane
AB
SA
pplia
nces
, Aut
omot
ives
Prop
ylen
eA
cryl
ic F
iber
sC
loth
ing
Acr
ylic
Aci
dA
cryl
ates
Pain
ts, A
dhes
ives
Supe
rabs
orba
nts
(Dia
pers
)
Prop
ylen
e O
xide
Poly
uret
hane
sFu
rnit
ure,
Aut
omot
ive,
Insu
lati
on
Poly
prop
ylen
eA
utom
otiv
e, C
onsu
mer
Pro
duct
s
Cru
de O
ilR
efin
ing
Ben
zene
Cum
ene
Phen
ol/A
ceto
nePo
lyca
rbon
ate,
Epo
xies
, Adh
esiv
es
(Nah
tha/
Gas
Oil)
Cyc
lohe
xane
Aut
omot
ive,
Car
pets
, Hos
iery
, Cor
ds
But
adie
ne
Fuel
DM
T/P
TA
Poly
este
rC
loth
ing,
Con
tane
rs, B
ottle
s (P
ET
)
Xyl
ene
Eth
ylen
e G
lyco
l
Sour
ce: H
SBC
, KM
EFI
C R
esea
rch
Nyl
on
Bas
ic B
uil
din
g B
lock
s
Ore
Poly
thyl
ene
Styr
ene
Acr
ylon
itri
le
July 2009 KMEFIC Research
Equity Analysis Report
The petrochemical sector in Saudi Arabia
P a g e | 11
MACROECONOMIC OVERVIEW
We will regard all GDP related issues with particular attention, as the demand for petrochemicals
has been growing at around 3% above the world GDP.
GROSS DOMESTIC PRODUCT & KEY GROWTH INDICATORS
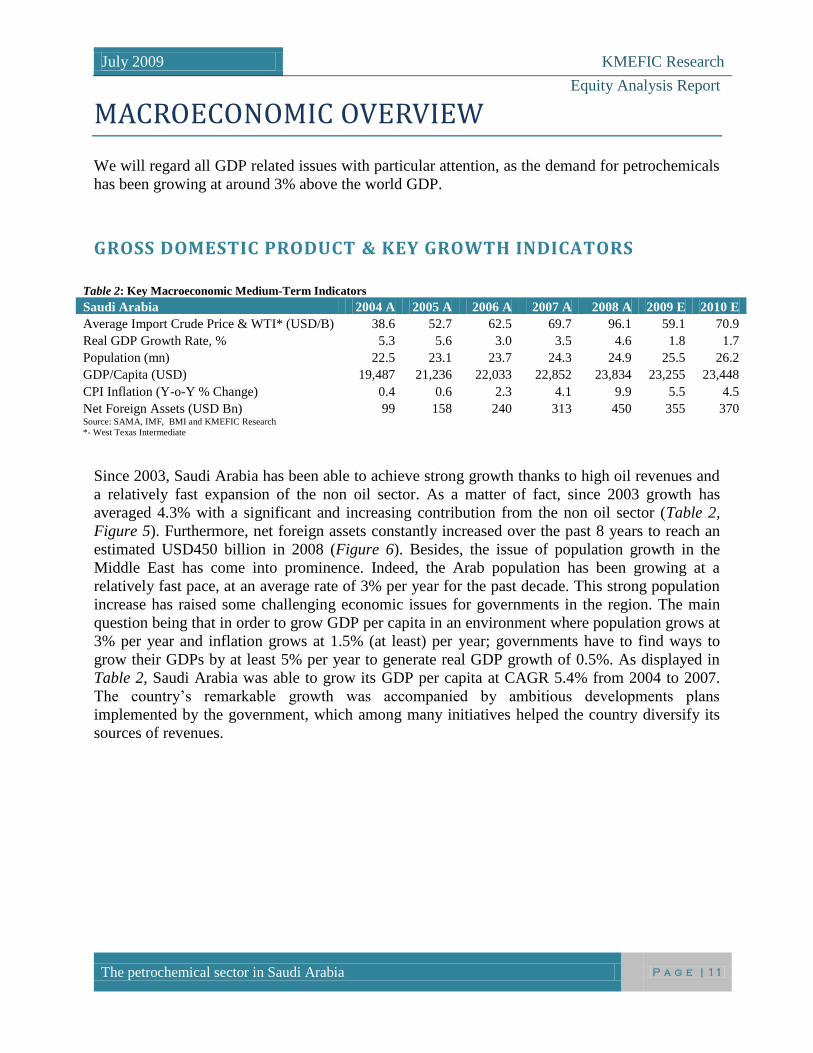
Table 2: Key Macroeconomic Medium-Term Indicators
Saudi Arabia 2004 A 2005 A 2006 A 2007 A 2008 A 2009 E 2010 E
Average Import Crude Price & WTI* (USD/B) 38.6 52.7 62.5 69.7 96.1 59.1 70.9
Real GDP Growth Rate, % 5.3 5.6 3.0 3.5 4.6 1.8 1.7
Population (mn) 22.5 23.1 23.7 24.3 24.9 25.5 26.2
GDP/Capita (USD) 19,487 21,236 22,033 22,852 23,834 23,255 23,448
CPI Inflation (Y-o-Y % Change) 0.4 0.6 2.3 4.1 9.9 5.5 4.5
Net Foreign Assets (USD Bn) 99 158 240 313 450 355 370 Source: SAMA, IMF, BMI and KMEFIC Research
*- West Texas Intermediate
Since 2003, Saudi Arabia has been able to achieve strong growth thanks to high oil revenues and
a relatively fast expansion of the non oil sector. As a matter of fact, since 2003 growth has
averaged 4.3% with a significant and increasing contribution from the non oil sector (Table 2,
Figure 5). Furthermore, net foreign assets constantly increased over the past 8 years to reach an
estimated USD450 billion in 2008 (Figure 6). Besides, the issue of population growth in the
Middle East has come into prominence. Indeed, the Arab population has been growing at a
relatively fast pace, at an average rate of 3% per year for the past decade. This strong population
increase has raised some challenging economic issues for governments in the region. The main
question being that in order to grow GDP per capita in an environment where population grows at
3% per year and inflation grows at 1.5% (at least) per year; governments have to find ways to
grow their GDPs by at least 5% per year to generate real GDP growth of 0.5%. As displayed in
Table 2, Saudi Arabia was able to grow its GDP per capita at CAGR 5.4% from 2004 to 2007.
The country’s remarkable growth was accompanied by ambitious developments plans
implemented by the government, which among many initiatives helped the country diversify its
sources of revenues.
July 2009 KMEFIC Research
Equity Analysis Report
The petrochemical sector in Saudi Arabia
P a g e | 12
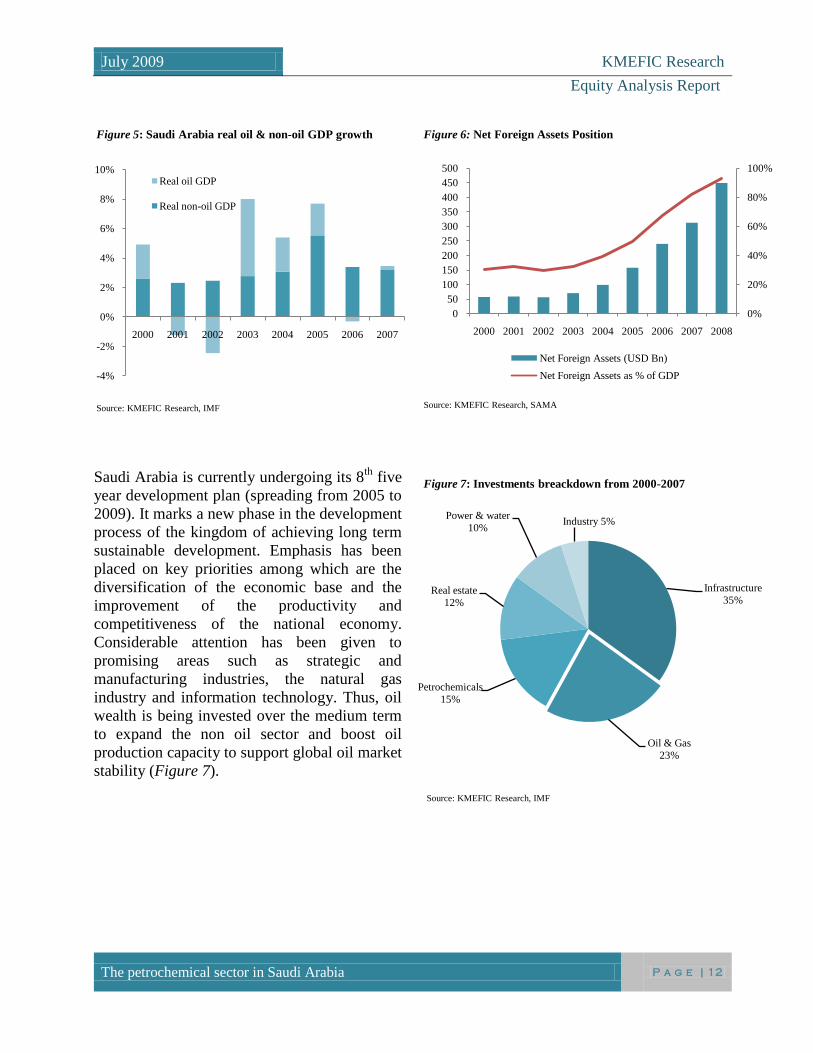
Saudi Arabia is currently undergoing its 8th
five
year development plan (spreading from 2005 to
2009). It marks a new phase in the development
process of the kingdom of achieving long term
sustainable development. Emphasis has been
placed on key priorities among which are the
diversification of the economic base and the
improvement of the productivity and
competitiveness of the national economy.
Considerable attention has been given to
promising areas such as strategic and
manufacturing industries, the natural gas
industry and information technology. Thus, oil
wealth is being invested over the medium term
to expand the non oil sector and boost oil
production capacity to support global oil market
stability (Figure 7).
-4%
-2%
0%
2%
4%
6%
8%
10%
2000 2001 2002 2003 2004 2005 2006 2007
Real oil GDP
Real non-oil GDP
Source: KMEFIC Research, IMF
Figure 5: Saudi Arabia real oil & non-oil GDP growth
Infrastructure
35%
Oil & Gas
23%
Petrochemicals
15%
Real estate
12%
Power & water
10%Industry 5%
Source: KMEFIC Research, IMF
Figure 7: Investments breackdown from 2000-2007
0%
20%
40%
60%
80%
100%
0
50
100
150
200
250
300
350
400
450
500
2000 2001 2002 2003 2004 2005 2006 2007 2008
Net Foreign Assets (USD Bn)
Net Foreign Assets as % of GDP
Figure 6: Net Foreign Assets Position
Source: KMEFIC Research, SAMA
July 2009 KMEFIC Research
Equity Analysis Report
The petrochemical sector in Saudi Arabia
P a g e | 13
OIL VULNERABILITY While oil importing countries might have welcome the fall in oil prices since mid-2008, this is
certainly not the case for oil exporting countries, many of which are subsequently expecting
dramatic declines in their fiscal balances along with much less growth in their net foreign assets
and in their GDPs. Indeed, a heavy concentration of economic activity in the hydrocarbon sector
naturally tends to raise a country vulnerability to sharp drop in oil prices. Standard & Poor’s
recently released their oil price vulnerability index ranking3, placing Saudi Arabia second among
the countries whose overall economy can be most impacted by oil prices fluctuations. Note that
fiscal outturns are logically expected to weaken in 2009, in line with falling oil prices and
revenues and the government deliberate countercyclical expansionary fiscal policy (elaborated
further in the “global financial crisis” section of our report), with total expenditure expected to
rise by 16% relative to 2008 budget. The government balance should, consequently, reach a
deficit of circa 7% of GDP, reversing from a 20% surplus in average over the past four years.
Nevertheless, Saudi Arabia holds enough cumulated fiscal surplus to digest this deficit in the
medium term.
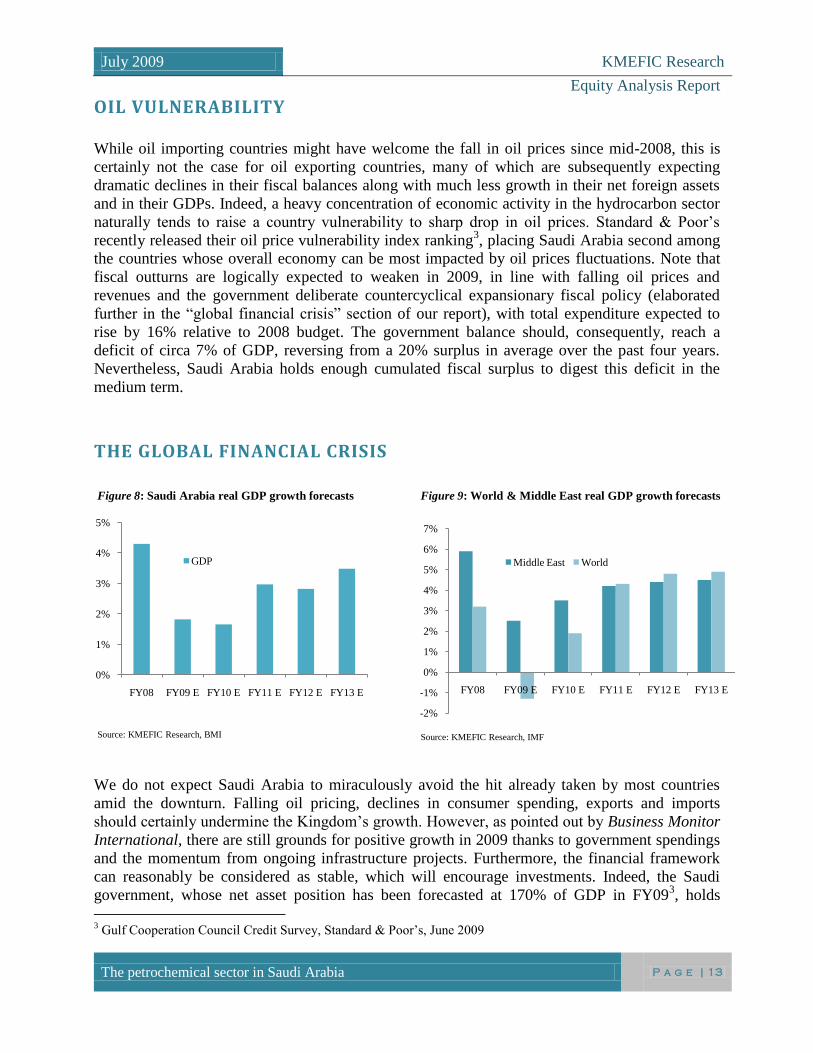
THE GLOBAL FINANCIAL CRISIS
We do not expect Saudi Arabia to miraculously avoid the hit already taken by most countries
amid the downturn. Falling oil pricing, declines in consumer spending, exports and imports
should certainly undermine the Kingdom’s growth. However, as pointed out by Business Monitor
International, there are still grounds for positive growth in 2009 thanks to government spendings
and the momentum from ongoing infrastructure projects. Furthermore, the financial framework
can reasonably be considered as stable, which will encourage investments. Indeed, the Saudi
government, whose net asset position has been forecasted at 170% of GDP in FY093, holds
3 Gulf Cooperation Council Credit Survey, Standard & Poor’s, June 2009
0%
1%
2%
3%
4%
5%
FY08 FY09 E FY10 E FY11 E FY12 E FY13 E
GDP
Source: KMEFIC Research, BMI
Figure 8: Saudi Arabia real GDP growth forecasts
-2%
-1%
0%
1%
2%
3%
4%
5%
6%
7%
FY08 FY09 E FY10 E FY11 E FY12 E FY13 E
Middle East World
Source: KMEFIC Research, IMF
Figure 9: World & Middle East real GDP growth forecasts
July 2009 KMEFIC Research
Equity Analysis Report
The petrochemical sector in Saudi Arabia
P a g e | 14
enough cash reserve to step in and rescue companies for political reasons. Furthermore, the
government stimulus plans adopted to cope with the crisis will certainly bear fruits in the near
term (Table 3). During the G20 summit meetings, held in London last April, Saudi Arabia
adopted a USD400 billion investment and development program for the government and the
monetary sectors for the next five years, comforting the country’s ambition to become one of the
world’s ten most competitive economies by 2010 (the 10x10 plan). This was one of the largest
economic initiatives prepared during the discussions of the economic recovery program for global
economies.
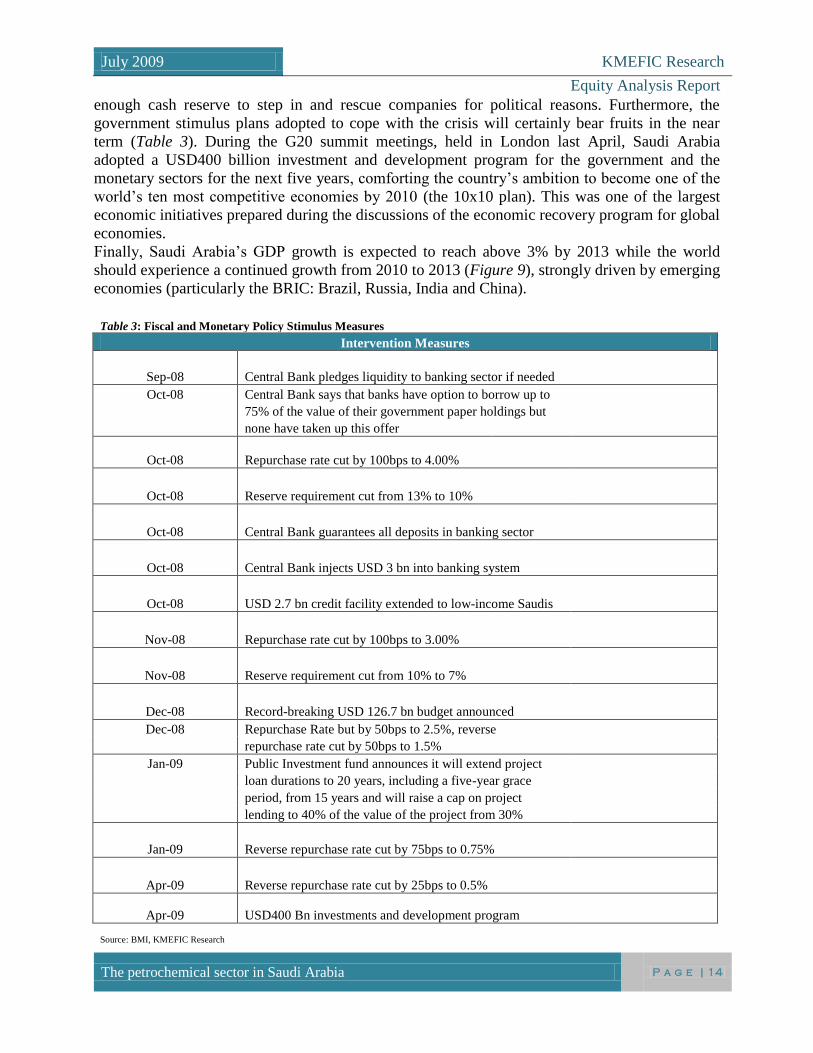
Finally, Saudi Arabia’s GDP growth is expected to reach above 3% by 2013 while the world
should experience a continued growth from 2010 to 2013 (Figure 9), strongly driven by emerging
economies (particularly the BRIC: Brazil, Russia, India and China).
Table 3: Fiscal and Monetary Policy Stimulus Measures
Intervention Measures
Sep-08 Central Bank pledges liquidity to banking sector if needed
Oct-08 Central Bank says that banks have option to borrow up to
75% of the value of their government paper holdings but
none have taken up this offer
Oct-08 Repurchase rate cut by 100bps to 4.00%
Oct-08 Reserve requirement cut from 13% to 10%
Oct-08 Central Bank guarantees all deposits in banking sector
Oct-08 Central Bank injects USD 3 bn into banking system
Oct-08 USD 2.7 bn credit facility extended to low-income Saudis
Nov-08 Repurchase rate cut by 100bps to 3.00%
Nov-08 Reserve requirement cut from 10% to 7%
Dec-08 Record-breaking USD 126.7 bn budget announced
Dec-08 Repurchase Rate but by 50bps to 2.5%, reverse
repurchase rate cut by 50bps to 1.5%
Jan-09 Public Investment fund announces it will extend project
loan durations to 20 years, including a five-year grace
period, from 15 years and will raise a cap on project
lending to 40% of the value of the project from 30%
Jan-09 Reverse repurchase rate cut by 75bps to 0.75%
Apr-09 Reverse repurchase rate cut by 25bps to 0.5%
Apr-09 USD400 Bn investments and development program
Source: BMI, KMEFIC Research
July 2009 KMEFIC Research
Equity Analysis Report
The petrochemical sector in Saudi Arabia
P a g e | 15
OIL & GAS OUTLOOK
MARKET DYNAMICS With around 266.7 billion barrels of proven oil reserves
4 (around one-fifth of the proven,
conventional world oil reserves) and 258.4 trillion cubic feet of natural gas4 (the fourth largest
natural gas reserves in the world), Saudi Arabia enjoys an enviable, unparalleled advantaged
energy and feedstock position; the revenue from oil & gas in turn supporting further investments
and developments. Oil & Gas prices impact petrochemical development when they are high or
low. Although there can be negative impact, the energy advantage prevails under both scenarios.
Scenario I: High or relatively high oil prices imply that gulf countries in general maintain a
share of the market at or near current levels. However, higher oil prices may also likely
negatively impact the world economy, which translates into lower petrochemical demand growth
and the requirement for fewer capital expenditures. As the incremental low cost producing region,
petrochemical investments in the Middle East are likely to be maintained (thanks to higher cash
margins) at the expense of other regions.
Scenario II: Although it might have been hard to seriously consider for many until recently, low
oil prices have the negative effect of reducing the inherent advantage of gulf petrochemical
producers. Nevertheless, very low oil prices would have to be sustained for an extended period of
time before investment economics were adversely affected. Prices would actually have to drop
considerably lower before Middle East ethane based producers had difficulty competing on a
delivered polyethylene cash cost basis (cf “feedstock cost advantage” section). Should oil prices
be sustained for a long time, the demand in petrochemical products would grow as consumers
would certainly fancy lower priced products. The resulting growth in the sector would push the
need for more facilities (potentially outside of the Middle East). However, one should understand
that very low oil prices for a very long period of time might be unlikely to occur as OPEC
countries which control around 50% of the world’s supply of oil and own about two thirds of the
world oil reserves would step in to influence market prices (up or down), trying to find consensus
for their own benefits and the world economy.
4 Oil & Gas Journal, 2009
July 2009 KMEFIC Research
Equity Analysis Report
The petrochemical sector in Saudi Arabia
P a g e | 16
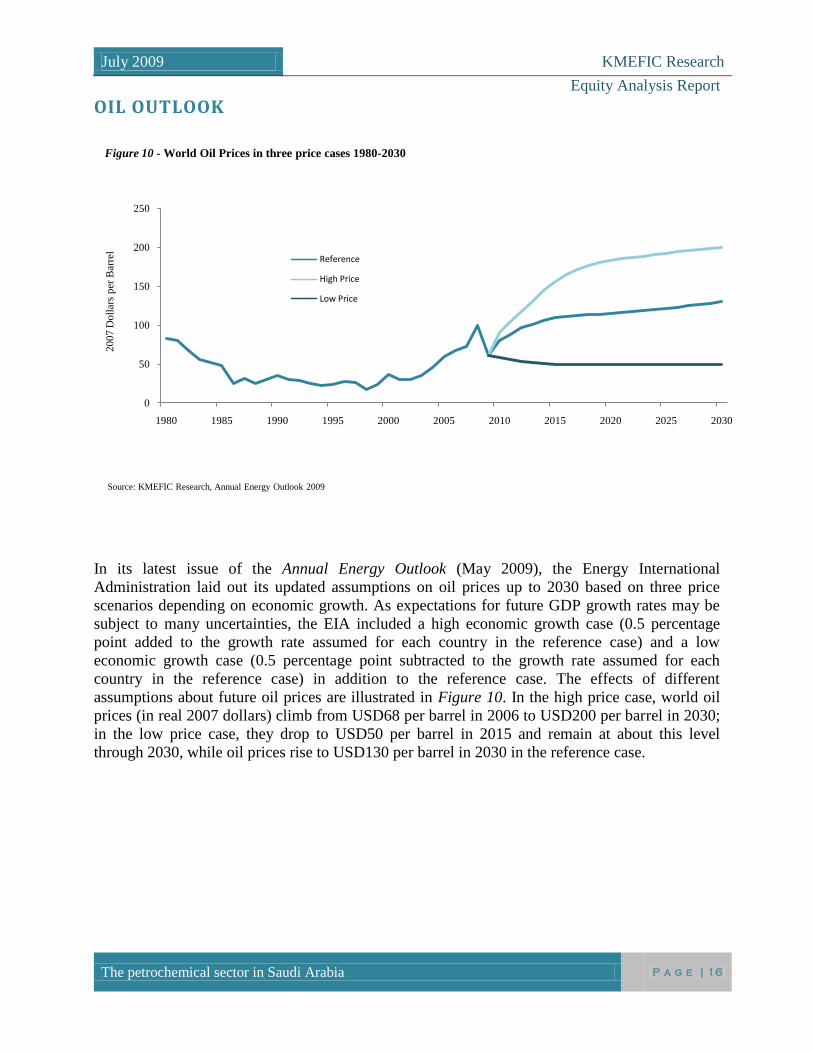
OIL OUTLOOK
In its latest issue of the Annual Energy Outlook (May 2009), the Energy International
Administration laid out its updated assumptions on oil prices up to 2030 based on three price
scenarios depending on economic growth. As expectations for future GDP growth rates may be
subject to many uncertainties, the EIA included a high economic growth case (0.5 percentage
point added to the growth rate assumed for each country in the reference case) and a low
economic growth case (0.5 percentage point subtracted to the growth rate assumed for each
country in the reference case) in addition to the reference case. The effects of different
assumptions about future oil prices are illustrated in Figure 10. In the high price case, world oil
prices (in real 2007 dollars) climb from USD68 per barrel in 2006 to USD200 per barrel in 2030;
in the low price case, they drop to USD50 per barrel in 2015 and remain at about this level
through 2030, while oil prices rise to USD130 per barrel in 2030 in the reference case.
0
50
100
150
200
250
1980 1985 1990 1995 2000 2005 2010 2015 2020 2025 2030
Reference
High Price
Low Price
Source: KMEFIC Research, Annual Energy Outlook 2009
Figure 10 - World Oil Prices in three price cases 1980-2030
20
07
Doll
ars
per
Bar
rel
July 2009 KMEFIC Research
Equity Analysis Report
The petrochemical sector in Saudi Arabia
P a g e | 17
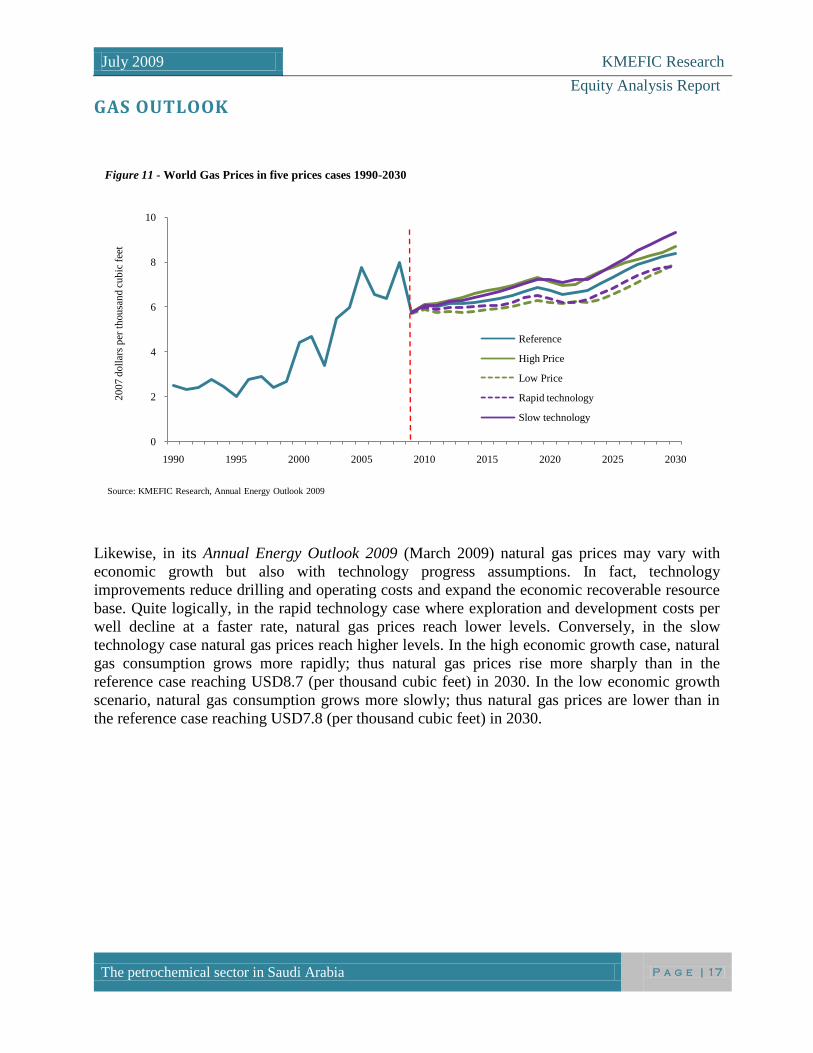
GAS OUTLOOK
Likewise, in its Annual Energy Outlook 2009 (March 2009) natural gas prices may vary with
economic growth but also with technology progress assumptions. In fact, technology
improvements reduce drilling and operating costs and expand the economic recoverable resource
base. Quite logically, in the rapid technology case where exploration and development costs per
well decline at a faster rate, natural gas prices reach lower levels. Conversely, in the slow
technology case natural gas prices reach higher levels. In the high economic growth case, natural
gas consumption grows more rapidly; thus natural gas prices rise more sharply than in the
reference case reaching USD8.7 (per thousand cubic feet) in 2030. In the low economic growth
scenario, natural gas consumption grows more slowly; thus natural gas prices are lower than in
the reference case reaching USD7.8 (per thousand cubic feet) in 2030.
0
2
4
6
8
10
1990 1995 2000 2005 2010 2015 2020 2025 2030
Reference
High Price
Low Price
Rapid technology
Slow technology
Source: KMEFIC Research, Annual Energy Outlook 2009
Figure 11 - World Gas Prices in five prices cases 1990-2030
20
07
doll
ars
per
th
ou
san
d c
ub
ic f
eet
Make look better
+ put units + add vertical line
at beginning of assumptions +
PUT CORRECT COLORS
!!
July 2009 KMEFIC Research
Equity Analysis Report
The petrochemical sector in Saudi Arabia
P a g e | 18
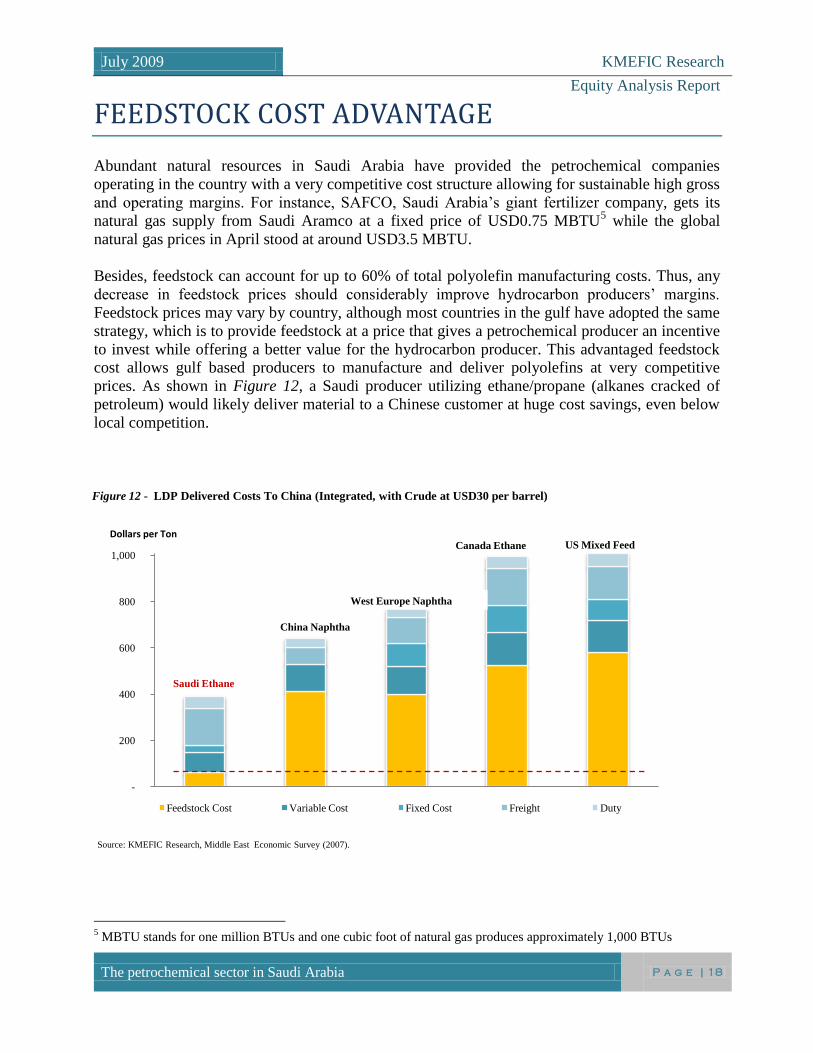
FEEDSTOCK COST ADVANTAGE
Abundant natural resources in Saudi Arabia have provided the petrochemical companies
operating in the country with a very competitive cost structure allowing for sustainable high gross
and operating margins. For instance, SAFCO, Saudi Arabia’s giant fertilizer company, gets its
natural gas supply from Saudi Aramco at a fixed price of USD0.75 MBTU5 while the global
natural gas prices in April stood at around USD3.5 MBTU.
Besides, feedstock can account for up to 60% of total polyolefin manufacturing costs. Thus, any
decrease in feedstock prices should considerably improve hydrocarbon producers’ margins.
Feedstock prices may vary by country, although most countries in the gulf have adopted the same
strategy, which is to provide feedstock at a price that gives a petrochemical producer an incentive
to invest while offering a better value for the hydrocarbon producer. This advantaged feedstock
cost allows gulf based producers to manufacture and deliver polyolefins at very competitive
prices. As shown in Figure 12, a Saudi producer utilizing ethane/propane (alkanes cracked of
petroleum) would likely deliver material to a Chinese customer at huge cost savings, even below
local competition.
5 MBTU stands for one million BTUs and one cubic foot of natural gas produces approximately 1,000 BTUs
-
200
400
600
800
1,000
Figure 12 - LDP Delivered Costs To China (Integrated, with Crude at USD30 per barrel)
Feedstock Cost Variable Cost Fixed Cost Freight Duty
Dollars per Ton
Source: KMEFIC Research, Middle East Economic Survey (2007).
Saudi Ethane
China Naphtha
West Europe Naphtha
Canada Ethane US Mixed Feed
July 2009 KMEFIC Research
Equity Analysis Report
The petrochemical sector in Saudi Arabia
P a g e | 19
CAPACITY AND INFRASTRUCTURES
Feedstock availability coupled with high oil & gas prices for the past years (until end 2008) have
enabled Saudi petrochemical prices to achieve very high cash margins. Petrochemical companies’
ability to be profitable has therefore been largely dependent on the country’s feedstock capacity.
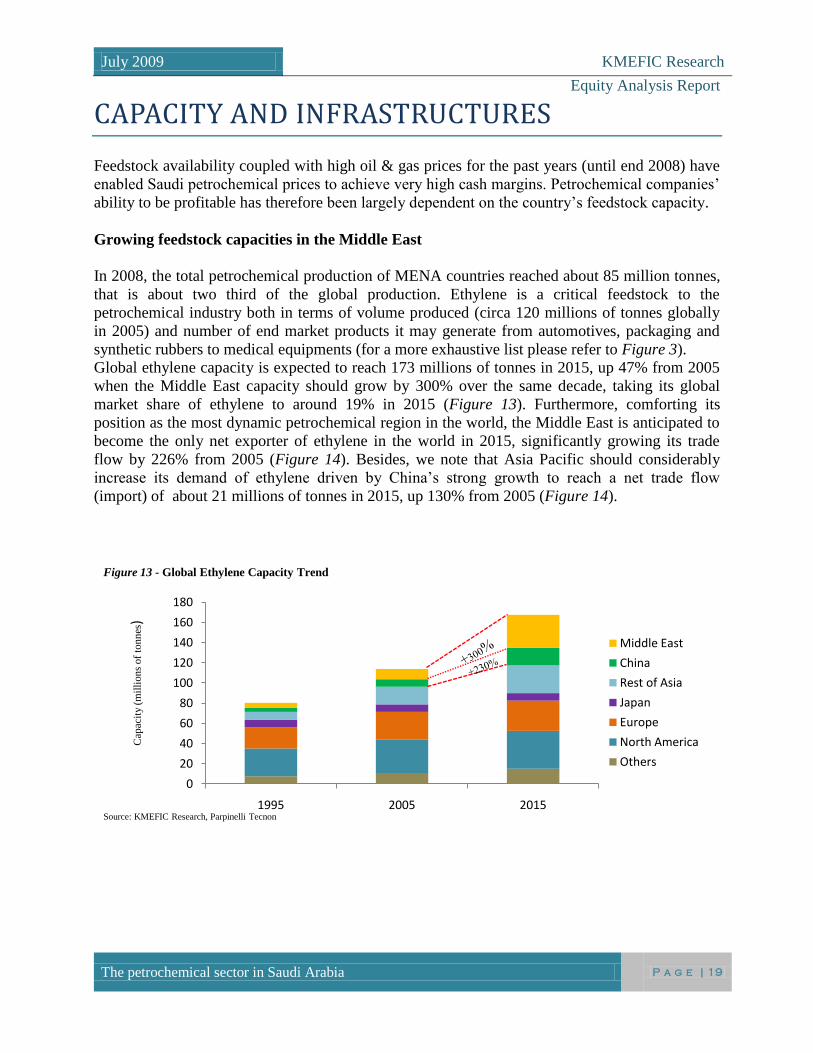
Growing feedstock capacities in the Middle East
In 2008, the total petrochemical production of MENA countries reached about 85 million tonnes,
that is about two third of the global production. Ethylene is a critical feedstock to the
petrochemical industry both in terms of volume produced (circa 120 millions of tonnes globally
in 2005) and number of end market products it may generate from automotives, packaging and
synthetic rubbers to medical equipments (for a more exhaustive list please refer to Figure 3).
Global ethylene capacity is expected to reach 173 millions of tonnes in 2015, up 47% from 2005
when the Middle East capacity should grow by 300% over the same decade, taking its global
market share of ethylene to around 19% in 2015 (Figure 13). Furthermore, comforting its
position as the most dynamic petrochemical region in the world, the Middle East is anticipated to
become the only net exporter of ethylene in the world in 2015, significantly growing its trade
flow by 226% from 2005 (Figure 14). Besides, we note that Asia Pacific should considerably
increase its demand of ethylene driven by China’s strong growth to reach a net trade flow
(import) of about 21 millions of tonnes in 2015, up 130% from 2005 (Figure 14).
0
20
40
60
80
100
120
140
160
180
1995 2005 2015
Middle East
China
Rest of Asia
Japan
Europe
North America
Others
Source: KMEFIC Research, Parpinelli Tecnon
Figure 13 - Global Ethylene Capacity Trend
Cap
acit
y(m
illi
on
s of
ton
nes
)
July 2009 KMEFIC Research
Equity Analysis Report
The petrochemical sector in Saudi Arabia
P a g e | 20
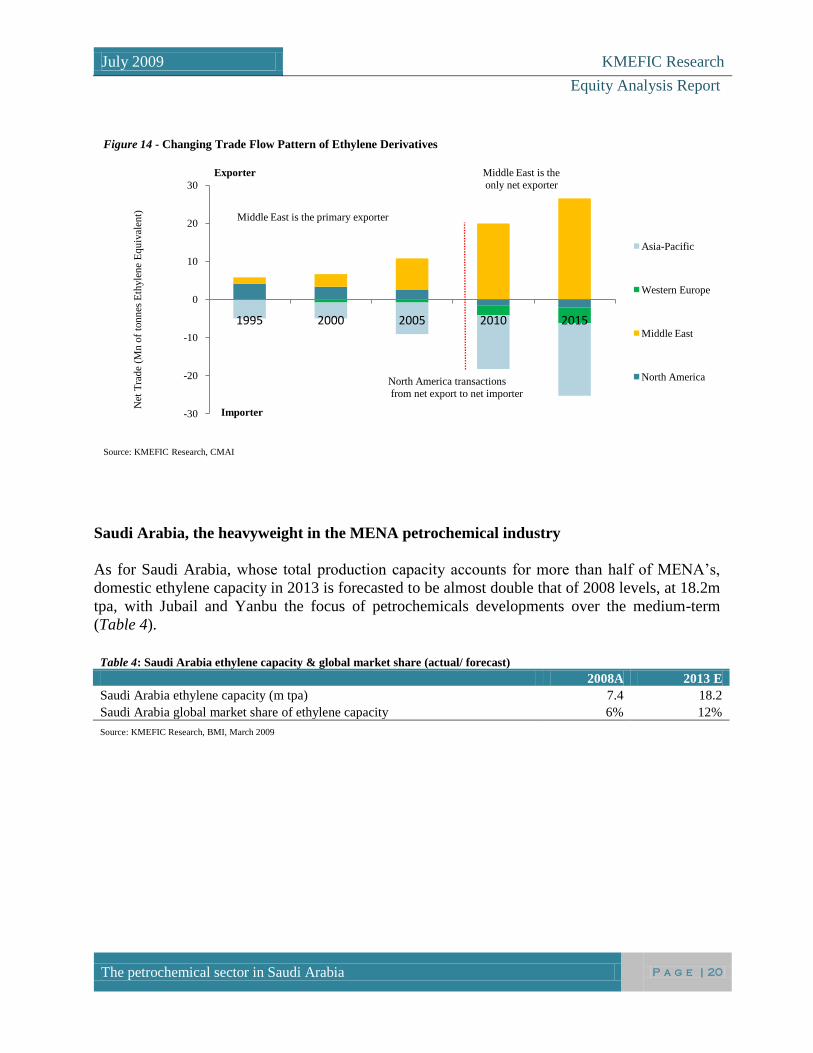
Saudi Arabia, the heavyweight in the MENA petrochemical industry
As for Saudi Arabia, whose total production capacity accounts for more than half of MENA’s,
domestic ethylene capacity in 2013 is forecasted to be almost double that of 2008 levels, at 18.2m
tpa, with Jubail and Yanbu the focus of petrochemicals developments over the medium-term
(Table 4).
Table 4: Saudi Arabia ethylene capacity & global market share (actual/ forecast)
2008A 2013 E
Saudi Arabia ethylene capacity (m tpa) 7.4 18.2
Saudi Arabia global market share of ethylene capacity 6% 12%
Source: KMEFIC Research, BMI, March 2009
-30
-20
-10
0
10
20
30
1995 2000 2005 2010 2015
Asia-Pacific
Western Europe
Middle East
North America
Source: KMEFIC Research, CMAI
Figure 14 - Changing Trade Flow Pattern of Ethylene DerivativesN
et T
rad
e (M
nof
ton
nes
Eth
yle
ne
Eq
uiv
alen
t)
North America transactions
from net export to net importer
Middle East is the
only net exporter
Middle East is the primary exporter
Exporter
Importer
July 2009 KMEFIC Research
Equity Analysis Report
The petrochemical sector in Saudi Arabia
P a g e | 21
Saudi Basic Industries Corporation (SABIC)
Listing : Tadawul Sector : Petrochemical Industries
CMP (30 Jun - 09) : SAR62.75
Upside/ (Downside) : 12%
LTFV : SAR70.58
Opinion : Undervalued
Key Performance Indicators
in'million'SAR unless otherwise indicated (Dec year end) FY08 A FY09 E FY10 E FY11 E
Revenues 150,810 90,486 106,773 124,925
EBITDA 46,643 28,222 39,108 43,446 Net Profit 22,030 9,038 15,221 20,201
Gross Profit Margin 30.3% 29.5% 34.0% 36.0%
Operating Margin 24.3% 19.3% 26.0% 28.0%
Net Profit Margin 14.6% 10.0% 14.3% 16.2%
ROE 15.7% 6.0% 9.7% 11.8%
EPS (SAR) 7.34 3.01 5.07 6.73 EPS growth -18.5% -59.0% 68.4% 32.7%
P/E 8.5 20.8 12.4 9.3
BVPS (SAR) 48.9 52.0 56.7 62.4
P/BV 1.3 1.2 1.1 1.0 Dividend Yield 1.7% 2.9% 4.4% 5.3%
EV/EBITDA 4.0 6.7 4.8 4.3
Debt/Equity 63.2% 60.7% 58.1% 49.6%
Net Debt 74,091 57,816 55,999 53,739 Source: KMEFIC Research, SABIC financial statements
Free Float
30.0%
Public
Investment
Fund 70.0%
Source: KMEFIC Research, Zawya
Figure 16 - SABIC shareholding structure
0
5
10
15
20
25
30
35
40
0
20
40
60
80
100
120
140
160
J-08 J-08 A-08 S-08 O-08 N-08 D-08 J-09 F-09 M-09 A-09 M-09 J-09
Volume (Million Shares)
SABIC (SAR)
Petrochemical Index (Rebased)
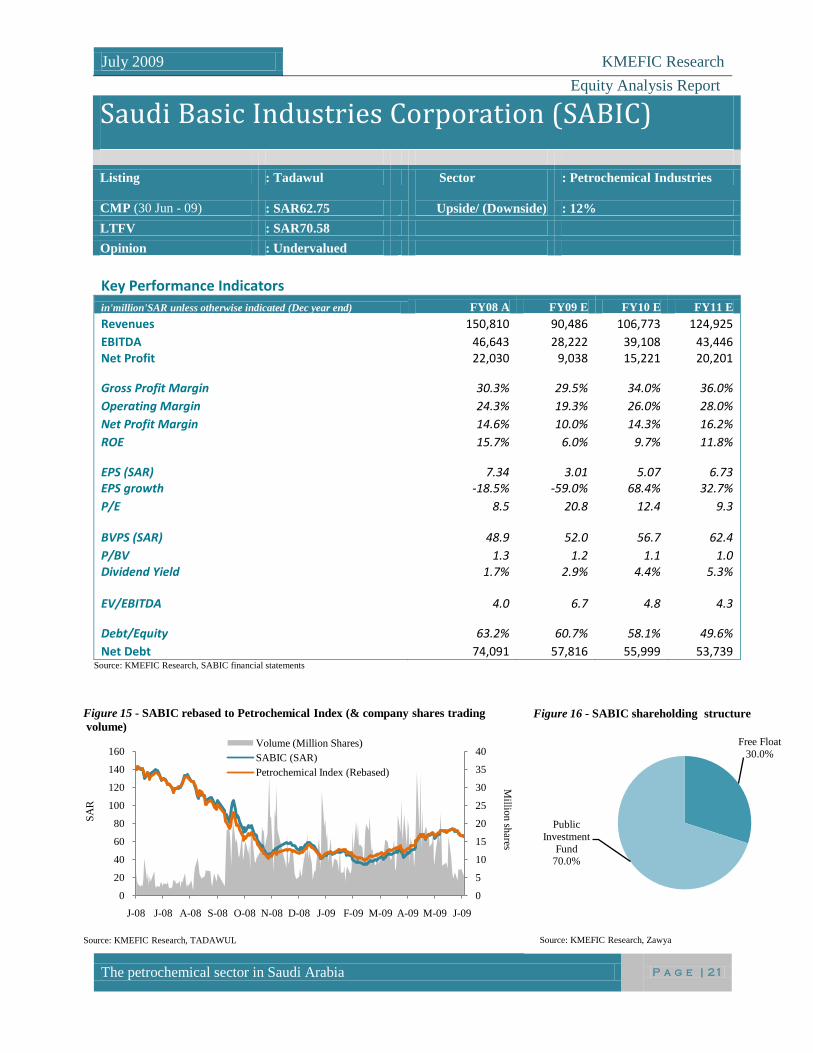
Figure 15 - SABIC rebased to Petrochemical Index (& company shares trading
volume)
Source: KMEFIC Research, TADAWUL
Millio
n sh
ares
SA
R
July 2009 KMEFIC Research
Equity Analysis Report
The petrochemical sector in Saudi Arabia
P a g e | 22
COMPANY & BUSINESS OVERVIEW The Saudi Basic Industries Corporation (SABIC) was established by a royal decree in 1976 to
produce chemicals, polymers and fertilizers, benefiting from oil and gas competitive feedstock
thanks to the country’s abundant natural resources. Constantly growing organically and through
acquisitions, SABIC has become a heavyweight in the petrochemical sector. In 2008, SABIC’s
revenues topped about SAR151 billion, net profit SAR22 billion with a production of more than
56 million metric tonnes, up 60% YoY. Best known for being one of the world largest
petrochemical companies, the Saudi Arabia based company has also grown and diversified its
activities to become the largest steel producer in the Middle East. As a truly global company,
SABIC currently employs more than 33,000 people in more than 100 countries over six
continents. As on 30 June 2009, the company’s market capitalization was SAR188.2 billion,
which is more than 60% of the petrochemical sector’s combined capitalizations in the Tadawul.
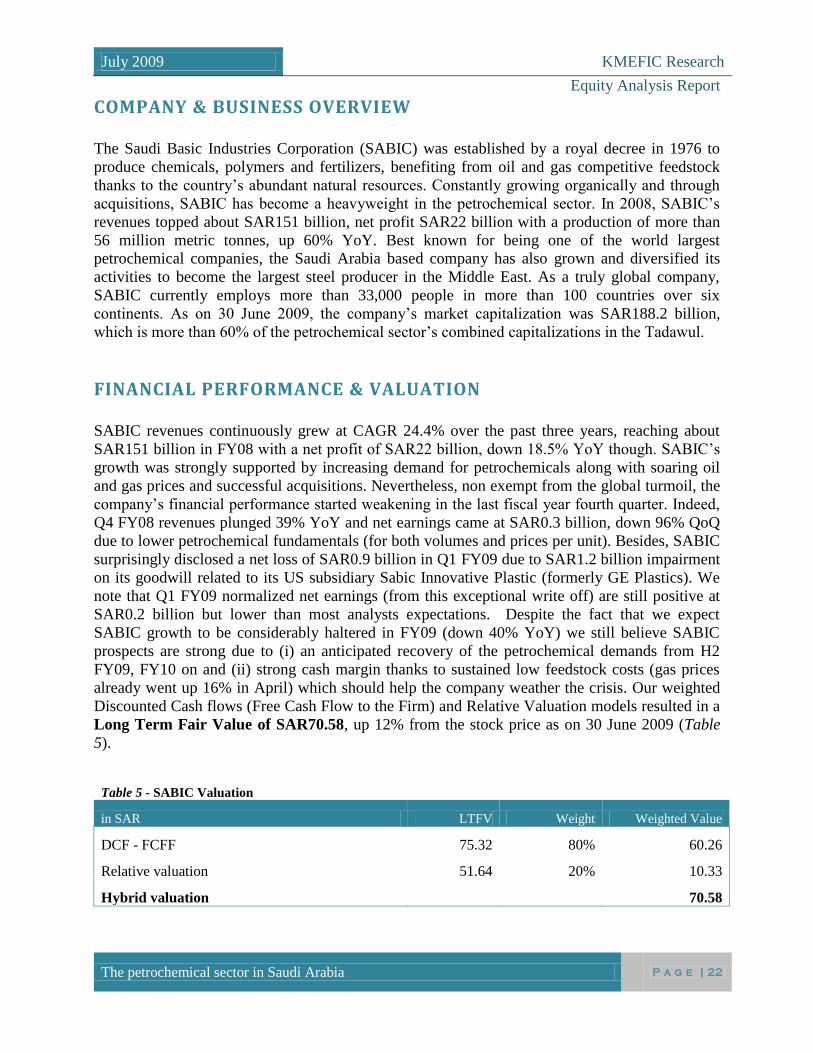
FINANCIAL PERFORMANCE & VALUATION SABIC revenues continuously grew at CAGR 24.4% over the past three years, reaching about
SAR151 billion in FY08 with a net profit of SAR22 billion, down 18.5% YoY though. SABIC’s
growth was strongly supported by increasing demand for petrochemicals along with soaring oil
and gas prices and successful acquisitions. Nevertheless, non exempt from the global turmoil, the
company’s financial performance started weakening in the last fiscal year fourth quarter. Indeed,
Q4 FY08 revenues plunged 39% YoY and net earnings came at SAR0.3 billion, down 96% QoQ
due to lower petrochemical fundamentals (for both volumes and prices per unit). Besides, SABIC
surprisingly disclosed a net loss of SAR0.9 billion in Q1 FY09 due to SAR1.2 billion impairment
on its goodwill related to its US subsidiary Sabic Innovative Plastic (formerly GE Plastics). We
note that Q1 FY09 normalized net earnings (from this exceptional write off) are still positive at
SAR0.2 billion but lower than most analysts expectations. Despite the fact that we expect
SABIC growth to be considerably haltered in FY09 (down 40% YoY) we still believe SABIC
prospects are strong due to (i) an anticipated recovery of the petrochemical demands from H2
FY09, FY10 on and (ii) strong cash margin thanks to sustained low feedstock costs (gas prices
already went up 16% in April) which should help the company weather the crisis. Our weighted
Discounted Cash flows (Free Cash Flow to the Firm) and Relative Valuation models resulted in a
Long Term Fair Value of SAR70.58, up 12% from the stock price as on 30 June 2009 (Table
5).
Table 5 - SABIC Valuation
in SAR LTFV Weight Weighted Value
DCF - FCFF 75.32 80% 60.26
Relative valuation 51.64 20% 10.33
Hybrid valuation 70.58
July 2009 KMEFIC Research
Equity Analysis Report
The petrochemical sector in Saudi Arabia
P a g e | 23
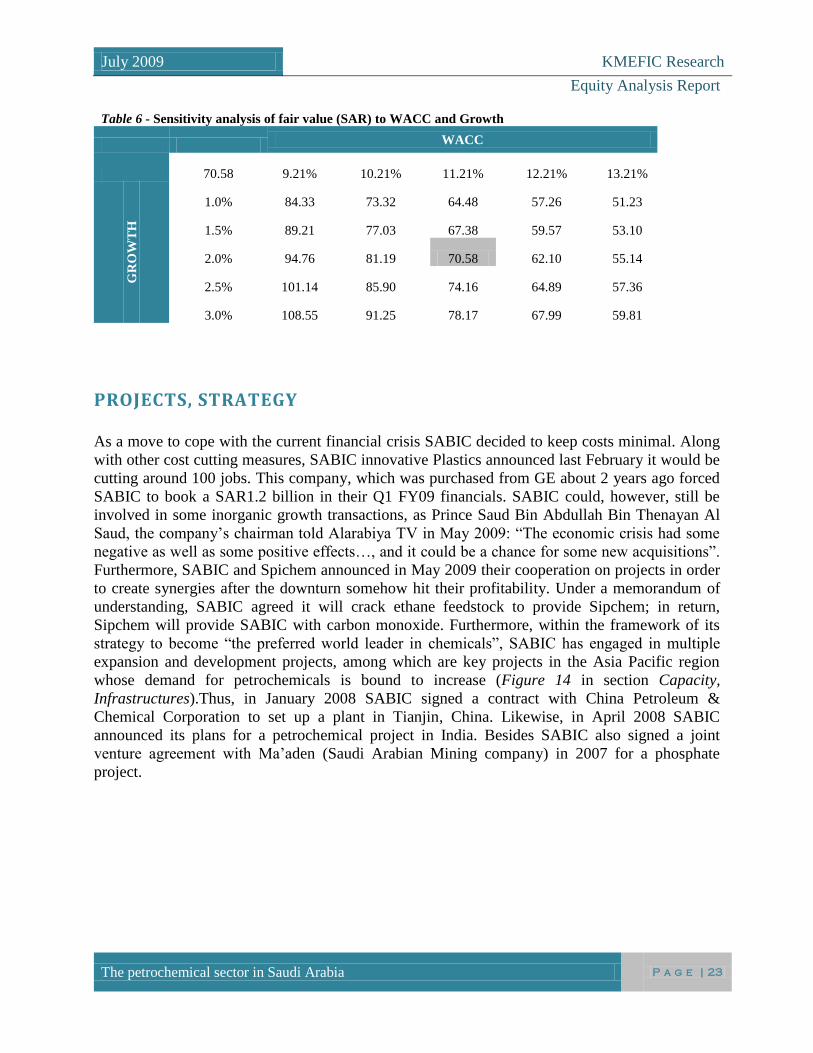
Table 6 - Sensitivity analysis of fair value (SAR) to WACC and Growth
WACC
70.58 9.21% 10.21% 11.21% 12.21% 13.21%
GR
OW
TH
1.0% 84.33 73.32 64.48 57.26 51.23
1.5% 89.21 77.03 67.38 59.57 53.10
2.0% 94.76 81.19 70.58 62.10 55.14
2.5% 101.14 85.90 74.16 64.89 57.36
3.0% 108.55 91.25 78.17 67.99 59.81
PROJECTS, STRATEGY As a move to cope with the current financial crisis SABIC decided to keep costs minimal. Along
with other cost cutting measures, SABIC innovative Plastics announced last February it would be
cutting around 100 jobs. This company, which was purchased from GE about 2 years ago forced
SABIC to book a SAR1.2 billion in their Q1 FY09 financials. SABIC could, however, still be
involved in some inorganic growth transactions, as Prince Saud Bin Abdullah Bin Thenayan Al
Saud, the company’s chairman told Alarabiya TV in May 2009: “The economic crisis had some
negative as well as some positive effects…, and it could be a chance for some new acquisitions”.
Furthermore, SABIC and Spichem announced in May 2009 their cooperation on projects in order
to create synergies after the downturn somehow hit their profitability. Under a memorandum of
understanding, SABIC agreed it will crack ethane feedstock to provide Sipchem; in return,
Sipchem will provide SABIC with carbon monoxide. Furthermore, within the framework of its
strategy to become “the preferred world leader in chemicals”, SABIC has engaged in multiple
expansion and development projects, among which are key projects in the Asia Pacific region
whose demand for petrochemicals is bound to increase (Figure 14 in section Capacity,
Infrastructures).Thus, in January 2008 SABIC signed a contract with China Petroleum &
Chemical Corporation to set up a plant in Tianjin, China. Likewise, in April 2008 SABIC
announced its plans for a petrochemical project in India. Besides SABIC also signed a joint
venture agreement with Ma’aden (Saudi Arabian Mining company) in 2007 for a phosphate
project.
July 2009 KMEFIC Research
Equity Analysis Report
The petrochemical sector in Saudi Arabia
P a g e | 24
Saudi Arabian Fertilizer Company (SAFCO)
Listing : Tadawul Sector : Petrochemical Industries
CMP (30 Jun - 09) : SAR113.50
Upside/ (Downside) : 24%
LTFV : SAR140.21
Opinion : Undervalued
Key Performance Indicators
in'million'SAR unless otherwise indicated (Dec year end) FY08 A FY09 E FY10 E FY11 E
Revenues 5,243 3,408 4,430 5,095
EBITDA 4,594 2,481 3,600 4,044
Net Profit 4,280 2,353 3,389 3,839
Gross Profit Margin 83.7% 69.0% 79.0% 78.0%
Operating Margin 80.8% 64.0% 74.5% 73.5%
Net Profit Margin 81.6% 69.0% 76.5% 75.3%
ROE 60.9% 30.5% 38.6% 37.5%
EPS (SAR) 17.12 9.41 13.56 15.35
EPS growth 55.0% -45.0% 44.1% 13.3%
P/E 6.6 12.1 8.4 7.4
BVPS (SAR) 32.1 29.6 40.7 41.1
P/BV 3.5 3.8 2.8 2.8
Dividend Yield 10.6% 4.6% 6.6% 7.4%
EV/EBITDA 6.2 11.4 7.9 7.0
Debt/Equity 7.3% 8.1% 7.3% 8.3%
Net Debt -2,102 -1,735 -4,229 -3,758 Source: KMEFIC Research, Financial Statements
SABIC
43%
General
Organization
for Social Insurance
14%
Free Float
43%
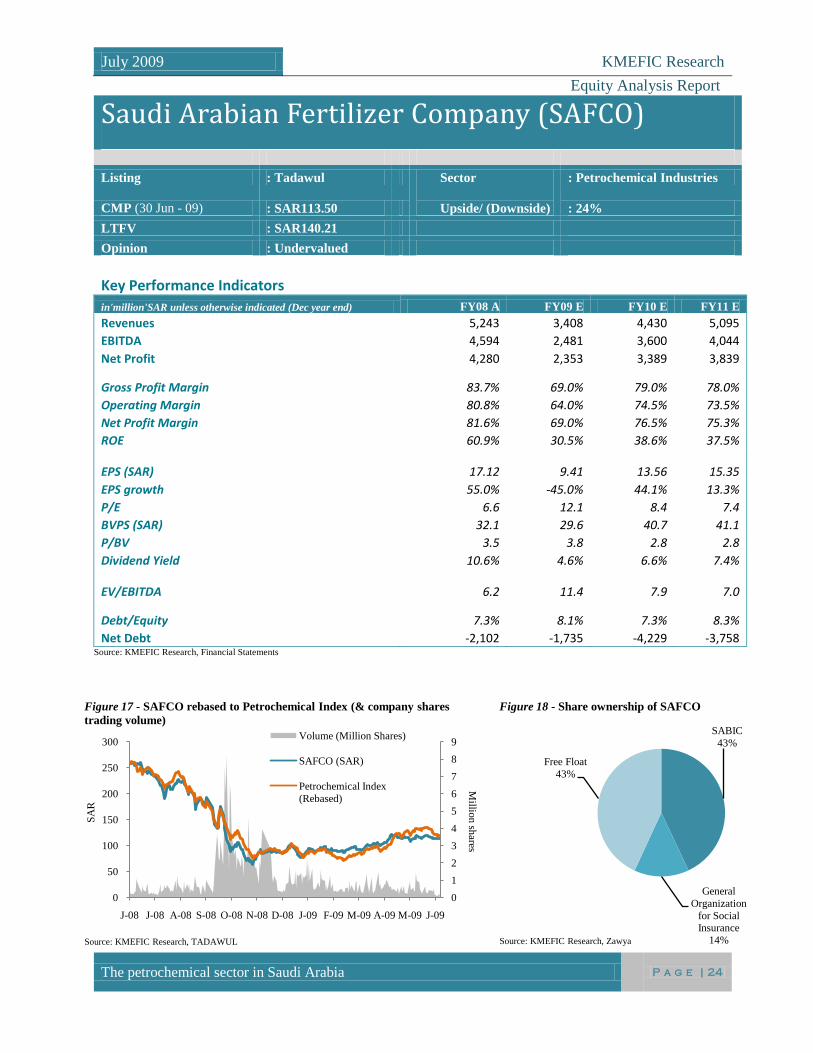
Figure 18 - Share ownership of SAFCO
Source: KMEFIC Research, Zawya
0
1
2
3
4
5
6
7
8
9
0
50
100
150
200
250
300
J-08 J-08 A-08 S-08 O-08 N-08 D-08 J-09 F-09 M-09 A-09 M-09 J-09
Volume (Million Shares)
SAFCO (SAR)
Petrochemical Index
(Rebased)
Source: KMEFIC Research, TADAWUL
Figure 17 - SAFCO rebased to Petrochemical Index (& company shares
trading volume)
Millio
n sh
ares
SA
R
July 2009 KMEFIC Research
Equity Analysis Report
The petrochemical sector in Saudi Arabia
P a g e | 25
COMPANY & BUSINESS OVERVIEW The Saudi Arabian Fertilizer Company (SAFCO), the first petrochemical company in Saudi
Arabia, was established in 1965 by a royal decree. SAFCO’s products include urea (since 1970),
ammonia (since 1970), sulfuric acid (since 1972) and melamine (since 1984). They are mostly
used in the agricultural industry but may as well supply other industries (Figure 4 in section
“Basic production flow”). The company’s products are sold domestically but also widely
exported to Asia, North America, South America, Australia and Europe. SAFCO, which has
grown organically to become the leading manufacturer and exporter of fertilizers in the Gulf
region, generated revenues of SAR5.2 billion in FY08, up 49% YoY, with 4.8 million metric
tonnes produced. SAFCO is currently 43% owned by SABIC, which may give it the opportunity
to benefit from potential synergies in certain business areas (such as sales, marketing, R&D). As
on 30 June 2009, the company’s market capitalization was SAR28.4 billion.
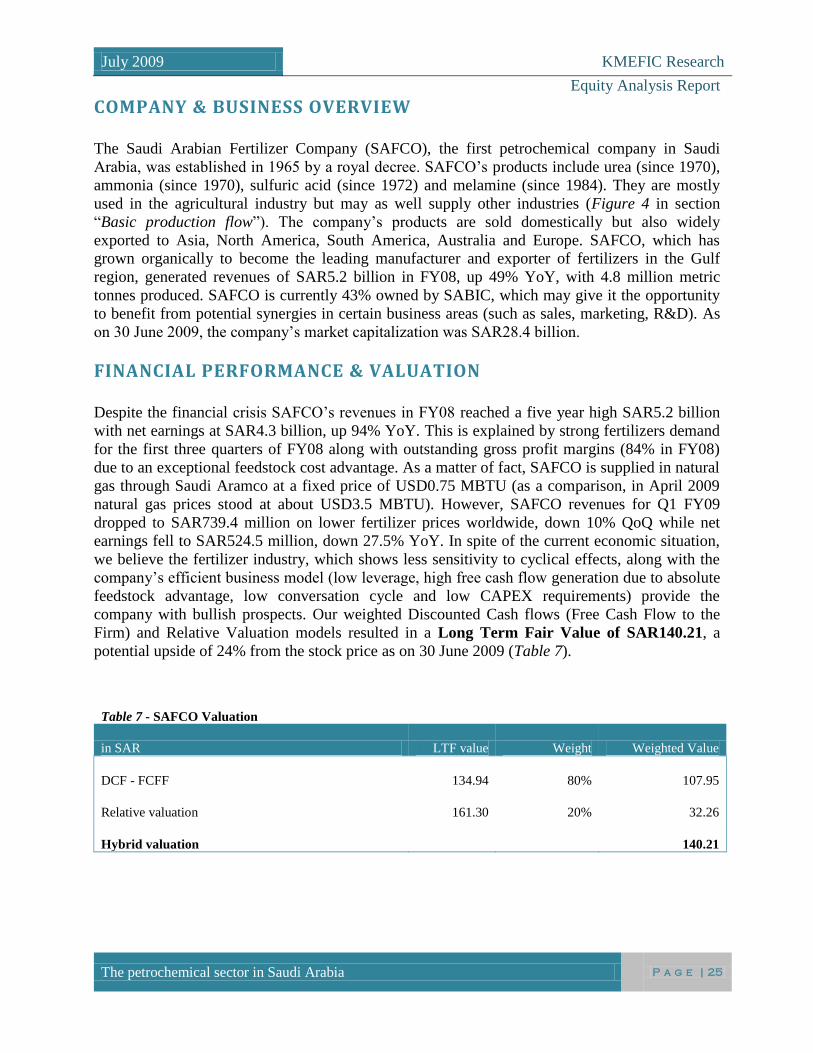
FINANCIAL PERFORMANCE & VALUATION Despite the financial crisis SAFCO’s revenues in FY08 reached a five year high SAR5.2 billion
with net earnings at SAR4.3 billion, up 94% YoY. This is explained by strong fertilizers demand
for the first three quarters of FY08 along with outstanding gross profit margins (84% in FY08)
due to an exceptional feedstock cost advantage. As a matter of fact, SAFCO is supplied in natural
gas through Saudi Aramco at a fixed price of USD0.75 MBTU (as a comparison, in April 2009
natural gas prices stood at about USD3.5 MBTU). However, SAFCO revenues for Q1 FY09
dropped to SAR739.4 million on lower fertilizer prices worldwide, down 10% QoQ while net
earnings fell to SAR524.5 million, down 27.5% YoY. In spite of the current economic situation,
we believe the fertilizer industry, which shows less sensitivity to cyclical effects, along with the
company’s efficient business model (low leverage, high free cash flow generation due to absolute
feedstock advantage, low conversation cycle and low CAPEX requirements) provide the
company with bullish prospects. Our weighted Discounted Cash flows (Free Cash Flow to the
Firm) and Relative Valuation models resulted in a Long Term Fair Value of SAR140.21, a
potential upside of 24% from the stock price as on 30 June 2009 (Table 7).
Table 7 - SAFCO Valuation
in SAR LTF value Weight Weighted Value
DCF - FCFF 134.94 80% 107.95
Relative valuation 161.30 20% 32.26
Hybrid valuation 140.21
July 2009 KMEFIC Research
Equity Analysis Report
The petrochemical sector in Saudi Arabia
P a g e | 26
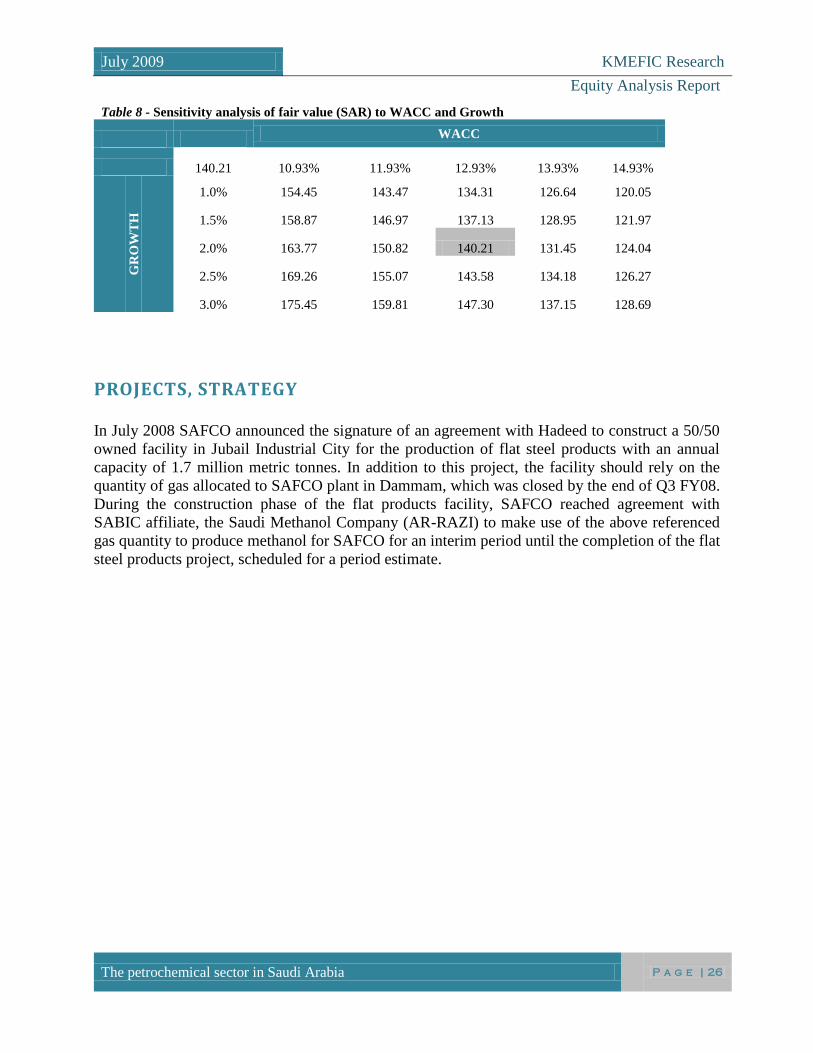
Table 8 - Sensitivity analysis of fair value (SAR) to WACC and Growth
WACC
140.21 10.93% 11.93% 12.93% 13.93% 14.93%
GR
OW
TH
1.0% 154.45 143.47 134.31 126.64 120.05
1.5% 158.87 146.97 137.13 128.95 121.97
2.0% 163.77 150.82 140.21 131.45 124.04
2.5% 169.26 155.07 143.58 134.18 126.27
3.0% 175.45 159.81 147.30 137.15 128.69
PROJECTS, STRATEGY In July 2008 SAFCO announced the signature of an agreement with Hadeed to construct a 50/50
owned facility in Jubail Industrial City for the production of flat steel products with an annual
capacity of 1.7 million metric tonnes. In addition to this project, the facility should rely on the
quantity of gas allocated to SAFCO plant in Dammam, which was closed by the end of Q3 FY08.
During the construction phase of the flat products facility, SAFCO reached agreement with
SABIC affiliate, the Saudi Methanol Company (AR-RAZI) to make use of the above referenced
gas quantity to produce methanol for SAFCO for an interim period until the completion of the flat
steel products project, scheduled for a period estimate.
July 2009 KMEFIC Research
Equity Analysis Report
The petrochemical sector in Saudi Arabia
P a g e | 27
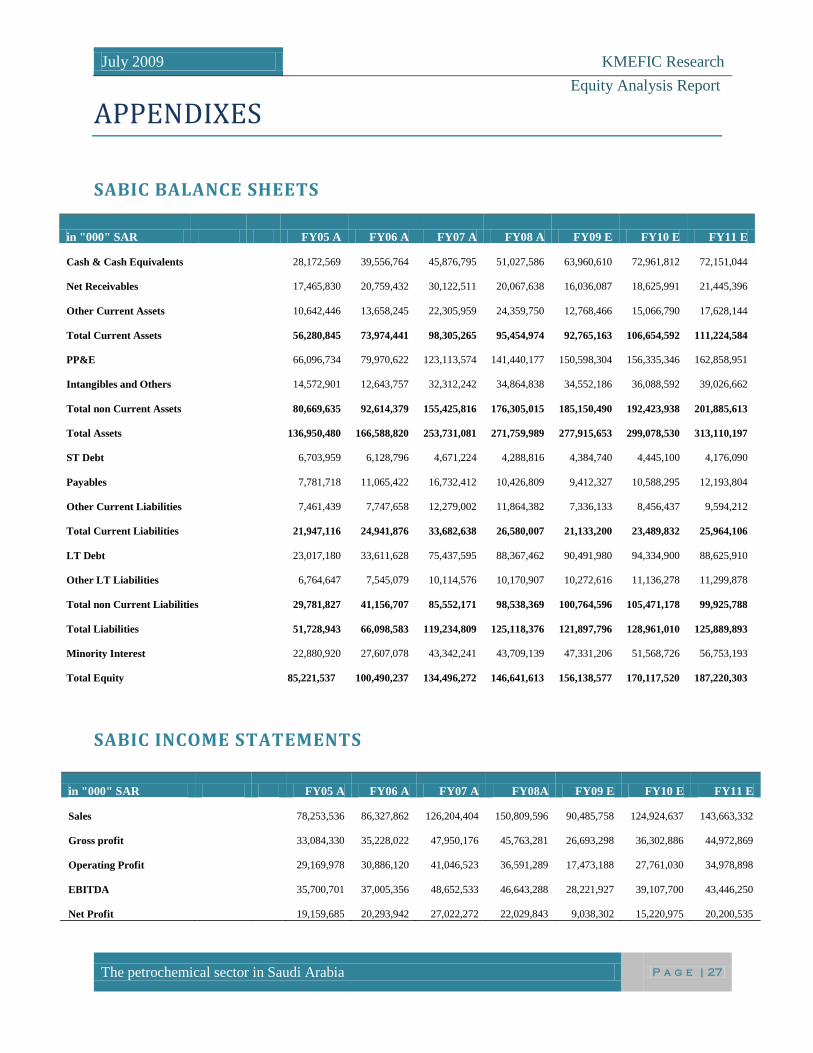
APPENDIXES
SABIC BALANCE SHEETS
SABIC INCOME STATEMENTS
in "000" SAR FY05 A FY06 A FY07 A FY08A FY09 E FY10 E FY11 E
Sales
78,253,536
86,327,862
126,204,404
150,809,596
90,485,758
124,924,637
143,663,332
Gross profit
33,084,330
35,228,022
47,950,176
45,763,281
26,693,298
36,302,886
44,972,869
Operating Profit
29,169,978
30,886,120
41,046,523
36,591,289
17,473,188
27,761,030
34,978,898
EBITDA
35,700,701
37,005,356
48,652,533
46,643,288
28,221,927
39,107,700
43,446,250
Net Profit
19,159,685
20,293,942
27,022,272
22,029,843
9,038,302
15,220,975
20,200,535
in "000" SAR FY05 A FY06 A FY07 A FY08 A FY09 E FY10 E FY11 E
Cash & Cash Equivalents
28,172,569
39,556,764
45,876,795
51,027,586
63,960,610
72,961,812
72,151,044
Net Receivables
17,465,830
20,759,432
30,122,511
20,067,638
16,036,087
18,625,991
21,445,396
Other Current Assets
10,642,446
13,658,245
22,305,959
24,359,750
12,768,466
15,066,790
17,628,144
Total Current Assets
56,280,845
73,974,441
98,305,265
95,454,974
92,765,163
106,654,592
111,224,584
PP&E
66,096,734
79,970,622
123,113,574
141,440,177
150,598,304
156,335,346
162,858,951
Intangibles and Others
14,572,901
12,643,757
32,312,242
34,864,838
34,552,186
36,088,592
39,026,662
Total non Current Assets
80,669,635
92,614,379
155,425,816
176,305,015
185,150,490
192,423,938
201,885,613
Total Assets
136,950,480
166,588,820
253,731,081
271,759,989
277,915,653
299,078,530
313,110,197
ST Debt
6,703,959
6,128,796
4,671,224
4,288,816
4,384,740
4,445,100
4,176,090
Payables
7,781,718
11,065,422
16,732,412
10,426,809
9,412,327
10,588,295
12,193,804
Other Current Liabilities
7,461,439
7,747,658
12,279,002
11,864,382
7,336,133
8,456,437
9,594,212
Total Current Liabilities
21,947,116
24,941,876
33,682,638
26,580,007
21,133,200
23,489,832
25,964,106
LT Debt
23,017,180
33,611,628
75,437,595
88,367,462
90,491,980
94,334,900
88,625,910
Other LT Liabilities
6,764,647
7,545,079
10,114,576
10,170,907
10,272,616
11,136,278
11,299,878
Total non Current Liabilities
29,781,827
41,156,707
85,552,171
98,538,369
100,764,596
105,471,178
99,925,788
Total Liabilities
51,728,943
66,098,583
119,234,809
125,118,376
121,897,796
128,961,010
125,889,893
Minority Interest
22,880,920
27,607,078
43,342,241
43,709,139
47,331,206
51,568,726
56,753,193
Total Equity
85,221,537
100,490,237
134,496,272
146,641,613
156,138,577
170,117,520
187,220,303
July 2009 KMEFIC Research
Equity Analysis Report
The petrochemical sector in Saudi Arabia
P a g e | 28
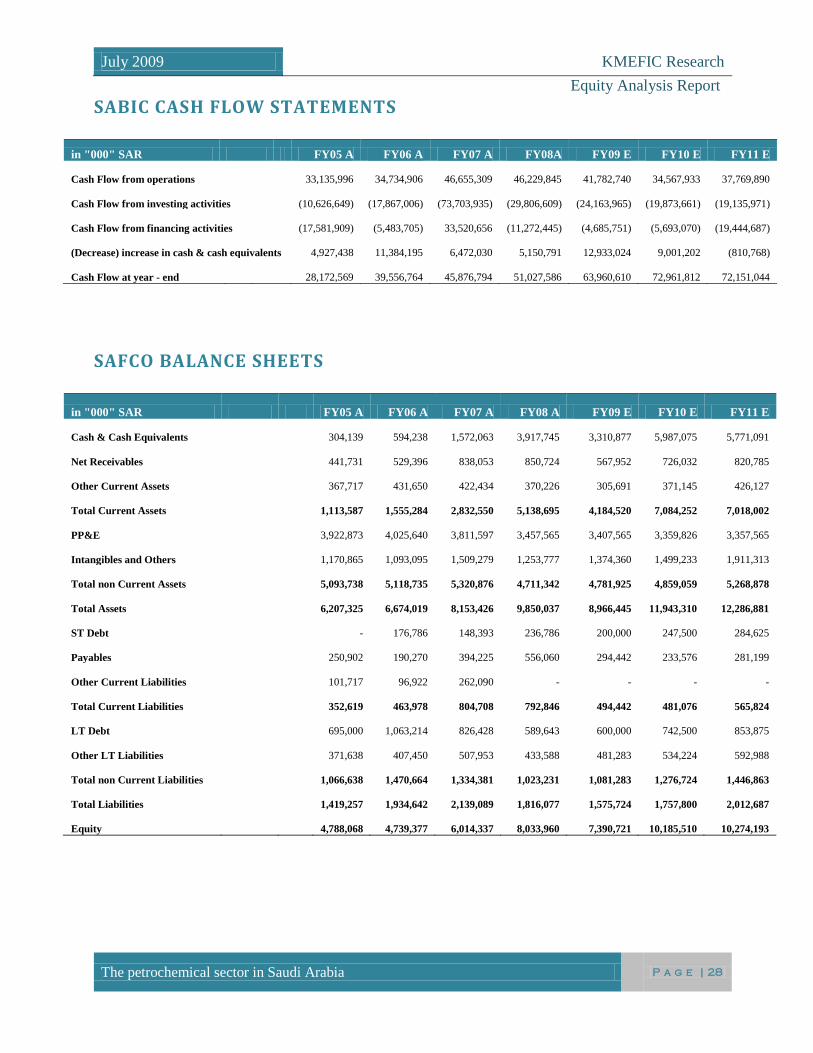
SABIC CASH FLOW STATEMENTS
in "000" SAR FY05 A FY06 A FY07 A FY08A FY09 E FY10 E FY11 E
Cash Flow from operations
33,135,996
34,734,906
46,655,309
46,229,845
41,782,740
34,567,933
37,769,890
Cash Flow from investing activities
(10,626,649)
(17,867,006)
(73,703,935)
(29,806,609)
(24,163,965)
(19,873,661)
(19,135,971)
Cash Flow from financing activities
(17,581,909)
(5,483,705)
33,520,656
(11,272,445)
(4,685,751)
(5,693,070)
(19,444,687)
(Decrease) increase in cash & cash equivalents
4,927,438
11,384,195
6,472,030
5,150,791
12,933,024
9,001,202
(810,768)
Cash Flow at year - end
28,172,569
39,556,764
45,876,794
51,027,586
63,960,610
72,961,812
72,151,044
SAFCO BALANCE SHEETS
in "000" SAR FY05 A FY06 A FY07 A FY08 A FY09 E FY10 E FY11 E
Cash & Cash Equivalents
304,139
594,238
1,572,063
3,917,745
3,310,877
5,987,075
5,771,091
Net Receivables
441,731
529,396
838,053
850,724
567,952
726,032
820,785
Other Current Assets
367,717
431,650
422,434
370,226
305,691
371,145
426,127
Total Current Assets
1,113,587
1,555,284
2,832,550
5,138,695
4,184,520
7,084,252
7,018,002
PP&E
3,922,873
4,025,640
3,811,597
3,457,565
3,407,565
3,359,826
3,357,565
Intangibles and Others
1,170,865
1,093,095
1,509,279
1,253,777
1,374,360
1,499,233
1,911,313
Total non Current Assets
5,093,738
5,118,735
5,320,876
4,711,342
4,781,925
4,859,059
5,268,878
Total Assets
6,207,325
6,674,019
8,153,426
9,850,037
8,966,445
11,943,310
12,286,881
ST Debt
-
176,786
148,393
236,786
200,000
247,500
284,625
Payables
250,902
190,270
394,225
556,060
294,442
233,576
281,199
Other Current Liabilities
101,717
96,922
262,090
- -
- -
Total Current Liabilities
352,619
463,978
804,708
792,846
494,442
481,076
565,824
LT Debt
695,000
1,063,214
826,428
589,643
600,000
742,500
853,875
Other LT Liabilities
371,638
407,450
507,953
433,588
481,283
534,224
592,988
Total non Current Liabilities
1,066,638
1,470,664
1,334,381
1,023,231
1,081,283
1,276,724
1,446,863
Total Liabilities
1,419,257
1,934,642
2,139,089
1,816,077
1,575,724
1,757,800
2,012,687
Equity
4,788,068
4,739,377
6,014,337
8,033,960
7,390,721
10,185,510
10,274,193
July 2009 KMEFIC Research
Equity Analysis Report
The petrochemical sector in Saudi Arabia
P a g e | 29
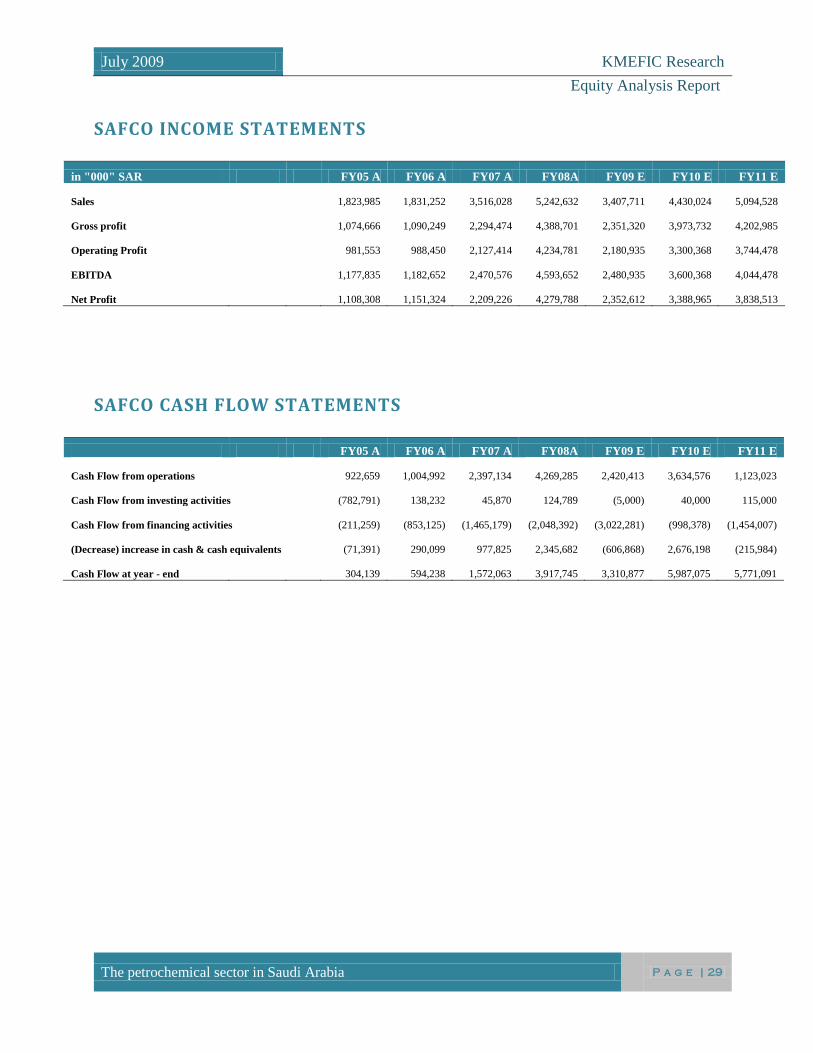
SAFCO INCOME STATEMENTS
in "000" SAR FY05 A FY06 A FY07 A FY08A FY09 E FY10 E FY11 E
Sales
1,823,985
1,831,252
3,516,028
5,242,632
3,407,711
4,430,024
5,094,528
Gross profit
1,074,666
1,090,249
2,294,474
4,388,701
2,351,320
3,973,732
4,202,985
Operating Profit
981,553
988,450
2,127,414
4,234,781
2,180,935
3,300,368
3,744,478
EBITDA
1,177,835
1,182,652
2,470,576
4,593,652
2,480,935
3,600,368
4,044,478
Net Profit
1,108,308
1,151,324
2,209,226
4,279,788
2,352,612
3,388,965
3,838,513
SAFCO CASH FLOW STATEMENTS
FY05 A FY06 A FY07 A FY08A FY09 E FY10 E FY11 E
Cash Flow from operations
922,659
1,004,992
2,397,134
4,269,285
2,420,413
3,634,576
1,123,023
Cash Flow from investing activities
(782,791)
138,232
45,870
124,789
(5,000)
40,000
115,000
Cash Flow from financing activities
(211,259)
(853,125)
(1,465,179)
(2,048,392)
(3,022,281)
(998,378)
(1,454,007)
(Decrease) increase in cash & cash equivalents
(71,391)
290,099
977,825
2,345,682
(606,868)
2,676,198
(215,984)
Cash Flow at year - end
304,139
594,238
1,572,063
3,917,745
3,310,877
5,987,075
5,771,091
July 2009 KMEFIC Research
Equity Analysis Report
The petrochemical sector in Saudi Arabia
P a g e | 30
This report is being provided for informational purposes only and on the condition that it will not form a primary basis for any investment
decision. This report is not an offer to buy or sell any of the securities that may be referred to herein. In no event will KMEFIC be liable for any
loss occurring from investment decisions made based on the recommendation here-enclosed. Past performance is not necessarily a guide to future
performance. Investors should make their own decision on whether or not to buy or sell the securities covered herein based upon their specific
investment goals and in consultation with their financial advisor. KMEFIC has no obligation to update, modify or amend this report or to
otherwise make any notification or announcement thereof in the event that any matter stated herein, or any opinion, projection, forecast or estimate
set forth herein, changes or subsequently becomes inaccurate. The inclusion of any opinions/estimates does not necessarily imply a
recommendation or endorse the views expressed within them. Many areas of the report contain opinions and/or analysis that represent the involved
analysts' views; neither the analysts nor KMEFIC shall be in any way liable for their opinions expressed in the report. KMEFIC may or may not
have ownership or interest in companies mentioned in this report. This report has been prepared and issued by the Research Department @ Kuwait
& Middle East Financial Investment Co. S.A.K. (KMEFIC), a licensed Kuwaiti investment company regulated by the Central Bank of Kuwait.
KMEFIC prepared this report using publicly available information, internal data, and other sources considered reliable; however, KMEFIC makes
no representations or warranties of any kind, express or implied, about the completeness, accuracy, reliability, suitability with respect to the report
or the information, analysis, opinions, or related graphics contained on the report for any purpose. While great care has been taken to ensure that
the facts stated are accurate, neither KMEFIC nor any of its employees shall be in any way responsible for the contents. Neither this document nor
any of its contents may be distributed in any jurisdiction where its distribution is restricted by law. Neither this document nor its content may be
copied, transmitted or distributed without the prior written consent of KMEFIC. Additional information on the contents of this report is available
on request.
July 2009 KMEFIC Research
Equity Analysis Report
The petrochemical sector in Saudi Arabia
P a g e | 31
This page was left blank intentionally
Source: Reuters
م .ك.م.المالي ش شركة الكويت والشرق األوسط لإلستثمار
+(965 )63222525: فاكس –+( 965 )22255000: هاتف –13009 صفاة الكويت 819.ب.صKuwait and Middle East Financial Investment Company K.S.C.C
P.O.Box 819 Safat 13009 Kuwait – Telephone: (+965) 22255000 – Fax: (+965) 22252563
[email protected] – www.kmefic.com.kw
Q1 2009