kod projek: g kementerian pendidikan … · g a focal point of recent research on criminology is to...
TRANSCRIPT
BORANG ERGS - P3(R)
G KEMENTERIAN PENDIDIKAN MALAYSIA
Kod Projek:
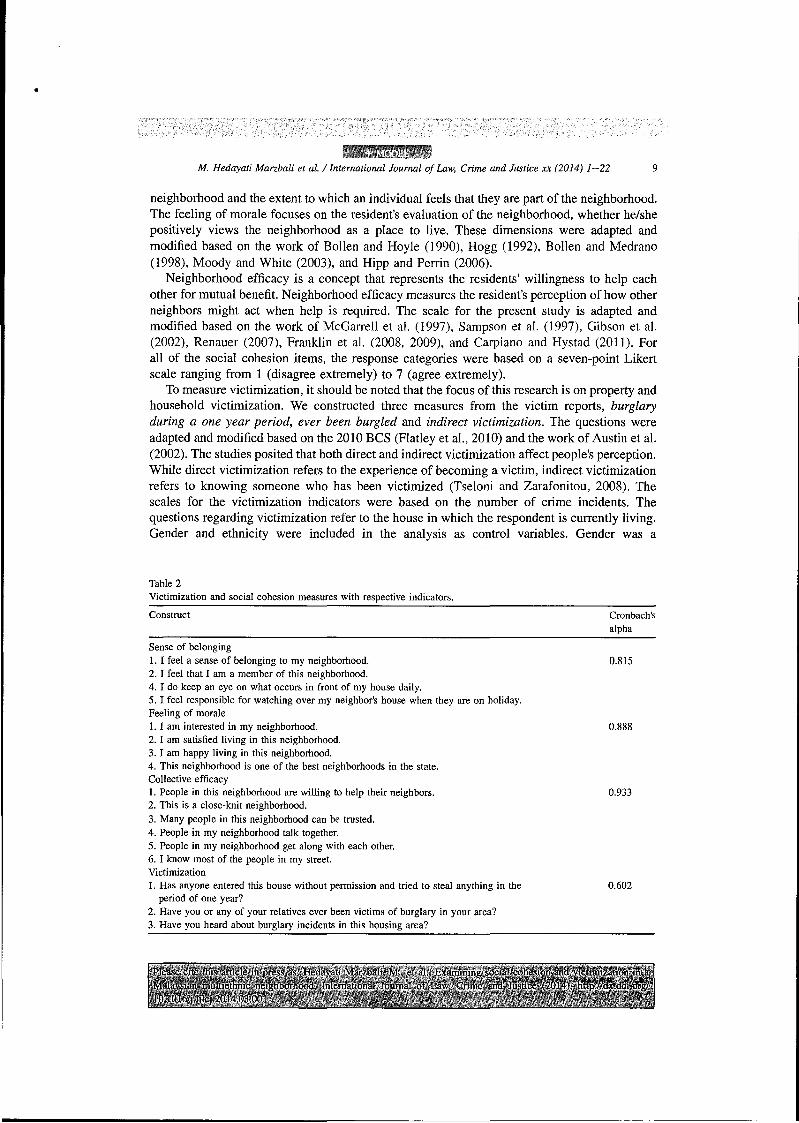
FINAL REPORT EXPLORATORY RESEARCH GRANT SC
Laporan Akhir Skim Geran Penyelidikan ,...~_cmlnrt=l 2014
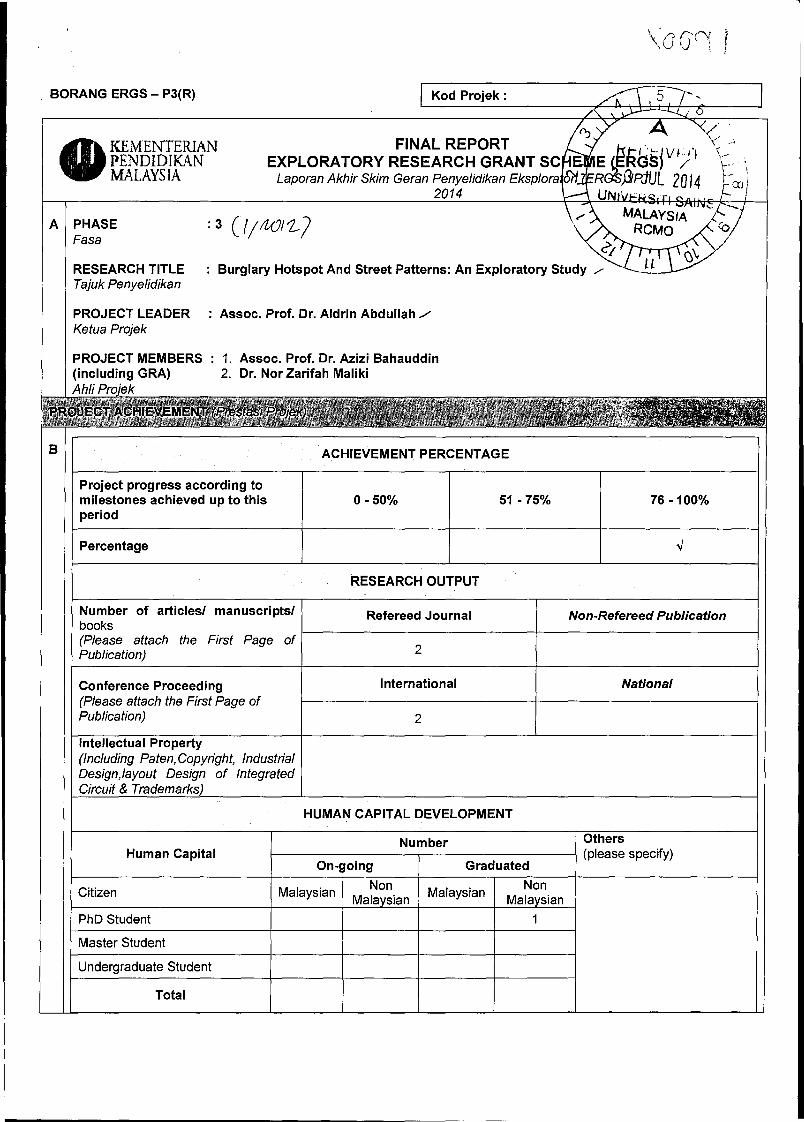
: 3 C! / !l{J(l) A PHASE Fasa
\aG~
RESEARCH TITLE Tajuk Penyelidikan
: Burglary Hotspot And Street Patterns: An Exploratory Study /
B
PROJECT LEADER Ketua Projek
: Assoc. Prof. Dr. Aldrin Abdullah ./
PROJECT MEMBERS : 1. Assoc. Prof. Dr. Azizi Bahauddin (including GRA) 2. Dr. Nor Zarifah Maliki Ahli
ACHIEVEMENT PERCENTAGE
Project progress according to milestones achieved up to this period
Percentage
Number of articlesl manuscriptsl books (Please attach the First Page of Publication)
Conference Proceeding (Please attach the First Page of Publication)
(Including Paten, Copyright, Industrial Design,layout Design of Integrated Circuit & Tr""r/",,,m!lrvC'
Human Capital
0-50% 51 -75%
RESEARCH OUTPUT
Refereed Journal
2
International
2
HUMAN CAPITAL DEVELOPMENT
Number
On-going Graduated
Citizen Malaysian Malaysian
PhD Student
Master Student
Undergraduate Student
Total
76 -100%
Non-Refereed Publication
National
n

C Budget Approved (Peruntukan diluluskan) Amount Spent (Jumlah Perbelanjaan)
RM 50,000.00 RM 49,868.00
D
Balance (8aki) Percentage of Amount Spent (Peratusan 8elanja)
International Activit
(e.g: Course! Seminar! Symposium! Conference! Workshop! Site Visit)
National Activity
(e.g: Course! Seminar! Symposium! Conference! Workshop! Site Visit)
RM 132.65 99.7%
Date (Month, Year) Workshop on Structural Equation Modeling (SEM), a pre-conference workshop of International Conference on Statistics in Science, Business and Engineering 2012 (Sep, 2012)
Date (Month, Year)
Partial Least Square (PLS) workshop (Feb, 2014)
Or anizer Universiti Teknologi Mara
Organizer
School of Management, Universiti Sains Malaysia
E Often it is simply not possible to gather all the information needed, especially in crime studies due to confidentiality issues. Time, access and resources should all be taken into consideration as they could impact data availability. Awareness of those constraints means knowing the limitations on the quality of available information. Based on the 2008 British Crime Survey (BCS), victimization survey provides the most reliable measure of the extent of actual victimization, while the police offence report covers crimes that are reported to and recorded by the pOlice. Since the current study used the same crime index as given by the police, the result of the survey indicates that 57% of the victimized respondents did not report to the police, suggesting a high proportion of unreported crime. On the other hand, the lack of official motorcar crimes by Mukim can be considered as a second limitation of the study. To overcome this, the present study has employed a victimization survey to measure a more accurate picture of the true extent of crime.
F It is believed that burglary is concentrated at certain geographic hotspots. The findings illustrated that the culde-sacs road type could increase the degree of social integration and at the same time reduce perceived fear of crime by residents compared to other road types. Tessellation planning and honeycomb housing design concepts are the best examples of housing layouts composed of cul-de-sac street types. Basic features of such designs include creating a safe, pleasant and shady area just outside the home.

Another concern, in relation to burglary and design features refers to the existence of a footpath for a street segment that connects to another street network. This kind of footpaths increase the risk of burglary, and decrease the privacy and amenities of adjoining properties. The findings indicated that residents who have lived in such streets perceive higher levels of fear of crime compared to others. Consistently, evidence suggested that this kind of footpaths that connect the cul-de-sac to a larger network increase crime risk. Professionals involved in the design process of residential areas should limit the use of rear footpaths which may act as offenders' escape routes. Meanwhile, local authorities can provide some good lighting at night in order to decrease crime opportunities for the existing footpaths.
G A focal pOint of recent research on criminology is to understand how crime evolves and the means to curb it. Crime and fear of crime are issues for citizens, police, communities and governments. Reducing crime and fear of crime using design and planning initiatives is a relatively new and increasingly popular trend. The Malaysian government recognizes this problem and has put great emphasis in reducing burglary in residential area through the six NKRA as established in the Government Transformation Programme. Crime prevention through environmental design (CPTED) methods have been adopted as the efforts of preventing or reducing crimes. Today's CPTED proponents claim that modifying environmental design can reduce opportunities of criminal acts, and provide a better quality of life to improve human's basic needs. The findings illustrated that the cul-de-sacs road type could increase the degree of social integration and at the same time reduce crime and perceived fear of crime by residents compared to other road types. Results of the study suggested that the degree of social integration has a great effect in reducing crime. Therefore, local authorities or the neighborhood committee should encourage a sense of ownership and feelings of attachment among the residents by organizing community events.
Date Tarikh
1 July 2014
H ................................................................ ....................................................................................................................
.........................
Name: Nama:
Date: Tarikh:
........................... ..............................................
PROF. MADYA LEE KEAT TEONG Pengarah
Pejabal Pengurusan & Kreativiti Penyelidikar Universiti Sa ins Malaysia
1'IPnn! J0.~.~ P~jh~' Dt .. ,~."')~;
.................. ........................... .....................................
Signature: Tandatangan:
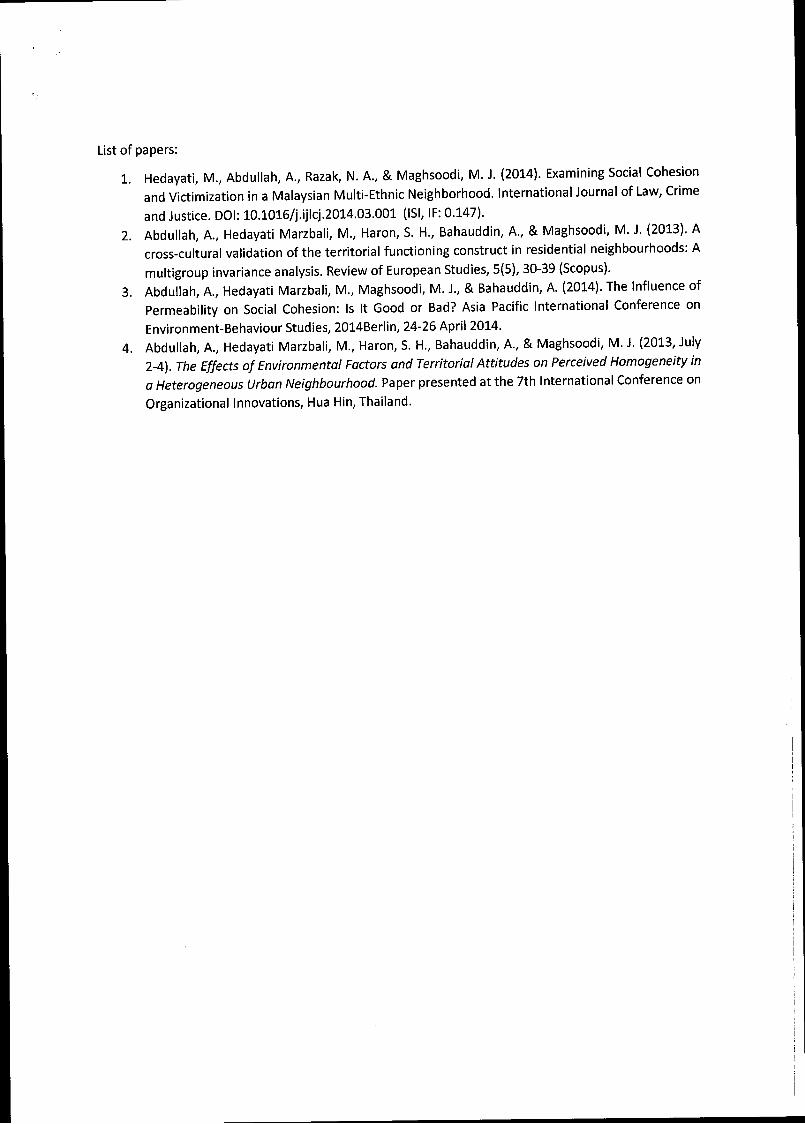
List of papers:
1. Hedayati, M., Abdullah, A., Razak, N. A., & Maghsoodi, M. J. (2014). Examining Social Cohesion
and Victimization in a Malaysian Multi-Ethnic Neighborhood. International Journal of Law, Crime
and Justice. 001: 10.1016/j.ijlcj.20l4.03.00l (151, IF: 0.147). 2. Abdullah, A., Hedayati Marzbali, M., Haron, S. H., Bahauddin, A., & Maghsoodi, M. J. (2013). A
cross-cultural validation of the territorial functioning construct in residential neighbourhoods: A
multigroup invariance analysis. Review of European Studies, 5(5), 30-39 (Scopus).
3. Abdullah, A., Hedayati Marzbali, M., Maghsoodi, M. J., & Bahauddin, A. (2014). The Influence of
Permeability on Social Cohesion: Is It Good or Bad? Asia Pacific International Conference on
Environment-Behaviour Studies, 2014Berlin, 24-26 April 2014. 4. Abdullah, A., Hedayati Marzbali, M., Haron, S. H., Bahauddin, A., & Maghsoodi, M. J. (2013, July
2-4). The Effects of Environmental Factors and Territorial Attitudes on Perceived Homogeneity in
a Heterogeneous Urban Neighbourhood. Paper presented at the 7th International Conference on
Organizational Innovations, Hua Hin, Thailand.
i I I
ELSEVIER
Available online at www.sciencedirect.com
ScienceDirect International Journal of Law, Crime and Justice
xx (2014) 1-22
International Journal of Law,
Crime and Justice
www.elsevier.com/locate/ijlcj
Examining social cohesion and victimization in a Malaysian multiethnic neighborhood
Massoomeh Hedayati Marzbali a, I, Aldrin Abdullah a, * , Nordin Abd Razak b,2, Mohammad Javad Maghsoodi Tilaki a,3
a University Sains Malaysia, School of Housing, Building & Planning, USM, 11800 Pulau Penang, Malaysia b University Sains Malaysia, School of Educational Studies, USM, 11800 Pulau Penang, Malaysia
Abstract
The ecological theories linking neighborhood characteristics to victimization have rarely been tested in Asia. This article examines three conceptual models of social cohesion (collective efficacy, sense of belonging and feeling of morale) that are designed to explain the residents' victimization in Malaysia. This study focuses on the effects of social cohesion on crime using a sample of 294 ethnically diverse residents living in a high-crime neighborhood. The study shows the relevance of all three conceptual models in predicting victimization for both males and females. The findings indicate that a greater sense of belonging and feeling of morale among the neighborhood residents is significantly associated with lower levels of victimization. Contrary to the literature, the collective efficacy measure was associated with higher reported victimization. Our model also links social cohesion measures to neighborhood racial heterogeneity, a finding that adds knowledge to the study of ethnic diversity and crime-community relationships. © 2014 Elsevier Ltd. All rights reserved.
Keywords: Social cohesion; Feelings of morale; Sense of belonging; Victimization; Neighborhood
* Corresponding author. Tel.: +60 12 410 4715. E-mail addresses:[email protected](M.HedayatiMarzbali)[email protected](A.Abdullah)[email protected] (N.A.
Razak), [email protected] (MJ. Maghsoodi Tilaki). lTel.: +60 17447 1295; fax: +6046576523. 2Tel.: +60 17 455 9554. 3Tel.: +60 17 405 8454.
http://dx.doi.orgIiO. J 0 16/j.ijlcj.20 14.03.00 I 1756-0616/© 2014 Elsevier Ltd. All rights reserved.
2 M. Hedayati Marzbali et at. / International Journal of Law, Crime and Justice xx (2014) 1-22
1. Introduction
The ecological theories linking neighborhood characteristics to victimization have rarely been tested outside the context of the United States and Western Europe (Villarreal and Silva, 2006). There is growing recognition that perceived cohesion and the neighborhood context contribute significantly to the residents' well-being. One of the theories that links neighborhood structure to crime is social disorganization theory (Wong, 2012). This theory, which originated from the work of the early Chicagoan researchers (Shaw and McKay, 1942), hypothesized that the crime rate is a function of neighborhood cohesion, which is the result of informal social control (Rountree and Warner, 1999). This theory focuses on the direct relationship between community characteristics and crime through the mediation of social processes (McCrea et aI., 2005). Traditional social disorganization theory focuses on crime and disorder rather than on the fear of crime. However, some studies have linked neighborhood structure and cohesion to both crime and fear through the incivilities thesis (Markowitz et aI., 2001). In addition, several studies have found that social cohesion and neighborhood safety are associated with social disorganization theory, which takes into consideration the fact that neighborhoods with a high sense of social cohesion are able to control their surrounding area and, as a consequence, experience less crime (Hale, 1996; Steenbeek and Hipp, 2011; van Wilsem et aI., 2006).
Neighborhood cohesion enables the residents to bond together, which leads to an increase in their sense of belonging to the community. The sharing of resources among residents is part of a theoretical model that posits that social cohesion positively affects health outcomes (Putnam, 2000) and reduces crime rates (Hirschfield and Bowers, 1997; Lee, 2000). Brown et al. (2003) viewed neighborhood cohesion as the socio-psychological bonds to the social and physical surroundings. The previous research has defined neighborhood cohesion as the ability of residents to recognize strangers as well as the degree of their sense of belonging to their neighborhood (Hunter and Baumer, 1982). Neighborhood cohesion is one of the inhibitors of crime and fear, and neighborhoods with high levels of cohesion are associated with low levels of crime and fear (Lewis and Salem, 1986; Perkins et aI., 1990; Rountree and Land, 1996).
However, the present study defines social cohesion as the degree to which the residents perceive cohesion within their neighborhood. The underlying assumption is conceptualized based on social disorganization theory, where the residents' perceived social cohesion is associated with low crime rates (Sampson and Raudenbush, 1999). Despite the importance that early social disorganization theorists attributed to poverty as a key factor diminishing neighborhoods, the extent to which the effect of neighborhood disorganization on crime is mediated through the social cohesion among residents as a community characteristic remains insufficiently understood. Yet, the organization of urban communities in developing countries may challenge the stereotypes presented in previous studies on the effect of structural characteristics, specifically the effects of poverty and ethnic heterogeneity on crime. This article examines social disorganization theory in the context of urban Malaysia, focusing on high-crime middle class multiethnic residents. The present study employs structural equation modeling (SEM) approach using bootstrapping estimation to understand the relationships between ethnicity, social cohesion and crime.
1.1. Neighborhood cohesion and victimization
Social disorganization theory focuses on the direct relationship between the neighborhood structure and crime through the mediation of social cohesion (McCrea et aI., 2005; Rountree
M. Hedayati Marzbali et al. I International Journal of Law. Crime and Justice xx (2014) 1-22 3
and Warner, 1999). Markowitz et al. (2001) point out that there are very limited studies on the relationship between crime, fear and various dimensions of neighborhood cohesion and the results are mixed (Liska and Warner, 1991; Sampson et aI., 1997; Skogan and Maxfield, 1981; Taub et aI., 1984; Taylor, 1995). Consistent with social disorganization theory, Steenbeek and Hipp (2011) conducted a longitudinal study in the Netherlands and found a significant negative effect from high ethnic heterogeneity on social cohesion, and consequently, the study found that less social cohesion is associated with high crime risk. Research has suggested examining the hypothesized effect of social environment and peoples' behavior as a mediating effect on crime (Foster and Giles-Corti, 2008). Fishkin et al. (1997) found the associations between demographic characteristics (such as ethnicity), exposure to victimization and fear of crime. Based on social disorganization theory, Wong (2012) proposed that ethnic heterogeneity is a predictive of high rates of crime in urban areas.
On the relationship between social interactions and victimization, research noted that friendship networks may predict victimization (Giannotta et aI., 2012). Meanwhile, Bellair and Browning (2010) revealed that social cohesion and informal social control are associated with both property and violent crimes. However, all types of social cohesion are not equally effective in increasing social control and reducing the crime rate (Warner and Rountree, 1997). Sampson and Groves (1989) found that neighborhood cohesion significantly reduces some types of victimization, including burglary and robbery, while no significant effect was found on violent crime, vandalism and car theft. The findings of the work of Sampson and Raudenbush (1999) indicated that although neighborhood efficacy is a predictor of violent crime, no significant effect was found in relation to burglary. Warner and Rountree (1997) found an inverse effect from social cohesion on the crime risk in a predominantly white neighborhood but not in a multiracial neighborhood. These authors further reported an inverse effect of social cohesion on assault but a positive effect on burglary. In a black middle-class neighborhood, Pattillo (1998) suggested that the effectiveness of social cohesion in controlling crime is moderated by the characteristics of the neighborhood such as high crime and high poverty. In sum, several studies on the influence of social cohesion on crime levels have found mixed results, indicating that cohesion does not always reduce all crime types. However, for the concept of neighborhood cohesion to be useful in reducing crime, it is important, in particular, that it operates in a medium-income high-crime context where the residents often do not have the economic means to engage in using safety devices.
1.2. Neighborhood cohesion and demographic factors
Certain groups in society tend to have more social interactions than others, and this can have an influence on the level of victimization (Fishkin et aI., 1997) and perceived social cohesion. As suggested by Taylor (1997), demographic factors have a great effect on the perceived control among residents. Local friendship ties and the level of participation in society vary across communities based on residential stability (Sampson, 1999). Research indicates that the more stable neighborhoods have a perceived higher level of neighborhood integrity (Lewis and Salem, 1986). A study conducted in the US context found that there is a significant effect from social cohesion on victimization for male respondents whereas no significant effect was found for females (Schafer et aI., 2006). With the recognition of the importance of demographic factors in neighborhood crime studies, the present study will bring additional insights into the body of knowledge by focusing on the influence of neighborhood diversity on both social cohesion and victimization.
4 M. Hedayati Marzbali et al. / International Journal of Law, Crime and Justice xx (2014) 1-22
1.3. Social cohesion in Malaysia
Malaysia is a unique country with a multiethnic, multi-religion and multilingual population. The main ethnic groups consist of Malay (55%), Chinese (24%), and Indian (7%), and various other ethnic minorities (13%) make up the rest of the population (Department of Statistics Malaysia, 2012). The pattern of social cohesion among the different ethnic groups has been a major focus of studies in Malaysia. In various other countries, studies have found that there is low social integration in multiracial communities (Costa and Kahn, 2003; Putnam, 2007). Support for this assumption comes from work by Gijsberts et al. (2012) in a European context, which indicates a negative effect from ethnic diversity on the degree of contact in the neighborhood (Gijsberts et aI., 2012). The relationship between the community's ethnic composition and its effect on social cohesion and the crime rate is not a new debate. In the early decades of the twentieth century, Shaw and McKay (1942) developed social disorganization theory on the basis of the link between neighborhood structure (including ethnic heterogeneity) and crime through the mediating role of social processes. However, addressing crime-community relationships as in this study is especially important for countries such as Malaysia because of the diverse religious and cultural background of its population. The evidence suggests that the three dominant ethnic groups have their own cultures, beliefs, norms and values, which have a great impact on the development of personal behavior (Yusof, 2006). A study in Kelantan, Malaysia, examined the social network between Muslims and Buddhists and suggested that the possible disruptive element in the interactions between the two groups is trivial religious issues (Engku Alwi and Mohd Rashid, 2011). In addition, Ahmad and Syed Abdul Rashid (2003) have conducted a study on the patterns of social interaction in a residential neighborhood in Kuala Lumpur among the Malay and Chinese residents. They found that although social interaction takes place between both ethnic groups, the Chinese residents tend to make more of an effort to socialize with their neighbors than the Malay residents. However, despite their socialization efforts, there is a lack of participation in the neighborhood activities amongst the Chinese compared to the Malays (Ahmad and Syed Abdul Rashid, 2003).
1.4. Conceptual model development
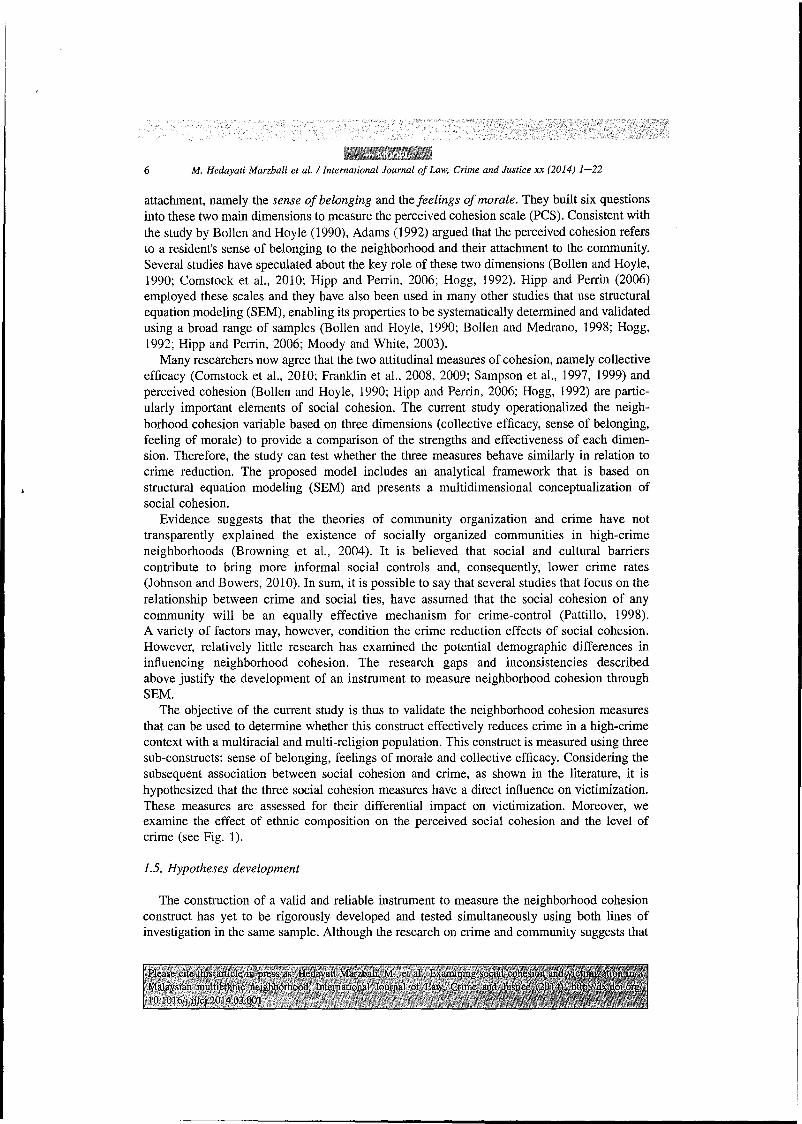
Table 1 summarizes a selection of the previous research on crime, illustrating a wide range of measurements for social cohesion. The researchers have conceptualized the perceived social cohesion within a neighborhood in different terms. Neighborhood cohesion based on attitudinal measures is hypothesized to measure two different attributes. The first attribute refers to asking respondents to report on their own feelings of cohesion, whereas the second focuses on the perceived cohesion of others in the locale. The latter comes from a study conducted by Sampson and colleagues in 1997. Although these questions have been used by many researchers, one limitation of this measurement is that the respondents are required to determine answers in areas where they may not accurately have knowledge, such as the extent to which others are willing to help or get along with others (Hipp and Perrin, 2006). However, a stream of research employs these questions in examining the perceptions of residents to understand how their other neighbors behave in specific situations, which is known as collective efficacy (Browning and Cagney, 2002; Comstock et aI., 2010). Collective efficacy is defined as the perceived social cohesion among residents combined with their willingness to intervene for their neighborhood's benefit (Sampson et a!., 1997). It is believed that generating feelings of
M. Hedayati Marzbali et al. / International Journal of Law, Crime and Justice xx (2014) 1-22 5
Table I Summary of selected prior studies using community social organization measures.
Study
McDougall (1920) Bollen and Hoyle (1990)
Bellair (1997) Warner and Rountree (1997)
Sampson et al. (1997)
Greenberg and Rohe (1982) Sampson and Groves (1989)
Pattillo (1998) Bonaiuto et al. (1999)
Rountree and Warner (1999)
Morenoff et al. (2001)
Markowitz et al. (2001) Browning et al. (2002,2004)
McCrea et al. (2005)
Schafer et al. (2006)
Villarreal and Silva (2006) Hipp and Perrin (2006)
van Hooijdonk et al. (2008)
Franklin et al. (2008, 2009) Comstock et al. (20 I 0) Steenbeek and Hipp (2011) Lindblad et al. (2012) Kuipers et al. (2012)
Takagi et al. (2012)
Context
US
New York, US Washington, US
Chicago, US
Atlanta, Georgia UK
Chicago, US Rome, Italy
Washington, US
Chicago, US
UK Chicago, US
Brisbane, Australia
Midwestern, US
Brazil Southern US
Netherlands
Washington, US Colorado, US Netherlands Carolina, US Netherlands
Japan and US
Community organization measures
Attachment to the group Perceived cohesion scale: Individual perceptions of their own cohesion to a group (sense of belonging and feeling of morale) Frequency of interaction with neighbors Sharing tools and having food with neighbors and helping neighbors with a problem Social cohesion and trust combined with the willingness to intervene on behalf of the common good (collective efficacy) Willingness to intervene in a hypothetical disturbance Friendship network in the neighborhood and organizational participation Dense social network and informal surveillance Neighborhood attachment: residents' feelings for the neighborhood Sharing tools and having food with neighbors and helping neighbors with a problem Collective efficacy, friendship ties and organizational participation Perceived cohesion and trust Collective efficacy, favor exchange and frequency of interaction with neighbors Neighborhood trust, goodwill, reciprocity, involvement and friendliness Frequency of interaction with neighbors, get together socially with neighbors, sharing tools with neighbors and agree to watch a neighbor's home Frequency of interaction with neighbors Social cohesion: sense of belonging and feelings of morale Social cohesion: sense of belonging and feelings of morale Perceived cohesion and trust Collective efficacy and neighborhood attachment Collective efficacy and sense of belonging Collective efficacy and informal social control Social cohesion: sense of belonging and feelings of morale Generalized trust, reciprocity and supportive network
neighborhood efficacy allows the residents to feel that they are not alone in wanting a safe living environment (Schafer et aI., 2006).
However, a line of scholars utilized scales in which individuals only assessed their own feelings to solve the intellectual challenges of assessing the respondents' views on the feelings of others. Bollen and Hoyle (1990) argued that although neighborhood cohesion is extensively researched, the individual group members' perceptions of the level of cohesion within a particular group are largely ignored. In spite of this existing gap in knowledge, these authors conceptualized the perceived cohesion of the individuals to a particular group, including two main dimensions derived from McDougall's (1920) study of the formation of neighborhood
6 M. Hedayati Marzbali et al. / International Journal of Law. Crime and Justice xx (2014) 1-22
attachment, namely the sense of belonging and the feelings of morale. They built six questions into these two main dimensions to measure the perceived cohesion scale (PCS). Consistent with the study by Bollen and Hoyle (1990), Adams (1992) argued that the perceived cohesion refers to a resident's sense of belonging to the neighborhood and their attachment to the community. Several studies have speculated about the key role of these two dimensions (Bollen and Hoyle, 1990; Comstock et aI., 2010; Hipp and Perrin, 2006; Hogg, 1992). Hipp and Perrin (2006) employed these scales and they have also been used in many other studies that use structural equation modeling (SEM), enabling its properties to be systematically determined and validated using a broad range of samples (Bollen and Hoyle, 1990; Bollen and Medrano, 1998; Hogg, 1992; Hipp and Perrin, 2006; Moody and White, 2003).
Many researchers now agree that the two attitudinal measures of cohesion, namely collective efficacy (Comstock et aI., 2010; Franklin et aI., 2008, 2009; Sampson et aI., 1997, 1999) and perceived cohesion (Bollen and Hoyle, 1990; Hipp and Perrin, 2006; Hogg, 1992) are particularly important elements of social cohesion. The current study operationalized the neighborhood cohesion variable based on three dimensions (collective efficacy, sense of belonging, feeling of morale) to provide a comparison of the strengths and effectiveness of each dimension. Therefore, the study can test whether the three measures behave similarly in relation to crime reduction. The proposed model includes an analytical framework that is based on structural equation modeling (SEM) and presents a multidimensional conceptualization of social cohesion.
Evidence suggests that the theories of community organization and crime have not transparently explained the existence of socially organized communities in high-crime neighborhoods (Browning et aI., 2004). It is believed that social and cultural barriers contribute to bring more informal social controls and, consequently, lower crime rates (Johnson and Bowers, 2010). In sum, it is possible to say that several studies that focus on the relationship between crime and social ties, have assumed that the social cohesion of any community will be an equally effective mechanism for crime-control (Pattillo, 1998). A variety of factors may, however, condition the crime reduction effects of social cohesion. However, relatively little research has examined the potential demographic differences in influencing neighborhood cohesion. The research gaps and inconsistencies described above justify the development of an instrument to measure neighborhood cohesion through SEM.
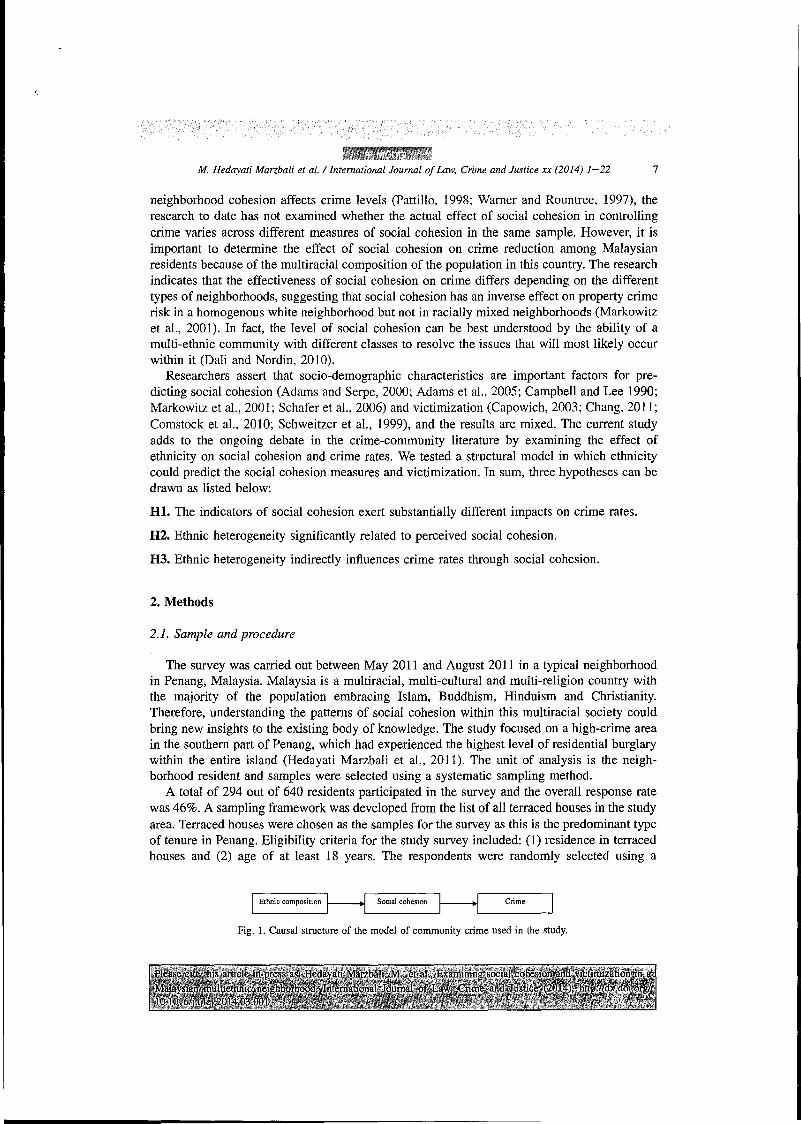
The objective of the current study is thus to validate the neighborhood cohesion measures that can be used to determine whether this construct effectively reduces crime in a high-crime context with a multiracial and multi-religion population. This construct is measured using three sub-constructs: sense of belonging, feelings of morale and collective efficacy. Considering the subsequent association between social cohesion and crime, as shown in the literature, it is hypothesized that the three social cohesion measures have a direct influence on victimization. These measures are assessed for their differential impact on victimization. Moreover, we examine the effect of ethnic composition on the perceived social cohesion and the level of crime (see Fig. 1).
1.5. Hypotheses development
The construction of a valid and reliable instrument to measure the neighborhood cohesion construct has yet to be rigorously developed and tested simultaneously using both lines of investigation in the same sample. Although the research on crime and community suggests that
':
M. Hedayati Marzbali et al. / International Journal of Law, Crime and Justice xx (2014) 1-22 7
neighborhood cohesion affects crime levels (Pattillo, 1998; Warner and Rountree, 1997), the research to date has not examined whether the actual effect of social cohesion in controlling crime varies across different measures of social cohesion in the same sample. However, it is important to determine the effect of social cohesion on crime reduction among Malaysian residents because of the multiracial composition of the population in this country. The research indicates that the effectiveness of social cohesion on crime differs depending on the different types of neighborhoods, suggesting that social cohesion has an inverse effect on property crime risk in a homogenous white neighborhood but not in racially mixed neighborhoods (Markowitz et aI., 2001). In fact, the level of social cohesion can be best understood by the ability of a multi-ethnic community with different classes to resolve the issues that will most likely occur within it (Dali and Nordin, 2010).
Researchers assert that socio-demographic characteristics are important factors for predicting social cohesion (Adams and Serpe, 2000; Adams et aI., 2005; Campbell and Lee 1990; Markowitz et aI., 2001; Schafer et aI., 2006) and victimization (Capowich, 2003; Chang, 2011; Comstock et aI., 20] 0; Schweitzer et aI., 1999), and the results are mixed. The current study adds to the ongoing debate in the crime-community literature by examining the effect of ethnicity on social cohesion and crime rates. We tested a structural model in which ethnicity could predict the social cohesion measures and victimization. In sum, three hypotheses can be drawn as listed below:
HI. The indicators of social cohesion exert substantially different impacts on crime rates.
H2. Ethnic heterogeneity significantly related to perceived social cohesion.
H3. Ethnic heterogeneity indirectly influences crime rates through social cohesion.
2. Methods
2.1. Sample and procedure
The survey was carried out between May 2011 and August 2011 in a typical neighborhood in Penang, Malaysia. Malaysia is a multiracial, multi-cultural and multi-religion country with the majority of the population embracing Islam, Buddhism, Hinduism and Christianity. Therefore, understanding the patterns of social cohesion within this multiracial society could bring new insights to the existing body of knowledge. The study focused on a high-crime area in the southern part of Penang, which had experienced the highest level of residential burglary within the entire island (Hedayati Marzbali et aI., 2011). The unit of analysis is the neighborhood resident and samples were selected using a systematic sampling method.
A total of 294 out of 640 residents participated in the survey and the overall response rate was 46%. A sampling framework was developed from the list of all terraced houses in the study area. Terraced houses were chosen as the samples for the survey as this is the predominant type of tenure in Penang. Eligibility criteria for the study survey included: (1) residence in terraced houses and (2) age of at least 18 years. The respondents were randomly selected using a
I Ethnic composition H Social cohesion ~I Crime
Fig. 1. Causal structure of the model of community crime used in the study.
8 M. Hedayati Marzbali et al. / International Journal of Law, Crime and Justice xx (2014) 1-22
systematic sampling method at intervals of every fourth unit. Of these respondents, 125 were male (43%), and 169 were female (57%) with an average age of 53 years (SD = 12.9). The survey further illustrated that 48% of the respondents were Malay, 41 % were Chinese and 11 % were Indian. The majority of the respondents surveyed were Muslims (51 %), 39% were Buddhists, followed by 7% Hindus and 3% Christians. Slightly over 61 % of the respondents have lived in their properties for at least 13 years, suggesting a very stable neighborhood with long-term occupants. The mean family size is 4.6 with a majority of families having '4-6' members. This size is comparable with Penang Statistics (2011), which reported that the average household size in Penang is 4.2. The information on total household income suggests that the majority of households in the survey population are in the middle-income category (RM3001-5000) (lUSD = RM3.00). Based on the victimization survey undertaken by this research, the study area has a burglary rate of 21 per 100 households, while the police offence data for the State of Penang shows a burglary rate of 0.5 per 100 households (Royal Malaysian Police, 2010). Because the current study used the same crime index as that given by the police, the result of the survey indicates that 57% of the victimized respondents did not report to the police, suggesting a high proportion of unreported crime. Coincidentally, in Britain, the 2010 BCS also reported a rate of 57% unreported for burglary with no loss (Flatley et aI., 2010).
2.2. Survey instrument
The aim of this study is to investigate the influence of neighborhood cohesion on victimization. In addition, the study examines whether ethnicity predicts social cohesion measures and victimization. A self-administered questionnaire was developed to examine the residents' perceived social cohesion, victimization and background information. According to Hair et aI. (2010), content validity must be ensured prior to any measurement and testing of the theory. Three renowned scholars with relevant expertise were asked to review the survey instruments, examine the effectiveness of the selected items in measuring the underlying variables and evaluate the overall content of the survey instruments. The items used to measure a specific domain should be representative of the domain that they are supposed to measure (Kline, 2005).
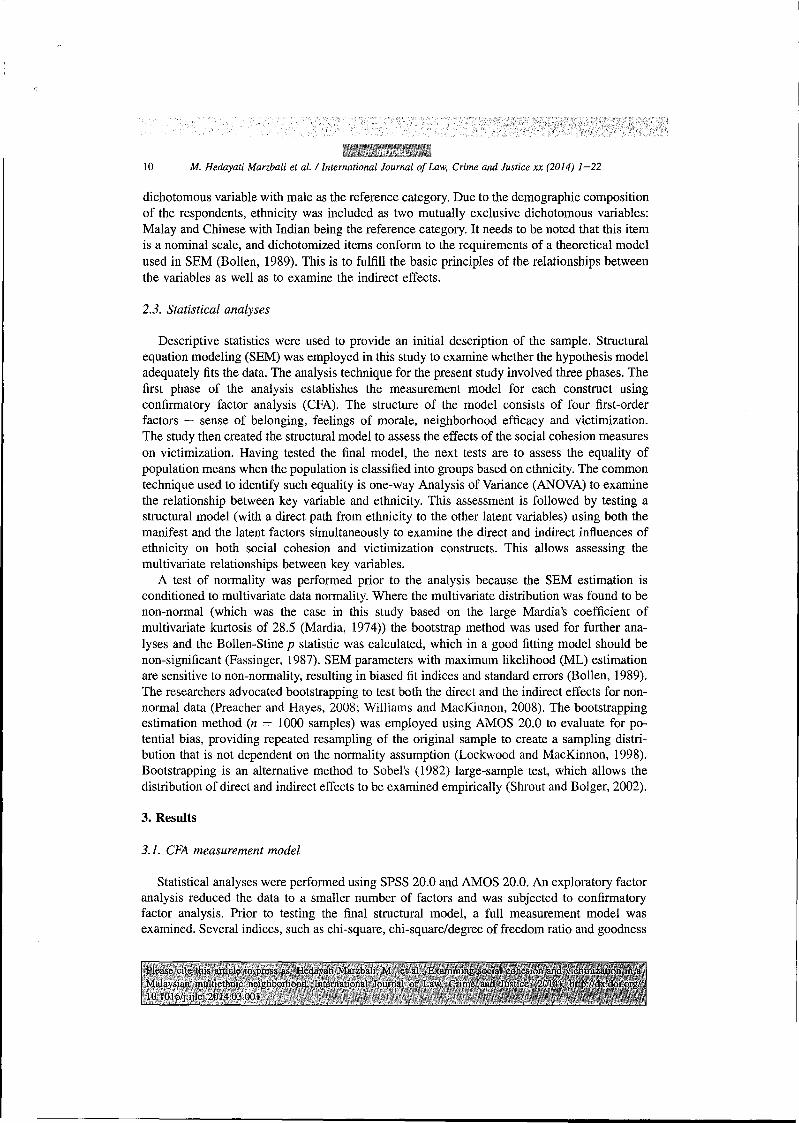
Once the content validity was established, the questionnaire was refined through rigorous pre-testing. This pre-testing emphasized the clarity, validity and wording of the survey instruments. During the pre-testing, 50 respondents were selected and the questionnaire was administered to them orally. The results of the factor analysis obtained from this pilot procedure confirmed that three factors explained the associations between the social cohesion indicators, namely collective efficacy, sense of belonging and feeling of morale. Each of these latent factors was derived from subsets of indicators that correlated strongly with each other and weakly with the other indicators in the dataset. The factors provided meaningful theoretical explanations linking them to the overall construct of social cohesion. The results of the internal reliability show that the resulting alpha values ranged from 0.81 to 0.93, which were above the acceptable threshold. It should be noted that one item (Item 3: I take part in social events organized by my neighbors) from the sense of belonging factor was excluded due to low factor loading. A description of the survey instruments used in this study is described in Table 2.
A comprehensive measure was employed to take into consideration both aspects of neighborhood cohesion. First, the perceived cohesion refers to asking the respondents to report on 'their own feelings' of cohesion, including two sub-constructs: sense of belonging andfeelings of morale. Second, the collective efficacy focuses on the perceived cohesion of 'others in the locale'. The sense of belonging represents the resident's perception of belonging to the
M. Hedayati Marzbali et al. / International Journal of Law, Crime and Justice xx (2014) 1-22 9
neighborhood and the extent to which an individual feels that they are part of the neighborhood. The feeling of morale focuses on the resident's evaluation of the neighborhood, whether he/she positively views the neighborhood as a place to live. These dimensions were adapted and modified based on the work of Bollen and Hoyle (1990), Hogg (1992), Bollen and Medrano (1998), Moody and White (2003), and Hipp and Perrin (2006).
Neighborhood efficacy is a concept that represents the residents' willingness to help each other for mutual benefit. Neighborhood efficacy measures the resident's perception of how other neighbors might act when help is required. The scale for the present study is adapted and modified based on the work of McGarrell et al. (1997), Sampson et aJ. (1997), Gibson et aJ. (2002), Renauer (2007), Franklin et aJ. (2008, 2009), and Carpiano and Hystad (2011). For all of the social cohesion items, the response categories were based on a seven-point Likert scale ranging from 1 (disagree extremely) to 7 (agree extremely).
To measure victimization, it should be noted that the focus of this research is on property and household victimization. We constructed three measures from the victim reports, burglary during a one year period, ever been burgled and indirect victimization. The questions were adapted and modified based on the 2010 BCS (Flatley et aI., 2010) and the work of Austin et aJ. (2002). The studies posited that both direct and indirect victimization affect people's perception. While direct victimization refers to the experience of becoming a victim, indirect victimization refers to knowing someone who has been victimized (Tseloni and Zarafonitou, 2008). The scales for the victimization indicators were based on the number of crime incidents. The questions regarding victimization refer to the house in which the respondent is currently living. Gender and ethnicity were included in the analysis as control variables. Gender was a
Table 2 Victimization and social cohesion measures with respective indicators.
Construct
Sense of belonging 1. I feel a sense of belonging to my neighborhood. 2. I feel that I am a member of this neighborhood. 4. I do keep an eye on what occurs in front of my house daily. 5. I feel responsible for watching over my neighbor'S house when they are on holiday. Feeling of morale 1. I am interested in my neighborhood. 2. I am satisfied living in this neighborhood. 3. I am happy living in this neighborhood. 4. This neighborhood is one of the best neighborhoods in the state. Collective efficacy 1. People in this neighborhood are willing to help their neighbors. 2. This is a close-knit neighborhood. 3. Many people in this neighborhood can be trusted. 4. People in my neighborhood talk together. 5. People in my neighborhood get along with each other. 6. I know most of the people in my street. Victimization 1. Has anyone entered this house witbout permission and tried to steal anything in tbe
period of one year? 2. Have you or any of your relatives ever been victims of burglary in your area? 3. Have you heard about burglary incidents in this housing area?
Cronbach's alpha
0.815
0.888
0.933
0.602
10 M. Hedayati Marzbali et al. / International Journal of Law, Crime and Justice xx (2014) ]-22
dichotomous variable with male as the reference category. Due to the demographic composition of the respondents, ethnicity was included as two mutually exclusive dichotomous variables: Malay and Chinese with Indian being the reference category. It needs to be noted that this item is a nominal scale, and dichotomized items conform to the requirements of a theoretical model used in SEM (Bollen, 1989). This is to fulfill the basic principles of the relationships between the variables as well as to examine the indirect effects.
2.3. Statistical analyses
Descriptive statistics were used to provide an initial description of the sample. Structural equation modeling (SEM) was employed in this study to examine whether the hypothesis model adequately fits the data. The analysis technique for the present study involved three phases. The first phase of the analysis establishes the measurement model for each construct using confirmatory factor analysis (CFA). The structure of the model consists of four first-order factors - sense of belonging, feelings of morale, neighborhood efficacy and victimization. The study then created the structural model to assess the effects of the social cohesion measures on victimization. Having tested the final model, the next tests are to assess the equality of population means when the population is classified into groups based on ethnicity. The common technique used to identify such equality is one-way Analysis of Variance (ANOVA) to examine the relationship between key variable and ethnicity. This assessment is followed by testing a structural model (with a direct path from ethnicity to the other latent variables) using both the manifest and the latent factors simultaneously to examine the direct and indirect influences of ethnicity on both social cohesion and victimization constructs. This allows assessing the multivariate relationships between key variables.
A test of normality was performed prior to the analysis because the SEM estimation is conditioned to multivariate data normality. Where the multivariate distribution was found to be non-normal (which was the case in this study based on the large Mardia's coefficient of multivariate kurtosis of 28.5 (Mardia, 1974» the bootstrap method was used for further analyses and the Bollen-Stine p statistic was calculated, which in a good fitting model should be non-significant (Fassinger, 1987). SEM parameters with maximum likelihood (ML) estimation are sensitive to non-normality, resulting in biased fit indices and standard errors (Bollen, 1989). The researchers advocated bootstrapping to test both the direct and the indirect effects for nonnormal data (Preacher and Hayes, 2008; Williams and MacKinnon, 2008). The bootstrapping estimation method (n = 1000 samples) was employed using AMOS 20.0 to evaluate for potential bias, providing repeated resampling of the original sample to create a sampling distribution that is not dependent on the normality assumption (Lockwood and MacKinnon, 1998). Bootstrapping is an alternative method to Sobel's (1982) large-sample test, which allows the distribution of direct and indirect effects to be examined empirically (Shrout and Bolger, 2002).
3. Results
3.1. CFA measurement model
Statistical analyses were performed using SPSS 20.0 and AMOS 20.0. An exploratory factor analysis reduced the data to a smaller number of factors and was subjected to confirmatory factor analysis. Prior to testing the final structural model, a full measurement model was examined. Several indices, such as chi-square, chi-square/degree of freedom ratio and goodness
M. Hedayati Marzbali et al. / International Journal of Law, Crime and Justice xx (2014) 1-22 11
of fit indices, were employed to judge whether the model fits the data. A recommendation for the relative/normed chi-square (X2Idf) is 3 or less (Carmines and McIver, 1981; Kline, 2005). The conventional method for examining the model fit is the chi-square (X2) statistic, which should be non-significant in a good fitting model.
An acceptable fit for the data to the model is provided by a model when the comparative fit index (CFI) > 0.9, the Goodness of Fit Index (GFI) > 0.9, the Tucker-Lewis index (TLI) > 0.9, and the root-mean square error of approximation (RMSEA) < 0.08 (Hu and Bentler, 1999; Kline, 2005). The cut-off value for the accepted factor loading employed in this study is 0.50 (Hair et aI., 2010). The Cronbach's alpha scores in each factor were higher than the recommended 0.60 cut-off value (Nunnally and Bernstein, 1994) and indicated good scale reliability. The model resulted in 95 degrees of freedom, X2 = 198.93, p = 0.032, X21dJ = 2.09. The Bollen-Stine p for the model was 0.114, which is non-significant and suggests a good model fit. The model fit indicators of GFI = 0.923, CFI = 0.974, TLI = 0.967 and RMSEA = 0.060 also support the fit results from the structural model. The non-significant Bollen-Stine p statistic, along with the underlying model fit indices, suggested that the model was a good fit for the data, thus demonstrating construct validity (Vandenberg and Lance, 2000) and indicating that the measurement scales employed in the model can be considered to be a valid operationalization of the latent constructs.
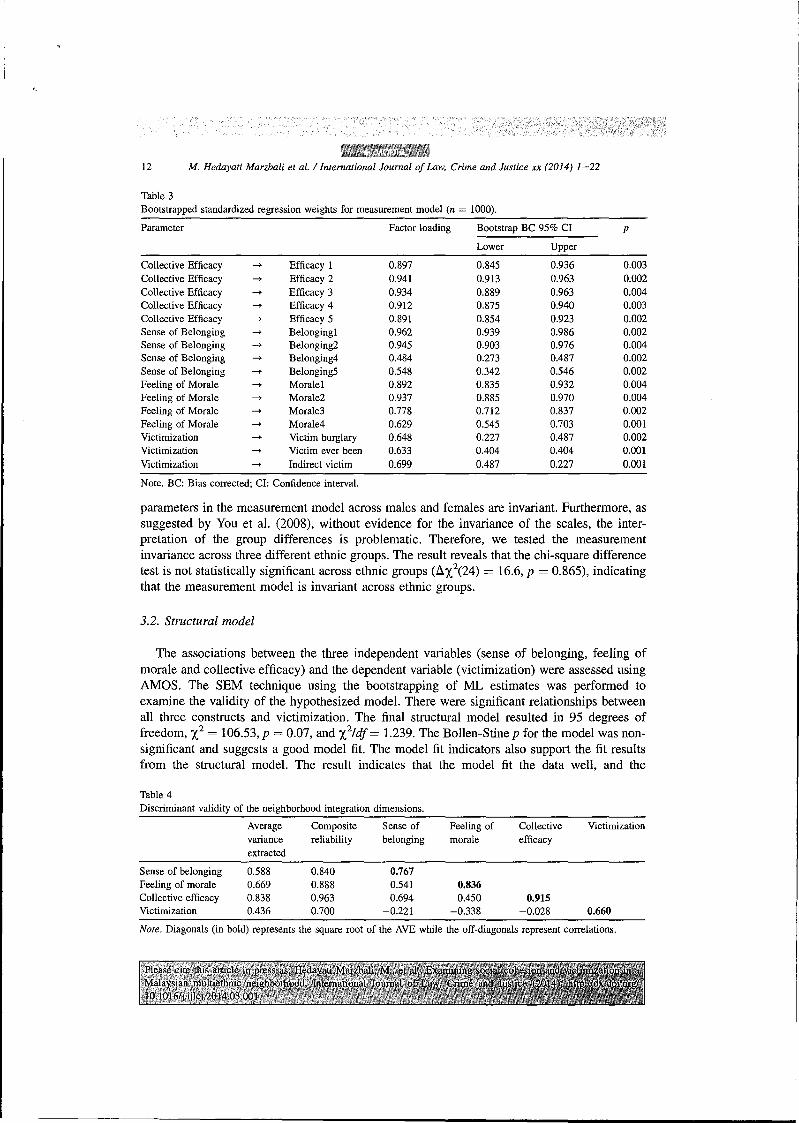
The study performed a CFA technique to examine the construct validity and reliability of the factors. Construct validity is composed of two categories: convergent and discriminant validity. Three methods were used to assess the convergent validity, namely factor loading, composite reliabilities and average variance extracted (AVE). As shown in Table 3, the factor loadings were in the 0.48 to 0.96 range, which is close to the recommended value of 0.5 (Hair et aI., 2010).
The composite reliability estimates the degree to which the respective indicators indicate the latent construct (Lin, 2007), and it ranged from 0.70 to 0.96. A cut-off value of 0.7 and above is suggested for composite reliability, representing good reliability (Hair et aI., 2010). The rule of thumb for AVE suggests that it equal 0.5 or above, indicating adequate convergence (Bagozzi and Yi, 1988). In this study, the AVE values were in the range of 0.44-0.84, which were close to the recommended value of 0.5 (Hair et aI., 2010). We then proceeded to test the discriminant validity for the four constructs undertaken in the study. The most common way to examine discriminant validity is a comparison between the square-root of the AVEs for any two constructs and the correlation estimate between the same constructs, where the former must be greater than the latter (Fornell and Larcker, 1981; Hair et aI., 2010). As shown in Table 4, the results indicate that the measure has adequate discriminant validity. In all, the CFA model demonstrated adequate reliability, convergent validity and discriminant validity. The results from the measurement models suggest that these models fit the data well based on normed chisquared and goodness-of-fit indices. In addition, the results demonstrated that the three social cohesion factors are highly correlated.
A study conducted in an American context found that there is a significant effect from social cohesion on victimization for male respondents, whereas no significant effect was found for females (Schafer et aI., 2006). Because several studies in the crime-community literature have considered gender to be a moderator that interacts with perceived social cohesion (De Jesus et aI., 2010; Peterson and Hughey, 2004), we tested a multigroup invariance of the measurement model across gender to assess whether the measuring instrument is equivalent across female and male respondents. The result indicates that the chi-square difference test (AX2) is not statistically significant (AX2(l2) = 12.41, p = 0.414). This result indicates that the path
12 M. Hedayati Marzbali et al. / International Journal of Law, Crime and Justice xx (2014) 1-22
Table 3 Bootstrapped standardized regression weights for measurement model (n = 1000).
Parameter Factor loading Bootstrap BC 95% CI p
Lower Upper
Collective Efficacy -> Efficacy 1 0.897 0.845 0.936 0.003 Collective Efficacy Efficacy 2 0.941 0.913 0.963 0.002 Collective Efficacy -> Efficacy 3 0.934 0.889 0.963 0.004 Collective Efficacy -> Efficacy 4 0.912 0.875 0.940 0.003 Collective Efficacy -> Efficacy 5 0.891 0.854 0.923 0.002 Sense of Belonging -> Belongingl 0.962 0.939 0.986 0.002 Sense of Belonging -> Belonging2 0.945 0.903 0.976 0.004 Sense of Belonging -> Belonging4 0.484 0.273 0.487 0.002 Sense of Belonging -> Belonging5 0.548 0.342 0.546 0.002 Feeling of Morale -> Morale 1 0.892 0.835 0.932 0.004 Feeling of Morale -> Morale2 0.937 0.885 0.970 0.004 Feeling of Morale -> Morale3 0.778 0.712 0.837 0.002 Feeling of Morale -> Morale4 0.629 0.545 0.703 0.001 Victimization -> Victim burglary 0.648 0.227 0.487 0.002 Victimization -> Victim ever been 0.633 0.404 0.404 0.001 Victimization -> Indirect victim 0.699 0.487 0.227 0.001
Note. BC: Bias corrected; CI: Confidence interval.
parameters in the measurement model across males and females are invariant. Furthermore, as suggested by You et al. (2008), without evidence for the invariance of the scales, the interpretation of the group differences is problematic. Therefore, we tested the measurement invariance across three different ethnic groups. The result reveals that the chi-square difference test is not statistically significant across ethnic groups (ilX2(24) = 16.6, p = 0.865), indicating that the measurement model is invariant across ethnic groups.
3.2. Structural model
The associations between the three independent variables (sense of belonging, feeling of morale and collective efficacy) and the dependent variable (victimization) were assessed using AMOS. The SEM technique using the bootstrapping of ML estimates was performed to examine the validity of the hypothesized model. There were significant relationships between all three constructs and victimization. The final structural model resulted in 95 degrees of freedom, X2 = 106.53, p = 0.07, and X21df = 1.239. The Bollen-Stine p for the model was nonsignificant and suggests a good model fit. The model fit indicators also support the fit results from the structural model. The result indicates that the model fit the data well, and the
Table 4 Discriminant validity of the neighborhood integration dimensions.
Average Composite Sense of Feeling of Collective Victimization variance reliability belonging morale efficacy extracted
Sense of belonging 0.588 0.840 0.767 Feeling of morale 0.669 0.888 0.541 0.836 Collective efficacy 0.838 0.963 0.694 0.450 0.915 Victimization 0.436 0.700 -0.221 -0.338 -0.028 0.660
Note. Diagonals (in bold) represents the square root of the AVE while the off-diagonals represent correlations.
M. Hedayati Marzbali et al. / International Journal of Law, Crime and Justice xx (2014) 1-22 13
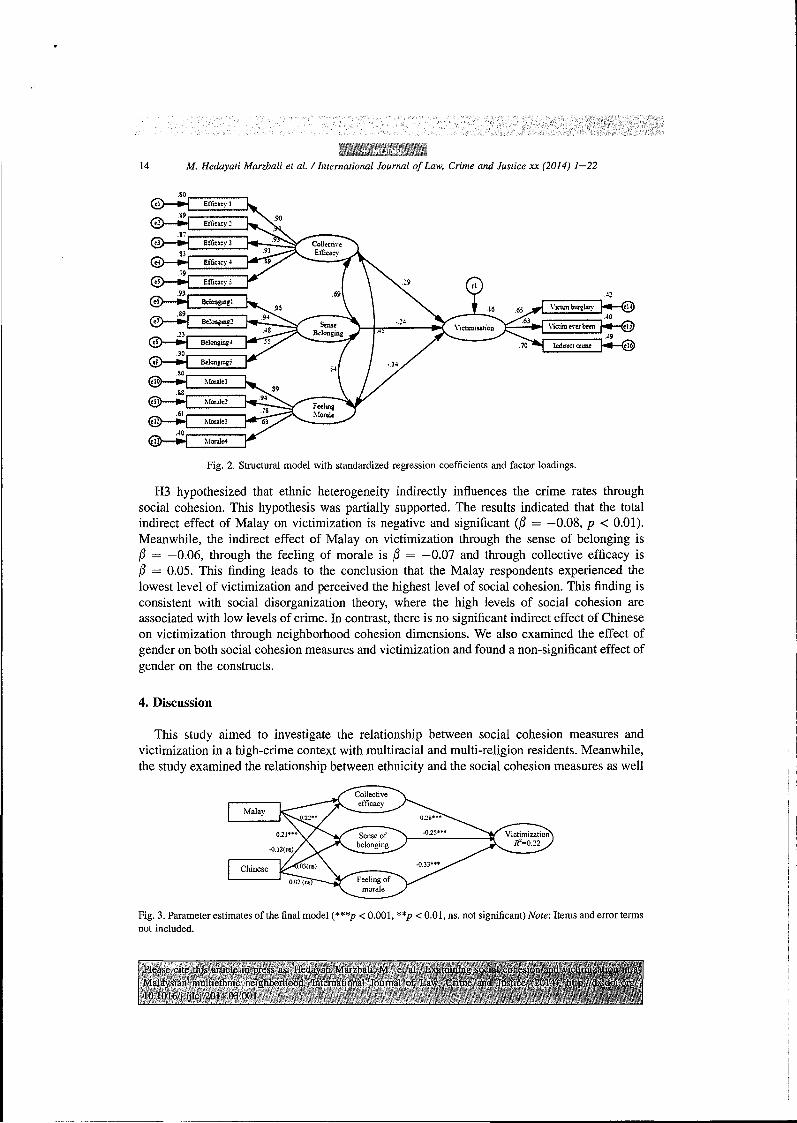
standardized regression weights were all significant. The final model demonstrated a good fit to the data, accounting for 16% of the variance associated with victimization (R2 = 0.16) (see Fig. 2).
The next stage of analysis structured the latent and observed variables into a hypothesized model. The structural model using the bootstrapping of ML estimates was performed to examine the effect of ethnicity on social cohesion constructs and victimization. The study employed the bootstrap method (Efron and Tibshirani, 1993), as suggested by Shrout and Bolger (2002), for assessing the direct and indirect effects. The validated measurement models were incorporated into the structural model to examine the hypothesized relationships between latent constructs. This is followed by the testing of the structural model with a direct path from two ethnic groups (namely, Malay and Chinese) to the other latent variables using an ML estimation. The final model, as shown in Fig. 3, resulted in 123 degrees of freedom, X2
= 319.856, p = 0.025, X2/df = 2.600. The Bollen-Stine p for the model was 0.096, which is non-significant and suggests a good model fit. The model fit indicators of GFI = 0.920, CFI = 0.973, TLI = 0.966 and RMSEA = 0.059 also support the fit results from the structural model. The data indicated that a non-multivariate distribution was corrected using the BollenStine bootstrapping application. The result indicates that the model fit the data well, and the standardized regression weights were all significant. The final model demonstrated a good fit to the data, accounting for 22% of the variance associated with victimization.
3.3. Results of the hypotheses testing
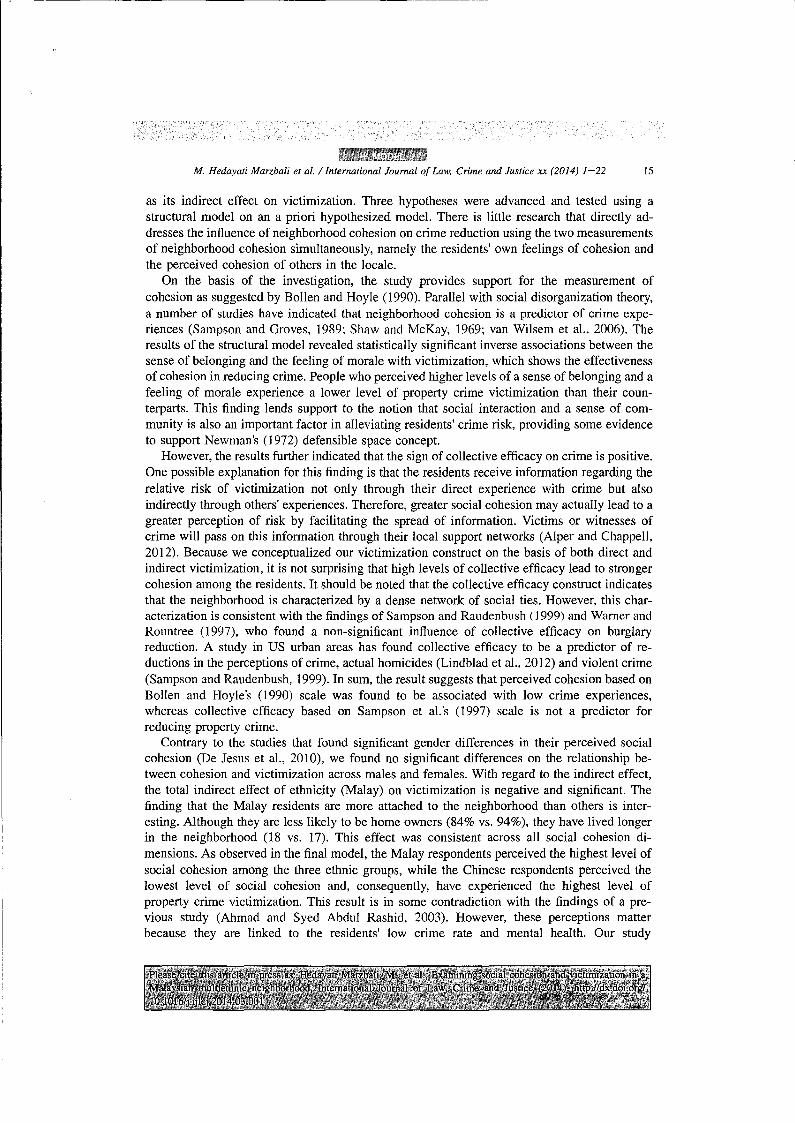
The importance of this study involves its simultaneous assessment of the role of the different measures of social cohesion in reducing crime in a single model. In addition, the study examines the effects of ethnicity on social cohesion measures and victimization. The confirmation or the rejection of the hypotheses using bootstrapping is as follows. HI hypothesized that the measures of social cohesion exert substantially different impacts on crime rates. This hypothesis was supported. The results indicated that there is a significant and negative relationship between the sense of belonging and victimization (~ = -0.24, p < 0.05), indicating that a greater perceived sense of belonging is associated with a lower victimization rate. Meanwhile, we found that a high perceived feeling of morale is related to low levels of crime (~ = -0.34, P < 0.01). This finding indicates that both a sense of belonging and a feeling of morale are associated with low crime experiences. The findings further revealed that the relationship between collective efficacy and victimization is significant and positive (~ = 0.29, p < 0.05). This finding implies that high level of collective efficacy is associated with high crime rates. H2 hypothesized that ethnic heterogeneity significantly related to perceived social cohesion. The data was analyzed using the one-way ANOVA and it showed that the three major ethnic groups appear to be significantly different on perceived social cohesion dimensions, namely collective efficacy (F(2, 291) = 5.95, p < 0.01), sense of belonging (F(2, 291) = 6.57, p < 0.01) and feeling of morale (F(2, 291) = 6.24, P < 0.01). The results indicate that there are significant differences between Malay, Chinese and Indians on their perceived social cohesion. Fig. 3 further indicates that Malay respondents appeared to have higher levels of collective efficacy (~= O.l8,p < 0.001), sense of belonging (~= 0.22,p < 0.01) and feeling of morale (~= 0.21, p < 0.001). Interestingly, Chinese residents failed to reach statistical significance with perceived social cohesion dimensions. The results demonstrate that the Malay residents perceived the highest levels of social cohesion measures, followed by the Indian and Chinese respondents. Therefore, H2 is supported.
14 M. Hedayati Marzbali et al. / International Journal of Law, Crime and Justice xx (2014) 1-22
Fig. 2. Structural model with standardized regression coefficients and factor loadings.
H3 hypothesized that ethnic heterogeneity indirectly influences the crime rates through social cohesion. This hypothesis was partially supported. The results indicated that the total indirect effect of Malay on victimization is negative and significant (~ = -0.08, p < 0.01). Meanwhile, the indirect effect of Malay on victimization through the sense of belonging is ~ = -0.06, through the feeling of morale is ~ = -0.07 and through collective efficacy is ~ = 0.05. This finding leads to the conclusion that the Malay respondents experienced the lowest level of victimization and perceived the highest level of social cohesion. This finding is consistent with social disorganization theory, where the high levels of social cohesion are associated with low levels of crime. In contrast, there is no significant indirect effect of Chinese on victimization through neighborhood cohesion dimensions. We also examined the effect of gender on both social cohesion measures and victimization and found a non-significant effect of gender on the constructs.
4. Discussion
This study aimed to investigate the relationship between social cohesion measures and victimization in a high-crime context with multiracial and multi-religion residents. Meanwhile, the study examined the relationship between ethnicity and the social cohesion measures as well
Fig. 3. Parameter estimates of the final model (***p < 0.001, **p < 0.01, ns. not significant) Note: Items and error terms not included.
M. Hedayati Marzbali et al. / International Journal of Law, Crime and Justice xx (2014) 1-22 15
as its indirect effect on victimization. Three hypotheses were advanced and tested using a structural model on an a priori hypothesized model. There is little research that directly addresses the influence of neighborhood cohesion on crime reduction using the two measurements of neighborhood cohesion simultaneously, namely the residents' own feelings of cohesion and the perceived cohesion of others in the locale.
On the basis of the investigation, the study provides support for the measurement of cohesion as suggested by Bollen and Hoyle (1990). Parallel with social disorganization theory, a number of studies have indicated that neighborhood cohesion is a predictor of crime experiences (Sampson and Groves, 1989; Shaw and McKay, 1969; van Wi1sem et aI., 2006). The results of the structural model revealed statistically significant inverse associations between the sense of belonging and the feeling of morale with victimization, which shows the effectiveness of cohesion in reducing crime. People who perceived higher levels of a sense of belonging and a feeling of morale experience a lower level of property crime victimization than their counterparts. This finding lends support to the notion that social interaction and a sense of community is also an important factor in alleviating residents' crime risk, providing some evidence to support Newman's (1972) defensible space concept.
However, the results further indicated that the sign of collective efficacy on crime is positive. One possible explanation for this finding is that the residents receive information regarding the relative risk of victimization not only through their direct experience with crime but also indirectly through others' experiences. Therefore, greater social cohesion may actually lead to a greater perception of risk by facilitating the spread of information. Victims or witnesses of crime will pass on this information through their local support networks (Alper and Chappell, 2012). Because we conceptualized our victimization construct on the basis of both direct and indirect victimization, it is not surprising that high levels of collective efficacy lead to stronger cohesion among the residents. It should be noted that the collective efficacy construct indicates that the neighborhood is characterized by a dense network of social ties. However, this characterization is consistent with the findings of Sampson and Raudenbush (1999) and Warner and Rountree (1997), who found a non-significant influence of collective efficacy on burglary reduction. A study in US urban areas has found collective efficacy to be a predictor of reductions in the perceptions of crime, actual homicides (Lindblad et aI., 20] 2) and violent crime (Sampson and Raudenbush, 1999). In sum, the result suggests that perceived cohesion based on Bollen and Hoyle's (1990) scale was found to be associated with low crime experiences, whereas collective efficacy based on Sampson et al.'s (1997) scale is not a predictor for reducing property crime.
Contrary to the studies that found significant gender differences in their perceived social cohesion (De Jesus et aI., 2010), we found no significant differences on the relationship between cohesion and victimization across males and females. With regard to the indirect effect, the total indirect effect of ethnicity (Malay) on victimization is negative and significant. The finding that the Malay residents are more attached to the neighborhood than others is interesting. Although they are less likely to be home owners (84% vs. 94%), they have lived longer in the neighborhood (18 vs. 17). This effect was consistent across all social cohesion dimensions. As observed in the final model, the Malay respondents perceived the highest level of social cohesion among the three ethnic groups, while the Chinese respondents perceived the lowest level of social cohesion and, consequently, have experienced the highest level of property crime victimization. This result is in some contradiction with the findings of a previous study (Ahmad and Syed Abdul Rashid, 2003). However, these perceptions matter because they are linked to the residents' low crime rate and mental health. Our study
16 M. Hedayati Marzbali et al. / International Journal of Law. Crime and Justice xx (2014) 1-22
contributes to the scientific literature in this area by providing some insight into the association between social cohesion and crime among middle-income residents as a potential pathway through which perceived social cohesion influences both direct and indirect crime. We argue that the effect of the three social cohesion measures on crime is highly explained by the greater feeling of morale occurring in the more cohesive neighborhoods where the residents' satisfaction with living in the neighborhood is high. This assertion has been supported because a large portion of the residents (87%) in the study area believed that their quality of life is highly affected by crime.
4.1. 1mplications of the study
One important conclusion of this study is that multiracial communities are not generally associated with lower levels of attachment, whereas evidence suggested that many other factors appeared to have strong effects on the level of neighborhood cohesion (Abdullah et aI., 2013). This is a positive finding for multi-ethnic communities, such as those found in Malaysia, where neighborhood cohesion can be used as a mechanism to reduce crime rate. The Malay respondents experienced the lowest level of victimization and perceived the highest level of social cohesion. Regardless of the different ethnic groups of residents, an important implication of the present study is that effective communication between residents is crucial to promoting the spirit of neighborliness and, consequently, to achieving safer communities. Organizing community activities would help to strengthen the residents' friendships and to create more awareness among the residents. The findings of this study contradict the stereotypes presented in previous studies that describe mixed-racial neighborhoods as associated with high crime rates and that claim that social integration would not work in these communities to reduce crime.
It is believed that both social and physical factors can be an influence to create feelings of attachment in a community. As such, the research suggested that in the Malaysian context, tessellation planning and honeycomb housing design concepts are the best examples of housing layouts because they are composed of cul-de-sac street types that encourage neighborly interactions (Hashim, 2005). These patterns create socially small and friendly neighborhoods that are based on Newman's defensible space concept to create safer places. However, we plan to address this subject in future studies that follow the effect of both social and physical factors on the resident's perceived social cohesion in high and low crime neighborhoods.
4.2. Study limitations and directions for future
Although the results of this study contribute to the literature by evaluating the patterns of social cohesion in a multiracial neighborhood, some limitations are worth noting. The first limitation of the present study is that it focuses only on property crime and does not address violent crime. The previous studies have found a significant and inverse effect of collective efficacy on violent crime. Our neighborhood efficacy scale might also have an inverse effect on violent crime. Future research might bring new insights to the body of knowledge by focusing on both property and violent crimes. Second, the findings of the study need to be considered in the context of the study neighborhood. The study focused on middle-income residents residing in terraced houses. Future studies should focus on other housing types such as flats, detached and semi-detached houses occupied by either lower or higher income residents. Approximately 78% of the variance of the victimization construct was left
M. Hedayati Marzbali et al. / International Journal of Law, Crime and Justice xx (2014) 1-22 17
unexplained in the research model. A large portion of the unexplained variance of victimization indicates that crime experiences are not simply a function of perceived neighborhood cohesion and ethnic composition; physical characteristics of the surrounding environment could also have a great influence on the crime experiences as well as the perceived social cohesion. Crime opportunities may also increase when capable guardians such as security systems and natural surveillability are absent (Franklin, 2011). Future research might examine the influence of a broad range of physical and social factors on crime and the residents' perceived social cohesion.
4.3. Conclusions
This study contributes to the existing body of knowledge on the subject matter both theoretically and methodologically. Although our perceived cohesion scale is adapted based on Bollen and Hoyle (1990) and Sampson et al.'s (1997) scales, we have added a number of items based on a pilot survey in the same neighborhood context that is later validated using CFA. An advantage of this study was the use of the SEM techniques using bootstrapping estimation. The SEM technique is a flexible and powerful method to address multigroup comparisons in association with latent traits. SEM enhances the accuracy of the analysis over ANOVA and regression procedures in latent traits. The SEM technique is warranted for researchers to address the measurement invariance before the interpretation of group differences on associated features.
The study found an indirect and significant effect from ethnicity on victimization through the social cohesion measures. This finding leads to the conclusion that ethnicity has a significant effect on both the social cohesion measures and victimization. Contrary to the result of the research in US urban areas (Warner and Rountree, 1997; Pattillo, 1998), the findings of the current work indicate a negative relationship between perceived cohesion and victimization in a multiracial context. To date, there is insufficient evidence to conclude that neighborhood cohesion contributes to a reduction in crime experiences in a multiracial population. Nonetheless, the results presented suggest that a high level of social interaction among residents can help to reduce the levels of crime even across a high-crime context with a multiracial and multireligion population. Similarly, the research has suggested that religious differences could not break the strength of the relationships between Muslims and Buddhists due to the universal values shared by both religious traditions (Engku Alwi and Mohd Rashid, 2011).
By studying the relationship between the respondents' characteristics, victimization and the perception of cohesion, the results of the bootstrapping estimation provided support for a direct relationship between social cohesion and victimization. If the residents feel a sense of belonging to their neighborhood, social control might increase and as a consequence, the crime rate might decrease. The strength of the study also refers to the effect of neighborhood cohesion on crime risk in a racially mixed context. Although the results of a previous study contradict social disorganization theory in a racially mixed neighborhood (Warner and Rountree, 1997), the findings of the current research provide support for social disorganization theory, where the perceived cohesion is a predictor in reducing crime risk due to higher social cohesion and, consequently, more social control. The results provide both empirical support for social disorganization theory and support for the conclusion that the previous study results were not idiosyncratic to 1942, as originated from the work of Shaw and McKay. Our study suggests, therefore, that the findings of the initial classic study were not artifactual but illuminated an underlying empirical pattern that has persisted over time.
18 M. Hedayati Marzbali et al. / International Journal of Law, Crime and Justice xx (2014) 1-22
The research found that both direct and indirect victimization negatively affects the individuals' concerns over crime and safety issues (Baumer, 1985; Greenberg and Rohe, 1984; Hedayati Marzbali et al., 2012; Skogan and Maxfield, 1981; Toseland, 1982). Markowitz et al. (2001) asserted that most social disorganization research in relation to cohesion and crime risk focuses on serious types of crime. Examples include knowing someone who has recently been victimized (Moley, 2008; Swaray, 2007). As such, another contribution of the current work refers to the indicators of victimization by measuring both direct and indirect victimization. One possible explanation is that both direct and indirect victimizations have significant associations with the perception of residents within their residence area. Finally, the discovery of strong social cohesion among Malays provides an encouraging direction for future research. Given that the present empirical confirmations of the model that combines two lines of thought, those interested in the applied possibilities of social cohesion can be encouraged to develop a new area of strength for the patterns of social cohesion in multiracial communities. Social cohesion may also be an alternative option for neighborhoods struggling with physical incivilities and high crime rates.
Acknowledgments
The authors would like to thank the Universiti Sains Malaysia for providing financial support for this study.
References
Abdullah, A., Hedayati Marzbali, M., Maghsoodi Tilaki, MJ., 2013. Predicting the influence of CPTED on perceived neighbourhood cohesion: considering differences across age. J. Environ. Psychol. 36, 54-64. December.
Adams, RE., 1992. Is happiness a home in the suburbs?: The influence of urban versus suburban neighborhoods on psychological health. J. Commun. Psychol. 20 (4), 353-372.
Adams, RE., Serpe, RT., 2000. Social integration, fear of crime, and life satisfaction. Sociol. Perspect. 43 (4), 605-629.
Adams, RE., Rohe, W.M., Arcury, T.A., 2005. Awareness of community-oriented policing and neighborhood perceptions in five small to midsize cities. J. Crim. Justice 33 (1), 43-54.
Ahmad, N., Syed Abdul Rashid, S.N., 2003. Social interaction in urban areas: a case study of mixed and mono-ethnic neighbourhoods in Kuala Lumpur. Pertanika J. Soc. Sci. Humanit. 11 (2), 107-118.
Alper, M., Chappell, A.T., 2012. Untangling fear of crime: a multi-theoretical approach to examining the causes of crime-specific fear. Sociol. Spectr. 32 (4), 346-363.
Austin, D.M., Furr, L.A., Spine, M., 2002. The effects of neighborhood conditions on perceptions of safety. J. Crim. Justice 30 (5), 417-427.
Bagozzi, RP., Yi, Y., 1988. On the evaluation of structural equation models. J. Acad. Mark. Sci. 16 (1), 74-94. Baumer, T.L., 1985. Testing a general model of fear of crime: data from a national sample. J. Res. Crime. Delinquen. 22
(3), 239-255. Bellair, P.E., 1997. Social interaction and community crime: examining the importance of neighbor networks. Crimi
nology 35 (4), 677-704. Bellair, P.E., Browning, C.R., 2010. Contemporary disorganization research: an assessment and further test of the
systemic model of neighborhood crime. J. Res. Crime. Delinquen. 47 (4), 496-521. Bollen, K.A., 1989. Structural Equations with Latent Variables. John Wiley & Sons, New York. Bollen, K.A., Hoyle, R.H., 1990. Perceived cohesion: a conceptual and empirical examination. Soc. Forces 69 (2),
479-504. Bollen, K., Medrano, J.D., 1998. Who are the Spaniards? Nationalism and identification in Spain. Soc. Forces 77 (2),
587-621.
M. Hedayati Marzbali et al. / International Journal of Law, Crime and Justice xx (2014) 1-22 19
Bonaiuto, M., Aiello, A., Perugini, M., Bonnes, M., Ercolani, A.P., 1999. Multidimensional perception of residential environment quality and neighbourhood attachment in the urban environment. J. Environ. Psycho!. 19 (4), 331-352.
Brown, B., Perkins, D.D., Brown, G., 2003. Place attachment in a revitalizing neighborhood: individual and block levels of analysis. J. Environ. Psycho!. 23 (3), 259-271.
Browning, C.R, Cagney, KA., 2002. Neighborhood structural disadvantage, collective efficacy, and self-rated physical health in an urban setting. J. Health Soc. Behav. 43 (4), 383-399.
Browning, C.R, Dietz, RD., Feinberg, S.L., 2004. The paradox of social organization: networks, collective efficacy, and violent crime in urban neighborhoods. Soc. Forces 83 (2), 503-534.
Capowich, G.E., 2003. The conditioning effects of neighborhood ecology on burglary victimization. Crim. Justice Behav. 30 (1), 39-61.
Carmines, E.G., McIver, J.P., 1981. Analyzing models with unobserved variables. In: Bohrnstedt, G.W., Borgatta, E.P. (Eds.), Social Measurement: Current Issues. Sage Publications, Inc, Beverly Hills, pp. 65-115.
Carpiano, RM., Hystad, P.W., 2011. "Sense of community belonging" in health surveys: what social capital is it measuring? Health & Place 17 (2), 606-617.
Chang, D., 2011. Social crime or spatial crime? Exploring the effects of social, economical, and spatial factors on burglary rates. Environ. Behav. 43 (1), 26-52.
Comstock, N., Dickinson, L.M., Marshall, J.A., Soobader, MJ., Turbin, M.S., Buchenau, M., Litt, J.S., 2010. Neighborhood attachment and its correlates: exploring neighborhood conditions, collective efficacy and gardening. J. Environ. Psycho!. 30 (4), 435-442.
Costa, D.L., Kahn, M.E., 2003. Understanding the decline in social capital, 1952-1998. Kyklos Int. Rev. Soc. Sci. 56 (1), 17-46.
Dali, M.M., Nordin, N.A., 2010. Is there an integrated society in urban neighbourhoods of Klang Vallley. J. Sustain. Dev. 3 (3), 266-274.
De Jesus, M., Puleo, E., Shelton, RC., Emmons, KM., 2010. Associations between perceived social environment and neighborhood safety: health implications. Health & Place 16 (5), 1007-1013.
Department of Statistics Malaysia, 2012. The Population and Housing Census of Malaysia Population and Vital Statistics. Putrajaya: Department of Statistics, Malaysia.
Efron, B., Tibshirani, RJ., 1993. An Introduction to the Bootstrap. Chapman & Hall, New York. Engku Alwi, E.AZ., Mohd Rashid, Z.B., 2011. Cross religious and social interaction: a case study of Muslims and
Buddhists in Kampung Tendong, Pasir Mas, Kelantan. Asian Soc. Sci. 7 (8), 112-128. Fassinger, RE., 1987. Use of structural equation modeling in counseling psychology research. J. Couns. Psycho!. 34 (4),
425-436. Fishkin, S.A., Rohrbach, L.A., Johnson, C.A., 1997. Correlates of Youths' fears of victimization. J. App!. Soc. Psycho!.
27 (18), 1601-1616. Flatley, J., Kershaw, C., Smith, K, Chaplin, R, Moon, D., 2010. Crime in England and Wales 2009110. In: Home Office
Statistical Bulletin 12110. Home Office, London. Fornell, C., Larcker, D.P., 1981. Evaluating structural equation models with unobservable variables and measurement
error. J. Mark. Res. 18 (1), 39-50. Foster, S., Giles-Corti, B., 2008. The built environment, neighborhood crime and constrained physical activity: an
exploration of inconsistent findings. Prevo Med. 47 (3), 241-251. Franklin, C.A., 2011. An investigation of the relationship between self-control and alcohol-induced sexual assault
victimization. Crim. Justice Behav. 38 (3), 263-285. Franklin, C.A., Franklin, T.W., 2009. Predicting fear of crime: considering differences across gender. Fern. Crimino!. 4
(1), 83-106. Franklin, T.W., Franklin, C.A., Fearn, N.E., 2008. A multilevel analysis of the vulnerability, disorder, and social
integration models of fear of crime. Soc. Justice Res. 21 (2),204-227. Giannotta, P., Settanni, M., Kliewer, W., Ciairano, S., 2012. The role of threat appraisal in the relation between peer
victimization and adjustment problems in early Italian Adolescents. J. App!. Soc. Psycho!. 42 (9), 2077-2095. Gibson, C.L., Zhao, J., Lovrich, N.P., Gaffney, MJ., 2002. Social integration, individual perceptions of collective ef
ficacy, and fear of crime in three cities. Justice Q. 19 (3), 537-564. Gijsberts, M., van der Meer, T., Dagevos, J., 2012. 'Hunkering Down' in multi-ethnic neighbourhoods? The effects of
ethnic diversity on dimensions of social cohesion. Eur. Socio!. Rev. 28 (4), 527-537. Greenberg, S.W., Rohe, W.M., 1984. Neighbourhood design and crime: a tale of two perspectives. J. Am. Plan. Assoc.
50 (1), 48-61. Hair, J.P', Black, W.C., Babin, B.J., Anderson, R.E., 2010. Multivariate Data Analysis: a Global Perspective, seventh ed.
Pearson, United States.
20 M. Hedayati Marzbali et al. / International Journal of Law, Crime and Justice xx (2014) ]-22
Hale, C., 1996. Fear of crime: a review of the literature. Int. Rev. Vict. 4 (2), 79-150. Hashim, H., 2005. Harmonious Community Living in Urban Neighbourhoods: a Case of Central Shah Alam. Paper
presented at the 8th International Conference of the Asian Planning Schools Association (APSA 2005), "Cities For People", Penang, Malaysia.
Hedayati Marzbali, M., Abdullah, A, Razak, N.A., Maghsoodi, M.I., 2011. Using hotspot mapping to understand spatial patterns of burglary in residential land use: a case study of Penang. World Appl. Sci. J. 13 (8), 1948-1958.
Hedayati Marzbali, M., Abdullah, A, Razak, N.A., Maghsoodi, M.I., 2012. Validating crime prevention through environmental design construct through checklist using structural equation modelling. Int. J. Law Crime Justice 40 (1), 82-99.
Hipp, J.R., Perrin, A., 2006. Nested loyalties: local networks' effects on neighbourhood and community cohesion. Urban Stud. 43 (13), 2503-2524.
Hirschfield, A, Bowers, K.I., 1997. The effect of social cohesion on levels of recorded crime in disadvantaged areas. Urban Stud. 34 (8), 1275-1295.
Hogg, M.A, 1992. The Social Psychology of Group Cohesiveness: from Attraction to Social Identity. New York University Press.
Hu, L., Bentler, P.M., 1999. Cutoff criteria for fit indexes in covariance structure analysis: conventional criteria versus new alternatives. Struct. Equ. Model. Multidiscip. J. 6 (1), 1-55.
Hunter, A., Baumer, T.L., 1982. Street traffic, social integration, and fear of crime. Sociol. Inq. 52 (2), 122-131. Johnson, S.D., Bowers, KJ., 2010. Permeability and burglary risk: are Cul-de-Sacs Safer? J. Quantitat. Criminol. 26 (1),
89-111. Kline, RB., 2005. Principles and Practice of Structural Equation Modeling, second ed. The Guilford Press, New York. Kuipers, M.A.G., van Poppel, M.N.M., van den Brink, W., Wingen, M., Kunst, A.E., 2012. The association between
neighborhood disorder, social cohesion and hazardous alcohol use: a national multilevel study. Drug. Alcoh. Dependen .. hup://dx.doi.org/I 0.1 0 16/j.drugaJcdep.20 12.04.008.
Lee, M.R, 2000. Community cohesion and violent predatory victimization: a theoretical extension and cross-national test of opportunity theory. Soc. Forces 79 (2), 683-706.
Lewis, D.A., Salem, G., 1986. Fear of Crime: Incivility and the Production of a Social Problem. Transaction Publishers, . New Jersey.
Lin, H.F., 2007. Predicting consumer intentions to shop online: an empirical test of competing theories. Electron. Commer. Res. Appl. 6 (4), 433-442.
Lindblad, M.R., Manturuk, K.R, Quercia, R.G., 2012. Sense of community and informal social control among lower income households: the role of homeownership and collective efficacy in reducing subjective neighborhood crime and disorder. Am. J. Commun. Psycho!.. http://dx.doi.orgIl0.1007/sl0464-012-9507-9.
Liska, A.E., Warner, B.D., 1991. Functions of crime: a paradoxical process. Am. J. Sociol. 96 (6), 1441-1463. Lockwood, C.M., MacKinnon, D.P., 1998. Bootstrapping the Standard Error of the Mediated Effect. Paper presented at
the 23rd Annual Meeting of SAS Users Group International, Cary, NC. Mardia, K.V., 1974. Applications of some measures of multivariate skewness and kurtosis in testing normality and
robustness studies. Sankhya: Indian J. Statist. Ser. B 36 (2), 115-128. Markowitz, F.E., Bellair, P.E., Liska, A.E., Liu, J., 2001. Extending social disorganization theory: modeling the re
lationships between cohesion, disorder, and fear. Criminology 39 (2), 293-320. McCrea, R, Shyy, T.K., Western, J., Stimson, R.I., 2005. Fear of crime in Brisbane: individual, social and neigh
bourhood factors in perspective. J. Sociol. 41 (1),7-27. McDougall, W., 1920. The Group Mind: a Sketch of the Principles of Collective Psychology, with Some Attempt to
Apply Them to the Interpretation of National Life and Character. GP Putnam's Sons. McGarrell, E.F., Giacomazzi, AL., Thurman, Q.C., 1997. Neighborhood disorder, integration, and the fear of crime.
Justice Q. 14 (3), 479-500. Moley, S., 2008. Public perceptions. In: Kershaw, C., Nicholas, S., Walker, A (Eds.), The British Crime Survey. Home
Office Statistical Bulletin, London. Moody, J., White, D.R., 2003. Structural cohesion and embeddedness: a hierarchical concept of social groups. Am.
Sociol. Rev. 68 (1), 103-127. Morenoff, J.D., Sampson, R.J., Raudenbush, S.W., 2001. Neighborhood inequality, collective efficacy, and the spatial
dynamics of urban violence. Criminology 39 (3), 517-558. Newman, 0., 1972. Defensible Space; Crime Prevention Through Urban Design. Macmillan, New York. Nunnally, J.C., Bernstein, LH., 1994. Psychometric Theory, third ed. McGraw-Hill, New York. Pattillo, M.E., 1998. Sweet mothers and gangbangers: managing crime in a black middle-class neighborhood. Soc.
Forces 76 (3), 747-774.
M. Hedayati Marzbali et al. / International Journal of Law, Crime and Justice xx (2014) 1-22 21
Penang Statistics, 2011. Penang Statistics 2011. Socio-Economic & Environmental Research Institute, Penang. Perkins, D.D., Florin, P., Rich, R.C., Wandersman, A., Chavis, D.M., 1990. Participation and the social and
physical environment of residential blocks: crime and community context. Am. J. Commun. Psycho!. 18 (I), 83-115.
Peterson, N.A., Hughey, J., 2004. Social cohesion and intrapersonal empowerment: gender as moderator. Health Educ. Res. 19 (5), 533-542.
Preacher, KJ., Hayes, A.F., 2008. Asymptotic and resampling strategies for assessing and comparing indirect effects in multiple mediator models. Behav. Res. Meth. 40 (3), 879-891.
Putnam, R.D., 2000. Bowling Alone: the Collapse and Revival of American Community. Simon & Schuster, New York. Putnam, R.D., 2007. E pluribus unum: diversity and community in the twenty-first century the 2006 Johan Skytte Prize
Lecture. Scand. Polit. Stud. 30 (2), 137-174. Renauer, B.C., 2007. Reducing fear of crime. Police Q. 10 (I), 41-62. Rountree, P.W., Land, KC., 1996. Burglary victimization, perceptions of crime risk, and routine activities: a multilevel
analysis across Seattle neighborhoods and census tracts. J. Res. Crime. Delinquen. 33 (2), 147-180. Rountree, P.w., Warner, B.D., 1999. Social ties and crime: is the relationship gendered? Criminology 37 (4), 789-814. Sampson, RJ., 1999. What "community" supplies. In: Ferguson, R.F., Dickens, W.T. (Eds.), Urban Problems and
Community Development. The Brookings Institution, Washington, DC, pp. 241-292. Sampson, RJ., Groves, W.B., 1989. Community structure and crime: testing social-disorganization theory. Am. J.
Socio!. 94 (4), 774-802. Sampson, R.J., Raudenbush, S.W., 1999. Systematic social observation of public spaces: a new look at disorder in urban
neighborhoods. Am. J. Socio!. 105 (3),603-651. Sampson, RJ., Raudenbush, S.W., Earls, F., 1997. Neighborhoods and violent crime: a multilevel study of collective
efficacy. Science 277 (5328), 918-924. Schafer, J.A., Huebner, B.M., Bynum, T.S., 2006. Fear of crime and criminal victimization: gender-based contrasts. J.
Crim. Justice 34 (3), 285-301. Schweitzer, J.H., Kim, J.W., Mackin, J.R., 1999. The impact of the built environment on crime and fear of crime in
urban neighborhoods. J. Urban Techno!' 6 (3), 59-73. Shaw, C.R., McKay, H.D., 1942. Juvenile Delinquency and Urban Areas. University of Chicago Press, Chicago. Shaw, C.R., McKay, H.D., 1969. Juvenile Delinquency and Urban Areas: a Study of Rates of Delinquency in Relation to
Differential Characteristics of Local Communities in American Cities. University of Chicago Press, Chicago. Shrout, P.E., Bolger, N., 2002. Mediation in experimental and nonexperimental studies: new procedures and recom
mendations. Psycho!. Meth. Psycho!. Meth. 7 (4), 422-445. Skogan, W.G., Maxfield, M.G., 1981. Coping with Crime: Individual and Neighborhood Reactions. Sage Publications,
Beverly Hills, CA. Sobel, M.E., 1982. Asymptotic confidence intervals for indirect effects in structural equation models. In: Leinhart, S.
(Ed.), Sociological Methodology. Jossey-Bass, San Francisco, pp. 290-312. Steenbeek, W., Hipp, J.R., 2011. A longitudinal test of social disorganization theory: feedback effects among cohesion,
social control, and disorder. Criminology 49 (3), 833-871. Swaray, R., 2007. On the relationship between the public's worry about safety from burglary and probabilities of
burglary: some evidence from simultaneous equation models. Soc. Indic. Res. 80 (2), 361-378. Takagi, D., Ikeda, K, Kawachi, I., 2012. Neighborhood social capital and crime victimization: comparison of spatial
regression analysis and hierarchical regression analysis. Soc. Sci. Med. 72 (10), 1895-1902. Taub, R., Taylor, D.G., Dunham, J., 1984. Paths of Neighbourhood Change: Race and Crime in Urban America.
University of Chicago Press, Chicago. Taylor, R.B., 1995. The impact of crime on communities. Ann. Am. Acad. Polit. Soc. Sci. 539 (1), 28-45. Taylor, R.B., 1997. Social order and disorder of street blocks and neighborhoods: ecology, microecology, and the
systemic model of social disorganization. J. Res. Crime Delinquen. 34 (I), 113-155. Toseland, R.W., 1982. Fear of crime: who is most vulnerable? J. Crim. Justice 10 (3), 199-209. Tseloni, A., Zarafonitou, C., 2008. Fear of crime and victimization: a multivariate multilevel analysis of competing
measurements. Eur. J. Crimino!. 5 (4), 387-409. van Hooijdonk, C., Droomers, M., Deerenberg, I.M., Mackenbach, J.P., Kunst, A.E., 2008. The diversity in associations
between community social capital and health per health outcome, popUlation group and location studied. Int. J. Epidemio!. 37 (6), 1384-1392.
van Wilsem, J., Wittebrood, K, de Graaf, N.D., 2006. Socioeconomic dynamics of neighborhoods and the risk of crime victimization: a multilevel study of improving, declining, and stable areas in the Netherlands. Soc. Prob!. 53 (2), 226-247.
22 M. Hedayati Marzbali et al. / International Journal of Law, Crime and Justice xx (2014) 1-22
Vandenberg, R.I., Lance, C.E., 2000. A review and synthesis of the measurement invariance literature: suggestions, practices, and recommendations for organizational research. Organ. Res. Meth. 3 (1),4-70.
Villarreal, A., Silva, B.F.A., 2006. Social cohesion, criminal victimization and perceived risk of crime in Brazilian neighborhoods. Soc. Forces 84 (3), 1725-1753.
Warner, B.D., Rountree, P.W., 1997. Local social ties in a community and crime model: questioning the systemic nature of informal social control. Soc. Probs. 44 (4), 520-536.
Williams, J., MacKinnon, D.P., 2008. Resampling and distribution of the product methods for testing indirect effects in complex models. Struct. Equ. Model. 15 (1), 23-51.
Wong, S.K., 2012. Youth crime and family disruption in Canadian municipalities: an adaptation of Shaw and McKay's social disorganization theory. Tnt. J. Law Crime Justice 40 (2), 100-114.
You, S., Furlong, MJ., Felix, E., Sharkey, J.D., Tanigawa, D., Green, J.G., 2008. Relations among school connectedness, hope, life satisfaction, and bully victimization. Psychol. Sch. 45 (5), 446-460.
Yusof, N.M., 2006. Patterns of social interaction between different ethnic groups in Malaysian Secondary Schools. J. Pendidik. Dan. Pendidik. 21, 149-164.
ELSEVIER
Available online at www.sciencedirect.com ... -"
.... ;' ScienceDirect Procedia - Social and Behavioral Sciences 00 (2014) RE-OIO
AicE-Bs20 14 Berlin (fonnerly AicE-Bs20 14Magdeburg)
Procedia Social and Behavioral Sciences
www.elsevier.comllocate/procedia
Asia Pacific International Conference on Environment-Behaviour Studies Sirius Business Park Berlin-yard field, Berlin, 24-26 February 2014
"Public Participation: Shaping a sustainable future "
The Influence of Permeability on Social Cohesion: Is it good or bad?
Aldrin Abdullah *, Massoomeh Hedayati Marzbali, Mohammad J avad Maghsoodi Tilaki, Azizi Bahauddin
School of Housing, Building & Planning, Universiti Sains Malaysia, 11800 Penang, Malaysia
Abstract
Finding ways to increase social interactions among residents in residential neighbourhoods may be one mechanism to improve health and wellbeing. Understanding environmental conditions of the neighbourhoods can playa critical role in maintaining social interactions among residents. This research is carried out to assess the effect of street permeability on the degree of social cohesion among residents in a residential neighbourhood in Penang, Malaysia. A total of 250 households participated in the study. The findings indicate that permeability can account for a significant proportion of the variance in residents' social cohesion. Residents living in less permeable streets are more likely to have a high social cohesion with their neighbours. The results further support the defensible space concept which advocates closed and less permeable streets. Implications for future research are discussed.
© 2014 Published by Elsevier Ltd. Selection and peer-review under responsibility of the Centre for EnvironmentBehaviour Studies (cE-Bs), Faculty of Architecture, Planning & Surveying, Universiti Teknologi MARA, Malaysia.
Keywords: Penneabi1ity; social cohesion; road type; residential neighbourhood
1. Introduction
There is no doubt that both social and physical factors have an effect on human behaviour. Without denying the effect of social factors, there is a need to examine more closely the physical factors that may contribute to social interaction. Numerous studies have proven that the built environment do affect human
• Corresponding author. Tel.: +6-012-410-4715; fax: +6-004-656-9298. E-mail address:[email protected]
2 Aldrin Abdullah et al.! Procedia - Social and Behavioral Sciences 02 (2014) RE 010
behaviour. Physical characteristics of urban neighbourhoods play a critical role in maintaining social interactions among residents. In fact, it is anticipated that the patterns of neighbourhood layout contribute to facilitate or disrupt any sense of attachment among residents. Although most planning literature has spoken of the enhancement of cohesion and privacy on cul-de-sacs rather than through roads, there is little evidence to support this assumption (Brown & Werner, 1985). The question arises on which physical characteristics of urban environments contribute to facilitate social interactions among neighbours. A report by the American Planning Association also indicates that design and planning processes that neglect human behaviour and basic needs result in neighbourhoods that fail to provide the ingredients for positive interactions between people in communities (Ziegler, 2007). The report has further observed that future development must take into consideration the interrelationships between human and the built environment to protect public health, safety and the character of residential neighbourhoods.
Our primary interest here is the influence of community design on social cohesion in an urban neighbourhood in Malaysia. One of the pathways through which aspects of the built environment might affect residents' health and safety is neighbourhood layout, as it plays a significant role in residents' safety, perceived cohesion and physical activity (Leitzrnann et aI., 2007; Ziegler, 2007). This is an interesting realisation of the architects and urban planners that the design of the built environment plays a significant role in human behaviour. It is believed that community design can foster greater social capital production by providing opportunities to interact and build trust in neighbourhoods. Increased interaction enhances cohesion, allowing design to overcome outcomes associated with crime and fear of crime such as social isolation, and the disparity among citizens from different ethnic backgrounds. Finding ways to facilitate social interactions may be especially important in Malaysia which is composed of different ethnic backgrounds. Malaysia is a multiracial, multi-cultural and multi-religious country with the majority of the population embracing Islam, Buddhism, Hinduism and Christianity. Therefore, understanding the patterns of social cohesion among this multiracial society could bring new insights that could facilitate racial integration.
An overview of the existing literature indicates that there are two quite divergent views on the pattern of street layout among urban planners. First of all, Jacobs (1961) in her well known discussion of crime and urban neighbourhood claims that the use of street sidewalk that brings in more outsiders is a bedrock feature of a safe city. The norm is that strangers quickly glance at each other and do not talk to one another. Although this type of face-work does not result in a sustained interaction, it may create a secure climate that in tum helps to keep crime rates low and facilitate social interactions. Similarly, the proponents of New Urbanism draw on the premise that the greater surveillability and walkability tend to invite more pedestrians to the streets and consequently increase safety (CND, 2001). The result ofa study conducted by Foster et aI. (2010) provides some support for the New Urbanism theory in terms of the neighbourhood configurations that draw people into the street and encourage walkability, both serving as significant positive correlates of social contacts.
Secondly, contrary to Jacobs, the proponents of Newman's (1972) defensible space concept demonstrate their advocacy towards cul-de-sac streets. Similarly, studies observe that there is a significant relationship between social integration and street form, where there is a greater neighbourhood attachment on cul-de-sacs than through roads (Baumer& Hunter, 1979; Brown & Werner, 1985). Due to the above dispute on the role of permeability in relation to social cohesion, this study seeks to address this issue in the Malaysian context. The present work attempts to investigate planning features of the residential area and to draw a clearer picture of how the patterns of human behaviour are influenced by spatial design. Such an analytic approach allows the researcher to examine whether the level of the street permeability is important for understanding human behaviour. Besides limited empirical studies on the relationship between design features and social cohesion, previous studies have only examined street
Aldrin Abdullah et al. / Procedia - Social and Behavioral Sciences 02 (2014) RE 010
pattern differences in terms of victims' experiences and burglary distribution, particularly in the European context (Shu, 2009) and the focus is not given on people's perception of surrounding environment that influences their quality of life (Beavon et aI., 1994; Shu, 2009). The current study addresses this shortcoming in the literature by testing the impact of permeability indicators on social cohesion. In doing so, this study examines whether social cohesion differs across road types. This approach provides a comprehensive understanding of how the street contributes to facilitate social cohesion. These discussions lead to the following hypotheses as shown on a hypothesised model (see Fig. 1). Hl. The five indicators of social cohesion provide a valid measurement of the social cohesion construct. H2. There is a significant relationship between the indicators of street permeability and social cohesion.
Indicators of Social cohesion permeability
Fig. 1. The conceptual pathway between street penneability and social cohesion.
2. Literature review
2.1. Community design and human behaviour
Evidence suggests that the spatial layout of street networks plays a vital role in establishing people's utilisation of places, movements and their perception of the surrounding environment (Johnson & Bowers, 2010). As mentioned above, there are two different perspectives on the patterns of neighbourhood layout. Firstly, Newman and Poyner deem passers-by as potential offenders who should be expelled from residential areas. Newman's (1972) plan for an ideal mini-neighbourhood layout was intended in part to improve safety and security. He explored important perspectives about human behaviour in the urban environment and encouraged less permeable layouts as opposed to New Urbanism policies that support high permeable layouts in achieving sustainability agenda. In the benefits of cul-desacs, Southworth and Ben-Joseph (2004) have stated that traffic engineering has strongly supported this street type. Cul-de-sac street layout has been a preferable design form to control through traffic since its early use as a part of hierarchy circulation system in the Radburn design concept of 1928 (Southworth& Ben-Joseph,2004).
Contrary to the position of a territoriality-based defensible space system advised by Newman (1972), Jacobs and Hillier consider passing strangers as being often generated by the intelligible through street system. Referring to diverse, open and permeable land uses, there is more continual flow of people (strangers and inhabitants) which can be referred to what Jacobs presents as "a basic supply of activities and eyes" (Jacobs, 1961, p. 40). The research conducted by Hillier (1988) is consistent with Jacobs' work. Hillier defmes "intelligible deformed grid" and "constituted outward facing block" as the main environmental features to prevent crime. He considers strangers as beneficial elements in the street system because they prevent crime, when residents can have a strong inter-visibility of the surrounding dwellings to protect from strangers. While through-roads with front entrances on both sides make spaces safer, fewer line neighbours, segregation and cul-de-sac patterns are the factors that make spaces quite vulnerable (Shu, 1999). Indeed, those anonymous streets that Newman defines more vulnerable are instead considered by Shu as safer patterns. Hillier and Shu (2000) have conducted a research in the UK, which suggests that cul-de-sacs patterns are generally less good than through-roads. In this research, the
3
4 Aldrin Abdullah et al. / Procedia - Social and Behavioral Sciences 02 (2014) RE 010
problem of cul-de-sacs has been mentioned due to its effect on the impoverishment of the public realm, which makes a community less safe and liveable.
Similar to Jacobs' work, Shu & Huang (2003) have found that places with segregated areas are more vulnerable than integrated ones due to fewer passers-by entering the areas, consequently generating less natural surveillance. A recent study by Shu (2009) proposes that segregated streets become extremely vulnerable when associated with low inter-visibility in the areas, while streets with higher accessibility are very safe when combined with higher inter-visibility and informal surveillance. However, on the whole, researchers with viewpoints similar to Jacobs have found that busier streets with some pedestrian movements are associated with high social interactions and low crime rates. Referring to the New Urbanists' design, cul-de-sac street patterns are car-oriented and pedestrian-hostile, compared to grid street patterns (Cozens, 2008). This increases walkability in the permeable grid layouts, promoting social cohesion and a sense of community (Morrow-Jons et aI., 2004). Jacobs' ideas underpin many of the New Urbanists' approaches (Cozens, 2008). To look at both sides of the continuum, similar to Jacobs' eyes on the street concept, New Urbanists believe that strangers are the sources of safety, while the proponents of defensible space consider strangers as the source of danger (Hillier, 2004). However, it should be noted that the context in which Jacobs and Newman's studies operate may be the influencing factor. Jacobs (1961) has drawn attention to the urban design and narrowed the investigation area of crime-space studies. Her study is more concerned with macro-scale planning such as commercial and business settings, while Newman's work focuses on micro-scale settings such as public housing and residential settings.
2.2. Permeability and social cohesion
Although few studies have focused on the relationship between social cohesion and road type, a review of the literature has shown some mixed findings. Evidence seems to suggest that there is a high degree of neighbouring behaviour on cul-de-sacs (Bajunid et aI., 2011; Brown & Werner, 1985). Doeksen (1997) asserts that positive qualities of the built environment can become a mediator to a sense of community and neighbourhood attachment. Similarly, a previous study has indicated that residents living on high permeable streets have limited their activities in the use of property frontage and their exposure to the strangers (Appleyard&Lintell, 1972). By contrast, the result of a study conducted by Foster et ai. (2010) provides some support for the New Urbanism theory and Jacobs' concept that draws people into the street and encourages walkability, both serving as significant positive correlates of social contacts.
The fmdings of Mayo's (1979) study challenge some of the present beliefs that manipulation of the streets can provide a better social atmosphere of streets within a neighbourhood. While a number of studies have found a significant relationship between street form and neighbouring behaviour (Hillier, 2004; Mason, 2010), scholars such as Gans (1967) and Mayo (1979) claim that no element in the site plan is influential in friendship ties. Mayo reports that planners cannot directly influence behaviour through the manipulation of street forms. By contrast, Taylor (1997) suggests that small geographic units act as compact behaviour settings and consequently, local social interactions and residents' behaviour patterns are developed within these units. He has also noted that street blocks allow residents to develop informal control and help to provide a connection among individuals.
Aldrin Abdullah et al. / Procedia - Social and Behavioral Sciences 02 (2014) RE 010
3. Methodology
3.1. Study context
This study was conducted in a typical residential neighbourhood in Penang, Malaysia, that are predominantly occupied by middle-income residents. The study was quantitative in natUre and involved asking the residents to answer a survey face-to-face. The survey contained several sections aiming at ascertaining the background information of the respondents and their perceived social integration. A sampling framework was developed from the list of all of the landed properties in the study area. The respondents were selected using a systematic sampling method with a random start. In all, 250 residents participated in the survey. Of these respondents, 108 were male (43%), and 142 were female (57%) with an average age of 53 years (SD=12.98). The survey further illustrates that 51 % of the respondents were Malay, 39% were Chinese and 10% were Indian. The majority of survey respondents (65%) had a college/university education.
3.2. Measures
3.2.1. Permeability To capture the degree of street permeability, we developed four indicators that were adapted based on
previous works. First, road type as a typological variable of street permeability refers to the degree of road hierarchy (Shu, 2009) as defined by Public Works Department Malaysia (PWD). This variable consists of five categories, namely VI (cul-de-sacs), V2 (local streets), U3 (minor collector), V4 (major collector) and V5 (arterial). These categories are based on the Malaysian road hierarchy system. The second spatial indicator is street accessibility which is adapted based on the work of Beavon et al. (1994) and Johnson and Brower (2010). It focuses on the degree of street accessibility by examining the number of turns into the street segment. The scale is based on the number of turnings to each street segment (from one to six), in which a larger number indicates greater degrees of accessibility.
The third indicator is traffic flow that represents traffic movement through neighbourhood streets. If major traffic routes path through the neighbourhood, it may have significant influences on the neighbouring behaviour and consequently, social cohesion. Several studies have found higher crime rates on or near major traffic routes (Beavon, 1984; Greenberg &Rohe, 1984). Since traffic information based on each street segment was not available, this item was measured based on the author's judgment by onsite observation. The last indicator, constitutedness, is related to the degree of inter-visibility which means a front door-to-front door relationship to measure the degree of inter-visibility between houses on both sides of each street segment. This indicator is adapted from the work of Shu (2009) and the scale is decided through on-site observation.
3.2.2. Social cohesion Social cohesion was measured by asking the respondents to report on their own feelings of cohesion.
This variable represents the extent to which respondents know their neighbours, like the neighbourhood and share similar interests. The items were adapted based on the work of Sampson et al. (1997). The items were: (1) people around here are willing to help their neighbours; (2) This is a close-knit neighbourhood; (3) People in this neighbourhood can be trusted; (4) People in this neighbourhood get along with each other; and (5) People in this neighbourhood share the same values. The responses were recorded on a 7-point scale with 1 representing 'strongly agree', 7 representing 'strongly disagree' and 4 representing 'neutral'.
5
6 Aldrin Abdullah et al. / Procedia - Social and Behavioral Sciences 02 (2014) RE 010
3.3. Plan of analysis
Descriptive statistics were used to provide an initial description of the sample and to assess the distribution of key variables. This is followed by assessing the validity and reliability of the social cohesion indicators. The next test is to assess the equality of population means when the population is classified into groups. The common technique used to identify such equality is the one-way Analysis of Variance (ANOVA) for more than two groups under comparison. Bivariate correlations were also examined to provide information regarding the relationship between the variables.
4. Data analysis
Responses to the seven-point Likert scales were aggregated to the household level as initial measures. The five social cohesion statements were examined for validity (using corrected item-to-total correlations) and reliability based on the index of Cronbach's Alpha (a). The results of the validity and reliability tests are illustrated in Table 1, indicating that each item had a corrected item-to-scale correlation above 0.3 (0.87 to 0.93). The Cronbach's a score for social cohesion (a=0.97) was higher than the recommended 0.70 cut-off value (Nunnally& Bernstein, 1994) and it indicated good scale reliability. The [mdings reveal that the five items were valid and reliable to measure the social cohesion construct. Therefore, HI is supported.
Having determined the social cohesion variable, the next test is to examine the mean differences of social cohesion based on different road types. The data were analysed using the one-way ANOV A to determine the significant differences in the mean of social cohesion. The results reveal that there are significant mean differences between road types (F(5, 244)=4.057, p<O.OI). The mean values and the standard deviations of the social cohesion variable based on road types are presented in Table 1. The results further indicate that residents living in cul-de-sacs street pattern perceived the highest level of social cohesion, whereas those living in arterials (through roads) perceived the lowest level of social cohesion. The findings of the present study indicate that respondents from the properties located on culde-sacs and local streets perceived a higher level of social cohesion compared to those from the arterials. This result is consistent with the findings of a previous study (Brown & Werner, 1985), suggesting that residents from close streets are more protective of their surroundings and are associated with higher levels of social integration and neighbourhood cohesion, compared to the higher levels of hierarchy.
Table 1. Descriptive statistics, reliability and item-total statistics for neighbourhood cohesion items
Variable Social cohesion (N= 250) Variable Corrected Item- Cronbach's One-way ANOV A
Groups Mean SD Total Correlation Alpha ifItem
Deleted
Road type Ul 20.51 4.164 Cohesion 1 0.87 0.97 4.057**,p<0.01
U2 19.85 4.202 Cohesion 2 0.90
U3 19.38 4.340 Cohesion 3 0.91
U4 18.33 4.455 Cohesion 4 0.93
U5 17.80 3.851 Cohesion 5 0.91
Note: SD= Standard deviation; **p<O.01.
The results from the bivariate correlations are presented in Table 2. Road type has demonstrated a statistically significant negative correlation with social cohesion (r=-.221, p<O.OI). Consistent with
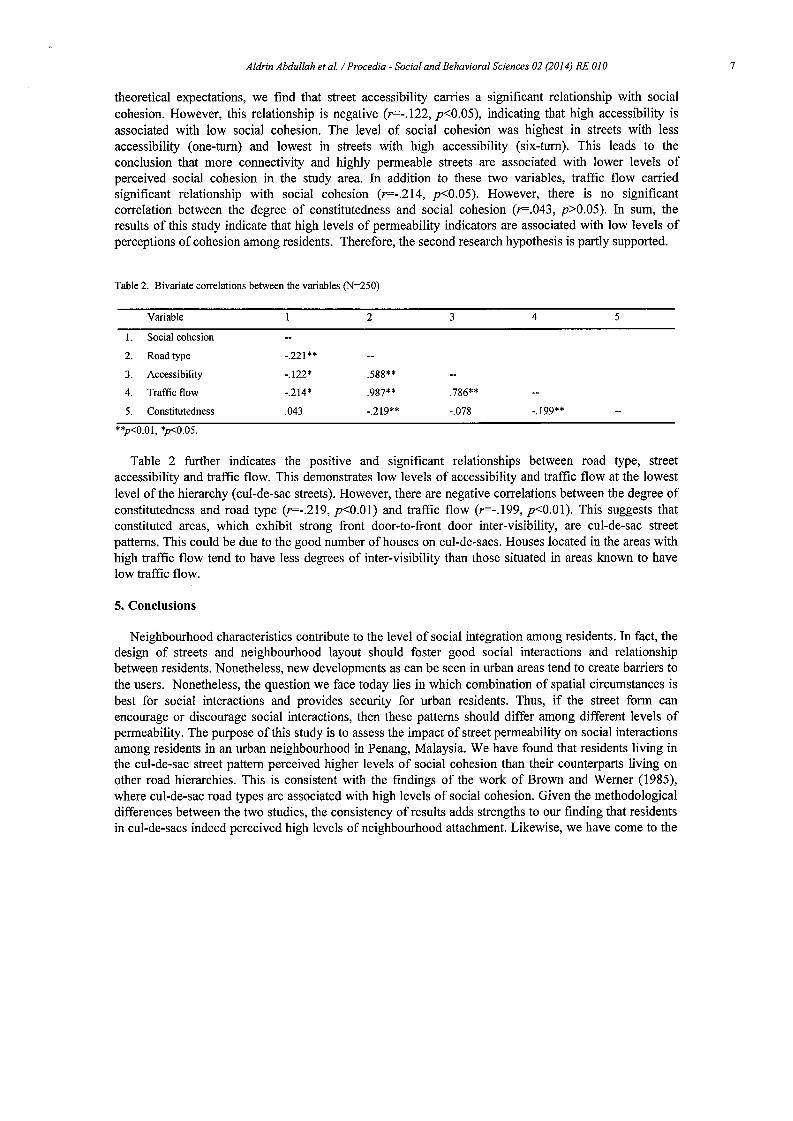
Aldrin Abdullah et at. / Procedia - Social and Behavioral Sciences 02 (2014) RE ala
theoretical expectations, we find that street accessibility carries a significant relationship with social cohesion. However, this relationship is negative (r=-.122, p<O.05), indicating that high accessibility is associated with low social cohesion. The level of social cohesion was highest in streets with less accessibility (one-tum) and lowest in streets with high accessibility (six-tum). This leads to the conclusion that more connectivity and highly permeable streets are associated with lower levels of perceived social cohesion in the study area. In addition to these two variables, traffic flow carried significant relationship with social cohesion (r=-.214, p<O.05). However, there is no significant correlation between the degree of constitutedness and social cohesion (r=.043, p>O.05). In sum, the results of this study indicate that high levels of permeability indicators are associated with low levels of perceptions of cohesion among residents. Therefore, the second research hypothesis is partly supported.
Table 2. Bivariate correlations between the variables (N=250)
Variable 2
1. Social cohesion
2. Road type -.221 **
3. Accessibility -.122* .588**
4. Traffic flow -.214* .987**
5. Constitutedness .043 -.219**
**p<O.OI, *p<0.05.
3
.786**
-.078
4 5
-.199**
Table 2 further indicates the positive and significant relationships between road type, street accessibility and traffic flow. This demonstrates low levels of accessibility and traffic flow at the lowest level of the hierarchy (cul-de-sac streets). However, there are negative correlations between the degree of constitutedness and road type (r=-.219, p<O.OI) and traffic flow (r=-.199, p<O.OI). This suggests that constituted areas, which exhibit strong front door-to-front door inter-visibility, are cul-de-sac street patterns. This could be due to the good number of houses on cul-de-sacs. Houses located in the areas with high traffic flow tend to have less degrees of inter-visibility than those situated in areas known to have low traffic flow.
5. Conclusions
Neighbourhood characteristics contribute to the level of social integration among residents. In fact, the design of streets and neighbourhood layout should foster good social interactions and relationship between residents. Nonetheless, new developments as can be seen in urban areas tend to create barriers to the users. Nonetheless, the question we face today lies in which combination of spatial circumstances is best for social interactions and provides security for urban residents. Thus, if the street form can encourage or discourage social interactions, then these patterns should differ among different levels of permeability. The purpose of this study is to assess the impact of street permeability on social interactions among residents in an urban neighbourhood in Penang, Malaysia. We have found that residents living in the cul-de-sac street pattern perceived higher levels of social cohesion than their counterparts living on other road hierarchies. This is consistent with the findings of the work of Brown and Werner (1985), where cul-de-sac road types are associated with high levels of social cohesion. Given the methodological differences between the two studies, the consistency of results adds strengths to our finding that residents in cul-de-sacs indeed perceived high levels of neighbourhood attachment. Likewise, we have come to the
7
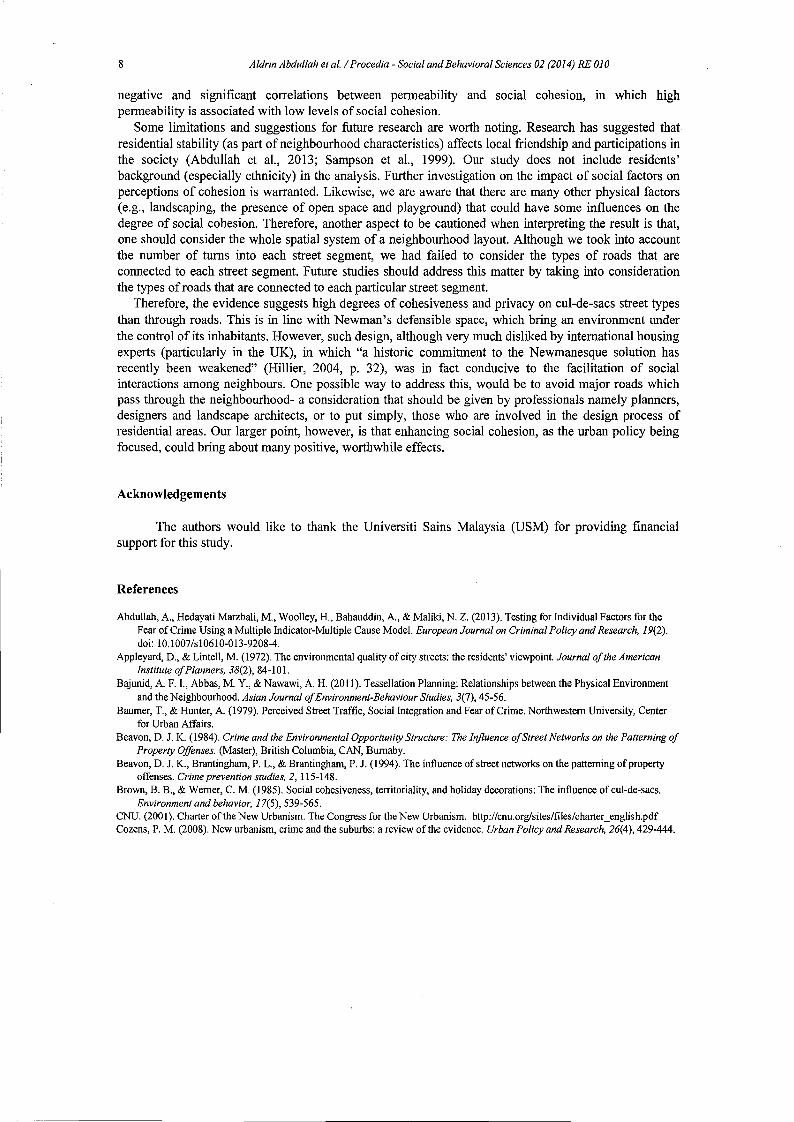
8 Aldrin Abdullah et al. / Procedia - Social and Behavioral Sciences 02 (2014) RE 010
negative and significant correlations between permeability and social cohesion, in which high permeability is associated with low levels of social cohesion.
Some limitations and suggestions for future research are worth noting. Research has suggested that residential stability (as part of neighbourhood characteristics) affects local friendship and participations in the society (Abdullah et aI., 2013; Sampson et aI., 1999). Our study does not include residents' background (especially ethnicity) in the analysis. Further investigation on the impact of social factors on perceptions of cohesion is warranted. Likewise, we are aware that there are many other physical factors (e.g., landscaping, the presence of open space and playground) that could have some influences on the degree of social cohesion. Therefore, another aspect to be cautioned when interpreting the result is that, one should consider the whole spatial system of a neighbourhood layout. Although we took into account the number of turns into each street segment, we had failed to consider the types of roads that are connected to each street segment. Future studies should address this matter by taking into consideration the types of roads that are connected to each particular street segment.
Therefore, the evidence suggests high degrees of cohesiveness and privacy on cul-de-sacs street types than through roads. This is in line with Newman's defensible space, which bring an environment under the control of its inhabitants. However, such design, although very much disliked by international housing experts (particularly in the UK), in which "a historic commitment to the Newmanesque solution has recently been weakened" (Hillier, 2004, p. 32), was in fact conducive to the facilitation of social interactions among neighbours. One possible way to address this, would be to avoid major roads which pass through the neighbourhood- a consideration that should be given by professionals namely planners, designers and landscape architects, or to put simply, those who are involved in the design process of residential areas. Our larger point, however, is that enhancing social cohesion, as the urban policy being focused, could bring about many positive, worthwhile effects.
Acknowledgements
The authors would like to thank the Universiti Sains Malaysia (USM) for providing financial support for this study.
References
Abdullah, A, Hedayati Marzbali, M., Woolley, H., Bahauddin, A, & Maliki, N. Z. (2013). Testing for Individual Factors for the Fear of Crime Using a Multiple Indicator-Multiple Cause Model. European Journal on Criminal Policy and Research, 19(2). doi: 10.1007/sI0610-013-9208-4.
Appleyard, D., & Lintell, M. (1972). The environmental quality of city streets: the residents' viewpoint. Journal of the American Institute of Planners, 38(2),84-101.
Bajunid, A F. L, Abbas, M. Y., & Nawawi, A H. (2011). Tessellation Planning: Relationships between the Physical Environment and the Neighbourhood. Asian Journal of Environment-Behaviour Studies, 3(7), 45-56.
Baumer, T., & Hunter, A (1979). Perceived Street Traffic, Social Integration and Fear of Crime. Northwestern University, Center for Urban Affairs.
Beavon, D. 1. K. (1984). Crime and the Environmental Opportunity Structure: The Influence of Street Networks on the Patterning of Property Offenses. (Master), British Columbia, CAN, Burnaby.
Beavon, D. 1. K., Brantingham, P. 1., & Brantingham, P. 1. (1994). The influence of street networks on the patterning of property offenses. Crime prevention studies, 2, 115-148.
Brown, B. B., & Werner, C. M. (1985). Social cohesiveness, territoriality, and holiday decorations: The influence of cul-de-sacs. Environment and behavior, 17(5), 539-565.
CNU. (2001). Charter of the New Urbanism. The Congress for the New Urbanism. http://cnu.org/sites/files!charter_english.pdf Cozens, P. M. (2008). New urbanism, crime and the suburbs: a review of the evidence. Urban Policy and Research, 26(4),429-444.
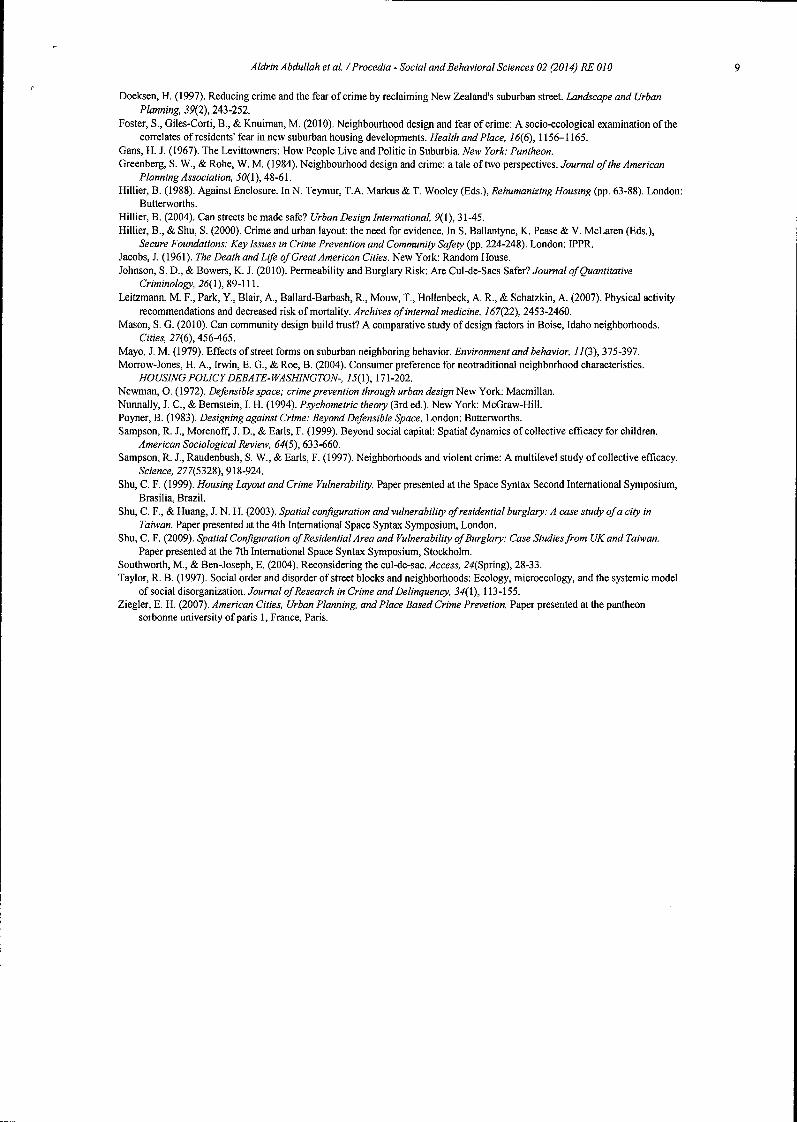
Aldrin Abdullah et al. / Procedia - Social and Behavioral Sciences 02 (2014) RE 010
Doeksen, H. (1997). Reducing crime and the fear of crime by reclaiming New Zealand's suburban street. Landscape and Urban Planning, 39(2), 243-252.
Foster, S., Giles-Corti, 8., & Knuiman, M. (2010). Neighbourhood design and fear of crime: A socio-ecological examination of the correlates of residents' fear in new suburban housing developments. Health and Place, 16(6), 1156-1165.
Gans, H. J. (1967). The Levittowners: How People Live and Politic in Suburbia. New York: Pantheon. Greenberg, S. W., & Rohe, W. M. (1984). Neighbourhood design and crime: a tale of two perspectives. Journal of the American
Planning AssOCiation, 50(1),48-61. Hillier, B. (1988). Against Enclosure. In N. Teymur, T.A. Markus & T. Wooley (Eds.), Rehumanizing Housing (pp. 63-88). London:
Butterworths. Hillier, B. (2004). Can streets be made safe? Urban Design International, 9(1),31-45. Hillier, B., & Shu, S. (2000). Crime and urban layout: the need for evidence. In S. Ballantyne, K. Pease & V. McLaren (Eds.),
Secure Foundations: Key Issues in Crime Prevention and Community Safety (pp. 224-248). London: IPPR. Jacobs, J. (1961). The Death and Life of Great American Cities. New York: Random House. Johnson, S. D., & Bowers, K. J. (2010). Permeability and Burglary Risk: Are Cul-de-Sacs Safer? Journal of Quantitative
Criminology, 26( 1), 89-111. Leitzmann, M. F., Park, Y., Blair, A., Ballard-Barbash, R., Mouw, T., Hollenbeck, A. R., & Schatzkin, A. (2007). Physical activity
recommendations and decreased risk of mortality. Archives of internal medicine, 167(22), 2453-2460. Mason, S. G. (2010). Can community design build trust? A comparative study of design factors in Boise, Idaho neighborhoods.
Cities, 27(6),456-465. Mayo, J. M. (1979). Effects of street forms on suburban neighboring behavior. Environment and behaVior, 11(3),375-397. Morrow-Jones, H. A., Irwin, E. G., & Roe, B. (2004). Consumer preference for neotraditional neighborhood characteristics.
HOUSING POLlCY DEBATE-WASHlNGTON-, 15(1), 171-202. Newman, O. (1972). Defensible space; crime prevention through urban design New York: Macmillan. Nunnally, J. C., & Bernstein, I. H. (1994). PsychometriC theory (3rd ed.). New York: McGraw-HilI. Poyner, B. (1983). Designing against Crime: Beyond Defensible Space. London: Butterworths. Sampson, R. J., Morenoff, J. D., & Earls, F. (1999). Beyond social capital: Spatial dynamics of collective efficacy for children.
American SOCiological Review, 64(5), 633-660. Sampson, R. J., Raudenbush, S. W., & Earls, F. (1997). Neighborhoods and violent crime: A multilevel study of collective efficacy.
Science, 277(5328), 918-924. Shu, C. F. (1999). Housing Layout and Crime Vulnerability. Paper presented at the Space Syntax Second International Symposium,
Brasilia, Brazil. Shu, C. F., & Huang, J. N. H. (2003). Spatial configuration and vulnerability of residential burglary: A case study ofa city in
Taiwan. Paper presented at the 4th International Space Syntax Symposium, London. Shu, C. F. (2009). Spatial Configuration of Residential Area and Vulnerability of Burglary: Case Studies from UK and Taiwan.
Paper presented at the 7th International Space Syntax Symposium, Stockholm. Southworth, M., & Ben-Joseph, E. (2004). Reconsidering the cul-de-sac. Access, 24(Spring), 28-33. Taylor, R. B. (1997). Social order and disorder of street blocks and neighborhoods: Ecology, microecology, and the systemic model
of social disorganization. Journal of Research in Crime and Delinquency, 34(1), 113-155. Ziegler, E. H. (2007). American Cities, Urban Planning, and Place Based Crime Prevetion. Paper presented at the pantheon
sorbonne university of paris 1, France, Paris.
9
PROCEEDINGS OF Z0131COI THE INTERNADONAL CONFERENCE ON
ORGANIZADONAL INNOVADON
JULY 2 - 4, 2013
Editor in Chief Dr. Shieh, Chich-Jen
Department of International Business Chang Jung Christian University, Taiwan, ROC
Editor Dr. Chou, Jyh-Rong
Department of Creative Product Design I-Shou University, Taiwan, ROC
Dr. Shang-Pao Yeh Department of Tourism,
I-Shou University, Taiwan, ROC
T. Aria Auliandri Department of Faculty of Economics and Business,
Airlangga University, Surabaya, Indonesia
HOSTED & ORGANIZED Institute of Sponsor: International Association of Organizational Innovations, USA International College of Suan Sunandha Rajabhat University, Thailand Airlangga University, Surabaya, Indonesia Chang Jung Christian University, College of Management, Taiwan Chang Jung Christian University, Department ofinternational Business, Taiwan Jasmine Publishions, Taiwan, ROC
Institute of Cosponsor: De La Salle University, Manila, Philippines Swinburne University of Technology, Master of Entrepreneurship and Innovation, Au Nanjing Audit University, School of Economics, China Southeastern Louisiana University, USA Far East University, College of Hospitality and Leisure, Taiwan
458 2013 International Conference of Organizational Innovation (2013 ICOI)
The Effects of Environmental Factors and Territorial Attitudes on Perceived Homogeneity in a Heterogeneous Urban Neighbourhood
'Aldrin Abdullah 'Massoomeh Hedayati Marzbali, PhD
'Syarmiia Hany Haron, PhD 'Azizi Bahauddin
'Mohammad Javad Maghsoodi Tilaki, PhD ·School of Housing, Building & Planning, Universiti Sains Malaysia, 11800, Penang,
Malaysia Corresponding author email address:[email protected]
Abstract This article investigates the relations between territorial attitude (T A) and territorial behaviour (TB) in a multi-ethnic urban neighbourhood in Malaysia. While the territorial functioning (TF) scale has been widely utilised in crime prevention studies, there is a lack of empirical evidence to support the link between TA and the actual TB. It is hypothesised that if T A is a dimension of the TF construct, there should be a positive significant correlation between TA and TB. We also anticipated that both TA and TB would be associated in the same fashion with perceived homogeneity (PH). In addition, it is hypothesised that neighbourhood stability would affect the TF dimensions and PH. A sample of218 inhabitants from Subang Jaya, Malaysia took part in the study. The result indicates a strong correlation between the two TF dimensions. Meanwhile, T A positively influences PH, whereas there is no significant effect of TB on PH. The results further reveal significant effects of neighbourhood stability on TF and PH, indicating that neighbourhood stability positively correlates to TF and enhances neighbourhood attachment, even in multi-ethnic communities.
2013 International Conference of Organizational Innovation (2013 I COl)
Introduction Neighbourhood condition has long been believed to have a direct influence on individual's perceptions through psychological consequences. Neighbourhoods play significant roles in the lives of those live and socialise within their boundaries. The neighbourhood is one of several spaces that provide social and physical space for interactions between residents, which leads to greater perception of safety and promote healthier communities. A range of features of the physical environment of a neighbourhood has been found to have an impact on residents' perception of the surrounding environment. Guided by social disorganisation theory, extant literature demonstrates that there are connections between the neighbourhood conditions, fear of crime and residents' interactions (De Jesus et at., 20 I 0; Foster et at., 2010; Hedayati Marzbali et aI., 20l2a; Lorenc et aI., 2012; Ross & Jang, 2000; Swatt et aI., 2013). In order to identify the mechanisms contributing to prevent negative neighbourhood conditions and develop healthier communities, considerable attention has been given to the concept of crime prevention by design strategies. One popular use of design strategies for crime prevention is territorial functioning (TF). Territorial functioning involves protecting a space and defending it against intrusion. It is based on the notion that residents are likely to protect spaces that belong to them and over which they have some means of control. There are many factors that can influence territorial functioning such as residents' responsibility, sense of coherence and lack of control (Patterson, 1978). Local neighbourhood ties enable the residents to bond together, which leads to an increase in their sense of belonging to the community. The sharing of resources among residents is part of a defensible space concept that posits that community networks reduce crime rates and fear of crime (Lee, 2000). Previous research has defined neighbourhood networks as a means of empowering residents to recognise strangers and of providing the degree of their sense of belonging to their neighbourhood (Hunter & Baumer, 1982). Studies posited that community network is one of the inhibitors of crime and fear, and neighbourhoods with high levels of cohesion are able to protect residents against intrusion (Lewis & Salem 1986; Perkins et aI., 1990). A number of studies have empirically examined the link between territorial attitude (TA) and the territorial behaviour (TB) elements. Taylor et al. (1981 b) found that territorial cognitions, expressed through attitudes, were strongly associated with marking behaviours. In another study, Edney (1972) found that residents who had more visible territorial display acted more rapidly to the presence of outsiders on their property. He found that these residents responded faster to a knock at the door. In the study conducted by Patterson (1978), it was revealed that people who displayed more territorial markers perceived themselves as being more territorial. Similarly, the results from a household survey showed that, after controlling for neighbourhood context, respondents with a better ability to identify between insiders and outsiders were more engaged in high demand gardening and had better kept dwellings (Taylor & Brower, 1985). Although the TF scale has been utilised in crime prevention studies as an appropriate strategy to reduce crime and fear of crime, research on the subject of territorial functioning has seldom taken into consideration territorial attitudes (Foster et aI., 2011). Research has suggested that future work should incorporate interpersonal and contextual influences of territorial functioning (Taylor et al., 1981 a). Previous studies have applied labels such as territorial meanings (Edney, 1974), territorial interpretations (Bakker & Bakker-Radbau, 1973) or territorial cognitions (Taylor et aI., 1981 a) to these attitudes. Territorial behaviour is an aspect of the actual territorial marking behaviour including the distribution of territorial cues to indicate that a space is owned, used or cared (Taylor et aI., 1981 a). We hypothesised that if TA is a dimension of the TF construct, there should be a positive significant correlation between T A and TB.
459
460 2013 International Conference of Organizational Innovation (2013 ICO!)
Studies have linked territorial functioning to social structure ofthe neighbourhood (Abdullah, 1999; Hedayati Marzbali et aI., 20 12b; Taylor et aI., 1981 a). A previous study has considered a label of social climate to measure perceived similarity of the residents to other residents on the same block (Taylor et aI., 1981 a). Their assessment of social climate focused on the perceived consonance of the on-block social grouping on several dimensions: household income, age, marital status, education and religion. However, our use of the term perceived homogeneity (PH) deserves some clarification. By perceived homogeneity, we mean the size of friendship networks among different ethnic groups as a dimension of community network. Research has established a link between territorial functioning and demographic factors, where the majority of households are inhabited by elder, married, owner-occupied, long-term occupied people with a high educational and income level (Hedayati Marzbali et aI., 2012b). Evidence suggests that a higher level of residential stability is positively correlated to neighborhood attachment (Brown et aI., 2003; Comstock et aI., 2010). In order to examine residents' similarities and differences, we also examined the effects of residential stability on the TF dimensions and PH. In addition to residential stability, it is well-known that ethnicity has an influence on residents' attitudes and neighbouring behaviour, although there is debate over why this is so. Such a perspective also recognises that the shape of attitude and social interaction will vary across cultures due to forces of cultural evolution and adaptation to specific ecologies. Support for this assumption comes from work by Brower (1980) and Scheflen (1971), which has indicated that different cultural or ethnic groups utilised different systems of attitudes and behaviours to maintain control. This article focuses on the effects of residents' socio-economic characteristics on TA, TB and PH in the neighbourhood.
HYPOTHESES DEVELOPMENT
Residents' perceptions of the surrounding environment and the effectiveness of capable guardians have been reported to vary amongst cultures and the neighbourhood contexts. However, the defensible space concept and crime prevention strategies have seldom been tested in a non-Western culture such as Malaysia. Examining these concepts in a multi-ethnic society could provide a deeper understanding of the impact of a neighbourhood's social factors and the physical environment in perceived homogeneity in different contexts. Therefore, the primary purpose of the present study was to test the validity of territorial functioning dimensions in the context of urban Malaysia, where the underlying assumption is conceptualised based on the defensible space concept and social disorganisation theory. It is useful to validate whether territorial features enhance perceived homogeneity among residents, focusing on high-crime middle-class multi-ethnic residents. This is done by assessing a path analysis using AMOS to test the hypothesised relationships between the variables. Taylor et aI., (1981 b) suggest that territorial functioning is more likely to develop in stable neighbourhoods as opposed to unstable neighbourhoods because of a clearer distinction between insiders and outsiders and because residents are more attached to their home and are thus more willing to manage the local environment. Residents of blocks with higher household income, length of residence and home ownership status have a greater material stake in the property. Because the residents are more territorial and often engaged in crime prevention efforts, they are expected to experience less crime. Other studies have also consistently revealed the link between neighbourhood stability and territorial functioning (Edney, 1972; Greenbaum & Greenbaum, 1981; Macdonald & Gifford, 1989; Rainwater, 1966). A classic issue arising from the use of the territorial functioning construct involves
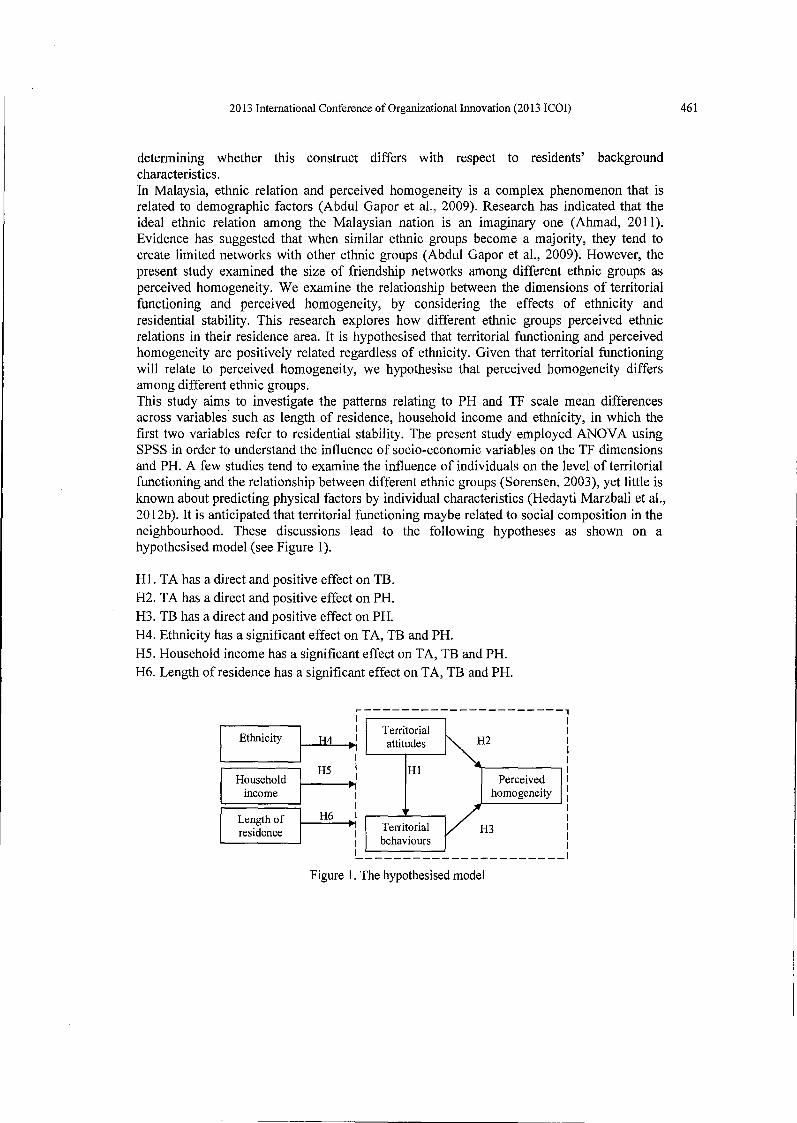
2013 International Conference of Organizational Innovation (2013 ICO!)
determining whether this construct differs with respect to residents' background characteristics. In Malaysia, ethnic relation and perceived homogeneity is a complex phenomenon that is related to demographic factors (Abdul Gapor et aI., 2009). Research has indicated that the ideal ethnic relation among the Malaysian nation is an imaginary one (Ahmad, 2011). Evidence has suggested that when similar ethnic groups become a majority, they tend to create limited networks with other ethnic groups (Abdul Gapor et ai., 2009). However, the present study examined the size of friendship networks among different ethnic groups as perceived homogeneity. We examine the relationship between the dimensions of territorial functioning and perceived homogeneity, by considering the effects of ethnicity and residential stability. This research explores how different ethnic groups perceived ethnic relations in their residence area. It is hypothesised that territorial functioning and perceived homogeneity are positively related regardless of ethnicity. Given that territorial functioning will relate to perceived homogeneity, we hypothesise that perceived homogeneity differs among different ethnic groups. This study aims to investigate the patterns relating to PH and TF scale mean differences across variables such as length of residence, household income and ethnicity, in which the first two variables refer to residential stability. The present study employed ANOV A using SPSS in order to understand the influence of socio-economic variables on the TF dimensions and PH. A few studies tend to examine the influence of individuals on the level of territorial functioning and the relationship between different ethnic groups (Sorensen, 2003), yet little is known about predicting physical factors by individual characteristics (Hedayti Marzbali et ai., 20 l2b). It is anticipated that territorial functioning maybe related to social composition in the neighbourhood. These discussions lead to the following hypotheses as shown on a hypothesised model (see Figure 1).
HI. TA has a direct and positive effect on TB. H2. TA has a direct and positive effect on PH. H3. TB has a direct and positive effect on PH. H4. Ethnicity has a significant effect on TA, TB and PH. H5. Household income has a significant effect on TA, TB and PH. H6. Length of residence has a significant effect on T A, TB and PH.
Ethnicity
Household income
Length of residence
H4
H5
r---------------------, 1 1 1
-I
1 1
Territorial attitudes
HI
Tenitorial behaviours
Perceived homogeneity
~---------------------Figure 1. The hypothesised model
461
462 2013 International Conference of Organizational Innovation (2013 ICO!)
METHODOLOGY
Participants
A sample of218 residents from a high-crime neighbourhood in Subang Jaya, Malaysia took part in the study. Of these respondents, 56% were male and 44% were female and the mean age was 42 years. The majority of the respondents surveyed were Chinese (50%), followed by Malay (40%) and Indian (10%). The survey revealed that a large proportion of the respondents (86%) have lived in their property for at least 3 years, suggesting a modestly stable neighbourhood. The majority of participants in the study area were homeowners (93%), and 7% were tenants. The unit of analysis is the neighbourhood resident and samples were selected using a systematic sampling method. The study focused on middle-income residents residing in terraced houses as these are the predominant type of dwelling in the neighbourhood.
Measures
The study was quantitative in nature and involved two parts. The first part involved an on-site observation of residents' front gardens to identify and evaluate residents' territorial behaviour. These actions were classified into four categories based on measures adapted from the work of previous studies (Brown & Altman, 1983; Hedayati Marzbali et ai., 2012a, 2012c; Pollack & Patterson, 1980). The first three categories, comprising gardening work (TB 1), exterior house maintenance (TB2), and physical barriers (TB3), were measured on a fivepoint Likert scale. Markers (TB4), as the last category, were based on the total number of items present (such as personalised decoration, security grills, garden furniture etc). The second part of the study involved asking residents to answer a self-administered questionnaire. Participants provided their demographic information and responded to ten statements regarding territorial attitudes (Edney, 1972; McCrea et ai., 2005; Patterson, 1978; Taylor et al., 1981 a, 1984) as well as four statements regarding perceived homogeneity among different ethnic groups of residents that had been adapted and modified from previous studies (BeUair & Browning, 2010; Sampson & Groves, 1989; Taylor et aI., 1984). Territorial attitude included the following items: (1) I spend time talking with neighbours within the house compound; (2) I keep an eye on what occurs in front of my house daily; (3) I can tell if a person standing in front of my house lives in the neighbourhood; (4) I know the names of most of my neighbours; (5) I feel responsible for watching over my neighbours' house when they are on vacation; (6) I feel comfortable living among my neighbours; (7) I feel that I belong in this neighbourhood; (8) It is easy for me to borrow tools from neighbours; (9) I maintain my garden so that other people know it is my territory; and (10) It is easy to keep strangers out of my garden if I don't want them there. Perceived homogeneity included the following items: (1) There is high cooperation among various races in this community; (2) I mingle with individuals from other races in this neighbourhood; (3) I have a close relationship with other races in this neighbourhood; and (4) I take part in social events organised by other races. The scores were based on a four-point Likert scale (1 =strongly disagree, 4=strongly agree). To establish content validity, three renowned scholars with relevant expertise were asked to review the survey instruments, examine the effectiveness of the selected items in measuring the underlying variables and evaluate the overall content of the survey instruments. Prior to completing the questionnaire, all participants were briefed on the purpose of the study. The first phase of the analysis established the number of factors underlying the TF construct and perceived homogeneity. This phase was followed by a path analysis to examine the
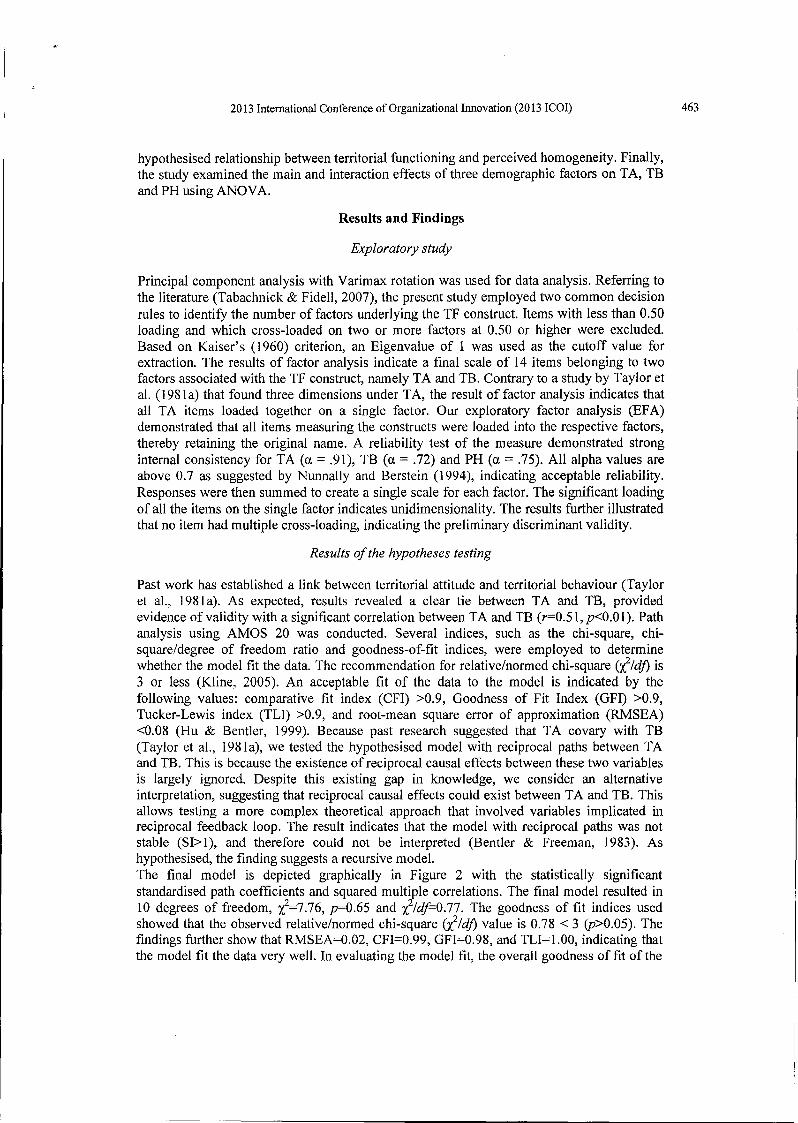
2013 International Conference of Organizational Innovation (2013 ICO!)
hypothesised relationship between territorial functioning and perceived homogeneity. Finally, the study examined the main and interaction effects of three demographic factors on T A, TB and PH using ANOV A.
Results and Findings
Exploratory study
Principal component analysis with Varimax rotation was used for data analysis. Referring to the literature (Tabachnick & Fidell, 2007), the present study employed two common decision rules to identify the number of factors underlying the TF construct. Items with less than O.SO loading and which cross-loaded on two or more factors at O.SO or higher were excluded. Based on Kaiser's (1960) criterion, an Eigenvalue of 1 was used as the cutoff value for extraction. The results of factor analysis indicate a final scale of 14 items belonging to two factors associated with the TF construct, namely T A and TB. Contrary to a study by Taylor et al. (1981 a) that found three dimensions under T A, the result of factor analysis indicates that all T A items loaded together on a single factor. Our exploratory factor analysis (EF A) demonstrated that all items measuring the constructs were loaded into the respective factors, thereby retaining the original name. A reliability test of the measure demonstrated strong internal consistency for TA (a = .91), TB (a = .72) and PH (a = .7S). All alpha values are above 0.7 as suggested by Nunnally and Berstein (1994), indicating acceptable reliability. Responses were then summed to create a single scale for each factor. The significant loading of all the items on the single factor indicates unidimensionality. The results further illustrated that no item had multiple cross-loading, indicating the preliminary discriminant validity.
Results of the hypotheses testing
Past work has established a link between territorial attitude and territorial behaviour (Taylor et ai., 1981 a). As expected, results revealed a clear tie between TA and TB, provided evidence of validity with a significant correlation between TA and TB (r=0.51, p<O.OI). Path analysis using AMOS 20 was conducted. Several indices, such as the chi-square, chisquare/degree of freedom ratio and goodness-of-fit indices, were employed to determine whether the model fit the data. The recommendation for relative/normed chi-square (t/d/) is 3 or less (Kline, 200S). An acceptable fit of the data to the model is indicated by the following values: comparative fit index (CFI) >0.9, Goodness of Fit Index (GFI) >0.9, Tucker-Lewis index (TLI) >0.9, and root-mean square error of approximation (RMSEA) <0.08 (Hu & Bentler, 1999). Because past research suggested that TA covary with TB (Taylor et ai., 1981 a), we tested the hypothesised model with reciprocal paths between TA and TB. This is because the existence of reciprocal causal effects between these two variables is largely ignored. Despite this existing gap in knowledge, we consider an alternative interpretation, suggesting that reciprocal causal effects could exist between TA and TB. This allows testing a more complex theoretical approach that involved variables implicated in reciprocal feedback loop. The result indicates that the model with reciprocal paths was not stable (SI> I), and therefore could not be interpreted (Bentler & Freeman, 1983). As hypothesised, the finding suggests a recursive model. The final model is depicted graphically in Figure 2 with the statistically significant standardised path coefficients and squared multiple correlations. The final model resulted in 10 degrees of freedom, X2=7.76, p=0.6S and X2/df=0.77. The goodness of fit indices used showed that the observed relative/normed chi-square CX2/d/) value is 0.78 < 3 (p>O.OS). The findings further show that RMSEA=0.02, CFI=0.99, GFI=0.98, and TLI=l.OO, indicating that the model fit the data very well. In evaluating the model fit, the overall goodness of fit of the
463
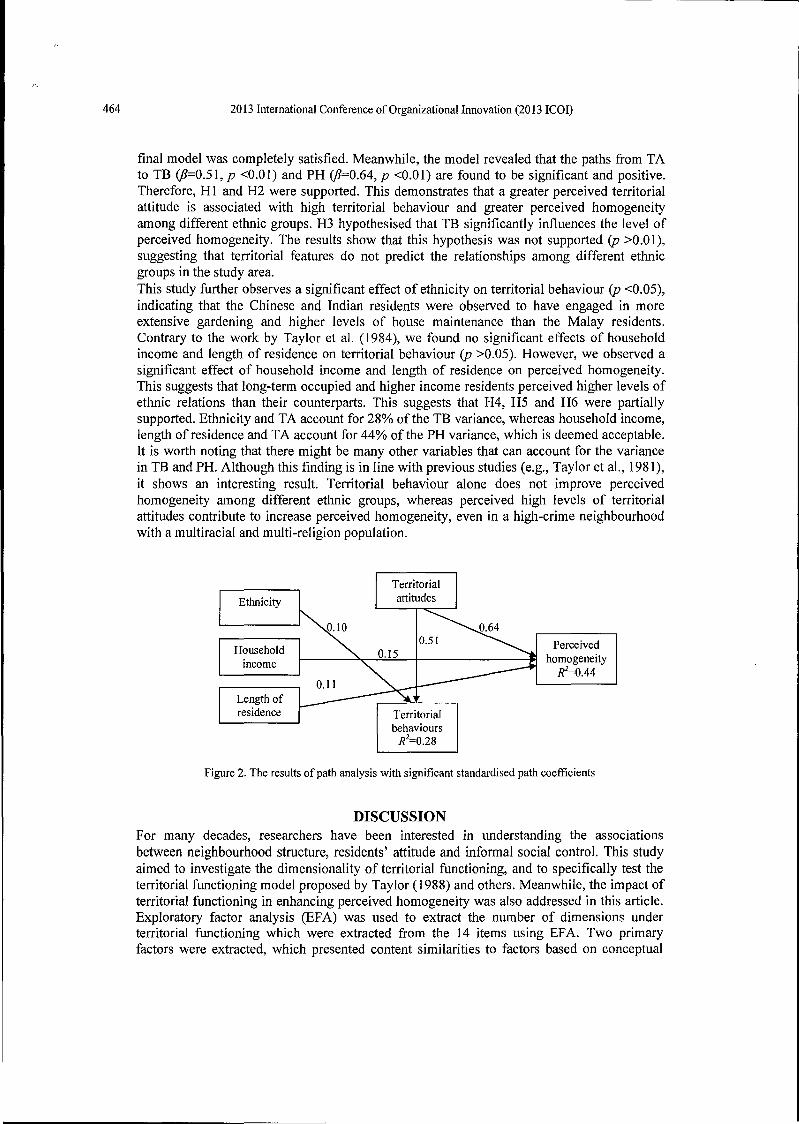
464 2013 International Conference of Organizational Innovation (2013 ICOI)
final model was completely satisfied. Meanwhile, the model revealed that the paths from T A to TB (jJ=0.51, P <0.01) and PH (jJ=0.64, P <0.01) are found to be significant and positive. Therefore, H I and H2 were supported. This demonstrates that a greater perceived territorial attitude is associated with high territorial behaviour and greater perceived homogeneity among different ethnic groups. H3 hypothesised that TB significantly influences the level of perceived homogeneity. The results show that this hypothesis was not supported (p >0.01), suggesting that territorial features do not predict the relationships among different ethnic groups in the study area. This study further observes a significant effect of ethnicity on territorial behaviour (p <0.05), indicating that the Chinese and Indian residents were observed to have engaged in more extensive gardening and higher levels of house maintenance than the Malay residents. Contrary to the work by Taylor et ai. (1984), we found no significant effects of household income and length of residence on territorial behaviour (p >0.05). However, we observed a significant effect of household income and length of residence on perceived homogeneity. This suggests that long-term occupied and higher income residents perceived higher levels of ethnic relations than their counterparts. This suggests that H4, H5 and H6 were partially supported. Ethnicity and TA account for 28% of the TB variance, whereas household income, length of residence and TA account for 44% of the PH variance, which is deemed acceptable. It is worth noting that there might be many other variables that can account for the variance in TB and PH. Although this finding is in line with previous studies (e.g., Taylor et aI., 1981), it shows an interesting result. Territorial behaviour alone does not improve perceived homogeneity among different ethnic groups, whereas perceived high levels of territorial attitudes contribute to increase perceived homogeneity, even in a high-crime neighbourhood with a multiracial and multi-religion population.
Ethnicity
Household income
Length of residence
Territorial attitudes
behaviours R2=0.28
Perceived homogeneity
R2=0.44
Figure 2. The results of path analysis with significant standardised path coefficients
DISCUSSION For many decades, researchers have been interested in understanding the associations between neighbourhood structure, residents' attitude and informal social control. This study aimed to investigate the dimensionality of territorial functioning, and to specifically test the territorial functioning model proposed by Taylor (1988) and others. Meanwhile, the impact of territorial functioning in enhancing perceived homogeneity was also addressed in this article. Exploratory factor analysis (EF A) was used to extract the number of dimensions under territorial functioning which were extracted from the 14 items using EF A. Two primary factors were extracted, which presented content similarities to factors based on conceptual
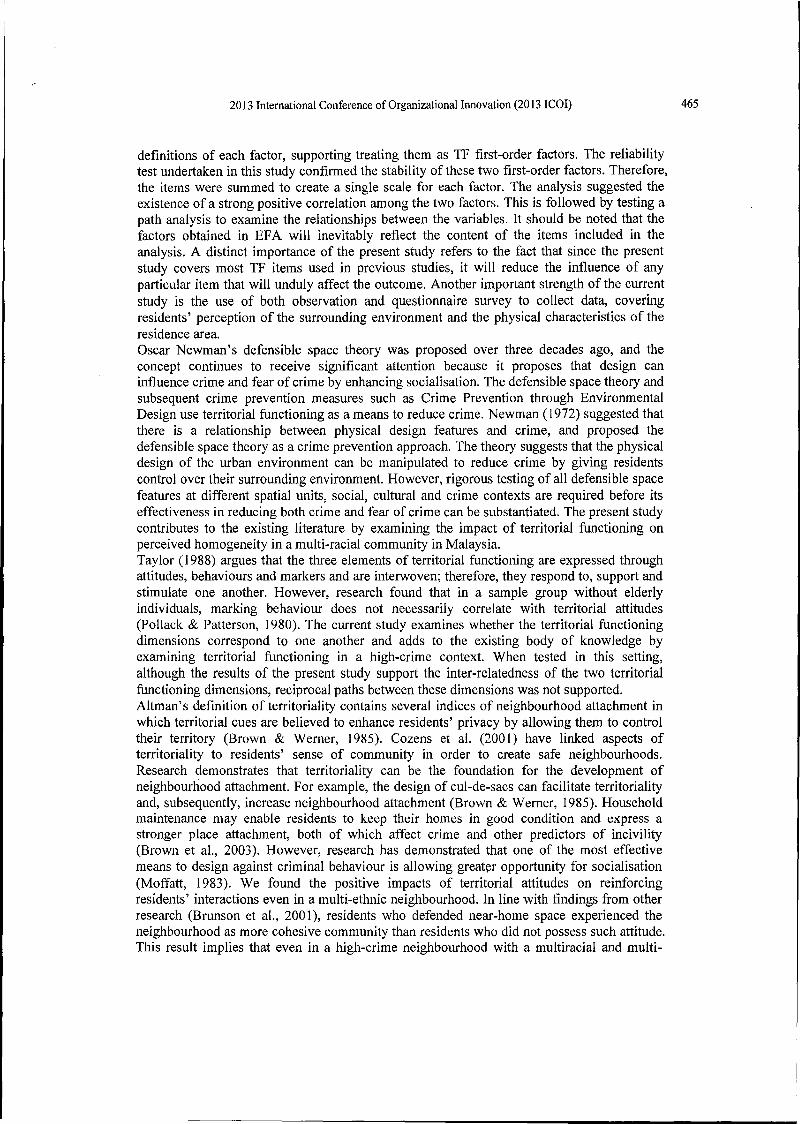
2013 International Conference of Organizational Innovation (2013 I COl)
definitions of each factor, supporting treating them as TF first-order factors. The reliability test undertaken in this study confirmed the stability of these two first-order factors. Therefore, the items were summed to create a single scale for each factor. The analysis suggested the existence of a strong positive correlation among the two factors. This is followed by testing a path analysis to examine the relationships between the variables. It should be noted that the factors obtained in EF A will inevitably reflect the content of the items included in the analysis. A distinct importance of the present study refers to the fact that since the present study covers most TF items used in previous studies, it will reduce the influence of any particular item that will unduly affect the outcome. Another important strength of the current study is the use of both observation and questionnaire survey to collect data, covering residents' perception of the surrounding environment and the physical characteristics of the residence area. Oscar Newman's defensible space theory was proposed over three decades ago, and the concept continues to receive significant attention because it proposes that design can influence crime and fear of crime by enhancing socialisation. The defensible space theory and subsequent crime prevention measures such as Crime Prevention through Environmental Design use territorial functioning as a means to reduce crime. Newman (1972) suggested that there is a relationship between physical design features and crime, and proposed the defensible space theory as a crime prevention approach. The theory suggests that the physical design of the urban environment can be manipulated to reduce crime by giving residents control over their surrounding environment. However, rigorous testing of all defensible space features at different spatial units, social, cultural and crime contexts are required before its effectiveness in reducing both crime and fear of crime can be substantiated. The present study contributes to the existing literature by examining the impact of territorial functioning on perceived homogeneity in a multi-racial community in Malaysia. Taylor (1988) argues that the three elements of territorial functioning are expressed through attitudes, behaviours and markers and are interwoven; therefore, they respond to, support and stimulate one another. However, research found that in a sample group without elderly individuals, marking behaviour does not necessarily correlate with territorial attitudes (Pollack & Patterson, 1980). The current study examines whether the territorial functioning dimensions correspond to one another and adds to the existing body of knowledge by examining territorial functioning in a high-crime context. When tested in this setting, although the results of the present study support the inter-relatedness of the two territorial functioning dimensions, reciprocal paths between these dimensions was not supported. Altman's definition of territoriality contains several indices of neighbourhood attachment in which territorial cues are believed to enhance residents' privacy by allowing them to control their territory (Brown & Werner, 1985). Cozens et al. (2001) have linked aspects of territoriality to residents' sense of community in order to create safe neighbourhoods. Research demonstrates that territoriality can be the foundation for the development of neighbourhood attachment. For example, the design of cul-de-sacs can facilitate territoriality and, subsequently, increase neighbourhood attachment (Brown & Werner, 1985). Household maintenance may enable residents to keep their homes in good condition and express a stronger place attachment, both of which affect crime and other predictors of incivility (Brown et aI., 2003). However, research has demonstrated that one of the most effective means to design against criminal behaviour is allowing great~r opportunity for socialisation (Moffatt, 1983). We found the positive impacts of territorial attitudes on reinforcing residents' interactions even in a multi-ethnic neighbourhood. In line with findings from other research (Brunson et aI., 2001), residents who defended near-home space experienced the neighbourhood as more cohesive community than residents who did not possess such attitude. This result implies that even in a high-crime neighbourhood with a multiracial and multi-
465
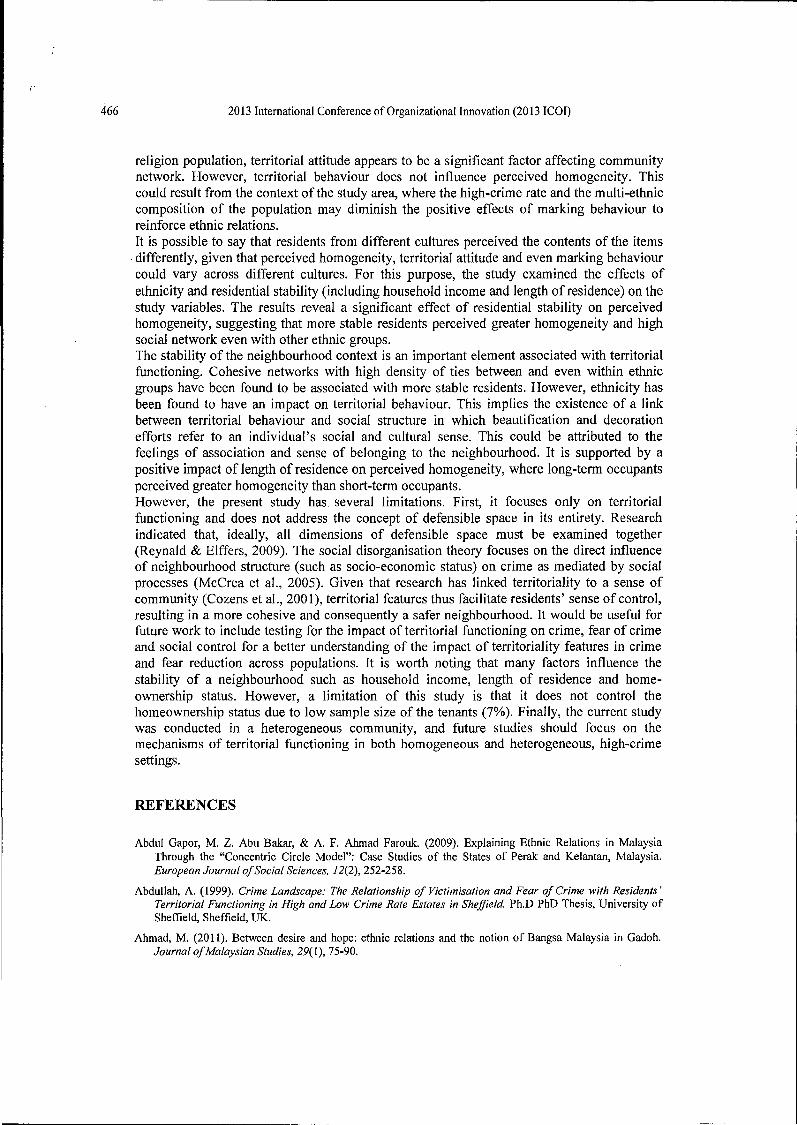
466 2013 International Conference of Organizational Innovation (2013 ICO!)
religion population, territorial attitude appears to be a significant factor affecting community network. However, territorial behaviour does not influence perceived homogeneity. This could result from the context ofthe study area, where the high-crime rate and the multi-ethnic composition of the population may diminish the positive effects of marking behaviour to reinforce ethnic relations. It is possible to say that residents from different cultures perceived the contents of the items differently, given that perceived homogeneity, territorial attitude and even marking behaviour could vary across different cultures. For this purpose, the study examined the effects of ethnicity and residential stability (including household income and length of residence) on the study variables. The results reveal a significant effect of residential stability on perceived homogeneity, suggesting that more stable residents perceived greater homogeneity and high social network even with other ethnic groups. The stability of the neighbourhood context is an important element associated with territorial functioning. Cohesive networks with high density of ties between and even within ethnic groups have been found to be associated with more stable residents. However, ethnicity has been found to have an impact on territorial behaviour. This implies the existence of a link between territorial behaviour and social structure in which beautification and decoration efforts refer to an individual's social and cultural sense. This could be attributed to the feelings of association and sense of belonging to the neighbourhood. It is supported by a positive impact of length of residence on perceived homogeneity, where long-term occupants perceived greater homogeneity than short-term occupants. However, the present study has several limitations. First, it focuses only on territorial functioning and does not address the concept of defensible space in its entirety. Research indicated that, ideally, all dimensions of defensible space must be examined together (Reynald & Elffers, 2009). The social disorganisation theory focuses on the direct influence of neighbourhood structure (such as socio-economic status) on crime as mediated by social processes (McCrea et aI., 2005). Given that research has linked territoriality to a sense of community (Cozens et aI., 200 I), territorial features thus facilitate residents' sense of control, resulting in a more cohesive and consequently a safer neighbourhood. It would be useful for future work to include testing for the impact of territorial functioning on crime, fear of crime and social control for a better understanding of the impact of territoriality features in crime and fear reduction across populations. It is worth noting that many factors influence the stability of a neighbourhood such as household income, length of residence and homeownership status. However, a limitation of this study is that it does not control the homeownership status due to low sample size of the tenants (7%). Finally, the current study was conducted in a heterogeneous community, and future studies should focus on the mechanisms of territorial functioning in both homogeneous and heterogeneous, high-crime settings.
REFERENCES
Abdul Gapor, M. Z. Abu Bakar, & A. F. Ahmad Farouk. (2009). Explaining Ethnic Relations in Malaysia Through the "Concentric Circle Model": Case Studies of the States of Perak and Kelantan, Malaysia. European Journal of Social Sciences, 12(2),252-258.
Abdullah, A. (1999). Crime Landscape: The Relationship of Victimisation and Fear of Crime with Residents' Territorial Functioning in High and Low Crime Rate Estates in Sheffield. Ph.D PhD Thesis, University of Sheffield, Sheffield, UK.
Ahmad, M. (2011). Between desire and hope: ethnic relations and the notion of Bangsa Malaysia in Gadoh. Journal of Malaysian Studies, 29(1), 75-90.
2013 International Conference of Organizational Innovation (2013 ICO!)
Bakker, C. B., & Bakker-Rabdau, M. K. (1973). No trespassing!: Explorations in human territoriality: Chandler & Sharp Publishers San Francisco.
Bellair, P. E., & Browning, C. R. (2010). Contemporary disorganization research: An assessment and further test of the systemic model of neighborhood crime. Journal of Research in Crime and Delinquency, 47(4), 496-521.
Bentler, P. M., & Freeman, E. H. (1983). Tests for stability in linear structural equation systems. Psychometrika, 48(1), 143-145.
Brower, S. N. (1980). Territory in urban settings. In 1. Altman, A Rapoport & J. F. Wohlwill (Eds.), Culture and Environment. Human Behavior and Environment (Vol. 4, pp. 179-207). New York: Plenum.
Brown, B. B., & Altman, I. (1983). Territoriality, defensible space and residential burglary: An environmental analysis. Journal of Environmental Psychology, 3(3), 203-220.
Brown, B. B., & Werner, C. M. (1985). Social cohesiveness, territoriality, and holiday decorations: The influence of cul-de-sacs. Environment and Behavior, 17(5), 539-565.
Brown, B., Perkins, D. D., & Brown, G. (2003). Place attachment in a revitalizing neighborhood: Individual and block levels of analysis. Journal of Environmental Psychology, 23(3), 259-271.
Brunson, L., Kuo, F. E., & Sullivan, W. C. (2001). Resident Appropriation of Defensible Space in Public Housing: Implications for Safety and Community. Environment and Behavior, 33(5), 626-652.
Comstock, N., Dickinson, L. M., Marshall, J. A., Soobader, M. J., Turbin, M. S., Buchenau, M., & Litt, 1. S. (2010). Neighborhood attachment and its correlates: Exploring neighborhood conditions, collective efficacy and gardening. Journal of Environmental Psychology, 30(4),435-442.
Cozens, P., Hillier, D., & Prescott, G. (2001). Crime and the design of residential property- exploring the theoretical background- Part 1. Property Management, 19(2), 136-164.
De Jesus, M., Puleo, E., Shelton, R. C., & Emmons, K. M. (2010). Associations between perceived social environment and neighborhood safety: Health implications. Health and Place, 16(5), 1007-1013.
Edney, J. 1. (1972). Property, Possession and Permanence: A Field Study in Human Territoriality. Journal of Applied Social Psychology, 2(3), 275-282.
Edney, J. J. (1974). Human territoriality. Psychological Bulletin, 81(12),959-975.
Foster, S., Giles-Corti, B., & Knuiman, M. (2010). Neighbourhood design and fear of crime: A socio-ecological examination of the correlates of residents' fear in new suburban housing developments. Health and Place, 16(6),1156-1165.
Foster, S., Giles-Corti, B., & Knuiman, M. (2011). Creating safe walkable streetscapes: Does house design and upkeep discourage incivilities in suburban neighbourhoods? Journal of Environmental Psychology, 31(1), 79-88.
Greenbaum, P. E., & Greenbaum, S. D. (1981). Territorial personalization: Group identity and social interaction in a Slavic-American neighborhood. Environment and Behavior, 13(5),574-589.
Hedayati Marzbali, M., Abdullah, A, Razak, N. A, & Maghsoodi Tilaki, M. J. (2012a). The Influence of Crime Prevention Through Environmental Design on Victimisation and Fear of Crime. Journal of Environmental Psychology, 32(2), 79-88.
Hedayati, M., Abdullah, A, Razak, N. A, & Maghsoodi, M. J. (2012c). Validating Crime Prevention Through Environmental Design Construct Through Checklist Using Structural Equation Modelling. International Journal of Law, Crime and Justice, 40(1), 82-99.
Hedayati, M., Abdullah, A, Razak, N. A, & Maghsoodi, M. 1. (2012b). The relationship between socioeconomic characteristics, victimization and CPTED principles: evidence from the MIMIC model. Crime, Law and Social Change, 58(3),351-371.
Hu, L., & Bentler, P. M. (1999). Cutoff criteria for fit indexes in covariance structure analysis: Conventional criteria versus new alternatives. Structural Equation Modeling: A Multidisciplinary Journal, 6(1), 1-55.
Hunter, A, & Baumer, T. L. (1982). Street Traffic, Social Integration, and Fear of Crime. Sociological Inquiry, 52(2),122-131.
467
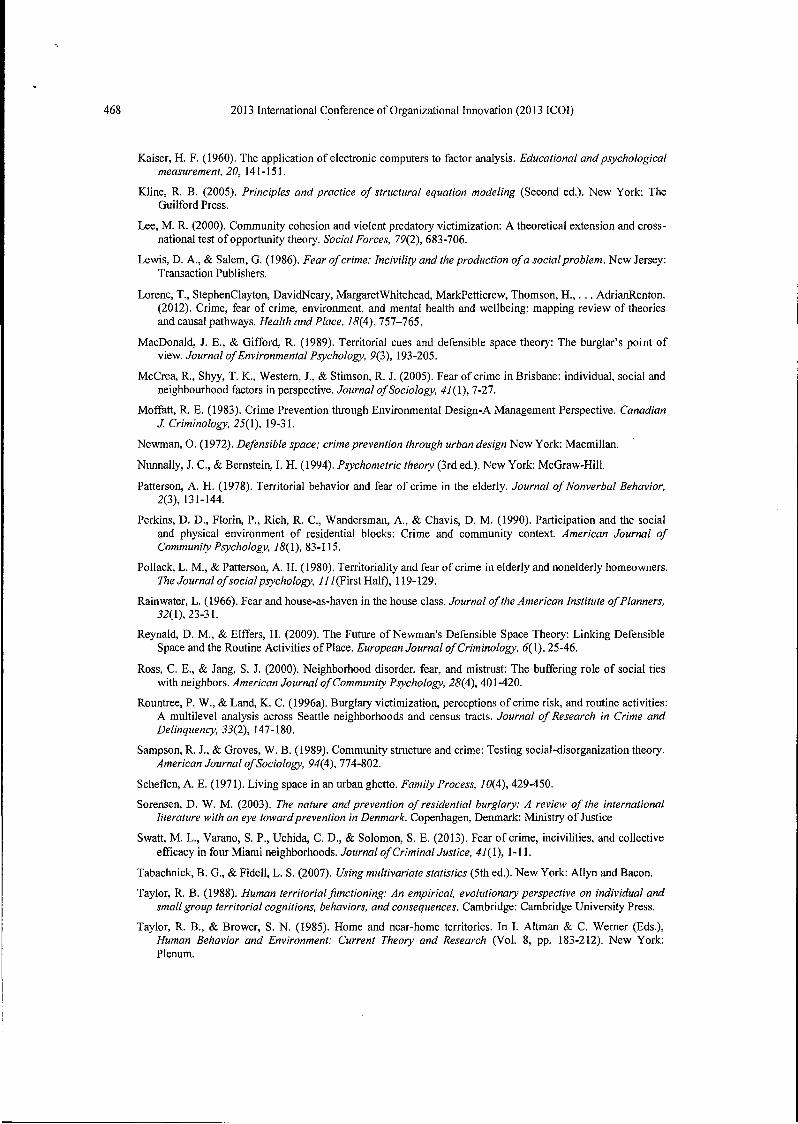
468 2013 International Conference of Organizational Innovation (2013 ICOI)
Kaiser, H. F. (1960). The application of electronic computers to factor analysis. Educational and psychological measurement, 20, 141-151.
Kline, R. B. (2005). Principles and practice of structural equation modeling (Second ed.). New York: The Guilford Press.
Lee, M. R. (2000). Community cohesion and violent predatory victimization: A theoretical extension and crossnational test of opportunity theory. Social Forces, 79(2), 683-706.
Lewis, D. A, & Salem, G. (1986). Fear of crime: Incivility and the production of a social problem. New Jersey: Transaction Publishers.
Lorenc, T., StephenClayton, DavidNeary, MargaretWhitehead, MarkPetticrew, Thomson, H., ... AdrianRenton. (2012). Crime, fear of crime, environment, and mental health and wellbeing: mapping review of theories and causal pathways. Health and Place. 18(4),757-765.
MacDonald, J. E., & Gifford, R. (1989). Territorial cues and defensible space theory: The burglar's point of view. Journal of Environmental Psychology. 9(3),193-205.
McCrea, R., Shyy, T. K., Western, J., & Stimson, R. J. (2005). Fear of crime in Brisbane: individual, social and neighbourhood factors in perspective. Journal of Sociology, 41(1),7-27.
Moffatt, R. E. (1983). Crime Prevention through Environmental Design-A Management Perspective. Canadian J. Criminology. 25(1), 19-31.
Newman, O. (1972). DefenSible space; crime prevention through urban design New York: Macmillan.
Nunnally, J. c., & Bernstein, 1. H. (1994). Psychometric theory (3rd ed.). New York: McGraw-Hill.
Patterson, A. H. (1978). Territorial behavior and fear of crime in the elderly. Journal of Nonverbal Behavior, 2(3),131-144.
Perkins, D. D., Florin, P., Rich, R. C., Wandersman, A, & Chavis, D. M. (1990). Participation and the social and physical environment of residential blocks: Crime and community context. American Journal of Community Psychology. 18(1), 83-115.
Pollack, L. M., & Patterson, A H. (1980). Territoriality and fear of crime in elderly and nonelderly homeowners. The Journal of social psychology. 11 1 (First Half), 119-129.
Rainwater, L. (1966). Fear and house-as-haven in the house class. Journal of the American Institute of Planners, 32(1),23-31.
Reynald, D. M., & Elffers, H. (2009). The Future of Newman's Defensible Space Theory: Linking Defensible Space and the Routine Activities of Place. European Journal of Criminology, 6(1),25-46.
Ross, C. E., & Jang, S. J. (2000). Neighborhood disorder, fear, and mistrust: The buffering role of social ties with neighbors. American Journal of Community Psychology, 28(4),401-420.
Rountree, P. W., & Land, K. C. (l996a). Burglary victimization, perceptions of crime risk, and routine activities: A multilevel analysis across Seattle neighborhoods and census tracts. Journal of Research in Crime and Delinquency, 33(2), 147-180.
Sampson, R. J., & Groves, W. B. (1989). Community structure and crime: Testing social-disorganization theory. American Journal of Sociology. 94(4),774-802.
Scheflen, A E. (1971). Living space in an urban ghetto. Family Process, 10(4),429-450.
Sorensen, D. W. M. (2003). The nature and prevention of residential burglary: A review of the international literature with an eye toward prevention in Denmark. Copenhagen, Denmark: Ministry of Justice
Swatt, M. L., Varano, S. P., Uchida, C. D., & Solomon, S. E. (2013). Fear of crime, inciVilities, and collective efficacy in four Miami neighborhoods. Journal of Criminal Justice, 41(1), I-II.
Tabachnick, B. G., & Fidell, L. S. (2007). Using multivariate statistics (5th ed.). New York: Allyn and Bacon.
Taylor, R. B. (1988). Human territorial functioning: An empirical, evolutionary perspective on individual and small group territorial cognitions. behaviors, and consequences. Cambridge: Cambridge University Press.
Taylor, R. B., & Brower, S. N. (1985). Home and near-home territories. In 1. Altman & C. Werner (Eds.), Human Behavior and Environment: Current Theory and Research (Vol. 8, pp. 183-212). New York: Plenum.
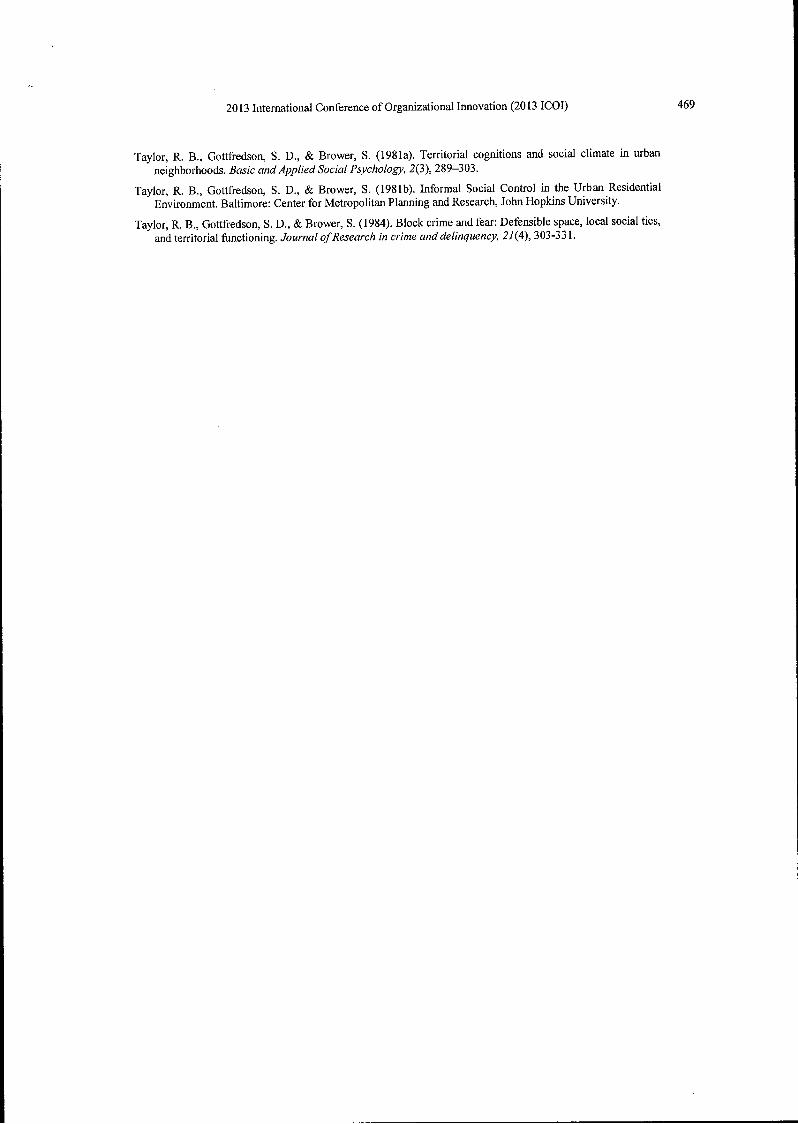
2013 International Conference of Organizational Innovation (2013 I COl)
Taylor, R. B .• Gottfredson, S. D., & Brower, S. (198Ia). Territorial cognitions and social climate in urban neighborhoods. Basic and Applied Social Psychology, 2(3), 289-303.
Taylor, R. B., Gottfredson, S. D., & Brower, S. (198Ib). Informal Social Control in the Urban Residential Environment. Baltimore: Center for Metropolitan Planning and Research, John Hopkins University.
Taylor, R. B., Gottfredson, S. D., & Brower, S. (1984). Block crime and fear: Defensible space, local social ties, and territorial functioning. Journal of Research in crime and delinquency, 21 (4), 303-331.
469
Review of European Studies; Vol. 5, No.5; 2013 ISSN 1918-7173 E-ISSN 1918-7181
Published by Canadian Center of Science and Education
A Cross-Cultural Validation of the Territorial Functioning Construct in Residential Neighbourhoods: A Multigroup Invariance Analysis
Aldrin Abdullah 1, Massoomeh Hedayati Marzbali 1, Syarmila Hany Haron 1, Azizi Bahauddin 1 & Mohammad Javad Maghsoodi Tilaki1
I School of Housing, Building & Planning, Universiti Sains Malaysia, Penang, Malaysia
Correspondence: Aldrin Abdullah, School of Housing, Building & Planning, Universiti Sains Malaysia, 11800 Penang, Malaysia. Tel: 60-124-104-715. E-mail: [email protected]
Received: September 12, 2013
doi: 10.5539/res.v5n5p30
Abstract
Accepted: October 11,2013 Online Published: October 11, 2013
URL: http://dx.doi.org/l 0.5539/res.v5n5p30
One popular use of design strategies for crime prevention is territorial functioning (TF). While the TF scale has been widely utilised in crime studies, there is a lack of empirical evidence to support the equivalence of the scale across diverse contexts. A sample of 416 inhabitants from Britain and Malaysia took part in the study. We examined the factor structure validity and invariance of the TF scale instrument within the two nations based on a multigroup analysis of invariance. The results indicated that confirmatory factor analytic models of the constructs exhibited an adequate fit according to multiple criteria within each sample and across samples. The results further indicated full support of configural invariance and partial support of metric and scalar invariance. Multigroup latent mean analysis revealed significant group mean differences in territorial attitude, indicating that Malaysian residents perceived a significantly higher territorial attitude than British residents.
Keywords: territorial attitude, marking behaviour, multigroup, invariance, cross-cultural
1. Introduction
There is substantial empirical evidence that links territorial functioning (TF) with low crime rates. Based on Newman's (1972) defensible space theory, TF is a crime prevention strategy focusing on the manipulation ofthe physical design to reduce crime by giving residents control over their surrounding environment. It is defined as a set of attitudes and behaviours of how people manage, occupy and use the space they own. Based on defensible space features and territorial signs, it is assumed that physical elements in the environment act as cues in a person's understanding of who belongs in a space and who does not (Brower, Dockett, & Taylor, 1983). Territoriality is the central concept of defensible space that gives residents control of their environment. The term defensible space was used by Oscar Newman (1972) to refer to the impact of physical elements on people's behaviour and to define private and semi-private spaces that make it possible for residents to protect owned areas against unwanted intrusion.
Taylor (1988) argues that TF comprises the interwoven expression of attitudes, behaviours and markers that support and stimulate one another. Research has indicated that the sociocultural context variables affect the level ofTF (Taylor, Gottfredson, & Brower, 1984). However, Pollack and Patterson (1980) found evidence indicating that these elements do not necessarily correlated with one another. Examining the literature provides a foundation for the present study. This conflict between territorial functioning elements indicates a need to investigate whether these elements correlated with one another. Taylor (1988) further suggested that TF is highly place-specific and should be regarded as a system that adapts to the social and physical contingencies of a particular locale. This perspective also recognises the varying shape ofTF across cultures due to cultural evolution and adaptation to specific ecologies. Support for this assumption comes from work by Brower (1980) and Scheflen (1971), which has indicated that different cultural or ethnic groups utilised distinct territorial attitudes and behaviours to maintain control. Among this line of investigations, Taylor (1988, p. 356) also suggests that territorial functioning exists along a centrality continuum and defines it as " ... an interlocked system of sentiments, cognitions, and behaviours that are highly place specific, socially and culturally determined and maintaining ... ".
Two popular scales for measuring TF are attitudes and marking behaviours (Brower et aI., 1983). To study TF in a neighbourhood involves statements such as "I know my neighbour's name" or "I feel comfortable living in my neighbourhood". Such fundamental statements are measured because the responses reflect residents' sense of
30
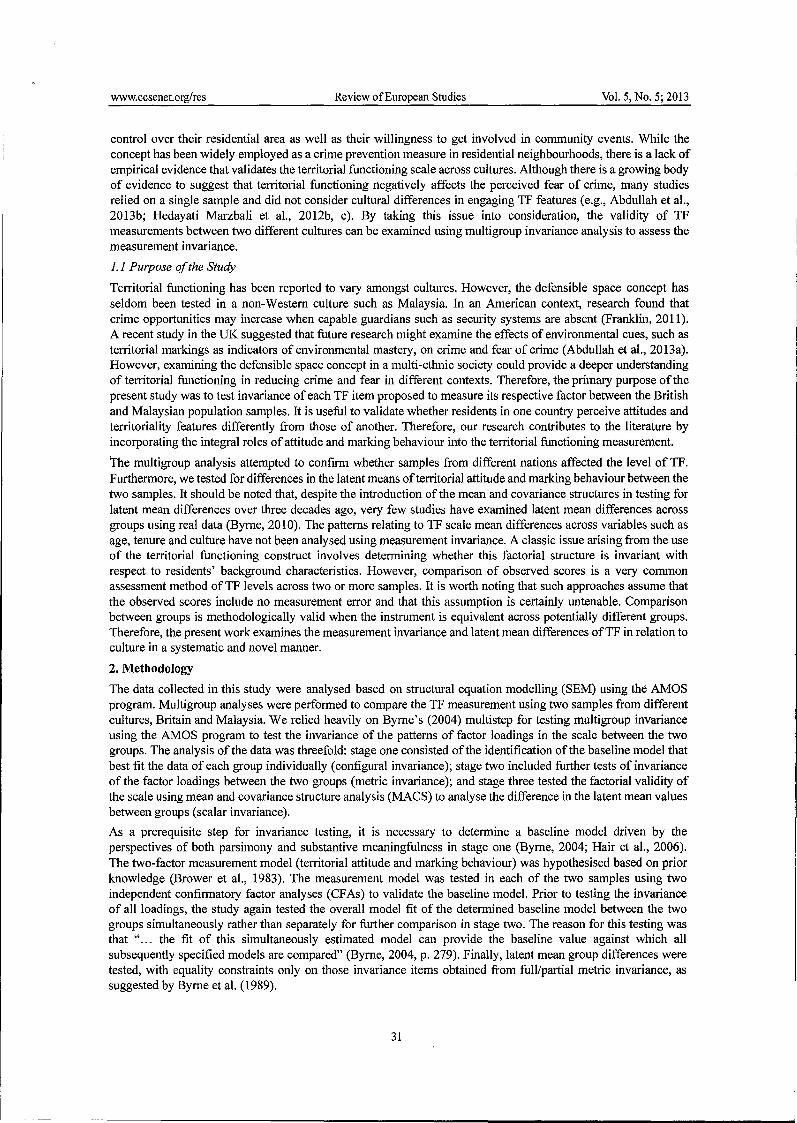
www.ccsenet.org/res Review of European Studies Vol. 5, No.5; 2013
control over their residential area as well as their willingness to get involved in community events. While the concept has been widely employed as a crime prevention measure in residential neighbourhoods, there is a lack of empirical evidence that validates the territorial functioning scale across cultures. Although there is a growing body of evidence to suggest that territorial functioning negatively affects the perceived fear of crime, many studies relied on a single sample and did not consider cultural differences in engaging TF features (e.g., Abdullah et aI., 2013b; Hedayati Marzbali et ai., 2012b, c). By taking this issue into consideration, the validity of TF measurements between two different cultures can be examined using multi group invariance analysis to assess the measurement invariance.
1.1 Purpose of the Study
Territorial functioning has been reported to vary amongst cultures. However, the defensible space concept has seldom been tested in a non-Western culture such as Malaysia. In an American context, research found that crime opportunities may increase when capable guardians such as security systems are absent (Franklin, 2011). A recent study in the UK suggested that future research might examine the effects of environmental cues, such as territorial markings as indicators of environmental mastery, on crime and fear of crime (Abdullah et aI., 2013a). However, examining the defensible space concept in a multi-ethnic society could provide a deeper understanding of territorial functioning in reducing crime and fear in different contexts. Therefore, the primary purpose of the present study was to test invariance of each TF item proposed to measure its respective factor between the British and Malaysian population samples. It is useful to validate whether residents in one country perceive attitudes and territoriality features differently from those of another. Therefore, our research contributes to the literature by incorporating the integral roles of attitude and marking behaviour into the territorial functioning measurement.
'The multigroup analysis attempted to confIrm whether samples from different nations affected the level of TF. Furthermore, we tested for differences in the latent means of territorial attitude and marking behaviour between the two samples. It should be noted that, despite the introduction of the mean and covariance structures in testing for latent mean differences over three decades ago, very few studies have examined latent mean differences across groups using real data (Byrne, 2010). The patterns relating to TF scale mean differences across variables such as age, tenure and culture have not been analysed using measurement invariance. A classic issue arising from the use of the territorial functioning construct involves determining whether this factorial structure is invariant with respect to residents' background characteristics. However, comparison of observed scores is a very common assessment method ofTF levels across two or more samples. It is worth noting that such approaches assume that the observed scores include no measurement error and that this assumption is certainly untenable. Comparison between groups is methodologically valid when the instrument is equivalent across potentially different groups. Therefore, the present work examines the measurement invariance and latent mean differences ofTF in relation to culture in a systematic and novel manner.
2. Methodology
The data collected in this study were analysed based on structural equation modelling (SEM) using the AMOS program. Multigroup analyses were performed to compare the TF measurement using two samples from different cultures, Britain and Malaysia. We relied heavily on Byrne's (2004) multistep for testing multigroup invariance using the AMOS program to test the invariance of the patterns of factor loadings in the scale between the two groups. The analysis of the data was threefold: stage one consisted of the identifIcation of the baseline model that best fIt the data of each group individually (confIgural invariance); stage two included further tests of invariance of the factor loadings between the two groups (metric invariance); and stage three tested the factorial validity of the scale using mean and covariance structure analysis (MACS) to analyse the difference in the latent mean values between groups (scalar invariance).
As a prerequisite step for invariance testing, it is necessary to determine a baseline model driven by the perspectives of both parsimony and substantive meaningfulness in stage one (Byrne, 2004; Hair et aI., 2006). The two-factor measurement model (territorial attitude and marking behaviour) was hypothesised based on prior knowledge (Brower et aI., 1983). The measurement model was tested in each of the two samples using two independent confIrmatory factor analyses (CFAs) to validate the baseline model. Prior to testing the invariance of all loadings, the study again tested the overall model fIt of the determined baseline model between the two groups simultaneously rather than separately for further comparison in stage two. The reason for this testing was that "... the fIt of this simultaneously estimated model can provide the baseline value against which all subsequently specifIed models are compared" (Byrne, 2004, p. 279). Finally, latent mean group differences were tested, with equality constraints only on those invariance items obtained from full/partial metric invariance, as suggested by Byrne et al. (1989).
31
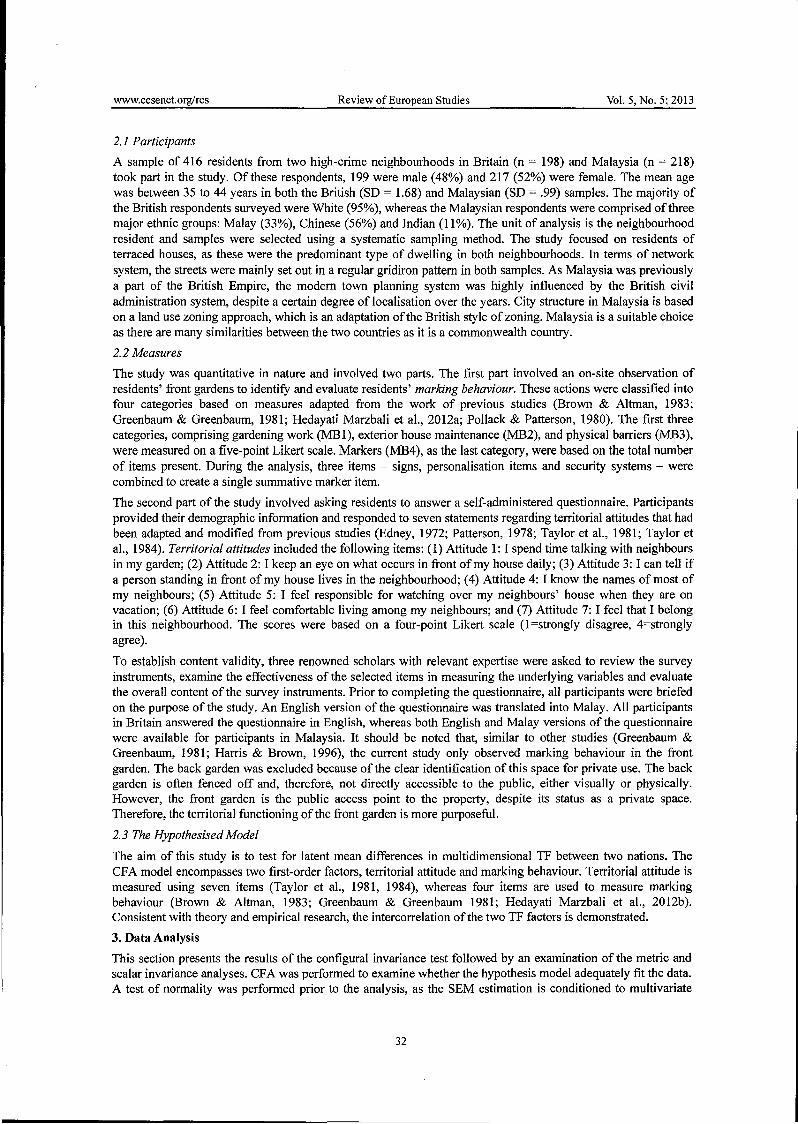
www.ccsenet.org/res Review of European Studies Vol. 5, No.5; 2013
2.1 Participants
A sample of 416 residents from two high-crime neighbourhoods in Britain (n = 198) and Malaysia (n = 218) took part in the study. Of these respondents, 199 were male (48%) and 217 (52%) were female. The mean age was between 35 to 44 years in both the British (SD = 1.68) and Malaysian (SD = .99) samples. The majority of the British respondents surveyed were White (95%), whereas the Malaysian respondents were comprised of three major ethnic groups: Malay (33%), Chinese (56%) and Indian (11 %). The unit of analysis is the neighbourhood resident and samples were selected using a systematic sampling method. The study focused on residents of terraced houses, as these were the predominant type of dwelling in both neighbourhoods. In terms of network system, the streets were mainly set out in a regular gridiron pattern in both samples. As Malaysia was previously a part of the British Empire, the modem town planning system was highly influenced by the British civil administration system, despite a certain degree of localisation over the years. City structure in Malaysia is based on a land use zoning approach, which is an adaptation ofthe British style of zoning. Malaysia is a suitable choice as there are many similarities between the two countries as it is a commonwealth country.
2.2 Measures
The study was quantitative in nature and involved two parts. The first part involved an on-site observation of residents' front gardens to identify and evaluate residents' marking behaviour. These actions were classified into four categories based on measures adapted from the work of previous studies (Brown & Altman, 1983; Greenbaum & Greenbaum, 1981; Hedayati Marzbali et aI., 2012a; Pollack & Patterson, 1980). The first three categories, comprising gardening work (MB1), exterior house maintenance (MB2), and physical barriers (MB3), were measured on a five-point Likert scale. Markers (MB4), as the last category, were based on the total number of items present. During the analysis, three items - signs, personalisation items and security systems - were combined to create a single summative marker item.
The second part of the study involved asking residents to answer a self-administered questionnaire. Participants provided their demographic information and responded to seven statements regarding territorial attitudes that had been adapted and modified from previous studies (Edney, 1972; Patterson, 1978; Taylor et aI., 1981; Taylor et aI., 1984). Territorial attitudes included the following items: (1) Attitude 1: I spend time talking with neighbours in my garden; (2) Attitude 2: I keep an eye on what occurs in front of my house daily; (3) Attitude 3: I can tell if a person standing in front of my house lives in the neighbourhood; (4) Attitude 4: I know the names of most of my neighbours; (5) Attitude 5: I feel responsible for watching over my neighbours' house when they are on vacation; (6) Attitude 6: I feel comfortable living among my neighbours; and (7) Attitude 7: I feel that I belong in this neighbourhood. The scores were based on a four-point Likert scale (1 =strongly disagree, 4=strongly agree).
To establish content validity, three renowned scholars with relevant expertise were asked to review the survey instruments, examine the effectiveness of the selected items in measuring the underlying variables and evaluate the overall content of the survey instruments. Prior to completing the questionnaire, all participants were briefed on the purpose of the study. An English version of the questionnaire was translated into Malay. All participants in Britain answered the questionnaire in English, whereas both English and Malay versions ofthe questionnaire were available for participants in Malaysia. It should be noted that, similar to other studies (Greenbaum & Greenbaum, 1981; Harris & Brown, 1996), the current study only observed marking behaviour in the front garden. The back garden was excluded because of the clear identification of this space for private use. The back garden is often fenced off and, therefore, not directly accessible to the public, either visually or physically. However, the front garden is the public access point to the property, despite its status as a private space. Therefore, the territorial functioning ofthe front garden is more purposeful.
2.3 The Hypothesised Model
The aim of this study is to test for latent mean differences in multidimensional TF between two nations. The CFA model encompasses two first-order factors, territorial attitude and marking behaviour. Territorial attitude is measured using seven items (Taylor et aI., 1981, 1984), whereas four items are used to measure marking behaviour (Brown & Altman, 1983; Greenbaum & Greenbaum 1981; Hedayati Marzbali et aI., 2012b). Consistent with theory and empirical research, the intercorrelation of the two TF factors is demonstrated.
3. Data Analysis
This section presents the results of the configural invariance test followed by an examination of the metric and scalar invariance analyses. CF A was performed to examine whether the hypothesis model adequately fit the data. A test of normality was performed prior to the analysis, as the SEM estimation is conditioned to multivariate
32
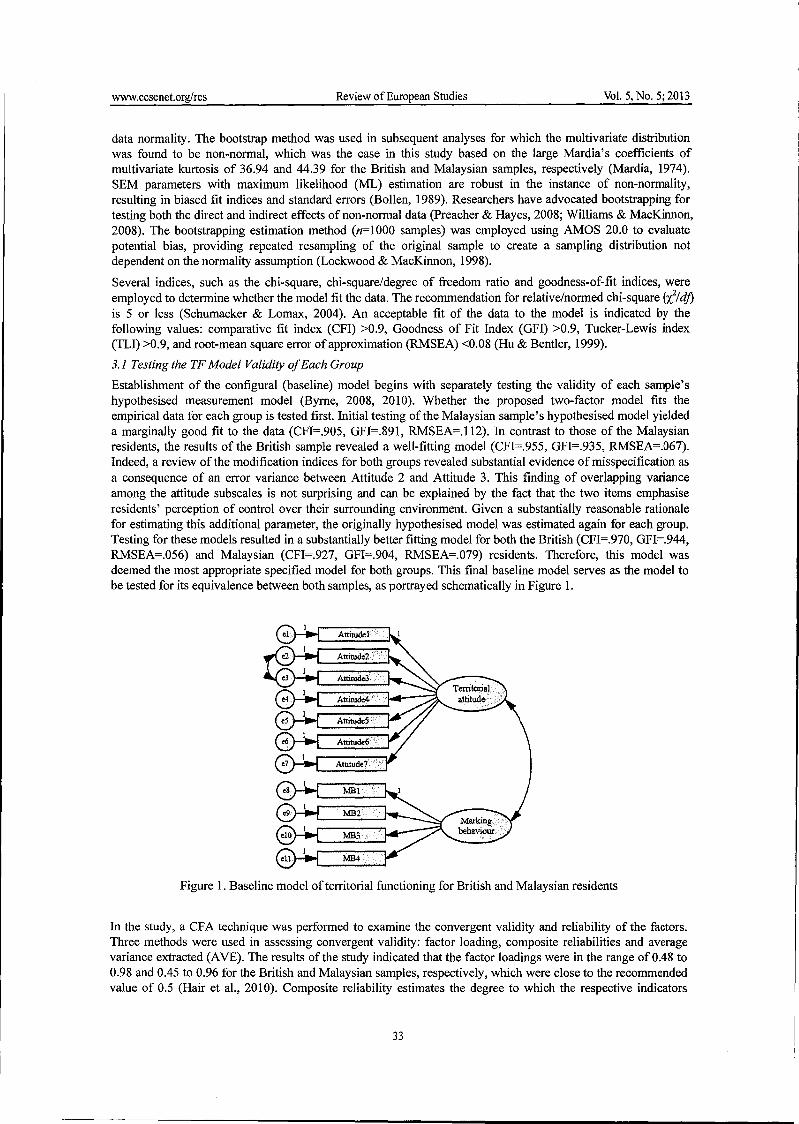
www.ccsenet.org/res Review of European Studies Vol. 5, No.5; 2013
data normality. The bootstrap method was used in subsequent analyses for which the multivariate distribution was found to be non-normal, which was the case in this study based on the large Mardia's coefficients of multivariate kurtosis of 36.94 and 44.39 for the British and Malaysian samples, respectively (Mardia, 1974). SEM parameters with maximum likelihood (ML) estimation are robust in the instance of non-normality, resulting in biased fit indices and standard errors (Bollen, 1989). Researchers have advocated bootstrapping for testing both the direct and indirect effects of non-normal data (Preacher & Hayes, 2008; Williams & MacKinnon, 2008). The bootstrapping estimation method (n=1000 samples) was employed using AMOS 20.0 to evaluate potential bias, providing repeated resampling of the original sample to create a sampling distribution not dependent on the normality assumption (Lockwood & MacKinnon, 1998).
Several indices, such as the chi-square, chi-square/degree of freedom ratio and goodness-of-fit indices, were employed to determine whether the model fit the data. The recommendation for relative/normed chi-square (X:/df) is 5 or less (Schumacker & Lomax, 2004). An acceptable fit of the data to the model is indicated by the following values: comparative fit index (CFI) >0.9, Goodness of Fit Index (GFI) >0.9, Tucker-Lewis index (TLI) >0.9, and root-mean square error of approximation (RMSEA) <0.08 (Hu & Bentler, 1999).
3.1 Testing the TF Model Validity of Each Group
Establishment of the configural (baseline) model begins with separately testing the validity of each sample's hypothesised measurement model (Byrne, 2008, 2010). Whether the proposed two-factor model fits the empirical data for each group is tested first. Initial testing of the Malaysian sample's hypothesised model yielded a marginally good fit to the data (CFI=.905, GFI=.891, RMSEA=.112). In contrast to those of the Malaysian residents, the results of the British sample revealed a well-fitting model (CFI=.955, GFI=.935, RMSEA=.067). Indeed, a review of the modification indices for both groups revealed substantial evidence of misspecification as a consequence of an error variance between Attitude 2 and Attitude 3. This finding of overlapping variance among the attitude subscales is not surprising and can be explained by the fact that the two items emphasise residents' perception of control over their surrounding environment. Given a substantially reasonable rationale for estimating this additional parameter, the originally hypothesised model was estimated again for each group. Testing for these models resulted in a substantially better fitting model for both the British (CFI=.970, GFI=.944, RMSEA=.056) and Malaysian (CFI=.927, GFI=.904, RMSEA=.079) residents. Therefore, this model was deemed the most appropriate specified model for both groups. This final baseline model serves as the model to be tested for its equivalence between both samples, as portrayed schematically in Figure 1.
Figure 1. Baseline model of territorial functioning for British and Malaysian residents
In the study, a CFA technique was performed to examine the convergent validity and reliability of the factors. Three methods were used in assessing convergent validity: factor loading, composite reliabilities and average variance extracted (AVE). The results of the study indicated that the factor loadings were in the range of 0.48 to 0.98 and 0.45 to 0.96 for the British and Malaysian samples, respectively, which were close to the recommended value of 0.5 (Hair et aI., 2010). Composite reliability estimates the degree to which the respective indicators
33
www.ccsenet.org/res Review of European Studies Vol. 5, No.5; 2013
signal the latent construct (Lin, 2007); these estimates ranged from 0.79 to 0.89. A cut-off value of 0.7 and above is suggested for composite reliability, representing good reliability (Hair et aI., 2010). The AVE is suggested have a value of 0.5 and above, indicating adequate convergence (Bagozzi & Yi, 1988). In this study, the AVE values ranged from 0.44 to 0.84, which were close to the recommended value of 0.5 (Hair et aI., 2010). For both samples, the Cronbach's alpha scores in each factor were higher than the recommended cut-off value of 0.7 (Nunnally & Bernstein, 1994) and indicated good scale reliability. Overall, the CFA model demonstrated adequate reliability and convergent validity between the two samples. The results from the measurement models suggest that these models fit the data well.
3.2 Testingfor Multigroup Invariance
3.2.1 The Global Fit of the Baseline Model between the Two Groups
Having determined baseline models for both sample populations, we repeated a test of goodness-of-fit of the model between the two groups simultaneously. Testing for configural invariance focuses on the extent to which the same number of factors best represents the data of both groups (Byrne, 2010). The test indicated that the determined baseline model still represented a fairly good fit (y} (84)= 220.498; CFI=.934, GFI=.916, RMSEA=.061). The "l value and the goodness-of-fit indices for the unconstrained multigroup model served as an initial baseline model for subsequent constrained models.
3.2.2 Testing for Metric Invariance between the Two Groups
The purpose of testing for metric invariance is to ensure the equality of the factor patterns in the proposed model. Subsequent to the configural model, all factor loadings were constrained to be equal between the two groups in the metric invariance test (Hair et aI., 2006). This model (model 2) was compared with the baseline model (model 1). The test for the invariance of factor loadings still represented a fairly good fit (l (93)= 301.140; CFI=.903, GFI=.900, RMSEA=.072). These constraints increased the l value from 220.498 to 301.140, a gain of9 degrees of freedom (see Table 1). Because the metric invariance model is nested within the baseline model, a X2 difference test was performed. A non-significance X2 test rejects the null of equality of all loadings. Given that the X2 difference of 100.703 with 10 degrees of freedom was statistically significant, metric invariance was not supported. Therefore, the hypothesis of an invariant pattern of factor loadings was untenable. Because the difference between the CFI values met the recommended cut off value of .01 (~CFI=.031) as suggested by Cheung and Rensvold (2002), the CFI difference test was used to further support our conclusion of non-invariance.
Table 1. Simultaneous tests of invariance for territorial functioning measurements
Competing models X2 df ~X2 ~df p-Value Decision
1. Configural invariance (baseline model) (Modell) 220.498 84 2. Full metric invariance (Model 2) (comparison 301.140 93 80.642 9 0.000 Reject between Models 1 and 2) 3. Partial metric invariance (Model 3a) (A Attitude6, A 286.330 91 65.832 7 0.000 Reject Attitude? free) (comparison between Models 1 and 3a) 4. Partial metric invariance (Model 3b) (A Attitude6, A 241.735 90 21.237 6 0.002 Reject Attitude? and A MB4 free) (comparison between Models 1 and 3b) 5. Partial metric invariance (Model 3c) (A Attitude6, A 229.607 89 9.109 5 0.105 Accept Attitude?, A MB2 and A MB4 free) (comparison between Models 1 and 3c) 6. Partial metric and full scalar invariance (Model 4) 988.582 100 758.975 11 0.000 Reject (comparison between Models 3c and 4) 7. Partial metric and partial scalar invariance (Model 5) 242.105 95 10.918 6 0.052 Accept (iI, i6, i7, i9, iII free) (comparison between Models 4 and 5)
3.2.3 Testing for Partial Metric Invariance
Some but not all measurement parameters are equally constrained across groups in the partial metric invariance test. It should be noted that the concept of partial metric invariance introduced by Byrne et al. (1989) has sparked
34
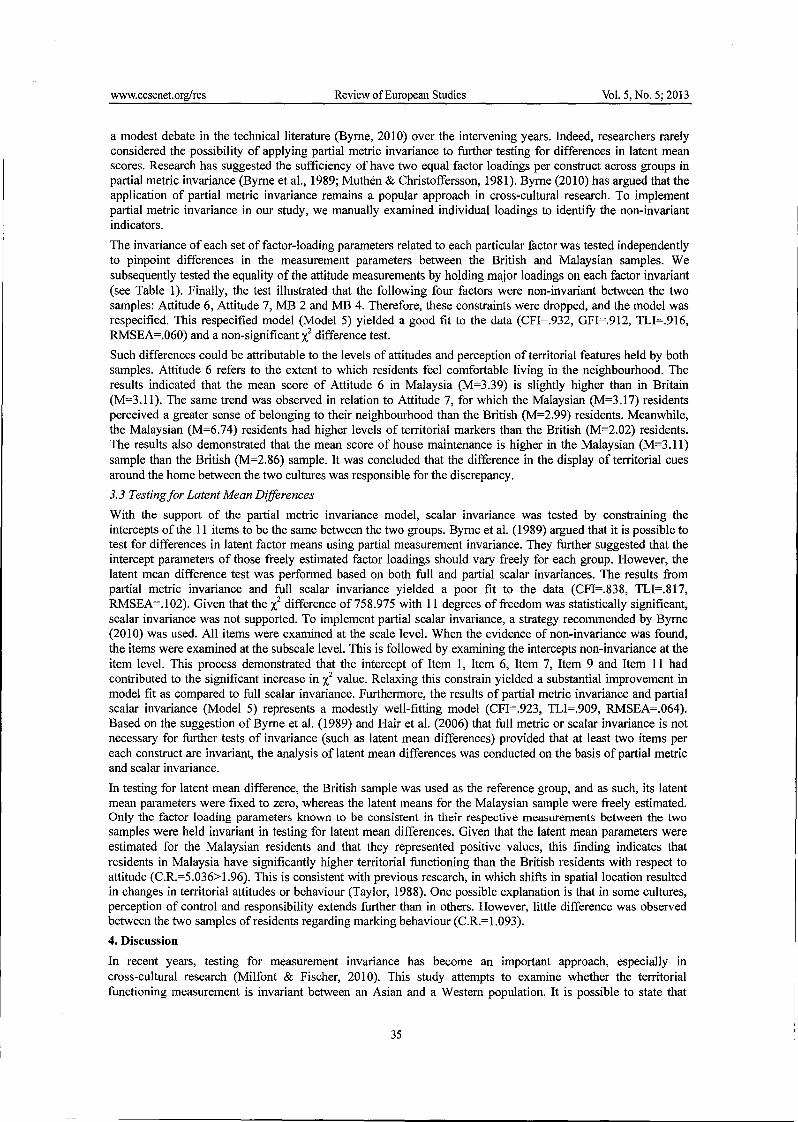
www.ccsenet.orglres Review of European Studies Vol. 5, No.5; 2013
a modest debate in the technical literature (Byrne, 2010) over the intervening years. Indeed, researchers rarely considered the possibility of applying partial metric invariance to further testing for differences in latent mean scores. Research has suggested the sufficiency of have two equal factor loadings per construct across groups in partial metric invariance (Byrne et aI., 1989; Muthen & Christoffersson, 1981). Byrne (2010) has argued that the application of partial metric invariance remains a popular approach in cross-cultural research. To implement partial metric invariance in our study, we manually examined individual loadings to identify the non-invariant indicators.
The invariance of each set of factor-loading parameters related to each particular factor was tested independently to pinpoint differences in the measurement parameters between the British and Malaysian samples. We subsequently tested the equality of the attitude measurements by holding major loadings on each factor invariant (see Table 1). Finally, the test illustrated that the following four factors were non-invariant between the two samples: Attitude 6, Attitude 7, MB 2 and MB 4. Therefore, these constraints were dropped, and the model was respecified. This respecified model (Model 5) yielded a good fit to the data (CFI=.932, GFI=.912, TLI=.916, RMSEA=.060) and a non-significant "l difference test.
Such differences could be attributable to the levels of attitudes and perception of territorial features held by both samples. Attitude 6 refers to the extent to which residents feel comfortable living in the neighbourhood. The results indicated that the mean score of Attitude 6 in Malaysia (M=3.39) is slightly higher than in Britain (M=3.11). The same trend was observed in relation to Attitude 7, for which the Malaysian (M=3.17) residents perceived a greater sense of belonging to their neighbourhood than the British (M=2.99) residents. Meanwhile, the Malaysian (M=6.74) residents had higher levels of territorial markers than the British (M=2.02) residents. The results also demonstrated that the mean score of house maintenance is higher in the Malaysian (M=3.11) sample than the British (M=2.86) sample. It was concluded that the difference in the display of territorial cues around the home between the two cultures was responsible for the discrepancy.
3.3 Testingfor Latent Mean Differences
With the support of the partial metric invariance model, scalar invariance was tested by constraining the intercepts of the 11 items to be the same between the two groups. Byrne et al. (1989) argued that it is possible to test for differences in latent factor means using partial measurement invariance. They further suggested that the intercept parameters of those freely estimated factor loadings should vary freely for each group. However, the latent mean difference test was performed based on both full and partial scalar invariances. The results from partial metric invariance and full scalar invariance yielded a poor fit to the data (CFI=.838, TLI=.817, RMSEA=.102). Given that the "I: difference of 758.975 with 11 degrees of freedom was statistically significant, scalar invariance was not supported. To implement partial scalar invariance, a strategy recommended by Byrne (2010) was used. All items were examined at the scale level. When the evidence of non-in variance was found, the items were examined at the subscale level. This is followed by examining the intercepts non-invariance at the item level. This process demonstrated that the intercept of Item 1, Item 6, Item 7, Item 9 and Item 11 had contributed to the significant increase in x,2 value. Relaxing this constrain yielded a substantial improvement in model fit as compared to full scalar invariance. Furthermore, the results of partial metric invariance and partial scalar invariance (Model 5) represents a modestly well-fitting model (CFI=.923, TLI=.909, RMSEA=.064). Based on the suggestion of Byrne et al. (1989) and Hair et al. (2006) that full metric or scalar invariance is not necessary for further tests of invariance (such as latent mean differences) provided that at least two items per each construct are invariant, the analysis of latent mean differences was conducted on the basis of partial metric and scalar invariance.
In testing for latent mean difference, the British sample was used as the reference group, and as such, its latent mean parameters were fixed to zero, whereas the latent means for the Malaysian sample were freely estimated. Only the factor loading parameters known to be consistent in their respective measurements between the two samples were held invariant in testing for latent mean differences. Given that the latent mean parameters were estimated for the Malaysian residents and that they represented positive values, this finding indicates that residents in Malaysia have significantly higher territorial functioning than the British residents with respect to attitude (C.R.=5.036> 1.96). This is consistent with previous research, in which shifts in spatial location resulted in changes in territorial attitudes or behaviour (Taylor, 1988). One possible explanation is that in some cultures, perception of control and responsibility extends further than in others. However, little difference was observed between the two samples of residents regarding marking behaviour (C.R.=1.093).
4. Discussion
In recent years, testing for measurement invariance has become an important approach, especially in cross-cultural research (Milfont & Fischer, 2010). This study attempts to examine whether the territorial functioning measurement is invariant between an Asian and a Western population. It is possible to state that
35
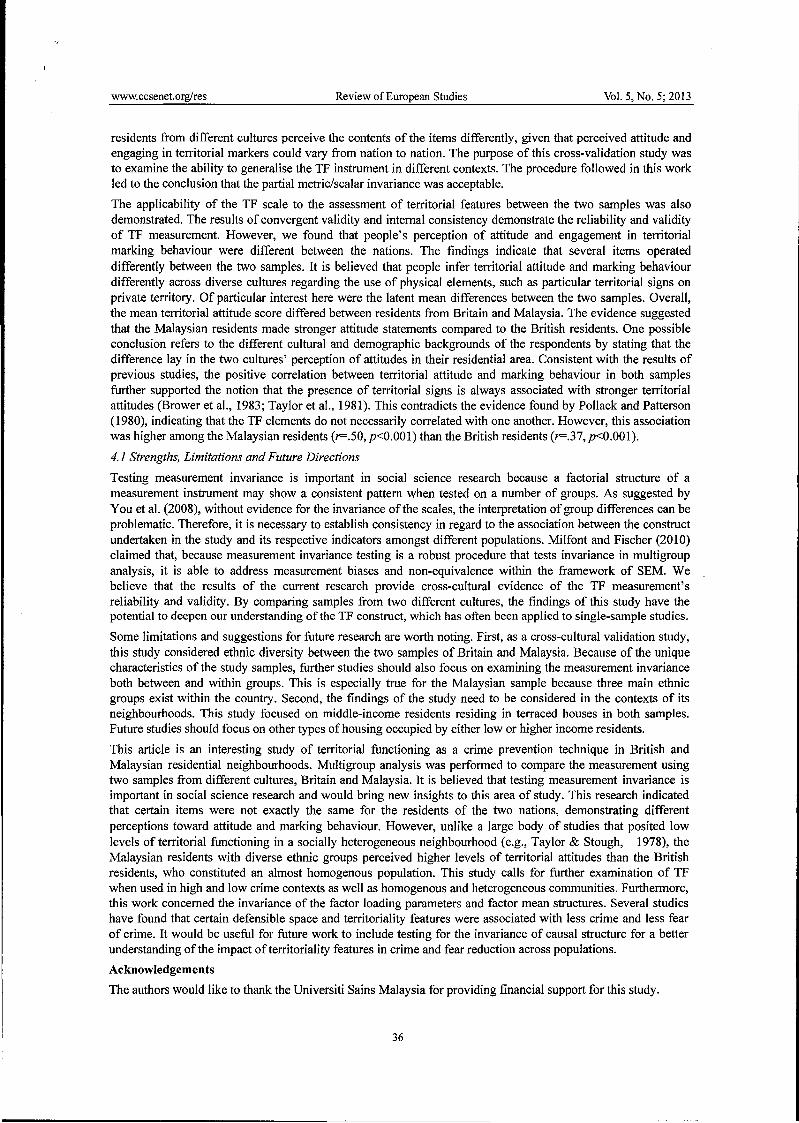
www.ccsenet.org/res Review of European Studies Vol. 5, No.5; 2013
residents from different cultures perceive the contents of the items differently, given that perceived attitude and engaging in territorial markers could vary from nation to nation. The purpose of this cross-validation study was to examine the ability to generalise the TF instrument in different contexts. The procedure followed in this work led to the conclusion that the partial metric/scalar invariance was acceptable.
The applicability of the TF scale to the assessment of territorial features between the two samples was also demonstrated. The results of convergent validity and internal consistency demonstrate the reliability and validity of TF measurement. However, we found that people's perception of attitude and engagement in territorial marking behaviour were different between the nations. The findings indicate that several items operated differently between the two samples. It is believed that people infer territorial attitude and marking behaviour differently across diverse cultures regarding the use of physical elements, such as particular territorial signs on private territory. Of particular interest here were the latent mean differences between the two samples. Overall, the mean territorial attitude score differed between residents from Britain and Malaysia. The evidence suggested that the Malaysian residents made stronger attitude statements compared to the British residents. One possible conclusion refers to the different cultural and demographic backgrounds of the respondents by stating that the difference lay in the two cultures' perception of attitudes in their residential area. Consistent with the results of previous studies, the positive correlation between territorial attitude and marking behaviour in both samples further supported the notion that the presence of territorial signs is always associated with stronger territorial attitudes (Brower et aI., 1983; Taylor et aI., 1981). This contradicts the evidence found by Pollack and Patterson (1980), indicating that the TF elements do not necessarily correlated with one another. However, this association was higher among the Malaysian residents (r=.50, p<O.OOI) than the British residents (r=.37, p<O.OOI).
4.1 Strengths, Limitations and Future Directions
Testing measurement invariance is important in social science research because a factorial structure of a measurement instrument may show a consistent pattern when tested on a number of groups. As suggested by You et al. (2008), without evidence for the invariance of the scales, the interpretation of group differences can be problematic. Therefore, it is necessary to establish consistency in regard to the association between the construct undertaken in the study and its respective indicators amongst different populations. Milfont and Fischer (2010) claimed that, because measurement invariance testing is a robust procedure that tests invariance in multigroup analysis, it is able to address measurement biases and non-equivalence within the framework of SEM. We believe that the results of the current research provide cross-cultural evidence of the TF measurement's reliability and validity. By comparing samples from two different cultures, the findings of this study have the potential to deepen our understanding ofthe TF construct, which has often been applied to single-sample studies.
Some limitations and suggestions for future research are worth noting. First, as a cross-cultural validation study, this study considered ethnic diversity between the two samples of Britain and Malaysia. Because of the unique characteristics of the study samples, further studies should also focus on examining the measurement invariance both between and within groups. This is especially true for the Malaysian sample because three main ethnic groups exist within the country. Second, the findings of the study need to be considered in the contexts of its neighbourhoods. This study focused on middle-income residents residing in terraced houses in both samples. Future studies should focus on other types of housing occupied by either low or higher income residents.
This article is an interesting study of territorial functioning as a crime prevention technique in British and Malaysian residential neighbourhoods. Multi group analysis was performed to compare the measurement using two samples from different cultures, Britain and Malaysia. It is believed that testing measurement invariance is important in social science research and would bring new insights to this area of study. This research indicated that certain items were not exactly the same for the residents of the two nations, demonstrating different perceptions toward attitude and marking behaviour. However, unlike a large body of studies that posited low levels of territorial functioning in a socially heterogeneous neighbourhood (e.g., Taylor & Stough, 1978), the Malaysian residents with diverse ethnic groups perceived higher levels of territorial attitudes than the British residents, who constituted an almost homogenous population. This study calls for further examination of TF when used in high and low crime contexts as well as homogenous and heterogeneous communities. Furthermore, this work concerned the invariance of the factor loading parameters and factor mean structures. Several studies have found that certain defensible space and territoriality features were associated with less crime and less fear of crime. It would be useful for future work to include testing for the invariance of causal structure for a better understanding of the impact of territoriality features in crime and fear reduction across populations.
Acknowledgements
The authors would like to thank the Universiti Sains Malaysia for providing financial support for this study.
36
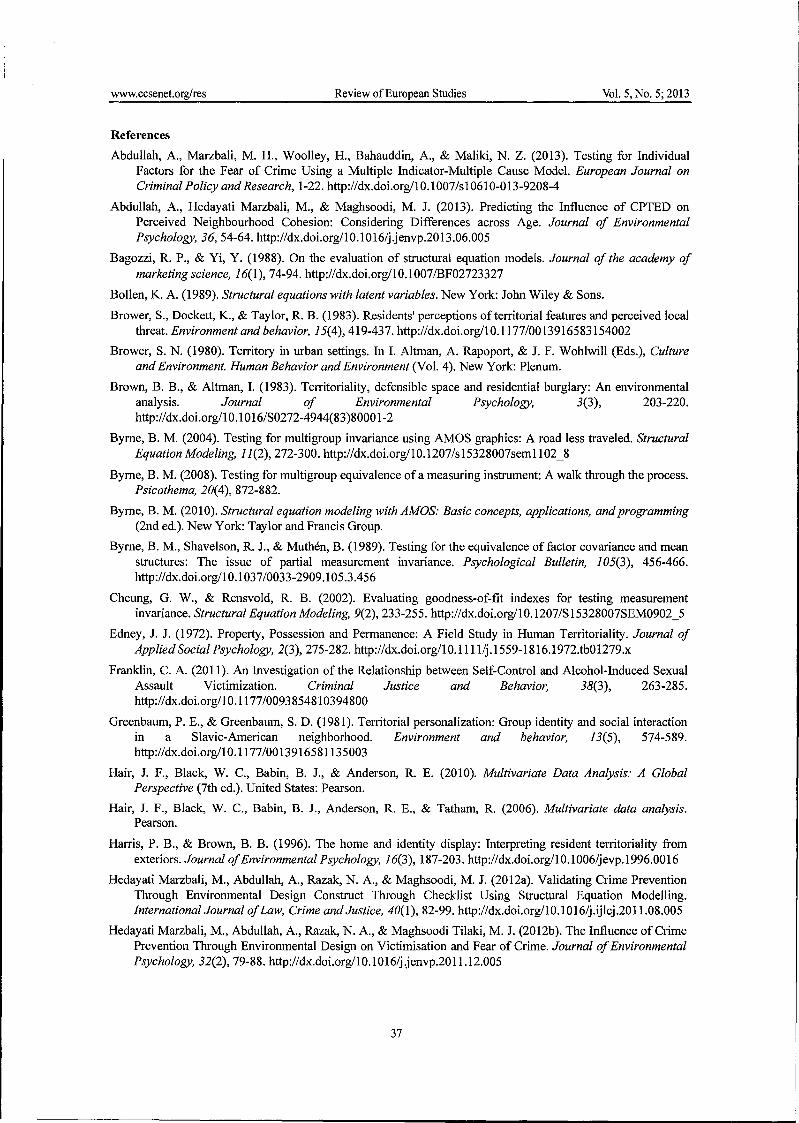
www.ccsenet.orglres Review of European Studies Vol. 5, No.5; 2013
References
Abdullah, A., Marzbali, M. H., Woolley, H., Bahauddin, A., & Maliki, N. Z. (2013). Testing for Individual Factors for the Fear of Crime Using a Multiple Indicator-Multiple Cause Model. European Journal on Criminal Policy and Research, 1-22. http://dx.doi.org/10.1007/s10610-013-9208-4
Abdullah, A., Hedayati Marzbali, M., & Maghsoodi, M. J. (2013). Predicting the Influence of CPTED on Perceived Neighbourhood Cohesion: Considering Differences across Age. Journal of Environmental Psychology, 36,54-64. http://dx.doLorg/10.1016/j.jenvp.2013.06.005
Bagozzi, R. P., & Yi, Y. (1988). On the evaluation of structural equation models. Journal of the academy of marketing science, 16(1), 74-94. http://dx.doi.org/10.1007IBF02723327
Bollen, K. A. (1989). Structural equations with latent variables. New York: John Wiley & Sons.
Brower, S., Dockett, K., & Taylor, R. B. (1983). Residents' perceptions of territorial features and perceived local threat. Environment and behavior, 15(4),419-437. http://dx.doi.org/10.1177/0013916583154002
Brower, S. N. (1980). Territory in urban settings. In I. Altman, A. Rapoport, & J. F. Wohlwill (Eds.), Culture and Environment. Human Behavior and Environment (Vol. 4). New York: Plenum.
Brown, B. B., & Altman, I. (1983). Territoriality, defensible space and residential burglary: An environmental analysis. Journal of Environmental Psychology, 3(3), 203-220. http://dx.doi.orgIl0.1 0 16/S0272-4944(83)8000 1-2
Byrne, B. M. (2004). Testing for multi group invariance using AMOS graphics: A road less traveled. Structural Equation Modeling, 11(2),272-300. http://dx.doi.org/1O.1207/s15328007semll02_8
Byrne, B. M. (2008). Testing for multigroup equivalence of a measuring instrument: A walk through the process. Psicothema, 20(4),872-882.
Byrne, B. M. (2010). Structural equation modeling with AMOS: Basic concepts, applications, and programming (2nd ed.). N ew York: Taylor and Francis Group.
Byrne, B. M., Shavelson, R. 1, & Muthen, B. (1989). Testing for the equivalence of factor covariance and mean structures: The issue of partial measurement invariance. Psychological Bulletin, 105(3), 456-466. http://dx.doLorg/l 0.1037/0033-2909.105.3.456
Cheung, G. W., & Rensvold, R. B. (2002). Evaluating goodness-of-fit indexes for testing measurement invariance. Structural Equation Modeling, 9(2), 233-255. http://dx.doLorg/10.1207/S15328007SEM0902_5
Edney, J. 1 (1972). Property, Possession and Permanence: A Field Study in Human Territoriality. Journal of Applied Social Psychology, 2(3), 275-282. http://dx.doi.orgIl0.1l11/j.1559-1816.l972.tb01279.x
Franklin, C. A. (2011). An Investigation of the Relationship between Self-Control and Alcohol-Induced Sexual Assault Victimization. Criminal Justice and Behavior, 38(3), 263-285. http://dx.doLorgIl0.1177 10093854810394800
Greenbaum, P. E., & Greenbaum, S. D. (1981). Territorial personalization: Group identity and social interaction in a Slavic-American neighborhood. Environment and behavior, 13(5), 574-589. http://dx.doi.org/10.1177/0013916581135003
Hair, 1 F., Black, W. c., Babin, B. 1, & Anderson, R. E. (2010). Multivariate Data Analysis: A Global Perspective (7th ed.). United States: Pearson.
Hair, J. F., Black, W. C., Babin, B. J., Anderson, R. E., & Tatham, R. (2006). Multivariate data analysis. Pearson.
Harris, P. B., & Brown, B. B. (1996). The home and identity display: Interpreting resident territoriality from exteriors. Journal of Environmental Psychology, 16(3), 187-203. http://dx.doi.org/10.1006/jevp.1996.0016
Hedayati Marzbali, M., Abdullah, A., Razak, N. A., & Maghsoodi, M. 1 (2012a). Validating Crime Prevention Through Environmental Design Construct Through Checklist Using Structural Equation Modelling. International Journal of Law, Crime and Justice, 40(1), 82-99. http://dx.doi.org/10.1 0 16/j.ijlcj.20 11.08.005
Hedayati Marzbali, M., Abdullah, A., Razak, N. A., & Maghsoodi Tilaki, M. J. (2012b). The Influence of Crime Prevention Through Environmental Design on Victimisation and Fear of Crime. Journal of Environmental Psychology, 32(2), 79-88. http://dx.doLorg/1O.1016/j.jenvp.2011.12.005
37
www.ccsenet.org/res Review of European Studies Vol. 5, No.5; 2013
Hedayati Marzbali, M., Abdullah, A., Razak, N. A., & Maghsoodi, M. J. (2012c). The relationship between socio-economic characteristics, victimization and CPTED principles: evidence from the MIMIC model. Crime, law and social change, 58(3), 351-371. http://dx.doi.orgll0.1007/s10611-012-9389-7
Hu, L., & Bentler, P. M. (1999). Cutoff criteria for fit indexes in covariance structure analysis: Conventional criteria versus new alternatives. Structural Equation Modeling: A Multidisciplinary Journal, 6(1), 1-55. http://dx.doi.orgI10.1080110705519909540118
Lin, H. F. (2007). Predicting consumer intentions to shop online: An empirical test of competing theories. Electronic Commerce Research and Applications, 6(4), 433-442. http://dx.doi.orgll 0.1 0 16/j .e1erap.2007 .02.002
Lockwood, C. M., & MacKinnon, D. P. (1998). Bootstrapping the standard error of the mediated effect. Paper presented at the 23rd Annual Meeting ofSAS Users Group International, Cary, NC.
Mardia, K. V. (1974). Applications of some measures of multivariate skewness and kurtosis in testing normality and robustness studies. Sankhyii: The Indian Journal of Statistics, Series B, 36(2), 115-128.
Milfont, T. L., & Fischer, R. (2010). Testing measurement invariance across groups: Applications in cross-cultural research. International Journal of psychological research, 3(1), 111-130.
Muthen, B., & Christoffersson, A. (1981). Simultaneous factor analysis of dichotomous variables in several groups. Psychometrika, 46(4),407-419. http://dx.doi.orgll0.l007IBF02293798
Newman, O. (1972). Defensible space; crime prevention through urban design. New York: MacmiIIan.
NunnaIIy,l C., & Bernstein, I. H. (1994). Psychometric theory (3rd ed.). New York: McGraw-HilI.
Patterson, A. H. (1978). Territorial behavior and fear of crime in the elderly. Journal of Nonverbal Behavior, 2(3),131-144. http://dx.doi.orgllO.1007IBF01145816
PoIIack, L. M., & Patterson, A. H. (1980). Territoriality and fear of crime in elderly and nonelderly homeowners. The Journal of social psychology, I1J(First Half), 119-129. http://dx.doi.orgI10.1080/00224545.1980.9924280
Preacher, K. 1, & Hayes, A. F. (2008). Asymptotic and resampling strategies for assessing and comparing indirect effects in multiple mediator models. Behavior research methods, 40(3), 879-891. http://dx.doi.orgll0.3758IBRMA0.3.879
Scheflen, A. E. (1971). Living space in an urban ghetto. Family Process, 10(4), 429-450. http://dx.doi.orgI10.111I1j.1545-5300.l971.00429.x
Schumacker, R. E., & Lomax, R. G. (2004). A beginner's guide to structural equation modeling (2nd ed.). Mahwah, New Jersey: Lawrence Erlbaum Associates, Pubs.
Taylor, R. B. (1988). Human territorial fUnctioning: An empirical, evolutionary perspective on individual and small group territorial cognitions, behaviors, and consequences. Cambridge: Cambridge University Press. http://dx.doi.orgll0.l017/CB09780511571237
Taylor, R. B., Gottfredson, S. D., & Brower, S. (1981). Territorial cognitions and social climate in urban neighborhoods. Basic and Applied Social Psychology, 2(3), 289-303. http://dx.doi.org/l0.1207/s15324834basp0204_5
Taylor, R. B., Gottfredson, S. D., & Brower, S. (1984). Block crime and fear: Defensible space, local social ties, and territorial functioning. Journal of Research in Crime and Delinquency, 21(4), 303-331. http://dx.doi.orgl1 0.1177/0022427884021004003
Taylor, R. B., & Stough, R. R. (1978). Territorial cognition: Assesing Altman's typology. Journal of Personality and Social Psychology, 36(4),418-423. http://dx.doi.orgll0.l037/0022-3514.36AAI8
WiIIiams, J., & MacKinnon, D. P. (2008). Resampling and distribution of the product methods for testing indirect effects in complex models. Structural Equation Modeling, 15(1), 23-51. http://dx.doi.orgll0.l080110705510701758166
You, S., Furlong, M. J., Felix, E., Sharkey, 1 D., Tanigawa, D., & Green, J. G. (2008). Relations among school connectedness, hope, life satisfaction, and buIIy victimization. Psychology in the Schools, 45(5), 446-460. http://dx.doi.org/l0.l002/pits.20308
38

www.ccsenet.org/res Review of European Studies Vol. 5, No.5; 2013
Copyrights Copyright for this article is retained by the author(s), with first publication rights granted to the journal.
This is an open-access article distributed under the terms and conditions of the Creative Commons Attribution license (http://creativecommons.org/licenseslby/3.0/).
39
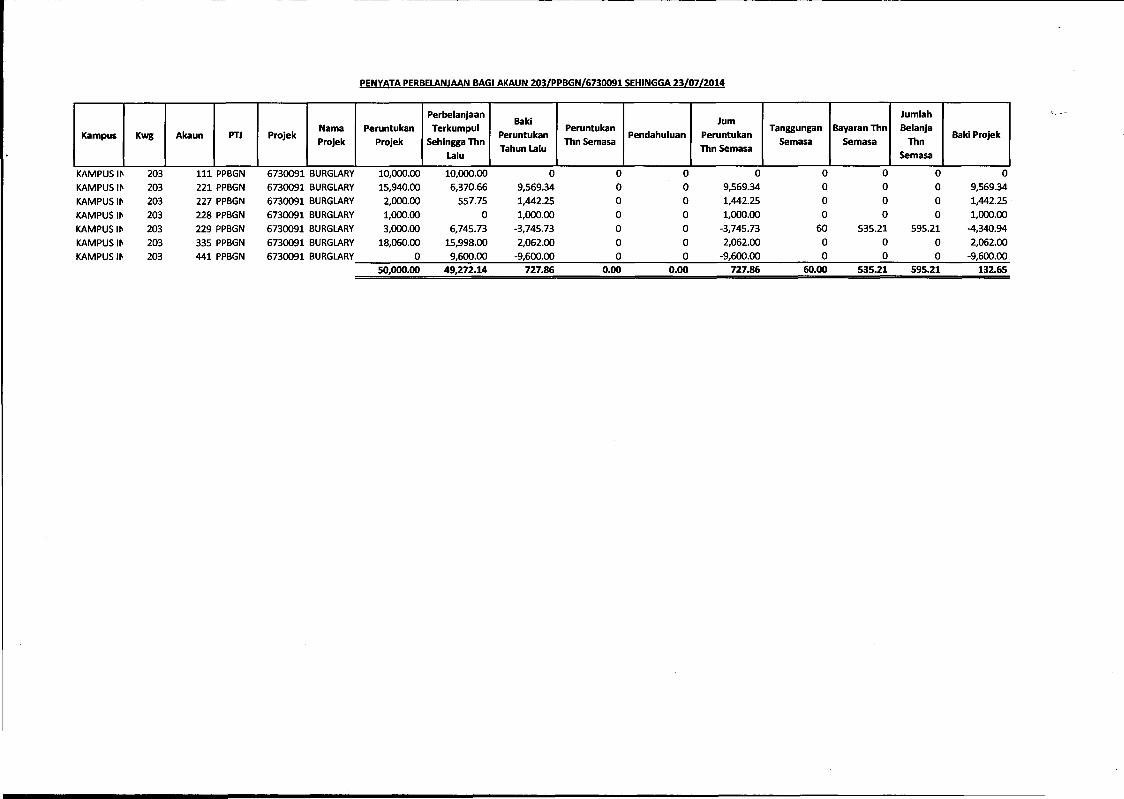
PENYATA PERBELANJAAN BAGI AKAUN 203/PPBGN/6730091 SEHINGGA 23/07/2014
Perbelanjaan Baki Jum
Jumlah
Akaun Projek Nama Peruntukan Terkumpul
Peruntukan Peruntukan
Pendahuluan Peruntukan Tanggungan BayaranTlm Belanja
Baki Projek Kampus Kwg PTJ Projek Projek Sehingga Thn ThnSemasa Semasa Semasa Thn
Lalu Tahun Lalu ThnSemasa
Semasa ----
KAMPUS I~ 203 111 PPBGN 6730091 BURGLARY 10,000.00 10,000.00 0 0 0 0 0 0 0 0
KAMPUS I~ 203 221 PPBGN 6730091 BURGLARY 15,940.00 6,370.66 9,569.34 0 0 9,569.34 0 0 0 9,569.34
KAMPUS I~ 203 227 PPBGN 6730091 BURGLARY 2,000.00 557.75 1,442.25 0 0 1,442.25 0 0 0 1,442.25
KAMPUS I~ 203 228 PPBGN 6730091 BURGLARY 1,000.00 0 1,000.00 0 0 1,000.00 0 0 0 1,000.00
KAMPUS I~ 203 229 PPBGN 6730091 BURGLARY 3,000.00 6,745.73 -3,745.73 0 0 -3,745.73 60 535.21 595.21 -4,340.94
KAMPUS I~ 203 335 PPBGN 6730091 BURGLARY 18,060.00 15,998.00 2,062.00 0 0 2,062.00 0 0 0 2,062.00
KAMPUS I~ 203 441 PPBGN 6730091 BURGLARY 0 9,600.00 -9,600.00 0 0 -9,600.00 0 0 0 -9,600.00
50,000.00 49,272.14 727.86 0.00 0.00 727.86 60.00 535.21 595.21 132.65