krisztina fehÉr supervisor: dr lÁszlÓ szilÁgyi · glc glucose man mannose gal galactose nacglc...
TRANSCRIPT

STUDIES OF CARBOHYDRATES AND PEPTIDES BY NMR SPECTROSCOPY AND MOLECULAR
MODELLING
PhD dissertation
BY
KRISZTINA FEHÉR
SUPERVISOR: DR LÁSZLÓ SZILÁGYI
UNIVERSITY OF DEBRECEN
DEBRECEN, 2003


Ezen értekezést a Debreceni Egyetem TTK Kémiai Doktori Iskola Heterociklusos vegyületek
programjának keretében készítettem a Debreceni Egyetem TTK doktori (Ph.D.) fokozatának
elnyerése céljából.
Debrecen, 2002.06.20.
....................................................................
Fehér Krisztina
Tanúsítom, hogy Fehér Krisztina doktorjelölt 1998 - 2003 között a fent megnevezett Doktori
Iskola Heterociklusos vegyületek programjának keretében irányítasommal végezte a
munkáját. Az értekezésben foglalt eredményekhez a jelölt önálló alkotó tevékenységével
meghatározóan hozzájárult. Az értekezés elfogadását javaslom.
Debrecen, 2003.06.20
....................................................................
Dr Szilágyi László
egyetemi tanár
témavezető


ACKNOWLEDGEMENTS
I am grateful to Professor László Szilágyi for his guidance and continuous careful
supervision of my work all along the years.
I am greatly indebted to Dr. Katalin E. Kövér and Dr. Gyula Batta for their invaluable
help regarding both practical and theoretical aspects of NMR.
I am grateful to Professor Dr. Stefan Berger in University of Leipzig. In his laboratory
I had unrestricted access to excellent equipment that has given me a chance to play around
any idea I was curious about. I also enjoyed the critical, very thorough discussions with
Professor Berger that stimulated me to dig down to the roots of problems.
I would like to thank to Professor Sándor Antus for giving me the opportunity to carry
out these investigations in the Organic Chemistry Department of University Debrecen.
Several people were contributing to this work as co-authors of publications and I
would like to acknowledge them all, in particular Dr Primož Pristovšek and Dr Anikó Borbás.
I would like to express my thanks to Sára Balla for her practical help in solving our
day-by-day problems in the laboratory in Debrecen and for ensuring a warm, friendly
atmosphere.
Thanks all the colleagues with whom I was working together in Debrecen and in
Leipzig for sharing day-by day problems both in the laboratory and in life.
I gratefully acknowledge the Marie Curie Training Site Fellowship grant HPMT-2000-
00183.
Krisztina Fehér
20.06.2003., Leipzig


TABLE OF CONTENTS
SYMBOLS AND ABBREVIATIONS
1. INTRODUCTION 1
2. METHODS
2.1 Structure elucidation by NMR 3
NMR observables in different physical states of matter 3
Methods for inducing anisotropy 7
Relationship between NMR parameters and structure 8
NMR experimental techniques 15
2.2 Methods for structure calculation 20
Potential energy of the molecular system 20
Quantum theories versus molecular mechanics 21
Molecular mechanics for carbohydrates 22
Conformational analysis 24
Analysis of simulations 27
CONFORMATIONAL STUDIES
3. CONFORMATIONAL INVESTIGATIONS OF MODIFIED CELL WALL PEPTIDES
3.1 The unique cellular structure in bacteria: the cell-wall 30
3.2 Biological activity and conformation of peptidoglycans 32
3.3 Novel derivatives with increased lipophilicity 35
3.4 Results and discussion 37
3.5 Conclusion 49
4. CONFORMATIONAL PREFERENCES OF DIGLYCOSYL DISULFIDES
4.1 Carbohydrates with unusual interglycosidic linkages 50
4.2 Structures investigated: disulfide disaccharides 51
4.3 NMR methods for investigating the conformation about
the interglycosidic linkage 52
4.4 Results and discussion 54
NMR investigations 54
Computer aided conformational analysis 62
4.5 Conclusion 76
IMPROVING METHODS FOR DETERMINATION OF NMR PARAMETERS
5. ACCURATE DETERMINATION OF SMALL ONE-BOND HETERONUCLEAR
RESIDUAL DIPOLAR COUPLINGS
5.1 Measuring one-bond heteronuclear scalar and residual dipolar coupling
with conventional NMR techniques 80
5.2 F1 coupled HSQC with G-BIRD(r) 85
5.3 Conclusion 88
6. BANDSELECTIVE SUPPRESSION OF UNWANTED SIGNALS IN
OLIGOSACCHARIDE SPECTRA
6.1 Signal overlap in the NMR spectra of oligosaccharides 89
6.2 Bandselective DPFGSE-TOCSY as a preparation period 90
6.3 Applications 92
7. EXPERIMENTAL
7.1 NMR measurements of the peptidoglycan derivatives 96
7.2 NMR measurements on isotropic diglycoside disulfide samples 98
7.3 Sample preparation and NMR measurements
on partially oriented samples 98
7.4 NMR measurements for protected oligosaccharides 101
8. SUMMARY 102
ÖSSZEFOGLALÓ 106
9. REFERENCES 110
10. APPENDIX 127
SYMBOLS AND ABBREVIATIONS
1D or 2D or 3D one/two/three dimensional
RDC residual dipolar coupling
RQC residual quadrupolar coupling
CSA chemical shift anisotropy
X heteronucleus: 13C or 15N 1JX,1H scalar coupling constant of X heteronucleus to directly bonded proton nJX,1H scalar coupling constant of X heteronucleus to long-range protons 1DX,1H dipolar coupling constant of X heteronucleus to directly bonded proton nDX,1H dipolar coupling constant of X heteronucleus to long-range protons
LC liquid crystal
COSY COrrelated SpectroscopY
TOCSY TOtal Correlated SpectroscopY
HSQC Heteronuclear Single Quantum Spectroscopy
HMQC Heteronuclear Multiple Quantum Correlated Spectroscopy
HMBC Heteronuclear Multiple Bond Correlated Spectroscopy
NOE Nuclear Overhauser Effect
NOESY Nuclear Overhauser Effect Spectroscopy
ROE Rotating frame nuclear Overhauser Effect
ROESY Rotating frame nuclear Overhauser Effect Spectroscopy
PES potential energy surface
Epot potential energy
GS grid search
SA simulated annealing
PGM peptidoglycan monomer
Ad-PGM adamant-1-yl-CH2CO-PGM
BocTyr-PGM tert-butyloxycarbonyl-L-tyrosyl-PGM
NAG, GlcNAc N-acetyl-D-glucosamine
NAM, MurNAc N-acetyl muramic acid
Lac L-acetyl
Ala alanine
Dap diaminopimelic acid

iGln iso-glutamine
Ad adamantyl
Tyr tyrosine
Boc butyl-oxy-carbonyl
But tercier-butyl
MDP N-acetyl-muramyl-dipeptide
Glc glucose
Man mannose
Gal galactose
NAcGlc N-acetyl-glucose
GlyVal glycine-valine
m meso
CHAPSO 3-[(3-cholamidopropyil) dimethylammonio]-2-hidroxy-1-
propanasesulfonate
DMPC dimyristoyl-DL-α-phosphatidylcholine 1,2-ditetradecanoyl-rac-
glycerol-3-phosphocholine
ℋ Hamiltoinian
Vectors are noted with underlines, tensors are indicated in bold. Other symbols are explained
in the text.

1. INTRODUCTION
Matter in the Universe is made up of the same 100 different types of atoms, still a vast
variety of different materials are observed. The enormous diversity arises from the various
ways the atoms are arranged. Knowing the 3D structure of a molecule is of paramount
importance today in chemistry and biology since it determines the large variety of chemical,
physical and biological properties of materials.
The concept of structure incorporates the chemical constitution, the stereochemistry
and the conformation (3D structure) of molecules. The conformations of molecules are
traditionally defined as those arrangements of atoms in space that can be interconverted
purely by rotation about single bonds. This definition is usually relaxed in recognition of the
fact that small distortions in bond angles and bond lengths often accompany conformational
changes, and that rotations can occur about bonds in conjugated systems that have bond
orders between one and two.
In crystalline materials positions of the heavy atoms in the molecule can be
determined by X-ray crystallography. Problems arise with X-ray crystallography when
crystals cannot be grown or a molecule has a dynamic nature. An alternative method for
structure determination is nuclear magnetic resonance (NMR) that is steadily gathered
importance in the last three decades or so. Applications of high-resolution solution state NMR
extend to numerous areas. As an analytical tool the result of chemical synthesis is checked in
a fast and efficient way, as far as connectivity, stereochemistry and purity is concerned. In
structural studies NMR spectroscopy has made the largest impact on the determination of
protein structures in solution, and a pioneer in NMR, Kurt Wüthrich was awarded the Nobel
Prize in 2002 for his contributions to this area. The information provided by NMR structures
is complementary to X-ray crystallography in many ways. It is performed on molecules in
solution or most recently on powder crystals; therefore no single crystal is required. New
structures can be obtained which are not available from X-ray studies or a meaningful
comparison of the conformations in single crystals and in non-crystalline states can be
obtained. It can provide additional information about dynamics on various time scales. The
solution conditions for NMR studies (e.g., pH, temperature, ionic strength, buffers) can be
varied over a wide range, which opens the possibility for comparative studies, or for
investigations of intermolecular interactions with other solute molecules. The NMR
studies are often combined or compared with the results of molecular modelling methods,
1

since NMR parameters provide structural constraints at the atomic level that can be
conveniently utilized in computations, while the analysis of calculations give further insight
into the characteristics of the chemical system.
This thesis describes conformational studies of two important classes of molecules,
glycopeptides and carbohydrates to reveal conformational features of biological relevance.
Furthermore, modifications to known NMR methods are proposed to improve measurements
of structurally relevant NMR parameters.
2

2. METHODS
2.1 Structure elucidation by NMR Any NMR study consists of three stages: experimental data collection, resonance
assignment and determination of structurally relevant parameters that are in turn converted to
constraints to derive information about the constitution, stereochemistry or 3D arrangement of
atoms in the molecule. Further experiments for measuring relaxation and exchange rates give
additional information on dynamic aspects.
The NMR parameters are connected to the molecular structure in various ways. When
building up the structure of a molecule one typically first searches for evidence of scalar
coupling between nuclei as this can be used to indicate the location of chemical bonds. After
all bonding relationships within the molecule have been established, the gross structure of the
molecule is defined. Spatial proximities between nuclei can be used to define stereochemical
relationships within a molecule and to address questions of conformation. Angular relations
are provided by scalar coupling constants and residual dipolar couplings. The theory of NMR
parameters in terms of spin interactions and their connection to structure is briefly
summarized in the followings.
NMR observables in different physical states of matter
Spectral parameters are manifestations of physical interactions of the nuclear spin (1).
The various types of spin interactions can be conveniently summarized in terms of the internal
nuclear spin Hamiltonian:
ℋint = ℋCS + ℋD + ℋJ + ℋQ
where ℋCS is the Hamiltonian for chemical shielding, ℋD stands for the direct dipole-dipole
coupling, ℋJ is for the indirect coupling and ℋQ is the quadrupolar coupling Hamiltonian.
The shielding is a magnetic interaction of the spin with the magnetic field generated by
electrons. The direct or dipolar coupling is a magnetic interaction whereby pairs of nuclei in
3

close proximity to each other sense one another through space. The J coupling involves an
indirect interaction of spins with each other by the mediation of the bonding electrons. The
quadrupolar coupling is an interaction of the electric quadrupole moment of the nucleus with
electric field gradients.
All these interactions are orientation dependent giving different interaction energies in
different directions. The orientation dependence is described by second rank interaction
tensors, hence the general form of the interaction Hamiltonian is the following:
, = constant I T J
where I is the spin angular momentum vector, T is the interaction tensor, J is the interacting
vector that can be a magnetic or an electric field vector or the spin angular momentum vector
of another spin. Table 2.1 summarize the tensors relating the two interacting vectors for all
possible interactions.
Table 2.1 Summary of physical interactions of spins. I and S are theangular spin momentums of spins I and S,
respectively, and B0 stands for the external static magnetic field.
Interaction Interacting physical quantities Tensor
Shielding I B0 σ shielding tensor
Indirect coupling I S J indirect coupling tensor
Direct coupling I S D dipolar coupling tensor
Quadrupolar coupling I I Q quadrupolar coupling tensor
It is practical to distinguish between intra- and intermolecular relations. Except for J
coupling, all interactions have intermolecular contributions for which the interacting vectors
are located in different molecules. For liquids, intermolecular interactions can further be
subdivided into short-range relations involving molecules within the same diffusion sphere,
and long-range relations between molecules at a larger distance. Such classification of
interactions is neccessary, because the internal, the short-range and the long-range
intermolecular part of interactions are affected by motions in a different way.
Motions present in different physical states have an averaging effect on the
interactions due their intrinsic orientation dependence. There are three relevant modes of
molecular motion: namely the internal, rotational and translational. Internal motions involve
vibrations, rotations of internal groups and chemical isomerizations. Rotations involve a
4

change in the orientation of molecules in space. Translational motions can be random
(diffusion) or biased in a particular direction by an external pressure gradient (convection).
Internal motions and rotations affect primarily the intramolecular spin interactions,
while translational motion may influence both intra- and intermolecular motions. The effect
of motions on NMR observables in different physical states is summarized in Table 2.2.
Table 2.2 Summary of NMR observables in different physical states of matter
State of matter liquid solid
Motion isotropic anisotropic single crystal powder
Internal free free restricted restricted
Rotational free restricted restricted restricted
Translational free free a restricted restricted
Orientation of
molecules
all orietations statistically
oriented
single orientation all orientations
NMR
observables
finit, isotropic
value or zero
partially averaged
or
residual value
values for a single
orientation
values for all
orientations
a) Recently there the translational diffusion were studied by NMR investigating restrictions of translational
motion in anisotropic liquid crystals (2)
In liquids, the diffusional motion completely averages the long-range intermolecular
interactions, it is, however, not able to average out the short-range intermolecular interactions.
This effect, however, hardly can be detected.
In isotropic liquids, all intramolecular interactions are averaged by rotational motions
since all orientations are equally likely. This average can be a finite value or zero. A finite
residual value is observed for the shielding and the indirect coupling. As a result, resonances
of nuclei in an isotropic liquid are shifted by the isotropic chemical shift (simply referred to as
chemical shift) and split by the isotropic indirect coupling (the so called scalar coupling). The
isotropic averages are, however, zero for both the dipolar and the quadrupolar interactions.
5
Thus, these terms does not affect directly the isotropic solution state NMR spectra, although
they have effects via relaxation as line broadening or through NOE.
There is a considerable rotational motion in anisotropic liquids, but not all orientations
are equally probable. The direction dependent rotational motion averages the spin interactions
to anisotropic values that are different from their isotropic value. For the shielding it results in
a residual chemical shift anisotropy that will add to the isotropic chemical shift. The J
anisotropy is usually small and often ignored. The direct and the quadrupolar couplings
average to a finite value yielding a residual direct or dipolar coupling (RDC) and a residual
quadrupolar coupling (RQC). This latter one appears only in spectra of quadrupolar nuclei as
line splitting by the finite value of the RQC.
In the solid state all type of motions are highly restricted, except for certain degrees of
internal motions such as group rotations. Due to restricted rotation, intramolecular motions
are not averaged. Only one orientation of the molecule is present in single crystals. For each
interaction a single value characteristic for the single orientation appear in the spectra. In case
of powders all orientations are present and for all interactions values characteristic for all
orientation prevail. The most important difference between liquids and solids is, however, that
diffusion is completely absent in solids and not able to affect either intra- or intermolecular
interactions. This latter is quite significant since molecules are densely packed to each other
in the solid phase giving rise to the manifestation of numerous mainly unresolved splittings.
This yields very broad, featureless lines in the NMR spectra of solids.
The isotropic NMR parameters, the chemical shift and the scalar coupling constant,
are easily measured due to "simplicity" of the spectra, but are difficult to convert to specific
structural information as these parameters are sensitive to subtle changes in electron density
sometimes in regions of the molecule relatively remote from the nucleus of interest. Instead,
empirical rules are deduced for certain classes of compounds and these rules are applied for
structural analysis. Measuring NMR spectra in isotropic liquids therefore causes a
considerable loss of structural information, but gives the advantage of "easily" interpreted
spectra.
In the NMR spectra of solids, broad lines are observed combining high information
content with extreme complexity making spectral analysis difficult. This necessitates the use
of special manipulations of experimental conditions in order to obtain spectra of comparable
resolution as for liquids.
Recently anisotropic sample conditions have been used in order to reintroduce the
information content present in orientation dependent spin interactions. A slight degree of
6
alignment maintained in the solution offers residual values of anisotropic interactions,
whereas still retaining simplicity of the spectra. Parameters obtained in this manner are the
residual chemical shift anisotropy, the residual dipolar coupling and the residual quadrupolar
coupling.
Methods for inducing anisotropy
Alignment of molecules can be achieved by application of electric or magnetic fields,
by dissolving the substance in dilute liquid crystals or by other methods.
Application of electric field alignment (3,4) in NMR has not, however, become
widespread, due to the need for specially designed probes and the limitation to relatively non-
conducting solutions.
Intrinsic partial alignment (5) is observed for molecules possessing sufficiently large
magnetic susceptibility anisotropy such as nucleic acids (6), protein-nucleic acid complexes
(7), metal binding paramagnetic proteins (8, 9), or proteins with strong diamagnetic
susceptibility anisotropy (10, 11) in the presence of strong magnetic field. The degree of
orientation depends the inherent anisotropy in magnetic susceptibility of the molecule under
study. The magnitude of the resulting RDCs at the available field strengths is, however, small
and therefore difficult to measure reliably.
Alignment can be achieved by dissolving the molecule in partially oriented media.
Liquid crystalline media have long been used for orienting solutes in order to study their
structure (12-14). The degree of solute orientation typically obtained in such a solvent is so
large that interpretation of the NMR spectra of molecules with larger size is extremely
difficult. Furthermore, the RDCs obtained exceed the chemical shift differences between
resonances and as a result the spectra suffer from strong coupling effects.
A tunable degree of alignment was achieved by dissolving molecules in a dilute liquid
crystalline phase (15). This reduces the RDCs to an extent that only the largest couplings are
observable, thus retaining the resolution, simplicity and sensitivity of the NMR spectra in the
isotropic phase. The resulting RDCs are of measurable magnitude (±2-20Hz) compared to
values resulting from intrinsic alignment studies. In recent years RDCs have therefore been
extensively applied (16-19) for structural studies of proteins, nucleic acids and carbohydrates
in the liquid state and proved to improve the precision of structures.
Alignment with bicelles, which usually consist of a long-chain and a short-chain
phospholipid, is the most common way to align molecules (20). The mixture in aqueous
7
solution was shown to form disc-like aggregates which align themselves in the presence of a
magnetic field. The short-chain phospholipids are believed to be located primarily at the
edges of the disc, whereas the long-chain phospholipids form a stable flat bilayer. These
aggregates, commonly referred to as bicelles, adopt a nematic liquid crystalline phase at a
given temperature and align themselves in the magnetic field with their director perpendicular
to the magnetic field direction. Many different bicelle mixtures for different sample
conditions (concentration, molar ration, temperature, ionic strength, pH) are known.
Other liquid crystal based methods use lamellar phases formed by quasi-ternary
mixtures of CPCl (cetylpyridinium cloride) or CPBr (cetylpyridinium bromide)/hexanol/bile
salt (21-22) or n-alkyl-poly-(ethylene-glycol)/n-alkyl-alcohol based systems (23). Another
commonly utilized method to achieve alignment is the use of nematic phases of rod-shaped
viruses (24-25), purple membrane fragments (26-27). Furthermore, other approaches have
also been introduced such as cellulose crystallites (28-29) and poly-acryl amide gel (30)
combined with the application of mechanic pressure.
Relationship between NMR parameters and molecular structure
Parameters conventionally measured in isotropic liquids
The most important NMR parameters in isotropic liquids are the chemical shift and the
scalar spin-spin coupling constant. Since these parameters are treated in detail in many text
books, here only practical issues relevant for the content of this thesis are discussed.
The chemical shift
The chemical shift is a change of the Larmor frequency of the nuclear spin due to its
chemical environment. Phenomenologically the chemical shift arise because the field actually
experienced by the nucleus, Beff, slightly differs from the external field, B0, that would be felt
by an isolated, bare nucleus. This effect is characterized by the shielding constant (σ).
Beff = B0 (1 − σ)
8
It is useful to divide the nuclear shielding into parts:
σlocal = σdia + σpara + σIS + σring + σinter
where σdia represents the contribution from local diamagnetic electron currents in the vicinity
of nucleus I, σpara reflects anisotropic, non-spherical local electron circulations, the σIS term
represents the contribution from the magnetic anisotropy of neighbouring groups (31-32), σring
represents the effect of aromatic ring currents and σinter reflects the effect of intermolecular
interactions (hydrogen bonding, solvent effects) upon shielding.
For protns, the most important contributions to the chemical shift are the local
diamagnetic term dependent on the inductive and mesomeric effects, the shielding term
arising from shielding anisotropy of neighbouring bonds and the aromatic ring current effects.
The temperature dependence of the NH/OH proton chemical shifts can be considered
as a diagnostic tool for structure determination since it indicates the solvent accessibilty of the
proton. A small temperature dependence (< -3 ppb/K) in a non-competitive solvent indicates
small accessibility to solvent molecules of the proton in question which can be caused by
participation in hydrogen-bonding of the particular proton (33).
The most important shielding contributions in carbon NMR arise from the
hybridization state of the observed nucleus effecting local electron distribution, inductive
effects of substituents, van der Waals and steric effects between closely spaced nuclei, electric
fields originating from molecular dipoles or point charges, hyperconjugation, mesomeric
interactions in π-electron systems (delocalization effects), diamagnetic shielding due to heavy
substituents (‘heavy-atom’ effect), neighbour anisotropy effects and isotope effects (32).
Scalar spin-spin couplings
Scalar spin-spin coupling constants are widely applied to chemical structure
determination due to a large number of groundwork that related these parameters to
stereochemical and conformational features. (32, 34-37). The interpretation of the magnitudes
of coupling constants in an atomic level is difficult, therefore only selected coupling constants
relevant to biomolecular structure will be briefly summarized bellow.
Studies on carbohydrate derivatives have shown that the anomeric one-bond carbon-
proton coupling (32, 37) is sensitive to the configuration at C-1 (38). The 1JC1/H1 values in the
9
α and β anomers are ca. 170 Hz and ca. 160 Hz respectively. This correlation is fairly general,
and can therefore be used in cases, where the determination of 3JHH is difficult.
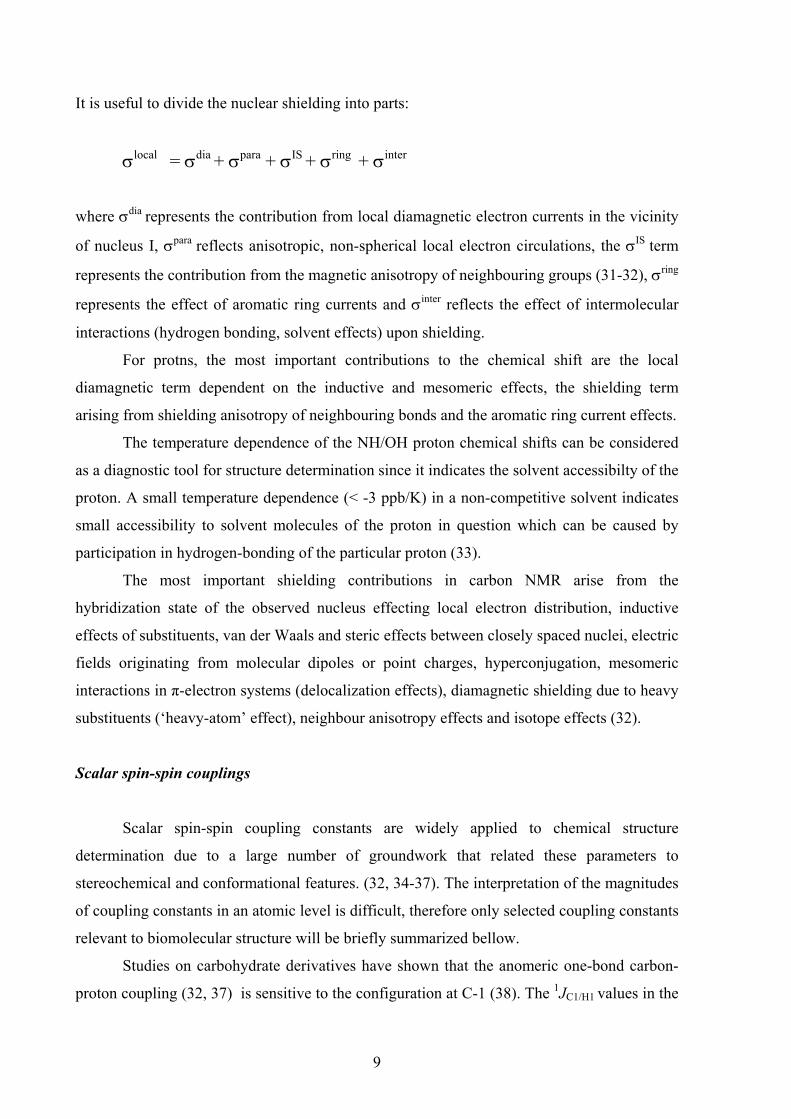
Probably the most useful spin-spin couplings are those involving nuclei separated
by three bonds. Experimentally and theoretically, these coupling constants are found to
vary with the torsion angle, ϑ according to the Karplus relation (plotted in Figure 2.1)(32,
39):
3JHH = A + B cosϑ + C cos2ϑ
Figure 2.1 Typical dependence of a three-bond coupling constant on the torsional angle ϑ
The utility of three-bond couplings lies principally in conformational analysis.
Determination of the interglycosidic bond geometry in oligosaccharides, assignment of the
diastereotopic C-6 methylene protons in glycosyl residues are based on vicinal couplings
between protons and/or protons and heteronuclei (34-37). The Karplus relation finds valuable
applications in studies of protein structures. Couplings between the amide and α protons in a
polypeptide chain provide information on the conformation of the protein backbone (35, 36,
40).
The interpretation of three-bond couplings in conformationally mobile molecules is
somewhat different. The three staggered conformations, or rotamers, interconvert rapidly so
that the observed 3J value is an average, weigthed according to the populations of the three
energy minima. Thus:
3J = Pg-Jg + Pg+Jg + Pt Jt
where Jt and Jg are the trans (ϑ = 180°) and gauche ( ϑ = ±60°) coupling constants, and Pg+
+ Pg- + Pt = 1. The relative populations of the three rotamers can therefore be determined,
provided Jt and Jg can be obtained from rigid model compounds.
10
The Nuclear Overhauser Effect
The NOE is an aspect of nuclear relaxation; it is defined as a change in intensity of a
resonance when the transitions belonging to another one are perturbed in some way. The
mechanisms, which drive relaxation, are related to molecular motion. (41) The NOE is as
follows:
ηI(s) = (I – I0) / I0 × 100
where I0 is the intensity of a resonance in thermal equilibrium and I the intensity while
saturating resonances of S.
According to the Solomon equation the steady-state NOE is proportional to the ratio
of the cross-relaxational (σIS) and the longitudinal relaxational rate (ρIS), and to the proportion
of gyromagnetic ratios (γ) between the pertubed and the observed nucleus:
γS σIS
Since the
cross cor
protons a
the distan
43) are
conforma
intraresid
assignme
Paramet
St
obtained
chemical
ηI(s) =
γS ρIS
longitudinal relaxational rate are fairly similar for protons in biomolecules and the
relational rate is strongly dependent on the distance between the crossrelaxing
nd on the reorientational time for the interproton vectors, hence the NOE is related to
ce between the two spins. One- and other multidimensional NOE experiments (42,
therefore powerful methods to furnish structural data and to investigate the
tional preferences of larger molecules in solution. The various inter- and
ual NOEs are a rich source of information for establishing sequence specific
nts and solution structures for peptides and proteins. (44)
ers measured in anisotropic liquids
ructural information present in orientation dependent spin interactions may be
in anisotropic liquids. NMR parameters obtained in this manner are the residual
shift anisotropy, the residual dipolar coupling and the residual quadrupolar coupling.
11
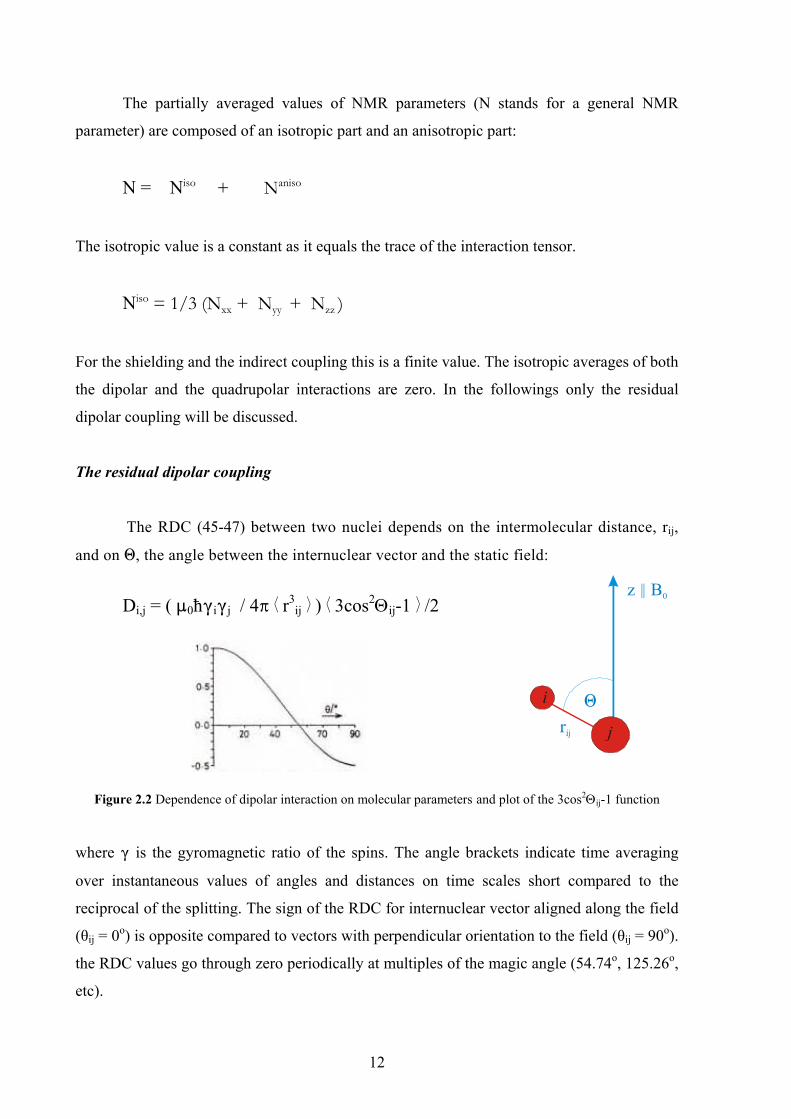
The partially averaged values of NMR parameters (N stands for a general NMR
parameter) are composed of an isotropic part and an anisotropic part:
N = Niso + Naniso
The isotropic value is a constant as it equals the trace of the interaction tensor.
Niso = 1/3 (Nxx + Nyy + Nzz )
For the shielding and the indirect coupling this is a finite value. The isotropic averages of both
the dipolar and the quadrupolar interactions are zero. In the followings only the residual
dipolar coupling will be discussed.
The residual dipolar coupling
The RDC (45-47) between two nuclei depends on the intermolecular distance, rij,
and on 1, the angle between the internuclear vector and the static field:
Di,j = ( :0ħ(i(j / 4Π ¢ r3ij ¦ ) ¢ 3cos2Θij-1 ¦ /2
z B2 0
i
j
1
Figure 2.2 Dependence of dipolar interaction on molecular parameters and plot of the 3cos2Θij-1 function
where ( is the gyromagnetic ratio of the spins. The angle brackets indicate time averaging
over instantaneous values of angles and distances on time scales short compared to the
reciprocal of the splitting. The sign of the RDC for internuclear vector aligned along the field
(θij = 0o) is opposite compared to vectors with perpendicular orientation to the field (θij = 90o).
the RDC values go through zero periodically at multiples of the magic angle (54.74o, 125.26o,
etc).
12

Interpretation of tensorial interactions is a complicated issue, because the
experimentally obtained information is a convolution of structural and dynamic contributions.
In solution state, the time dependence arises from several sources. These include fluctuations
in the internuclear distance, changes in the orientation of the internuclear vector with respect
to the magnetic field due to overall molecular reorientation as well as internal motions.
Deconvolution of the various contributions is required
It can assumed that the distance vibrations occur on very different time scales and thus
their averages can be computed independently (48). Therefore < r3ij > can be approximated as
simply r3ij
eff and omitting time averages. To separate effects of the overall molecular
reorientation and the internal motions, an intermediate coordinate system is introduced fixed
onto a rigid fragment of the molecule. Tumbling and alignment of this molecule fixed
coordinate frame (with axes denoted as Z, X, Y) with respect to the external magnetic field
(laboratory frame x,y,z, with z axis aligned along B0) reflects only the global reorientation,
but is independent of the internal motions.
z = B0
i
j
>
.
X
Z Y
2
N
Nz
Nx
Ny
z = B0
i
j
2x2z
2yZ Y
X
Figure 2.3 Introduction of laboratory frame as a polar coordinate system (left side) and as a Cartesian coordinate
system (right side). Angles characterizing structural information for a rigid subunit are in red, whereas the global
reorientation manifest in the time dependence of angles are in blue. (Notations of the angles follow the literature
(45, 10))
Thus, by the introduction of the molecular frame the internal motions are separated
from the global reorientation. The former is characterized by the angles between the
internuclear vector and the molecule fixed coordinates system. In polar coordinates, these are
the 2 and N, in Cartesian coordinates the Nz, Nx and Ny. In a general case these are time
dependent, whereas for a rigid subunit assuming no internal motions, they may be considered
being independent of time. Likewise, the overall reorientation is characterized by the time
13

dependent polar (ξ and ζ) or Cartesian angles (θz, θx, θy) between the molecular frame and the
laboratory frame.
The Saupe orientation tensor (49) or alignment tensor describes how the molecule
coordinate frame (Z, X, Y) is oriented in the laboratory frame (z, x, y). It was originally
formulated using Cartesian coordinates as follows:
S = SXx SXy SXz
SYx SYy SYz
SZx SZy SZz
SPq = ‹ 3 cos θp cos θq - δpq › / 2
z = B0
i
j
2Xx
2Zz
2Zy
Z Y
X
where P, q are Cartesian coordinate axes of the molecular and the laboratory frame,
respectively, θP, θq are angles between the molecular frame axis and the laboratory axis, δpq is
the Krönecker delta, p = q ⇒ δpq = 1, p ≠ q ⇒ δpq = 0 and angular brackets denote time
average. By using the order tensor the RDC is now:
Di,j = ( :0ħ(i(j / 4Π r3ij
eff ) G SPq cos (NP) cos (NQ)
The internal geometry is represented by the direction cosines describing the orientation of the
internuclear vector within the molecular frame, whereas the global reorientation is
characterized bythe Saupe order tensor. The tensor is symmetric and traceless; therefore 5
independent elements have to be determined.
Sxy = Syx Sxz = Szx Syz = Szy Sxx + Syy + Szz = 0
Measurements of five RDC 's corresponding to five independent dipolar interactions
combined with the knowledge of the structure of a rigid subunit assuming no internal
dynamics, allow the determination of the Saupe's order tensor.
Diagonalization of the order tensor that transforms the order tensor into a coordinate
frame where it is diagonal. This coordinate system is referred to as the principal axis frame
14

where the tensor is expressed only in terms of its principle values S'xx, S'yy, S'zz where |S'zz| >
|S'yy| > |S'xx|. The transformation relates the orientation of the principal alignment axes to the
initial molecular frame and is represented in terms of three Euler angles. The principle values
can be recast into a principal order parameter, Szz, and an asymmetry parameter, η which
describes the deviation from axially symmetric ordering:
η = Sxx -Syy Szz
: runs from 0 for an axially symmetric tensor to 1 for the tensor with the highest possible
asymmetry. The RDC can be expressed in a polar coordinate frame using principal
components of the order matrix as follows:
RDC = -Dstat S'zz (( 3/2 cos22 - 1/2) + (:/2 sin22 cos2N))
Dstat = :0ħ(i(j / 4Π r3ij
eff
where 2 and N are polar angles (depicted in Figure 2.3, left side) defining the orientation of
the internuclear vector with respect to the principle axis system of the alignment tensor, Szz is
the principal order parameter, : is the asymmetry parameter, Dstat is the static dipolar coupling
subsuming various physical constants.
NMR experimental techniques
The unique feature of NMR spectroscopy is its ability to define relationships between
specific nuclei within a molecule or even between molecules. This is generally obtained by
correlating one nucleus with another by exploiting the following phenomena (50):
- through-bond interactions: J couplings, via bonding electrons.
- through-space interactions: the nuclear Overhauser effect mediated through
manifestation of dipole-dipole coupling in spin relaxation
- chemical exchange: the physical exchange of spins with two different locations.
The homonuclear correlation experiment, COSY, (51, 52) identifies those nuclei that
share a J-coupling, which, for protons, operate over two, three and, less frequently, four
bonds. This information can therefore be used to indicate the presence of a bonding pathway.
The correlation of nuclei within the same coupled network or chain of spins established with
15

the aid of the TOCSY experiment (53-56). Crosspeak overlap in homonuclear correlation
spectra may be resolved by exploiting the higher chemical shift distribution of the
heteronuclei in experiments such as HMQC/HSQC-COSY/TOCSY (57-59). One-bond
heteronuclear correlation methods (HMQC or HSQC) (60-63) identify the heteroatoms to
which the protons are directly attached and can, for example, provide carbon assignments
from previously established proton assignments. Long-range heteronuclear correlations over
two- or three-bonds (HMBC) (64-66) provide a wealth of information on the skeleton of the
molecule and can be used to infer the location of carbon-carbon or carbon-heteroatom bonds.
These correlations can be particularly valuable when proton-proton correlations are absent. As
an alternative to the collection of a full 2D dataset, the 1D analogue (67-71) can prove
advantageous in some circumstances. The 1D equivalents of 2D sequences are in general
faster and can be recorded with higher digital resolution. Measurements based on the NOE
(41, 72-75) are used to define the 3D structure and stereochemistry of a molecule since this
effect maps through-space proximity between nuclei. In the case of medium sized molecules
the NOE become negligible. In such cases one can take advantage of the Rotating-frame
Overhauser Enhancement (ROE). (76-79, 41)
Measurement of coupling constants
There is a wide array of experimental methods (81) for the accurate determination of
coupling constants. Methods can be classified into two general categories on the basis of the
measured NMR parameter: frequency resolved methods and intensity-based methods. In
frequency resolved methods (82) the splitting of the signal caused the coupling between
nuclei is detected and the resulting characteristic lineshape is analysed to determine the
coupling constant. In the simplest case (weak coupling) the coupling can be extracted as a
frequency difference between peak maxima. Intensity-based approaches (83-86) utilize the
fact that the efficiency of magnetization transfer is dependent on the magnitude of the
coupling, therefore its value is encoded in, and can therefore be determined, from signal
intensity.
The frequency-resolved versus intensity-based methods are somewhat complementary
as they are often subject to different sources of systematic error. They also differ in
applicability to different ranges of molecular size as the frequency resolved methods suffer
from a degradation of precision as the linewidths increase. This fact makes them useful to
16
small to medium sized molecules while for macromolecules the attainable precision is limited
by the linewidths.
The issue of how much precision can be obtained from frequency domain spectra and
how the data can be most efficiently acquired is actually a complex problem (87). Possible
sources of multiplet splitting distorsions are the followings: the effects of transverse
relaxation (88) when linewidths are comparable to the magnitude of splittings, the effects of
cross-correlated relaxation manifested as differential line-broadening and the second order
dynamic frequency shift. (89)
The BIRD sequence
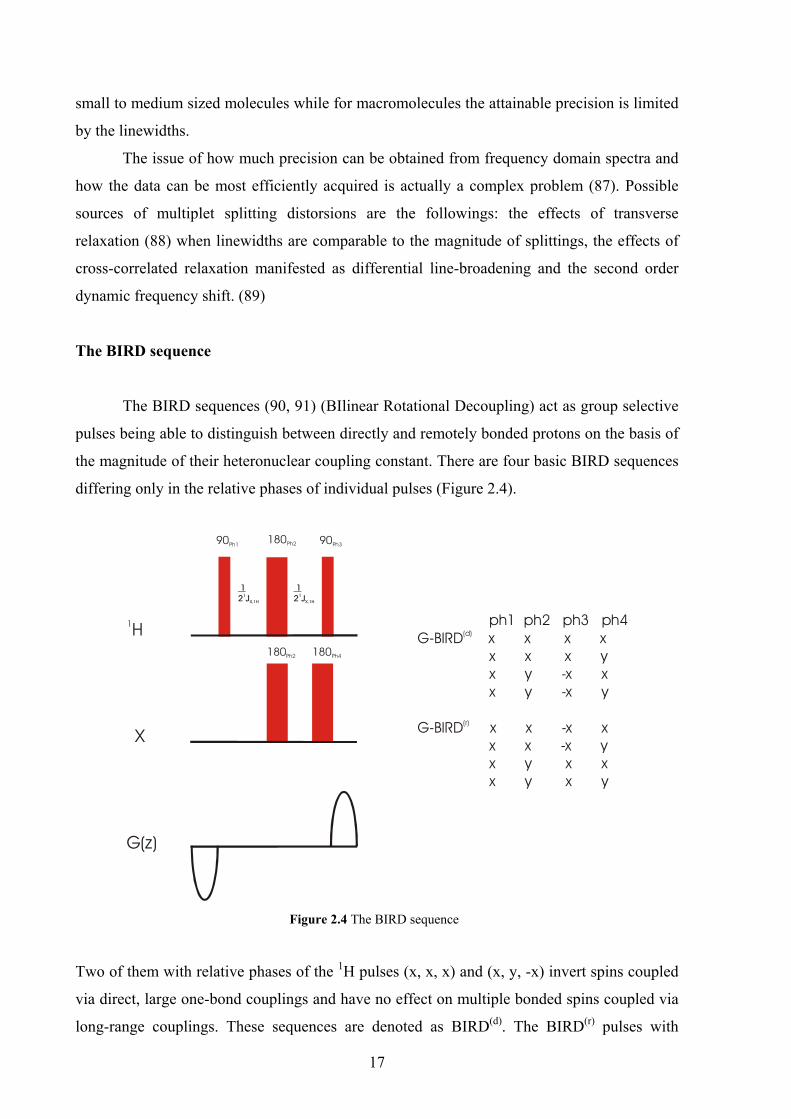
The BIRD sequences (90, 91) (BIlinear Rotational Decoupling) act as group selective
pulses being able to distinguish between directly and remotely bonded protons on the basis of
the magnitude of their heteronuclear coupling constant. There are four basic BIRD sequences
differing only in the relative phases of individual pulses (Figure 2.4).
1H
X
G(z)
90Ph1 90Ph3180Ph2
180Ph2
1 2 J1
X,1H
1 2 J1
X,1H
180Ph4
ph1 ph2 ph3 ph4G-BIRD x x x x x x x y
G-BIRD x x -x x x x -x y x y x x x y x y
(d)
(r)
x y -x x x y -x y
Figure 2.4 The BIRD sequence
Two of them with relative phases of the 1H pulses (x, x, x) and (x, y, -x) invert spins coupled
via direct, large one-bond couplings and have no effect on multiple bonded spins coupled via
long-range couplings. These sequences are denoted as BIRD(d). The BIRD(r) pulses with
17
relative phases on 1H pulses of (x, x, -x) and (x, y, x) have the opposite effect. The original
BIRD sequences also invert the magnetization of the heteronucleus thus preventing the
heteronuclear chemical shift evolution. This effect can be removed by the addition of a 180o
pulse on the heteronucleus simultaneously with the first or the last 90o 1H pulse. The BIRD(r)
sequence is surrounded by two gradients of opposite signs in order to purge out the fraction of
magnetization that does not experience perfect rotation by the sequence.
The DANTE sequence
Selective and bandselective pulses affect only a selected region of the spectral
window. There is two approach to produce such a selective pulse: soft pulses, which are of
longer duration on reduced radiofrequency power and preferably have a characteristic shape,
and the DANTE sequence (Delays Alternating with Nutation for Tailored Excitation) (92).
The DANTE sequence employs a series (N) of short hard pulses of tip angle α, where
α << 90o, interspersed with fixed delays (τ) for free precession:
[τ/2 - α - τ/2]N
The total length of the selective pulse is the product of N, τ, and tp, where tp is the duration of
each hard pulse and the net on-resonance tip angle is the sum of the individual pulses.
Limitations of the DANTE approach arise when very small τ durations are required
which pulse transmitters are unable to deliver. Another complication is the presence of strong
sidebands at multiples of the hard pulse frequency, 1/ τ. If only a single spectral window is
required to be affected by the pulse, then the hard pulse repetition frequency must be adjusted
by varying τ to ensure that the sidebands do not coincide with other resonances.
The DANTE sequence is still a method of choice on older instruments or on newer
ones without waveform generations, but its simplicity in terms of calibration (only one
parameter, τ to be adjusted) is still a major advantage.
Excitation sculpting
Recent methods have combined selective pulses with pulse field gradients to produce
experimentally robust sequences with a number of desirable properties. They are based on
pulse field gradient spin-echo sequences (PFGSE):
18
G - S - G
where G is the gradient and S represents any selective 180o pulse scheme. The bracketing
gradients are identical and act in opposition for those spins, which experience the selective
inversion pulse and thus, the second gradient refocus the dephasing effect of the first one.
Spins outside the selectively affected bandwidth do not experience the pulse and are
influenced by the cumulative effects of the gradients and become fully dephased in the
transverse plane and thus become unobservable. The gradient echo therefore achieves clean
resonance selection according to the profile of pulse S. The phase profile of the selected
resonances is also dictated by the phase properties of the selective pulse S, which may not be
ideal. Repeating the gradient echo (with a different gradient strength to avoid refocusing of
the previously dephased unwanted magnetisation) cancels any remaining phase errors and the
resulting pure-phase excitation profile depends on the inversion properties of the selective
pulse. The double pulse field gradient spin-echo sequence (DPFGSE) (93-94) is therefore the
following:
(G1 - S - G1) (G2 - S - G2)
Experimentally it is an enormous benefit since it makes implementation of the selective
sequence straightforward and gradients ensure excellent suppression of unwanted resonances.
19

2. 2 Methods for structure calculation
Computational chemistry or molecular modelling is an increasingly useful tool in
modern chemistry. Many chemical and physical properties can be calculated with theoretical
methods, most of them, however, require knowledge about the 3D structure of the molecular
system to be studied.
Molecular modelling studies involve three stages. First, the level of theory is selected
by which the internal potential energy (Epot) is calculated. The alternatives are the followings:
the quantum theory at different level of simplification or the molecular mechanics. These
models enable the energy of any arrangement of atoms and molecules in a system to be
calculated, and to determine how the energy of the system varies as the positions of the atoms
and molecules change. After the selection of the appropriate model and the desired property,
the calculation is carried out, such as energy minimization, a molecular dynamics, a Monte
Carlo simulation, a conformational search, etc. Finally, the calculation must be analysed to
compute molecular properties.
Potential energy of the molecular system
The concept of potential energy surfaces (PES) is central to computational chemistry
(95). The internal energy consists of the kinetic energy (Epot) resulting from motion and the
potential energy (Epot) resulting from position of the atoms or configuration of molecules
within a force field. In an isolated system the total internal energy of the system is constant as
stated by the principle of conservation of energy. The PES describes the energy of a molecule
in terms of its structure, as a function of the nuclear coordinates. The structure, energetics,
properties, reactivity, spectra and dynamics of molecules can in principle be understood in
terms of the PES. For all except the simplest system, the Epot is a complicated,
multidimensional function of the coordinates. Therefore a wide array of methods has been
developed for exploring the PESs. Calculations examine thePES using single point
calculations, optimisations, and molecular dynamic simulations and other simulation
procedures.
Particularly interesting points are the stationary points on the PES (Figure 2.5), where
the first derivative of the Epot is zero with respect to the internal or Cartesian coordinates. At a
20

stationary point the forces on all the atoms are zero. Minimum points are correspond to stable,
equilibrium geometries. There may be a very large number of minima on the PES. The
minimum with the very lowest energy is known as the global energy minimum.
Thermodynamics and kinetics of reactions can be calculated from the energy of the minima
for reactants, products and transition states. The shape of the valley around a minimum as
given by the second derivative or Hessian, determines the vibrational spectrum. Each
electronic state of a molecule has a separate potential energy surface, and the separation
between these surfaces yields the electronic spectrum. Properties of molecules such as dipole
moment, polarizability, NMR shielding, etc. depend on the response of the energy to the
applied electric and magnetic fields.
Figure 2.5 The potential energy surface with important points indicated
Mathematical models for the calculation of the Epot involve quantum theories
including quantum mechanics (ab-initio, semiempirical models) and density functional theory
and classical approaches such as molecular mechanics (force-field based) methods.
Quantum theories versus molecular mechanics
There are a number of quantum theories at different level of simplification for treating
molecular systems such as the molecular orbital theory (ab-initio), the semi-empirical
methods, the Hückel theory and the valence bond theory. An other alternative is the density
functional theory.
Quantum mechanics deals with the electrons in a system, so a large number of
particles must be considered and calculations are time-consuming. Force field methods ignore
21

the electronic motions and calculate the energy of a system as a function of the nuclear
positions only.
Molecular mechanics (96) assumes that the energy of a molecular system comprises
additive and non-interacting terms. These are the sum of all diatomic bond stretches, the sum
of all tri-atomic bond angle deformations, the sum of all tetra-atomic bond torsions, the sum
of all non-bonded van der Waals repulsions and the sum of all electrostatic attractions of
individual bond dipoles. Each of these functions are mathematically extremely simple and
computationally fast to evaluate, provided that simple parameters such as stretching force
constants, bond dipole moments, etc. are known. The total potential energy is the sum over all
these terms.
Epot = Ebond + Evalence angle + Etorsion angle + Eelectrostatic + Evan der Waals
The goal of a forcefield is to describe entire classes of molecules with reasonable
accuracy. In a sense, the forcefield extrapolates from the empirical data of a small set of
models, used to parametrize the forcefield, to a larger set of related models.
Molecular mechanics of course cannot provide properties that depend upon the
electronic distribution in a molecule. Applications beyond the capability of most forcefield
methods include for instance: electronic transitions (photon absorption), electron transport
phenomena, proton transfer (acid/base reactions), and stereoelectronic effects.
Molecular mechanics for carbohydrates
The force-field specifically developed for carbohydrates is the HSEA (Hard Sphere
Exo-Anomeric) force field (97-98). The approximation of the HSEA methods is to treat each
monosaccharides building up an oligosaccharide as rigid geometry units and considering only
variations in the interglycosidic torsion angles. The glycosidic linkage is influenced by
electronic and steric factors: stereoelectronic effects such as the exo-anomeric effect, non-
bonding attractions-repulsions between atoms and interresidual H bonds.
The exo-anomeric effect
The exo-anomeric effect (99, 100) relates to the preference of the aglycone atom for
the synclinal position around the glycosidic C-O bond. The exo-anomeric effect causes the
aglyconic atom to assume an orientation in which M is ~+60o in $-glycosides and ~-60o (or
22
300o) in "-glycosides. Shortening of the C1-O1 bond is also the geometrical consequence of
the exo-anomeric effect.
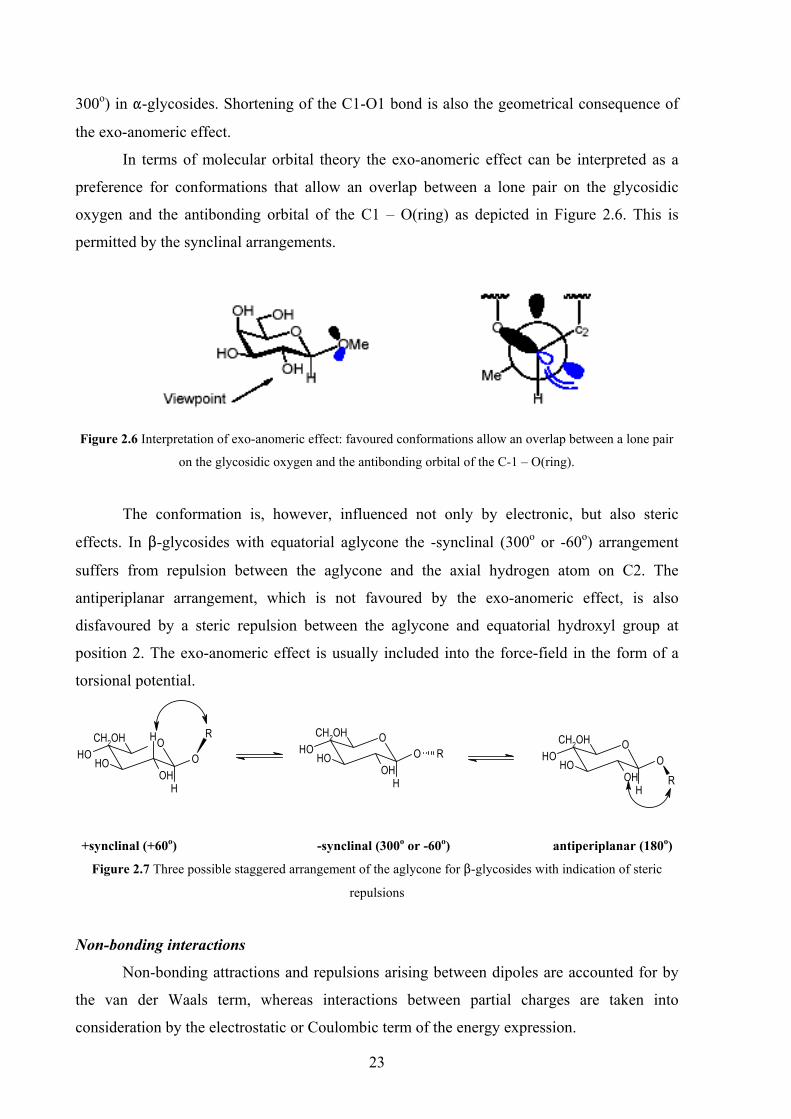
In terms of molecular orbital theory the exo-anomeric effect can be interpreted as a
preference for conformations that allow an overlap between a lone pair on the glycosidic
oxygen and the antibonding orbital of the C1 – O(ring) as depicted in Figure 2.6. This is
permitted by the synclinal arrangements.
Figure 2.6 Interpretation of exo-anomeric effect: favoured conformations allow an overlap between a lone pair
on the glycosidic oxygen and the antibonding orbital of the C-1 – O(ring).
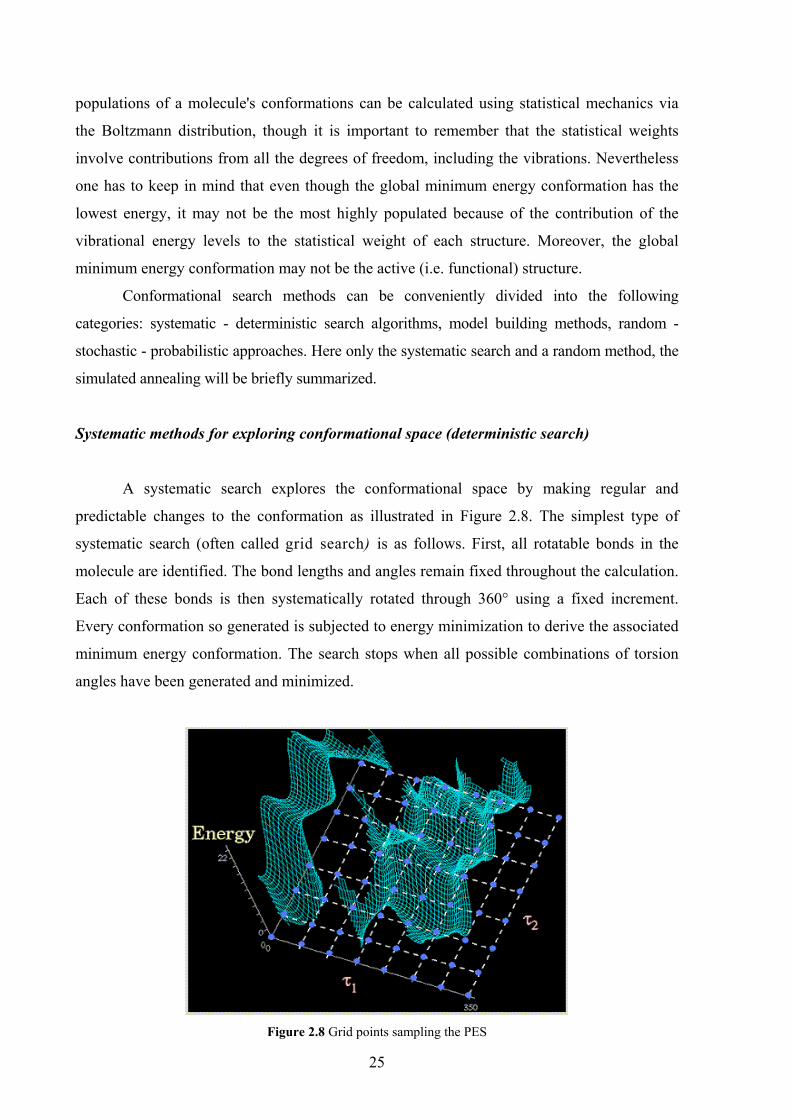
The conformation is, however, influenced not only by electronic, but also steric
effects. In $-glycosides with equatorial aglycone the -synclinal (300o or -60o) arrangement
suffers from repulsion between the aglycone and the axial hydrogen atom on C2. The
antiperiplanar arrangement, which is not favoured by the exo-anomeric effect, is also
disfavoured by a steric repulsion between the aglycone and equatorial hydroxyl group at
position 2. The exo-anomeric effect is usually included into the force-field in the form of a
torsional potential.
H
OOHO
OHOH
CH2OH H
H
OOHO
OHOH
CH2OH
R
H
OOHO
OHOH
CH2OH
R
R
+synclinal (+60o) -synclinal (300o or -60o) antiperiplanar (180o)
Figure 2.7 Three possible staggered arrangement of the aglycone for $-glycosides with indication of steric
repulsions
Non-bonding interactions
Non-bonding attractions and repulsions arising between dipoles are accounted for by
the van der Waals term, whereas interactions between partial charges are taken into
consideration by the electrostatic or Coulombic term of the energy expression.
23

H bonds
H bonds are accounted for either by explicitly including a separate H bonding term
into the energy expression of the force field or arise from the van der Waals interaction
between the donor and acceptor groups.
Hydrogen bonds (101) are generally identified by geometric and energetic criteria.
Energetically, hydrogen bonds are favoured, if in the equilibrium between bonded and non-
bonded systems, the hydrogen bonded system is lower in energy. The geometric criteria
involve a characteristic distance and an angle. If the distance between the hydrogen and the
acceptor is significantly smaller than the sum of the van der Waals radii for the two atoms,
then a hydrogen bond is present. For the hydrogen - oxygen pair, the van der Waals radius of
O is ca. 1.4Å and that of H is about 1.2Å yielding a sum of 2.6Å. As for the angle criterion it
must be considered that the hydrogen share a nonbonding orbital with the acceptor in addition
to its bonding orbital. So the angle formed by the three atoms must make either a tetrahedral
or trigonal planar angle. But in reality this ideal geometry cannot be expected in every case.
Solvent effects
Carbohydrates in polar solvents usually form H bonds only to neighbouring molecules,
mainly solvent molecules, while simulation in vacuum is dominated by conformations
stabilized by intramolecular H bonds (102) where the coulombic and H bonding terms are
overestimated. Stable conformers will be predicted arising from H bond stabilization where
none exists because of competition of solvent molecules for H bonding partners.
Several different approaches have been proposed to treat solvation effects (103). In the
simplest approach the dielectric constant is set distance dependent which will simulate the
damping effect of the solvent. An alternative strategy is to set the dielectric constant to a high
value, which will achieve a similar effect except that electrostatic interactions are not scaled
in favour of small internuclear distances. An alternative approach is to treat the solvent as a
dielectric continuum by adding a solvent specific energy term to the energy expression of the
force field (102). The best approach is the inclusion of explicit solvent molecules into the
calculation, this, however,considerably increases the computation time.
Conformational analysis
The conformational analysis locates conformations that are at minimum points on the
energy surface, that is, those corresponding to the equilibrium geometries. The relative
24
populations of a molecule's conformations can be calculated using statistical mechanics via
the Boltzmann distribution, though it is important to remember that the statistical weights
involve contributions from all the degrees of freedom, including the vibrations. Nevertheless
one has to keep in mind that even though the global minimum energy conformation has the
lowest energy, it may not be the most highly populated because of the contribution of the
vibrational energy levels to the statistical weight of each structure. Moreover, the global
minimum energy conformation may not be the active (i.e. functional) structure.
Conformational search methods can be conveniently divided into the following
categories: systematic - deterministic search algorithms, model building methods, random -
stochastic - probabilistic approaches. Here only the systematic search and a random method, the
simulated annealing will be briefly summarized.
Systematic methods for exploring conformational space (deterministic search)
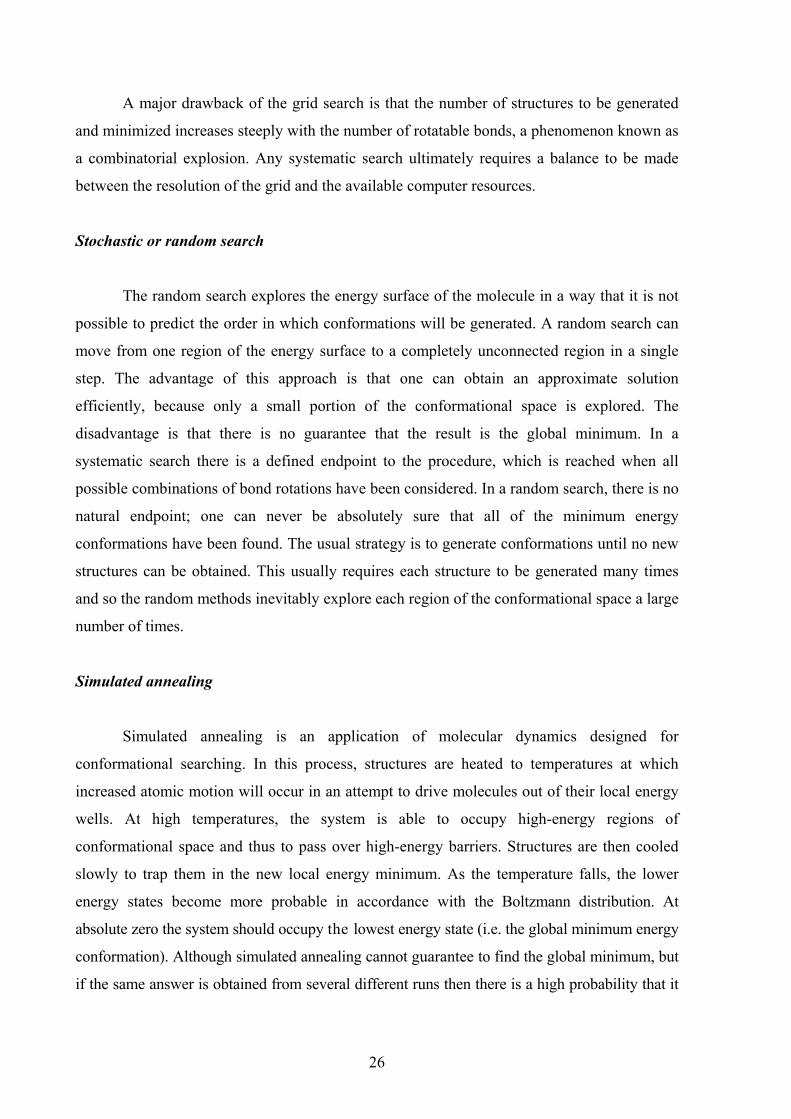
A systematic search explores the conformational space by making regular and
predictable changes to the conformation as illustrated in Figure 2.8. The simplest type of
systematic search (often called grid search) is as follows. First, all rotatable bonds in the
molecule are identified. The bond lengths and angles remain fixed throughout the calculation.
Each of these bonds is then systematically rotated through 360° using a fixed increment.
Every conformation so generated is subjected to energy minimization to derive the associated
minimum energy conformation. The search stops when all possible combinations of torsion
angles have been generated and minimized.
Figure 2.8 Grid points sampling the PES
25
A major drawback of the grid search is that the number of structures to be generated
and minimized increases steeply with the number of rotatable bonds, a phenomenon known as
a combinatorial explosion. Any systematic search ultimately requires a balance to be made
between the resolution of the grid and the available computer resources.
Stochastic or random search
The random search explores the energy surface of the molecule in a way that it is not
possible to predict the order in which conformations will be generated. A random search can
move from one region of the energy surface to a completely unconnected region in a single
step. The advantage of this approach is that one can obtain an approximate solution
efficiently, because only a small portion of the conformational space is explored. The
disadvantage is that there is no guarantee that the result is the global minimum. In a
systematic search there is a defined endpoint to the procedure, which is reached when all
possible combinations of bond rotations have been considered. In a random search, there is no
natural endpoint; one can never be absolutely sure that all of the minimum energy
conformations have been found. The usual strategy is to generate conformations until no new
structures can be obtained. This usually requires each structure to be generated many times
and so the random methods inevitably explore each region of the conformational space a large
number of times.
Simulated annealing
Simulated annealing is an application of molecular dynamics designed for
conformational searching. In this process, structures are heated to temperatures at which
increased atomic motion will occur in an attempt to drive molecules out of their local energy
wells. At high temperatures, the system is able to occupy high-energy regions of
conformational space and thus to pass over high-energy barriers. Structures are then cooled
slowly to trap them in the new local energy minimum. As the temperature falls, the lower
energy states become more probable in accordance with the Boltzmann distribution. At
absolute zero the system should occupy the lowest energy state (i.e. the global minimum energy
conformation). Although simulated annealing cannot guarantee to find the global minimum, but
if the same answer is obtained from several different runs then there is a high probability that it
26
corresponds to the true global minimum. Several simulated annealing runs may enable a series
of low energy conformations of a molecule to be obtained.
The simulated annealing has the property that it allows uphill directions. This property
allows the search to escape from local wells by moving uphill, therefore it has the ability to
avoid being trapped at a local minima.
Analysis of simulations
Calculations will generate a large amount of conformers which must be analysed.
Clustering of conformations will select conformational families, the members of which are
similar to each other regarding selected molecular parameters. Conformational energy
differences are typically very small (in the order of 1-5 kcal/mol) and even small errors might
lead to incorrect assignment of global minimum conformer.
27

28

CONFORMATIONAL STUDIES
29

3. CONFORMATIONAL INVESTIGATIONS OF MODIFIED
CELL WALL PEPTIDES
NMR and molecular modelling investigations were carried out on novel lipophilic
derivatives of the monomeric peptidoglycan of the bacterial cell wall. In order to understand
the importance of such studies the role of the bacterial cell wall and its biological significance
is briefly described. Then follows a survey of literature on conformational investigations of
natural or synthetic peptidoglycan fragments or derivatives. Finally conclusions of the
conformational investigations on the new synthetic derivatives are discussed.
3.1 The unique cellular structure in bacteria: the cell wall
Bacteria are single-cell, microscopic organisms that lack a nuclear membrane around
their genetic material, therefore are called prokaryotic. A general scheme of the most common
cellular organelles in bacteria is depicted in Figure 3.1. The most important internal structures
are the cytoplasm, the nucleotide region containing the genetic material and the ribosomes
which are the protein synthesizing factories of the cell. The inner material is separated from
the rest of the world by the cellular membrane and the cell wall
.
Figure 3.1 Universal structures in bacteria
Eukaryotic and prokaryotic cells by definition are distinguished on the basis of the
presence or absence of the nuclear membrane around their genetic material. Another
important difference between them is the presence or composition of the cell wall. Eubacteria
and Archaebacteria are two major classes of bacteria, both are prokaryotic, but peptidoglycan
30

containing cell wall can only be found in the cells of Eubacteria. The Archaebacteria also
have a cell wall, but it is composed of proteins, a complex carbohydrate, or other unique
molecules but not peptidoglycan. Eukaryotic cells of plant cells, algae, and fungi also have
cell walls which are usually composed of cellulose or chitin but never contain peptidoglycan.
Animal cells and protozoans, which are also eukaryotic, lack cell walls. The fact that the cell
wall of Eubacteria is composed of peptidoglycans not found in other species, can be exploited
in fighting against bacterial infections.
The membrane and the cell wall carry out different functions. The membrane is
composed of a bilayer of phospholipids embedded with proteins. It serves as an osmotic
barrier preventing the flow of material into the cell, where the solute concentration is much
higher than in the surroundings of the cell. The membrane must also act as a selective barrier
since the cell needs to get nutrients in and waste out. The cell membrane is able to prevent
most molecules getting inside the cell, but not for water. There is also a great pressure on the
membrane from the interior. Without something supporting the membrane the cell would
swell and burst. It is the cell wall that protects bacteria from osmotic lysis and also determines
the shape of the cell. The cell wall is therefore a critical structure in Eubacterial cells.
Figure 3.2 The structure of the peptidoglycan polymer and the composition of the peptidoglycan monomer
The cell wall is composed of peptidoglycan. The peptidoglycan, also called murein, is
a semirigid polymer consisting of interlocking chains of identical glycopeptide subunits as
can be seen in Figure 3.2, left side. A peptidoglycan monomer (Figure 3.2, right side) consists
of two joined amino sugars, β-1,4-linked N-acetyl-D-glucosamine (NAG, GlcNAc) and N-
31
acetylmuramic acid (NAM, MurNAc), with a tetrapeptide consisting of alternating L- and D-
amino acids connected to the NAM. These monomers are then bonded together to form
glycan chains. The individual glycan chains are then linked to one another by means of
pentaglycine cross links between the tetrapeptides coming off of the NAMs. These cross
bridges linking the rows of sugars together provide tremendous strength to the cell wall,
functioning much like a molecular chain fence around the bacterium.
3.2 Biological activity and conformation of peptidoglycans
Peptidoglycan fragments and substances derived from them exhibit versatile biological
activities that depend upon size and composition (104).
One of the most prominent and also well-documented activities of peptidoglycans is
the effect on the mammalian immune system. The immune system recognizes the material of
the bacterial cell wall as antigens and consequently induces immune defences in the host to
defend the body against bacterial infection. The immune response is stimulated even without
the presence of the actual infection and creates the basis for active immunization against
bacterial disease. Low molecular weight peptidoglycan fragments, either obtained from
natural sources or prepared synthetically, are mostly devoid of the toxic properties
characteristic for large peptidoglycans, but still retain marked immunomodulating activity
(105-108).
Immunomodulators are also used in cancer immunotherapy that aims to find
immunological manoeuvres that can raise host anticancer reflections (109-112). The two
branches of the immune response – humoral and cell-mediated – act both independently and
in concert to combat tumour progression, the success of which depends on the
immunogenicity of the tumour cells. Despite the immune system is able to discriminate
between transformed cells and normal cells by virtue of the presence of unique antigens on
tumour cells, it is, however, not always able to detect and kill cancerous cells because various
strategies have also evolved to escape immune surveillance. Attempts are being made to
trigger the immune system into an early and efficient response against malignant cells, and
various therapeutic methods are being developed to enhance the strength of the immune
response against tumours. Many substances endowed with immunomodulating properties
have therefore been developed and studied for antitumor activity.
32
If the structural basis of the biological functions could be inferred from spectroscopic
studies, it would be of value in design of analogues. Therefore the next section summarizes
conformational investigations on low molecular weight peptidoglycans.
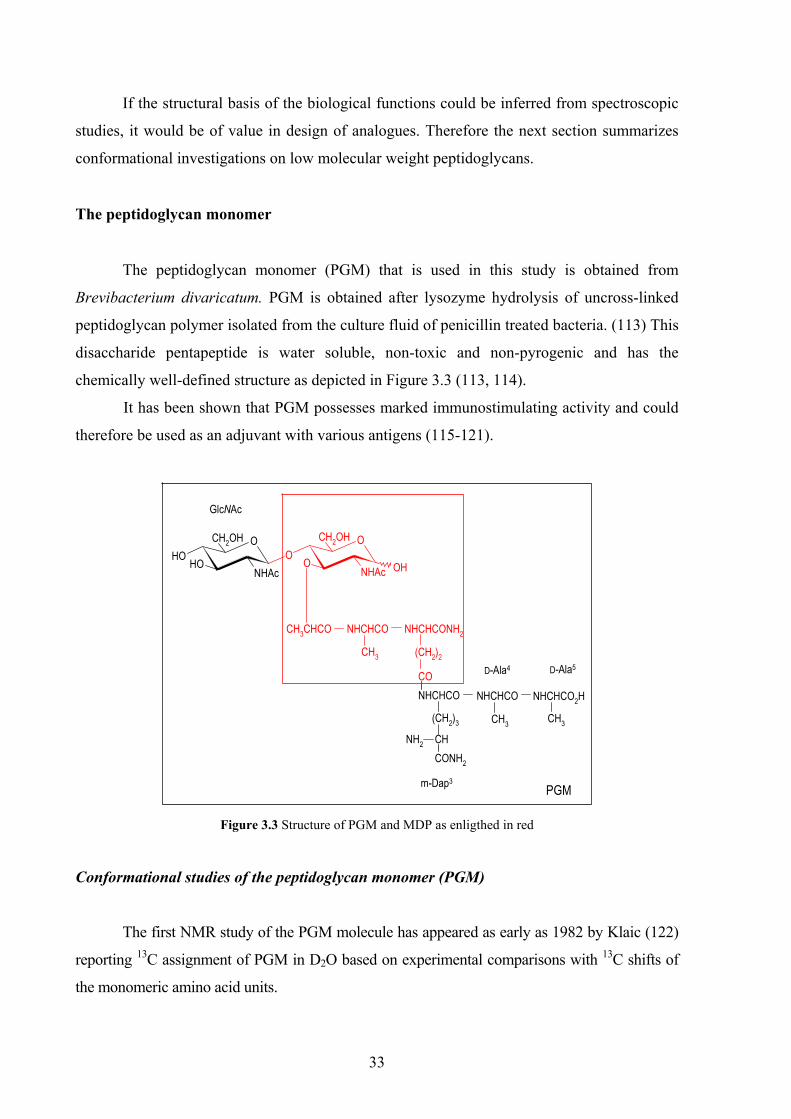
The peptidoglycan monomer
The peptidoglycan monomer (PGM) that is used in this study is obtained from
Brevibacterium divaricatum. PGM is obtained after lysozyme hydrolysis of uncross-linked
peptidoglycan polymer isolated from the culture fluid of penicillin treated bacteria. (113) This
disaccharide pentapeptide is water soluble, non-toxic and non-pyrogenic and has the
chemically well-defined structure as depicted in Figure 3.3 (113, 114).
It has been shown that PGM possesses marked immunostimulating activity and could
therefore be used as an adjuvant with various antigens (115-121).
NHCHCO NHCHCONH2
(CH2)2
CO
CH3
O
CH3CHCO
OHO
O
NHAc
CH2OH
MurNAc
D-iGln2L-Ala1
MDP
NHCHCO
OHOHO
NHAc
CH2OH
NHCHCO2HNHCHCO
(CH2)3
CHCONH2
CH3 CH3
NH2
GlcNAc
D-Ala4
m-Dap3
D-Ala5
PGM
Figure 3.3 Structure of PGM and MDP as enligthed in red
Conformational studies of the peptidoglycan monomer (PGM)
The first NMR study of the PGM molecule has appeared as early as 1982 by Klaic (122)
reporting 13C assignment of PGM in D2O based on experimental comparisons with 13C shifts of
the monomeric amino acid units.
33
1H and 13C NMR pH titrations have been carried out (123) in order to determine the
number and the positions of free amino and carboxyl groups. PGM was shown to consume equal
amounts of acid and base, hence it was concluded that it contains equal numbers of charged
groups. The pH dependence of signals showed that PGM contains two dissociable groups,
namely the carboxyl group of the C terminal alanine and the amino group of the mDap3 at the D
chiral center.
Later a preliminary investigation in DMSO solution by 1H NMR spectroscopy has been
reported (124). It has been suggested that the DAla5-NH group is involved in H bonding as
indicated by the amide proton chemical shift temperature dependencies. As a H bond donor
the DiGln2-δCO was proposed on the basis of the assumption that the DiGln2 residue in
question is rotationally restricted, although this latter argument is based on the large chemical
shift non-equivalence for the DiGln2-βCH2 protons. A cyclic structure was proposed for the
C-terminal pentapeptide of PGM that was supported by NOE interactions involving the
DiGln2 and the MurNAc residues.
A detailed conformational study of PGM in aqueous solution was carried out by Matter
et. al. in 1997 using a combined approach of 2D NMR spectroscopy, restrained simulated
annealing (SA) and molecular dynamics (MD) calculations (125). From simulated annealing, a
set of conformers was obtained, all characterized by a well-defined extended N-terminal
peptide part additionally stabilized by the bound disaccharide. The C-terminal part, on the
other hand, exhibited more conformational flexibility in agreement with experimental data
and MD simulations. Not only the interglycosidic bond but also the glycopeptide linkage was
proven to exist in a single, well-defined conformation, for which no conformational changes
were detected during the MD simulations. In contrast, conflicting experimental data for the N-
acetyl group of GlcNAc was found and explained using a conformer population analysis
based on ROE intensities and coupling constants accounting for a conformational equilibrium
with one dominantly populated rotamer. It was demonstrated that in the preferential
conformation in aqueous solution, the ε-amino group of mDap is exposed and, therefore,
readily available for possible chemical reactions.
Fragments: the muramyl-dipeptide (MDP)
Many fragments can be obtained from the bacterial cell wall depending on the micro-
organism, direction of the fermentation process and on the use of different enzymes or
chemical treatment for the hydrolysis of the peptidoglycanic polymers. The smallest known
biologically active unit with the peptidoglycanic structure is the N-acetyl-muramyl-dipeptide
34

(MDP) (structure can be seen in Figure 3.3 inside), which is a monosaccharide-dipeptide. This
simple glycopeptide elicit immunomodulatory and other biological effects. Several studies
appeared to reveal conformational characteristics by NMR and molecular modelling methods
(126-133).
Complexes
It was proposed, that partial hydrophilic character of the PGM molecule could be
modified by complexation of PGM with bivalent metals (134-135), since the coordination of
the metal with active hydrophilic groups as possible coordination sites may enforce
rearrangement of the lipophilic parts of the molecule. Another reason for the preparation of
bivalent metal complexes is based on the fact that metals could play an important role in the
stability, distribution, biotransformation and elimination of biologically active substances.
Dervatives
A large number of novel compounds representing smaller parts of the original PGM
molecule have been synthesized and found to possess immunomodulating properties (136-
137). Structurally related compounds that have been derived from MDP can roughly be divided
into three groups:
1. compounds that have a modified peptide moiety
2. compounds that have a modified N-acetylmuramyl structure
3. des-muramyl peptides
3.3 Novel derivatives with increased lipophilicity
Outstanding hydrophilicity and the weak lipophilic character of PGM may be
modified by preparation of derivatives bearing apolar groups. In this manner a new
equilibrium between the hydrophilic and the lipophilic nature of the molecule is established
which may have an influence on the immunomodulating effect by inducing a prolonged
activity in vivo and increase the affinity against target cells.
Two novel derivatives of PGM, namely, (adamant-1-yl)-CH2CO-PGM (Ad-PGM)
(138) and tert-butyloxycarbonyl-L-tyrosyl peptidoglycan monomer (BocTyr-PGM) (139)
starting from the unprotected PGM molecule have been synthesized. The structures are
35

depicted in Figure 3.4. Both derivatives exhibited immunostimulating activity comparable to
the activity of the parent PGM. (138-140)
NHCHCO NHCHCONH2
(CH2)2
CO NHCHCO NHCHCO2HNHCHCO
CH3
(CH2)3
CHCONH2NH
R
CH3 CH3
OHOHO
NHAc
CH2OH
O
CH3CHCO
OHO
O
NHAc
CH2OH
CH2COCH2OH CH CO
NHBoc
H
GlcNAc MurNAc
D-isoGln2
L-Ala1
D-Ala4 D-Ala5
Ada-CH2CO- BocTyr-
1 2 3
R=
mDap3
D-Lac
12
3
4
5
6
12
3
4
5
6
Figure 3.4 Structures of PGM, Ad-PGM and BocTyrPGM
All three compounds are substrates for N-acetylmuramyl-L-alanine amidase, as well.
The results indicated that the substitution of the free amino group in the PGM molecule with
bulky lipophilic substituents did not markedly affect either the immunostimulating activity or
the susceptibility towards hydrolysis by N-acetylmuramyl-L-alanine amidase.
In view of the similar in vivo behaviour of these three compounds, it was of interest to
determine whether these activities are related to similarities in the molecular conformations
or, on the opposite, eventual conformational differences may not exert sizeable influence on
the biological activity. We have therefore conducted a comparative study of the
conformations of the synthetically modified derivatives Ad-PGM and BocTyr-PGM with
respect to the unsubstituted PGM using NMR spectroscopy and molecular modelling. In
particular full assignments of the 1H and 13C spectra, using 2D NMR techniques, for all three
compounds in DMSO solutions were obtained. NOESY/ROESY experiments have provided
36

interproton distance restraints that were used in distance geometry modelling calculations to
derive conformational preferences for each of these molecules. These data were supplemented
with information available from chemical shifts, temperature dependence of amide proton
shifts and proton-proton scalar couplings.
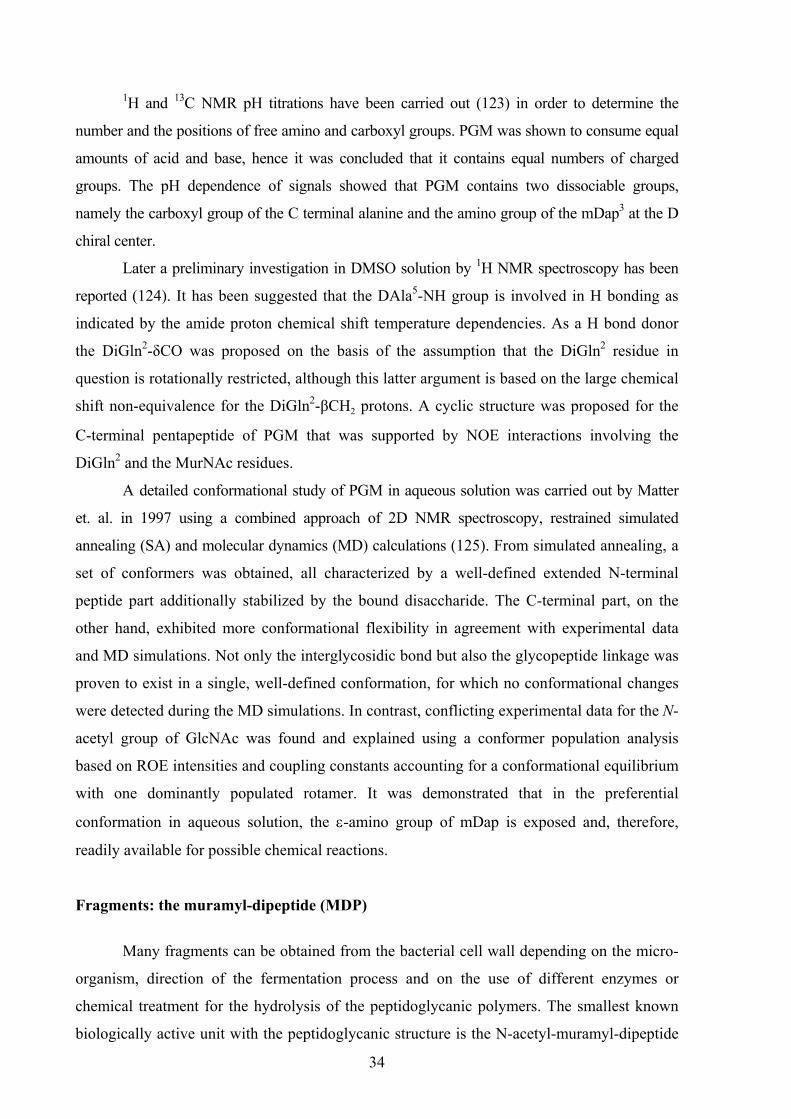
3.4 Results and discussions The relevant NMR spectral data are summarized in Table 3.1 (chemical shifts), 3.4
(proton-proton couplings and amide proton temperature coefficients) and 3.2 (selected
NOEs). The entire list of data for Tables 3.1 and 3.2 can be found in Appendix A and B,
respectively. In the course of the discussion only smaller parts of the Tables 3.1 and 3.2
containing relevant data are inserted. NOEs only for the dominant isomer with the reducing
MurNAc moiety in α-anomeric form are listed.
Comparison of the data obtained for the parent molecule PGM and the derivatives Ad-
PGM and BocTyr-PGM revealed differences in various conformation-related NMR
parameters, such as amide 1H chemical shifts (Table 3.1) and their temperature dependence
(Table 3.4) as well as 1H/1H NOEs (Figure 3.5, Table 3.2). On the other hand, no significant
differences were observed in the 3J(NH,Hα) values (Table 3.4).
The geminal protons of the Dap-CONH2 group display conspicuously large chemical
shift non-equivalence (ca. 0.8 ppm) in the unsubstituted parent molecule PGM mainly as a
result of a sizeable downfield shift of the resonance for NH2E (see in Table 3.3). CONH2
Z
and CONH2E refer to one of the amide protons in Z or E position with respect to the C=O
oxygen, respectively. The downfield shift of the NH2Z resonance is much less pronounced
with respect to those in the substituted derivatives Ad-PGM and BocTyr-PGM, whereas shifts
of CONH2 proton resonances of the iGln-residue are very similar in all three compounds and
also show reduced shift non-equivalences (see Table 3.1).
Table 3.3 Part of Table 3.1: 1H and 13C chemical shift data for PGM, Ad-PGM and BocTyr-PGM
PGM Ad-PGM BocTyr-PGM 1H 13C 1H 13C 1H 13C
m-Dap3-εCONH2E 8.107 - 7.248 - 7.355 - m-Dap3-εCONH2Z 7.287 - 6.912 - 6.938 -
The temperature coefficients for all CONH2 protons are in the range of -5 to -7 ppb/K
except that for Dap-CONH2E in PGM which is ca. twice as large (Table 3.4). The resonance
37

shift and non-equivalence effects observed for Dap-CONH2 protons in PGM are therefore
unlikely to be caused by protection from the solvent through H-bonding; rather, they may be
related to steric/conformational differences with respect to Ad-PGM and BocTyr-PGM that
both bear bulky substituents attached to the end of the Dap side chain.
Table 3.4 1H NMR coupling constants and amide temperature coefficients for PGM, Ad-PGM and BocTyr-
PGM
Residue 3J(NH,Hα) [Hz] ∆δ/∆T [-ppb/K]
PGM Ad-PGMBocTyr-
PGM PGM Ad-PGM
BocTyr-
PGM
β-GlcNAc 8.4 (8.4a; 9.6b) 7.6 8.4 5.4 (11.8b) 4.5 4.4
α-MurNAc 5.7 (7.9a; 7.5b) 5.7 6.1 11.7 (4.3b) 11.4 10.0
L-Ala1 ~7 (8.0a; 5.4b) 7.0 n.a. ~10 (13.8b) 7.0 ~6
D-iGln2 8.1 (8.0a; 7.8b) 8.1 7.0 7.8 (13.7b) 6.7 4.8
m-Dap3 (α) 7.5 (7.6a; 6.8b) 7.6 7.8 0.4 (10.5b) 5.9 5.2
D-Ala4 ~7 (7.2a; 6.8b) 8.1 n.a. ~10 (10.4b) 7.5 ~6
D-Ala5 6.4 (6.4a; 6.9b) 7.2 ~5 -8.1 (12.5b) 5.5 2.2
m-Dap3 (ε) ---- 8.1 n.a. ---- 6.1 ~6
D-iGln-CONH2E n.a. n.a. n.a. 6.4 5.3 ~5
D-iGln-CONH2Z n.a. n.a. n.a. 5.4 4.9 ~7
m-Dap-CONH2E n.a. n.a. n.a. ~14 5.9 ~5
m-Dap-CONH2Z n.a. n.a. n.a. 4.6 5.3 5.4
a In DMSO from ref. (124)
b In H2O from ref. (125)
A similar phenomenon is observed for Ala5-NH in Ad-PGM: a relatively large downfield
shift, with respect to PGM and BocTyr-PGM (Table 3.5), associated with a temperature
coefficient of -5.5 ppb/K; the latter indicating appreciable solvent exposure. The same amide
proton appears, however, largely protected from solvent in both PGM and BocTyr-PGM, as
indicated by the somewhat exceptional, large positive, and low negative, respectively,
temperature coefficients, see Table 3.4. The exceptional temperature coefficient for Ala5-NH
38

in PGM was also noticed earlier. (124) The conformational preferences at the N-terminus of
Ad-PGM may therefore be different from those in PGM and BocTyr-PGM.
Table 3.5 Part of Table 3.1: 1H and 13C chemical shift data for PGM, Ad-PGM and BocTyr-PGM
PGM Ad-PGM BocTyr-PGM 1H 1H 1H
D-Ala5-NH 7.547 8.072 7.513
Conformational differences are reflected in the NOESY cross peak patterns as well.
Part of the observed NOEs arises from intraresidue dipolar contacts (not listed in Table 3.2 in
Appendix D). The majority of the interresidue NOE contacts occur between neighbouring
residues as evidenced by αN(i,i+1) and βN(i,i+1) sequential (44) cross peaks (Table 3.2). In
fact, all possible sequential contacts, either of αN or βN-type,(44) could be observed along the
hexapeptide backbone starting with D-Lac except for the DiGln2-δ/mDap3-αNH and the
DAla4-β/DAla5-NH. Sequential cross peaks like those mentioned are usually observed for
small, unstructured peptides in aqueous solution.(141)
On the other hand, NOEs between the carbohydrate and peptide moieties (NOEs #2-
20, Table 3.6) are indicative of less conformational freedom at the N-terminal part of the
peptide chain. Strong interglycosidic NOEs (#1) were detected between GlcNAc-H1 and
MurNAc-H4 in all three molecules investigated (Table 3.6).
Inspection of the amide regions in the NOESY maps for PGM, Ad-PGM and BocTyr-
PGM (Figure 3.5) reveals characteristic differences especially with regard to the long-range
NOEs (Table 3.2). Of the three compounds PGM clearly features the largest number of long-
range NOEs. There are 13:7:10 long-range NOEs in derivatives PGM, Ad-PGM and BocTyr-
PGM, several indicating contacts between the MurNAc (especially the N-acetyl methyl and
MurNAc-2,3 protons) and the N-terminal peptide residues. The number of such contacts is
reduced in Ad-PGM, whereas practically none is observed in BocTyr-PGM (discussed NOEs
#6, 11, 17, 18, are indicated in Figure 3.6 are listed in Table 3.6,).
39

Table 3.6 Part of Table 3: NOESY/ROESY cross peak intensities for PGM, Ad-PGM and BocTyr-PGM
Proton1 Proton2 PGM Ad-PGM BocTyr-PGM
1 GlcNAc-1 MurNAc-4 s s s
2 GlcNAc-3 D-Lac-β - - w i)
3 MurNAc-2 D-Lac-α - m -
4 MurNAc-2 D-Lac-β m s m
5 MurNAc-2 L-Ala1-NH m m w
6 MurNAc-2 D-iGln2-NH w - -
7 MurNAc-NH D-Lac-α s s m
8 MurNAc-NH D-Lac-β s m w
9 MurNAc(CH3) L-Ala1-NH w w -
10 MurNAc(CH3) L-Ala1-β - - w
11 MurNAc(CH3) D-iGln2-NH w - -
12 MurNAc(CH3) D-iGln2-CONH2E w w w g)
13 MurNAc(CH3) D-iGln2-CONH2Z w w -
14 MurNAc(CH3) D-Ala4-β - - w
15 MurNAc-3 D-Lac-β m m w
16 MurNAc-3 L-Ala1-NH m w -
17 MurNAc-3 D-iGln2-NH w - -
18 MurNAc-3 D-iGln2-CONH2E w - -
19 MurNAc-4 D-Lac-β - - w
20 MurNAc-4 L-Ala1-NH w w -
g) Ambiguous: MurNAc(CH3) and GlcNAc(CH3) overlap
i) Ambiguous: GlcNAc-3 and GlcNAc-5 overlap
40
7.27.47.67.88.08.28.4ppm ppm
1.2
1.4
1.6
1.8
2.0
2.2
2.4
2.6
2.8
3.0
3.2
3.4
3.6
MurNAc-3MurNAc-2mDap -3
D-iG
ln-N
H2
Z 2
D-iG
ln-N
H2
E 2
D-A
la-N
H5
L-A
la-N
H1
D-iG
ln-N
H2
MurNAc(CH)3
mDap-3mDap- ’3
7.07.27.47.67.88.08.2ppm ppm
1.2
1.4
1.6
1.8
2.0
2.2
2.4
2.6
2.8
3.0
3.2
3.4
3.6
MurNAc(CH)3
MurNAc-3
MurNAc-2
D-iG
ln-N
H2
Z 2
D-iG
ln-N
H2
E 2
L-A
la-N
H1
D-iG
ln-N
H2
mD
ap-
NH
3
11 9 12 1338
176 5
Ad-CH2
6.87.07.27.47.67.88.08.28.4ppm ppm
1.2
1.4
1.6
1.8
2.0
2.2
2.4
2.6
2.8
3.0
3.2
3.4
3.6
3.8
MurNAc-3MurNAc-2
MurNAc(CH)3
D-iG
ln-N
H2
Z 2
D-iG
ln-N
H2
E 2
D-A
la-N
H5
L-A
la-N
H1
D-iG
ln-N
H2
11 9 12 13
17
6 5 37
D-Ala -4
L-Ty
r-3,5
11 9 12 13
17
6
5
37
18
35
42
PGM AdPGM BocTyrPGM
Figure 3.5 Partial NOE maps of PGM (left), Ad-PGM (middle) and BocTyr-PGM (right) emphasizing the presence (arrows in red) or absence (arrows in blue) of characteristic
long-range cross peaks. Cross peaks are labelled using peak numbers in Table 3.2.

NHCHCO NHCHCONH2
(CH2)2
CO NHCHCO NHCHCO2HNHCHCO
CH3
(CH2)3
CHCONH2NH
H
CH3 CH3
OHOHO
NHAc
CH2OH
O
CH3CHCO
OHO
O
NHCOCH3
CH2OH
GlcNAc MurNAc
D-isoGln2
L-Ala1
D-Ala4 D-Ala5
mDap3
D-Lac
12
3
4
5
6
12
3
4
5
6
61117
18
Figure 3.6 Contacts between the MurNAc (especially the N-acetyl methyl and MurNAc-2,3 protons) and the N-
terminal peptide residues in PGM
Long-range NOEs involving any of the adamantyl ring protons are conspicuously
missing in Ad-PGM. On the other hand, Tyr aromatic protons display some contacts with the
C-terminal residues of the peptide moiety (such as #33, 36 and 42, see, Table 3.7).
Table 3.7 Part of Table 3.2: NOESY/ROESY cross peak intensities for BocTyr-PGM
Proton1 Proton2 BocTyr-PGM
33 m-Dap3-β,β’ L-Tyr-3,5 w
36 m-Dap3-γγ’ L-Tyr-3,5 w
39 m-Dap3-εNH L-Tyr-α s
40 m-Dap3-εNH L-Tyr-β,β’ m
42 D-Ala4-β L-Tyr-3,5 w
The structures resulting from distance geometry calculations were divided in clusters
of conformations according to selected main chain dihedral angle values (see Experimental),
and the most populated cluster with low energy was chosen to represent the preferred
conformations. Selected structures from the representative clusters are shown with an
identical orientation of the two sugar units for each of the molecules in Figure 3.7.
42
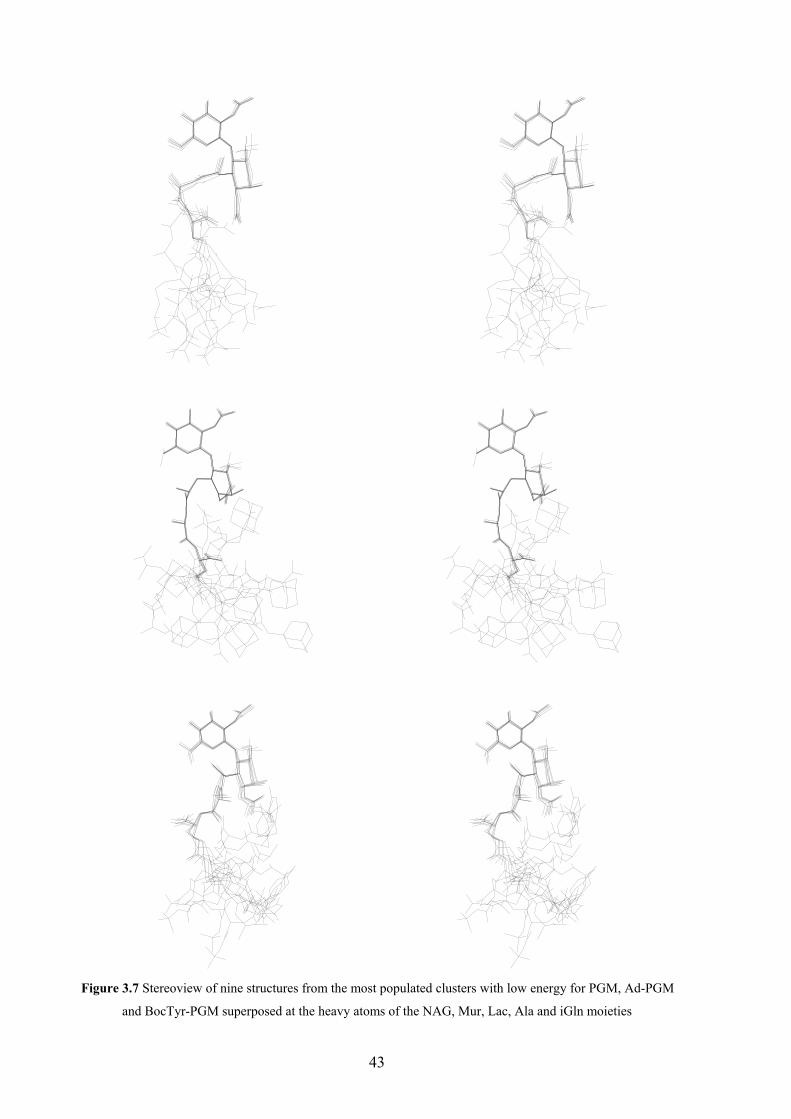
Figure 3.7 Stereoview of nine structures from the most populated clusters with low energy for PGM, Ad-PGM
and BocTyr-PGM superposed at the heavy atoms of the NAG, Mur, Lac, Ala and iGln moieties
43
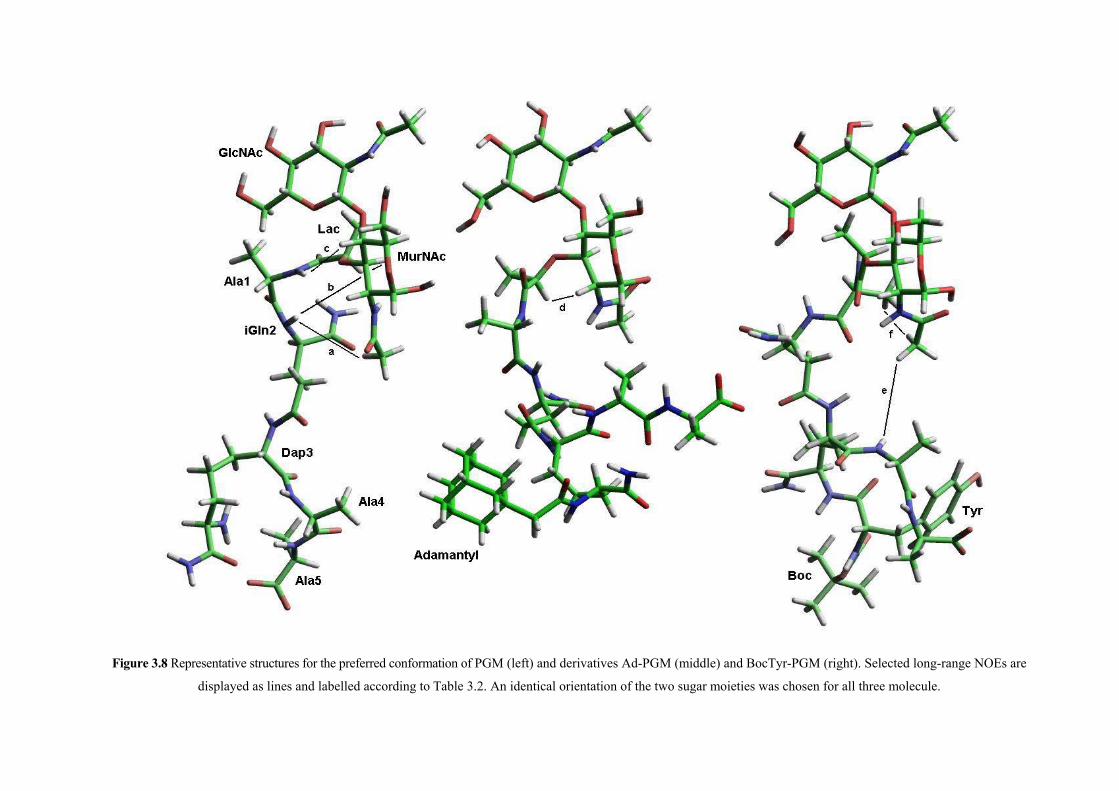
Figure 3.8 Representative structures for the preferred conformation of PGM (left) and derivatives Ad-PGM (middle) and BocTyr-PGM (right). Selected long-range NOEs are
displayed as lines and labelled according to Table 3.2. An identical orientation of the two sugar moieties was chosen for all three molecule.

In Table 3.8 some statistical data is shown regarding the main chain dihedral angle
values used for clustering of conformations, and a comparison with the values for PGM from
an explicit water simulation (125) is given. Additionally, the calculated values for selected
3JHN,α coupling constants (44, 142) are shown for the representative clusters. The latter are
reasonably similar to the experimental values (Table 3.4).
Table 3.8 Average values of selected dihedral angles (in degrees)a and 3J(HN,Hα) coupling constants (in Hz)
calculatedb for the representative clusters of PGM, Ad-PGM and BocTyr-PGM
Residue PGM c Ad-PGM BocTyr-PGM
iGln2-χ2 -67 (81) -64 56
iGln2-χ1 -161 (177) 164 131
iGln2-ψ -74 (77) -77 -72
iGln2-φ 80 (123) 76 130
Ala1-ψ 58 (130) 126 100
Ala1-φ 55 (-160) 175 0
Lac-ψ’ -7 (-166) -136 -172
Lac-φ’ 165 (84) 62.8 112
α-MurNAc-φ’ 121 (-161) -106 115
β-GlcNAc-ψ 120 (118) 123 121
β-GlcNAc-φ’ 165 (164) 162 165
3J(iGln2-α) 8.5 (n.a.) 7.3 7.7
3J(Ala1-α) 6.8 (n.a.) 6.5 6.6
3J(MurNAc) 5.4 (n.a.) 8.5 8.7
3J(GlcNAc) 8.7 (n.a.) 8.2 8.6
a) For the definition of the dihedral angles, see text
b) Using Karplus parameters from ref. (44)
c) Values in parentheses are those for PGM calculated for solution in water; from ref. (125)
The orientation of the Lac-Ala1-iGln2 moiety is similar, though not identical, for PGM
and Ad-PGM, but differs more strongly with BocTyr-PGM. With PGM the orientation of the
N-terminal peptide domain relative to the disaccharide moiety is characterized by NOEs from
the iGln2 to MurNAc (#6, 11, 17 and 18 in Table 3.6, Figure 3.6) while with Ad-PGM the Lac
45
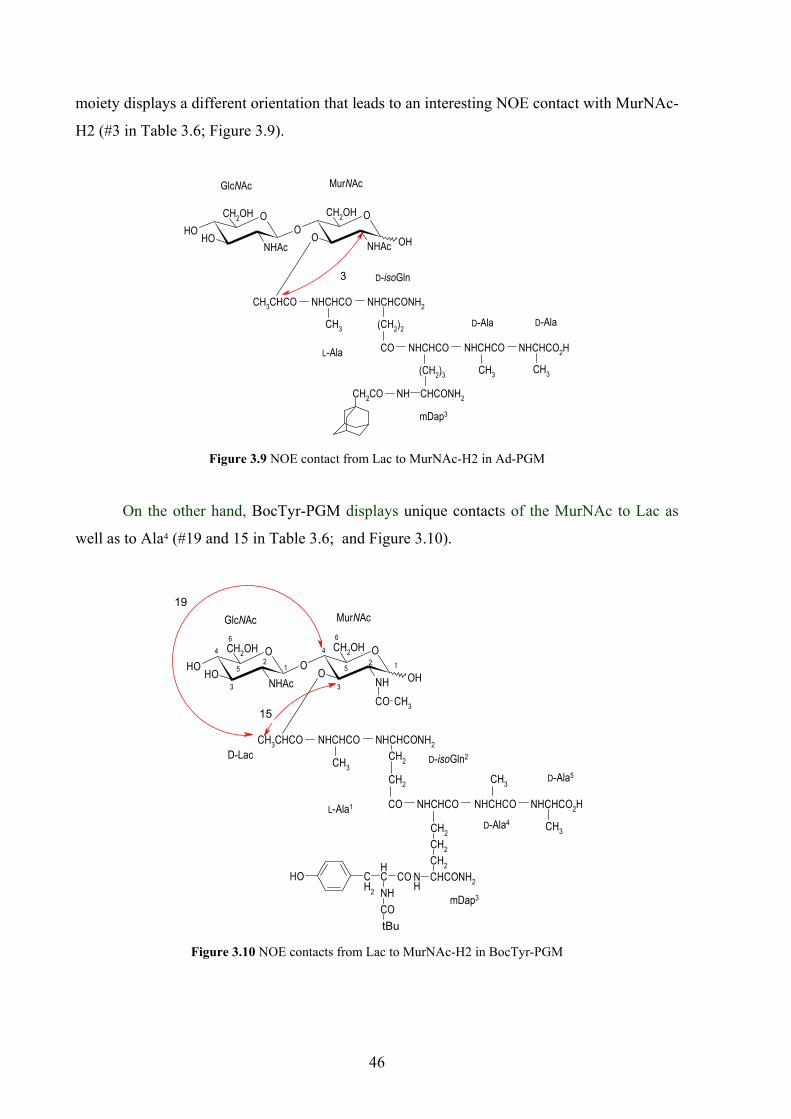
moiety displays a different orientation that leads to an interesting NOE contact with MurNAc-
H2 (#3 in Table 3.6; Figure 3.9).
NHCHCO NHCHCONH2
(CH2)2
CO NHCHCO NHCHCO2HNHCHCO
CH3
(CH2)3
CHCONH2
CH3 CH3
OHOHO
NHAc
CH2OH
O
CH3CHCO
OHO
O
NHAc
CH2OH
CH2CO NH
GlcNAc MurNAc
D-isoGln
L-Ala
D-Ala D-Ala
mDap3
3
Figure 3.9 NOE contact from Lac to MurNAc-H2 in Ad-PGM
On the other hand, BocTyr-PGM displays unique contacts of the MurNAc to Lac as
well as to Ala4 (#19 and 15 in Table 3.6; and Figure 3.10).
NHCHCO NHCHCONH2
CO NHCHCO NHCHCO2HNHCHCO
CH3
CH2CH2CH2CHCONH2N
HCOC
H
NHCOtBu
CH2
OH
CH3
CH3
OHOHO
NHAc
CH2OH
O
CH3CHCO
OHO
O
NH
CH2OH
CO CH3
CH2
CH2
GlcNAc MurNAc
D-isoGln2
L-Ala1
D-Ala4
D-Ala5
D-Lac
12
3
4
5
6
12
3
4
5
6
mDap3
15
19
Figure 3.10 NOE contacts from Lac to MurNAc-H2 in BocTyr-PGM
46

The structure of PGM can be used for an explanation of the unusual positive
temperature coefficient of the Ala5-NH chemical shift (Table 3.5). The latter could be caused
by the protection of Ala5-NH from solvent by the side chain of Dap3 that is attracted towards
the negatively charged Ala5-C-terminus by the positively charged Dap3-εNH3+ group. Such a
charged group is absent in Ad-PGM and BocTyr-PGM, where the respective temperature
coefficients are in the negative range. Additionally, PGM shows long-range NOEs from the
iGln2 to the sugar moiety (see above); the resulting conformations partially protect Dap3-NH
from solvent and may lower its temperature dependence (Table 3.4) although the exact
mechanism is not evident from the NOE pattern. The preferred conformation of PGM in
DMSO as determined in the present study is rather different from the average structure of
PGM that has been calculated in water, (125) except for the disaccharide conformation as can
be seen by comparing the torsion angle values in Table 3.8. Ad-PGM, on the other hand, is
devoid of any remarkable NOEs, including those involving the adamantyl moiety, or
anomalous amide chemical shift temperature dependences. Correspondingly, the calculated
structures are also the least constrained by distance restraints of the three molecules.
BocTyr-PGM, however, displays a network of hydrophobic interactions also involving
the But of Boc and aromatic protons, exemplified by the NOEs Mur-NAc(CH3) to Ala4-β
(#14), Tyr-3,5 to Ala4-β (#42), and Tyr-3,5 to But(Boc) (#43) in Figure 3.11.
NHCHCO NHCHCONH2
(CH2)2
CO NHCHCO NHCHCO2HNHCHCO
CH3
CH2CH2CH2CHCONH2N
HCOC
H
NHCOtBu
CH2
OH
CH3
CH3
OHOHO
NHAc
CH2OH
O
CH3CHCO
OHO
O
NH
CH2OH
CO CH3
GlcNAc MurNAc
D-isoGln2
L-Ala1
D-Ala4
D-Ala5D-Lac
12
3
4
5
6
12
3
4
5
6
mDap3
14
4243
Figure 3.11 Hydrophobic contacts in BocTyrPGM
47

The resulting structures fully expose Dap-NH but somewhat hide the Ala5-NH from
solvent in partial agreement with the temperature coefficients (Table 3.4). The high-field shift
of Ala5-NH in PGM and BocTyrPGM relative to Ad-PGM seems to be connected with its
protection from solvent. The low-field shift of the Dap3-NH2E and -NH2
Z protons in PGM
relative to Ad-PGM and BocTyrPGM (cf. Table 3.3) is most probably caused by the
proximity of the Dap3-εNH3+ amino group.
The results shown above suggest that the lipophilic substituents attached to the Dap3-
εNH2 amino group of the parent PGM molecule introduce changes in the conformational
preferences of the peptide moiety. In PGM electrostatic interactions between charged end
groups (Ala5-COO- and Dap3-εNH3+) apparently promote folded conformations with
participation of the long Dap side chain as indicated by the unique, long range NOE contacts
between Ala5-NH and Dap3 side-chain protons (#34, 35 and 37 in Table 3.9, Figure 3.12).
Table 3.9 Part of Table 3 NOESY/ROESY cross peak intensities for PGM, Ad-PGM and BocTyr-PGM
Proton1 Proton2 PGM Ad-PGM BocTyrPGM
34 m-Dap3-β,β’ D-Ala5-NH w - w
35 m-Dap3-γ,γ’ D-Ala5-NH m - -
37 m-Dap3-ε D-Ala5-NH w - -
NHCHCO NHCHCONH2
(CH2)2
CO NHCHCO NHCHCO2HNHCHCO
CH3
CH2CH2CH2CHCONH2NH2
CH3
CH3
OHOHO
NHAc
CH2OH
O
CH3CHCO
OHO
O
NH
CH2OH
CO CH3
GlcNAc MurNAc
D-isoGln2
L-Ala1
D-Ala4
D-Ala5D-Lac
12
3
4
5
6
12
3
4
5
6
mDap31
3435
37
Figure 3.12 Unique, long range NOE contacts between Ala5-NH and Dap3 side-chain protons indicating folded
conformations with participation of the long Dap side chain as indicated by the induced by electrostatic
interactions between charged end groups in 1 PGM
48
3.5 Conclusion
Derivatives wherein such interactions are suppressed by acylation of the Dap3-εNH2
are characterized by more extended conformations of the peptide chain. The above long range
interactions are missing in Ad-PGM and, conspicuously, no NOEs can be observed involving
any of the adamantly ring protons. Of the two acylated derivatives studied Ad-PGM appears
to be less constrained than BocTyr-PGM, the latter being characterized by hydrophobic
contacts of methyl, the aromatic and the But groups.
The differences in conformational preferences revealed in solutions for DMSO do not,
however, seem to influence the biological activities such as immunostimulation and binding
to N-acetylmuramyl-L-alanine amidase. (139-140) This may indicate that peripheral parts of
the peptide chain such as the C-terminus and end groups of the long Dap side chain do not
significantly contribute to the binding to receptors or enzymes, participating in these
biochemical interactions, under physiological conditions.
49

4. CONFORMATIONAL PREFERENCES OF DIGLYCOSYL
DISULFIDES
4.1 Carbohydrates with unusual interglycosidic linkages
Oligosaccharides containing unusual two-bond interglycosidic linkages
Analogues of oligosaccharides in which an N, S, Se or C-atom replaces the glycosidic
O-atom are well known and have been investigated in detail (143-158). Such carbohydrate
heteroanalogues are potential inhibitors of glycoside hydrolyse enzymes because the non-O-
glycosidic bond is usually resistant to hydrolysis.
Oligosaccharides with 1-6 and other three-bond linkages
On the other hand, few structures featuring a three-bond interglycosidic connection (-
X-Y-, with X, Y = O, N, C, S), in place of the natural two-bond coupling between
monosaccharide units, are known (159-161). Some representatives of the latter also occur in
Nature as components of important antitumor antibiotics (162-163). Three-bond
interglycosidic linkages (3BIGL, -X-Y-, with X,Y = O, N, C, S) in place of the natural two-
bond connection (2BIGL), between monosaccharide units in di- or oligosaccharides are
relatively rare. Some important natural oligosaccharides such as tunicamycin, moenomycin-A
or sialyl TN feature, significantly, 3BIGLs. An interesting subgroup, incorporating two
heteroatoms in the interglycosidic chain, also occurs in Nature as part of important antitumor
antibiotics. 3BIGLs with X=O and Y=C, such as the 1-6 bonds in polysaccharides are, on the
other hand, more frequent, e.g., in dextran, amylopectin or inulin.
The disulfide linkage
Disulfide linkages play an essential role in establishing tertiary structures of proteins,
in the formation of cyclopeptides and in many biologically relevant systems. This structural
motif is, however, virtually nonexistent within carbohydrates of either synthetic or natural
origin. Obvious exceptions are symmetric disulfides formed through oxidation of 1-
thioaldoses and some glycosyl-aryl/alkyl disulfides that have been known for a long time
(164-165). A few cyclic disulfide derivatives of mono- and disaccharides (166-167) have also
50
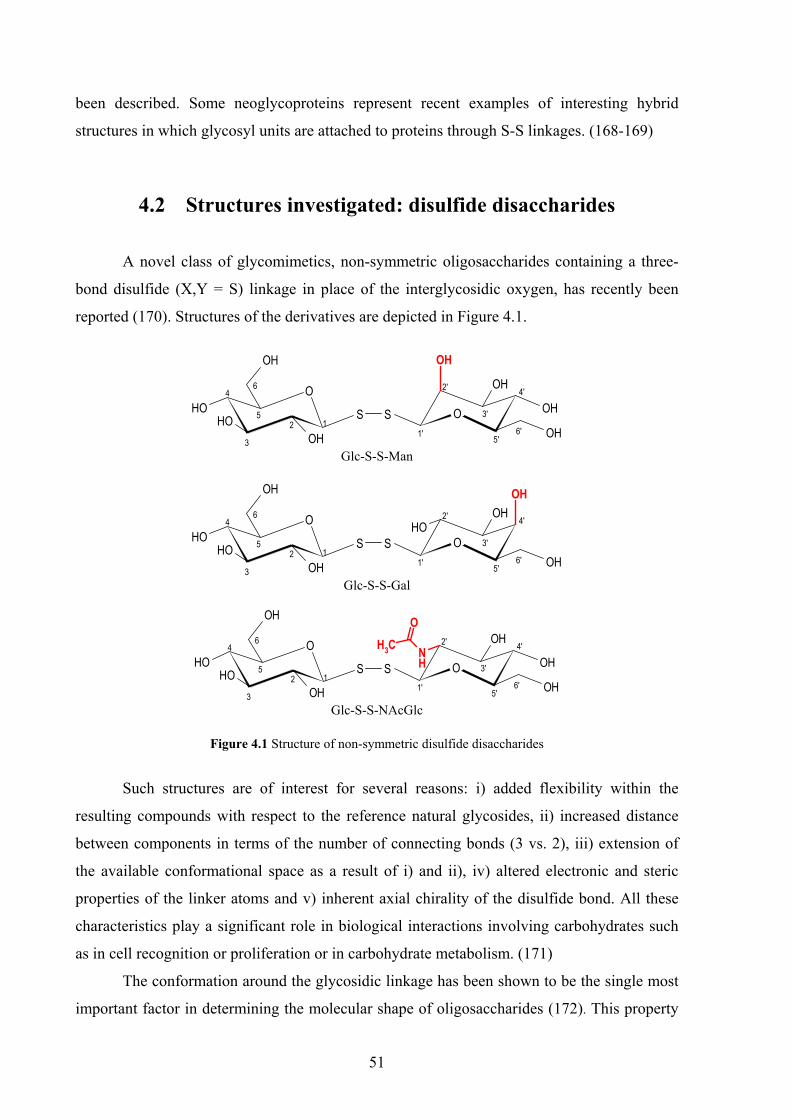
been described. Some neoglycoproteins represent recent examples of interesting hybrid
structures in which glycosyl units are attached to proteins through S-S linkages. (168-169)
4.2 Structures investigated: disulfide disaccharides
A novel class of glycomimetics, non-symmetric oligosaccharides containing a three-
bond disulfide (X,Y = S) linkage in place of the interglycosidic oxygen, has recently been
reported (170). Structures of the derivatives are depicted in Figure 4.1.
SOHO
OHOH
S
OH
OHO
OH
OH12
3
4
5
6
1'
2'
3'
5'6'
4'
OH
OH
NH
CH3
O
Glc-S-S-Man
SOHO
OHOH
S
OH
OHO
OH
OH12
3
4
5
6
1'
2'
3'
5'6'
4'
Glc-S-S-Gal
SOHO
OHOH
S
OH
OHO
OH
OH12
3
4
5
6
1'
2'
3'
5'6'
4'
Glc-S-S-NAcGlc
Figure 4.1 Structure of non-symmetric disulfide disaccharides
Such structures are of interest for several reasons: i) added flexibility within the
resulting compounds with respect to the reference natural glycosides, ii) increased distance
between components in terms of the number of connecting bonds (3 vs. 2), iii) extension of
the available conformational space as a result of i) and ii), iv) altered electronic and steric
properties of the linker atoms and v) inherent axial chirality of the disulfide bond. All these
characteristics play a significant role in biological interactions involving carbohydrates such
as in cell recognition or proliferation or in carbohydrate metabolism. (171)
The conformation around the glycosidic linkage has been shown to be the single most
important factor in determining the molecular shape of oligosaccharides (172). This property
51
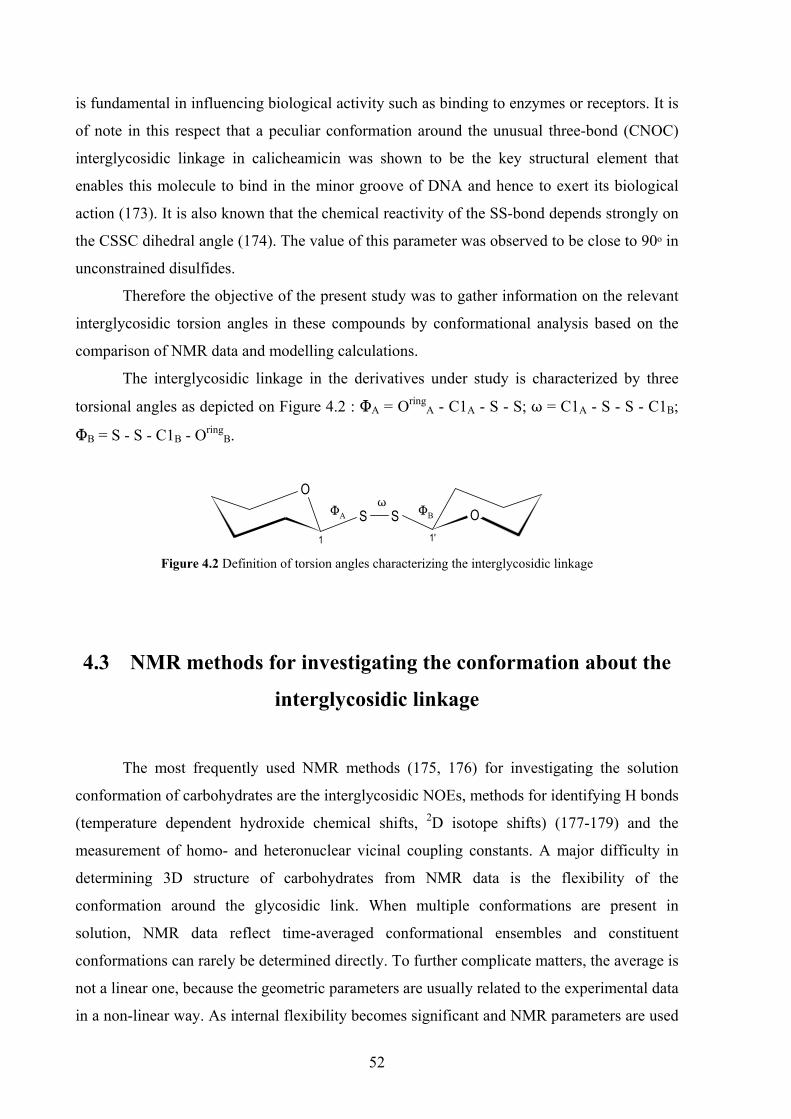
is fundamental in influencing biological activity such as binding to enzymes or receptors. It is
of note in this respect that a peculiar conformation around the unusual three-bond (CNOC)
interglycosidic linkage in calicheamicin was shown to be the key structural element that
enables this molecule to bind in the minor groove of DNA and hence to exert its biological
action (173). It is also known that the chemical reactivity of the SS-bond depends strongly on
the CSSC dihedral angle (174). The value of this parameter was observed to be close to 90o in
unconstrained disulfides.
Therefore the objective of the present study was to gather information on the relevant
interglycosidic torsion angles in these compounds by conformational analysis based on the
comparison of NMR data and modelling calculations.
The interglycosidic linkage in the derivatives under study is characterized by three
torsional angles as depicted on Figure 4.2 : MA = OringA - C1A - S - S; T = C1A - S - S - C1B;
MB = S - S - C1B - OringB.
S
O
S O1 1'
MA MBT
Figure 4.2 Definition of torsion angles characterizing the interglycosidic linkage
4.3 NMR methods for investigating the conformation about the
interglycosidic linkage
The most frequently used NMR methods (175, 176) for investigating the solution
conformation of carbohydrates are the interglycosidic NOEs, methods for identifying H bonds
(temperature dependent hydroxide chemical shifts, 2D isotope shifts) (177-179) and the
measurement of homo- and heteronuclear vicinal coupling constants. A major difficulty in
determining 3D structure of carbohydrates from NMR data is the flexibility of the
conformation around the glycosidic link. When multiple conformations are present in
solution, NMR data reflect time-averaged conformational ensembles and constituent
conformations can rarely be determined directly. To further complicate matters, the average is
not a linear one, because the geometric parameters are usually related to the experimental data
in a non-linear way. As internal flexibility becomes significant and NMR parameters are used
52

as empirical constraint in modelling calculations, this may lead to the generation of virtual
conformers, which represents structures that are not physically present. (180-181)
Experimental NMR data are, therefore, usually compared to ensemble averaged theoretical
parameters derived from model calculations (175, 181, 172) rather than used as constraints.
These studies result in the location of the preferred regions in the conformational space rather
than in the location of some well-defined points.
Conformational studies of three-bond interglycosidic linkages are difficult because the
monosaccharide units are in longer distance from one another. The usual approach based on
3-bond proton-carbon couplings cannot be applied. The vicinal 13C-13C scalar coupling
constant between the anomeric carbons contains information on the torsion angle around the
disulfide bond. This may be small because torsion angles close to 90o are anticipated (174),
and difficult to measure because of low sensitivity of the corresponding measurement
techniques. An additional difficulty is that the number of interresidue NOEs is expected to be
small due to the larger distance between monosaccharide units.
As a further approach to explore conformational features RDCs may be measured. The
RDC has an inverse cubic dependence on the separation between the nuclei and a squared
cosine dependence on the angle between the internuclear vector and the static field. For
directly bonded pairs of atoms such as a 1H-13C in direct connection, the internuclear distance
is accurately known, and the measured RDC provides information on the orientation of the
internuclear bond vector. Straightforward interpretation of RDC data is possible only for
carbohydrates which can be represented by a single conformer (182). For these cases the
orientation tensor defining the alignment of the whole molecule is obtained by fitting 1DC,H
data to model structure. This method is effective for models which have restricted and
symmetric internal motions around the glycosyl linkages.
Interpretation of RDCs in highly flexible oligosaccharides with several conformational
minima requires a different approach. In order to make use of the structural information the
alignment of each rigid unit in the molecule with respect to the magnetic field must be
determined. 5 independent elements of the alignment tensor must be known. Providing 5
experimental RDC for each rigid unit the alignment tensor can determined. Since it is known
that oligosaccharides are often flexible around the glycosidic bonds, therefore every
monosaccharide unit must be regarded as rigid unit for which separate alignment tensor must
be determined. This requirement leads to several problems during the interpretation of RDCs
in oligosaccharides. For a pyranose ring 5 one-bond heteronuclear RDCs can be measured.
The distribution of C,H bond vectors is, however, not isotropic due to the geometry of the
53
pyranose rings. To increase the number of experimental dipolar couplings H,H dipolar
couplings must be measured as well. With the additional homonuclear residual dipolar
couplings, it is possible to obtain an alignment tensor for each monosaccharide. (183, 184)
4.4 Results and discussion
NMR investigations
Solvent accessibilities were studied by temperature coefficients for the hydroxide and
amide protons to identify possible H bonding sites, 1H-1H NOE were measured in order to
reveal interannular NOEs between protons of the sugar rings and finally one-bond residual
dipolar 1H-13C couplings were measured in weakly oriented media.
NMR studies of exchangable protons of carbohydrates in aqueous solution are
severely hampered by the presence of fast chemical exchange of labile groups with water.
DMSO as a solvent were used to circumvent chemical exchange of OH and NH protons with
the residual water where NMR signals of hydroxide and amide protons can readily be
observed and provide useful additional source of interresidual NOE contacts and temperature
coefficients. Measurement of RDCs, however, involves dissolving the substance to be studied
in an aqueous dilute liquid crystal media. Potential conformational changes induced by the
different solvent were examined by comparing 1H and 13C chemical shifts.
Full 1H and 13C assignments of the substances in DMSO-d6 and aqueous liquid crystal
medium were achieved by conventional 1D and 2D NMR experiments. Assignments of 1H
and 13C resonances are listed in Table 4.1 and 4.2.
Conformational changes induced by solvent effects as evaluated by chemical shifts
1H nuclei located at peripheral positions of molecules are in direct contact with the
solvent molecules, while the 13C atoms in the interior of the skeleton of molecules are
influenced by solvation effects to a smaller extent. As a result, variations in 13C chemical
shifts more reliably reflect possible alteration in conformation than changes in the 1H
chemical shifts. Although differences in 1H chemical shifts between DMSO and the aqueous
liquid crystal solvent range up to ca. 0.9 ppm (4th and 6th column of Table 4.1), but this
change incorporate effects of the difference in solvation and that of the possible structural
54
changes. The 13C chemical shift changes are <1 ppm (4th and 6th column of Table 4.1)
suggest no extensive conformational differences in the two media.
Table 4.1 Chemical shifts for Glc-S-S-Man in DMSO and in D2O - DMPC/CHAPSO at isotropic sample
conditions
Assignment *1H )* *13C )* DMSO-
d6 D2O - DMPC/CHAPSO
DMSO-d6
D2O - DMPC/CHAPSO
G1 4.241 4.679 0.438 87.63 88.05 0.87 G2 3.421 3.915 0.494 70.20 70.78 0.58 G3 3.213 3.732 0.519 77.65 77.54 -0.11 G4 3.017 3.581 0.564 69.64 69.96 0.32 G5 3.169 3.671 0.502 81.13 80.81 -0.32 G6a 3.691 4.058 0.889 61.15 61.55 0.40 G6b 3.368 3.868 0.500 61.15 61.55 0.40 M1 4.786 5.110 0.324 92.15 91.99 -0.16 M2 3.832 4.343 0.498 71.27 72.05 0.78 M3 3.283 3.799 0.516 73.94 74.61 0.67 M4 3.28 3.756 0.476 66.42 67.02 0.78 M5 3.090 3.597 0.303 81.69 81.47 -0.22 M6a 3.691 4.103 0.412 61.15 61.69 0.54 M6b 3.423 3.914 0.491 61.15 61.69 0.54 Table 4.2 Chemical shifts for Glc-S-S-Gal in DMSO and in D2O - DMPC/CHAPSO at isotropic sample
conditions
Assignment *1H )* *13C )* DMSO-
d6 D2O - DMPC/CHAPSO
DMSO-d6
D2O - DMPC/CHAPSO
G1 4.311 4.491 0.180 89.65 88.76 -0.89 G2 3.285 3.580 0.295 71.57 70.95 -0.62 G3 3.173 3.451 0.278 78.00 77.16 -0.84 G4 3.072 3.347 0.275 69.55 69.34 -0.31 G5 3.131 3.405 0.274 81.19 80.38 -0.81 G6a 3.660 3.819 0.159 61.08 60.85 -0.23 G6b 3.441 3.645 0.204 61.08 60.85 -0.23 Ga1 4.323 4.464 0.141 91.51 90.84 -0.67 Ga2 3.512 3.682 0.170 69.11 69.08 0.03 Ga3 3.330 3.608 0.278 74.66 73.92 -0.74 Ga4 3.642 3.882 0.240 68.43 69.04 0.97 Ga5 3.400 3.662 0.262 79.55 79.74 0.19 Ga6a 3.504 3.700 0.196 60.62 61.14 0.78 Ga6b 3.504 3.663 0.159 60.62 61.14 0.78
55

Investigations in DMSO solution
Temperature coefficients for labile protons are listed in Table 4.3. Large upfield shifts
are observed as the temperature is increased since the values are in the range of - 6-8 ppb/K
demonstrating appreciable solvent exposure. The only exception is NAcGlc-2NH displaying
an intermediate value of -3.8 ppb/K.
Table 4.3 Temperature coefficients of labile (OH and NH) protons
Glc-S-S-Man Glc-S-S-Man Glc-S-S-NAcNH assignment )*/)T
(ppb/K) assignment )*/)T
(ppb/K) assignment )*/)T
(ppb/K) Glc-2OH -6.5 Glc-2OH -6.6 Glc-2OH -6.9 Glc-3OH -7.1 Glc-3OH -7.2 Glc-3OH a Glc-4OH -6.6 Glc-4OH -6.4 Glc-4OH -6.4 Glc-6OH -6.8 Glc-6OH -6.7 Glc-6OH -8.6 Man-2OH -7.9 Gal-2OH -6.6 NAcGlc-NH -3.8 Man-3OH -7.0 Gal-3OH -7.8 NAcGlc-3OH -6.3 Man-4OH -6.4 Gal-4OH -6.5 NAcGlc-4OH a Man-6OH -7.3 Gal-6OH -5.9 NAcGlc-6OH -6.6
a) Not determined due to mutual overlap
The important glycosyl NOEs are summarized in Table 4.4. As expected, only a few
conformationally relevant contacts were found for all three derivatives.
Table 4.4 Interannular contacts observed as NOESY crosspeaks in Glc-S-S-NAcGlc
peracetylated Glc-S-S-Man 1 Glc-2 Man-2 2 Glc-4 Man-2 3 Glc-6a Man-2
Glc-S-S-Gal 4 Glc-2OH Gal-6CH2
Glc-S-S-NAcGlc 5 Glc-2 NAcGlc-Me 6 Glc-4 NAcGlc-Me 7 Glc-6OH NAcGlc-Me 8 Glc-6OH NAcGlc-2NH
For the Glc-S-S-Man in particular, no interresidual NOE were detected at all.
Exploratory 1H–1H NOE measurements on the peracetylated Glc-S-S-Man, however,
disclosed significant interannular NOEs between H-2 of the mannose residue and various
glucose ring protons as illustrated in Figure 4.3 left side, these connectivities cannot,
however, be observed for the deacetylated derivative. Inspection of qualitative molecular
56
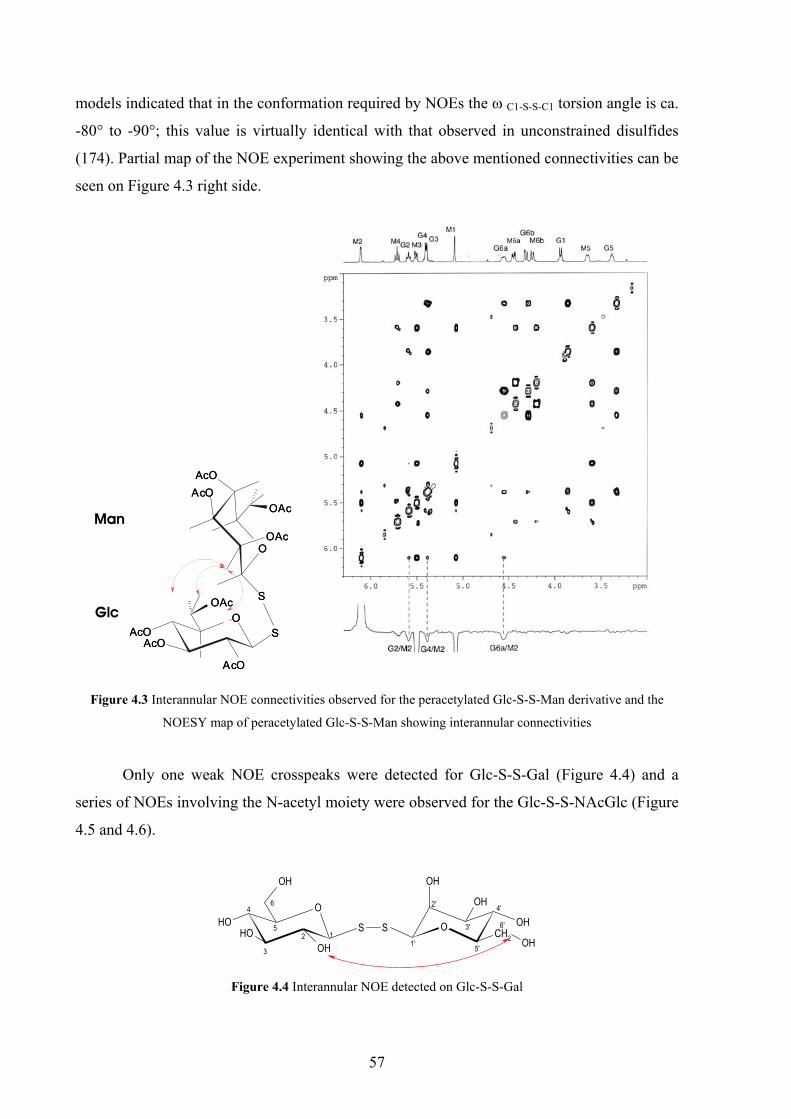
models indicated that in the conformation required by NOEs the ω C1-S-S-C1 torsion angle is ca.
-80° to -90°; this value is virtually identical with that observed in unconstrained disulfides
(174). Partial map of the NOE experiment showing the above mentioned connectivities can be
seen on Figure 4.3 right side.
OAc
SAcOO
AcO
S
AcO
O
OAc
OAc
AcO
AcO
OAc
SAcOO
AcO
S
AcO
O
OAc
OAc
AcO
AcO
Man
Glc
Figure 4.3 Interannular NOE connectivities observed for the peracetylated Glc-S-S-Man derivative and the
NOESY map of peracetylated Glc-S-S-Man showing interannular connectivities
Only one weak NOE crosspeaks were detected for Glc-S-S-Gal (Figure 4.4) and a
series of NOEs involving the N-acetyl moiety were observed for the Glc-S-S-NAcGlc (Figure
4.5 and 4.6).
SOHO
OHOH
S
OH OH
OHCH2
O
OH
OH12
3
4
5
6
1'
2'
3'
5'
6'
4'
Figure 4.4 Interannular NOE detected on Glc-S-S-Gal
57
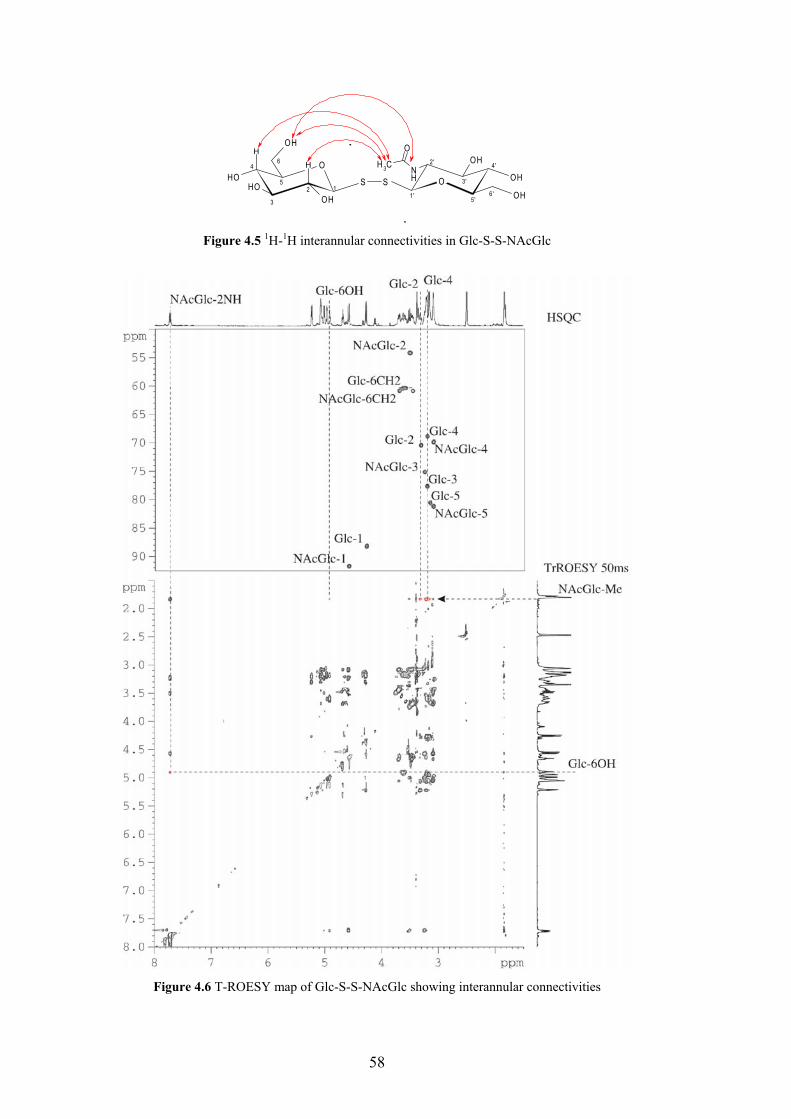
SOHO
OHOH
S
OHH
HOH
NH O
OH
OH
CH 3
O
12
3
4
5
6
1'
2'
3'
5'6'
4'
Figure 4.5 1H-1H interannular connectivities in Glc-S-S-NAcGlc
Figure 4.6 T-ROESY map of Glc-S-S-NAcGlc showing interannular connectivities
58

In conclusion, considerable conformational flexibility of the disaccharides studied in
DMSO-d6 solutions can be assumed from the large temperature coefficients and the sparse
number or the complete lack of any interannular interresidue NOE/ROE interactions.
Residual dipolar couplings measured in dilute liquid crystalline media
One-bond 1H-13C RDCs measured for the Glc-S-S-Man and the Glc-S-S-Gal
derivatives at various liquid crystal concentrations are listed in Table 4.5 and 4.6,
respectively.
Table 4.5 One-bond heteronuclear RDCs (Hz) in Glc-S-S-Man at different liquid crystal concentrations
Assignment 7.5% 15% 30% G1 3.2 4.9 10.5 G2 1.2 4.5 7.2 G3 4.7 6.5 8.1 G4 2.3 8.5 12.6 G5 1.7 3.4 7.9 M1 5.3 8.6 18.0 M3 5.5 7.6 15.8 M4 5.3 14.3 20.3 M5 7.3 12.4 20.5 M2 0.6 0.8 2.2
. Table 4.6 One-bond heteronuclear RDCs (Hz) in Glc-S-S-Gal at different liquid crystal concentrations
Assignment 7.5% 15% 30% G1 3.2 5.0 10.0 G2 2.2 3.6 6.8 G3 2.5 3.1 6.5 G4 2.8 5.2 9.1 G5 2.1 4.4 9.0 Ga1 2.9 4.5 8.3 Ga2 2.2 3.7 7.9 Ga3 1.5 2.8 6.4 Ga5 2.1 3.4 6.5 Ga4 -2.5 -5.5 -12.1
A random error of ca. 1-2Hz in the RDCs were observed using the modified F1
coupled HSQC technique described in chapter 5. The error was estimated by repeating the
measurement. This error is hardly smaller than the effect measured at 7.5% total amphiphile
concentration which is in agreement with the observation of Tjandra et al. (185). Martin-
Pastor and Bush (186-187) also reported "0.5Hz and "0.8Hz error for the precision of the
59

original F1 coupled HSQC. In order to increase the effect to be measured, the liquid crystal
concentration was increased to 15% and 30%. The RDCs are clearly showing an increasing
tendency with the same random error of 1-2Hz as can be seen on Figure 4.7 and 4.8.
0
5
10
15
20
25
0.0 5.0 10.0 15.0 20.0 25.0 30.0 35.0
Liqid crystal concentration (%)
RD
C (H
z)
G1G2G3G4G5M1M3M4M5M2
Figure 4.7 Changes of RDCs with the liquid crystal concentration for the Glc-S-S-Man derivative
-15
-10
-5
0
5
10
15
0.0 5.0 10.0 15.0 20.0 25.0 30.0 35.0
Liquid crystal concentration (%)
RD
C (H
z)
G1
G2
G3
G4
G5
Ga1
Ga2
Ga3
Ga5
Ga4
Figure 4.8 Changes of RDCs with the liquid crystal concentration for the Glc-S-S-Gal derivative
Relative magnitudes of the intraresidue RDCs reflect the stereochemistry at each
carbon centre, since the ring geometries of the constituent monosaccharide residues in the
oligosaccharide can be considered as rigid. The RDCs for the C1-H1, C2-H2, C3-H3, C4-H4
and C5-H-5 bond vectors of the glucose residue in Glc-S-S-Man and Glc-S-S-Gal are
comparable at a given liquid crystal concentration reflecting a similar (axial) orientations of
the ring protons (Figure 4.9). The RDCs for the glucose residue in the Glc-S-S-Man and in the
Glc-S-S-Gal are plotted on Figure 4.10, respectively. The absolute values of the respective
RDC are different for the glucose residue in the two molecules due to different alignments.
60

G1G2G3
G4 G5
G6
Figure 4.9 Axial orientation of the 1H-13C bond vectors in glucose highligthed in yellow
G1G2
G3G4
G5
7.5
15
300
2
4
6
8
10
12
14
RDC(Hz)
Assignment
LC (%)
7.5
15
30
G1G2
G3G4
G5
7.5
15
300
1
2
3
4
5
6
7
8
9
10
RDC(Hz)
Assignment
LC (%)
7.5
15
30
Figure 4.10 Distribution of RDCs belonging to axially aligned 1H-13C bond vectors in the glucose unit in Glc-S-
S-Man (left) and in Glc-S-S-Gal (right) derivative at various liquid crystal concentrations
Similarly, the axial bond vectors of the mannose (C1, C3, C4, C5 in Figure 3.11) and
galactose (C1, C2, C3, C5 in Figure 3.12) residues display fairly similar values when
compared at the same liquid crystal concentration. In contrast, the RDC for the C2-H2 bond
vector in mannose is very small and for the C4-H4 in galactose is a negative value, reflecting
the equatorial orientation of the respective protons.
M1M2
M3
M4
M5
M6
M1M2
M3M4
M5
7.5
15
300
5
10
15
20
25
RDC(Hz)
Assignment
LC (%)
7.5
15
30
Figure 4.11 Orientation of the 1H-13C bond vectors in mannose and the distribution of RDCs for 1H-13C bond
vectors in the mannose unit in Glc-S-S-Man derivative at various liquid crystal concentrations
61

Ga1Ga2
Ga3
Ga4Ga5
Ga1Ga2
Ga3Ga4
Ga5
7.5
15
30-15
-10
-5
0
5
10
RDC(Hz)
Assignment
LC (%)
7.5
15
30
Figure 4.12 Orientation of the 1H-13C bond vectors in galactose and the distribution of RDCs for 1H-13C bond
vectors in the galactose unit in Glc-S-S-Gal derivative at various liquid crystal concentrations
Since on the basis of the results obtained in DMSO solution no single conformer can
be assumed for the disulfide disaccharides studied, hence alignment of each rigid unit must be
determined. This requires 5 independent data for each monosaccharide ring. The 5 one-bond 1H-13C RDCs measured for the derivatives provide 1 independent data for the glucose
residue and 2 independent data for the mannose and galactose residue. With lack of 1H-1H
RDC data structure determination was not attempted thus far.
Computer aided conformational analysis
Since 3D structure determination of carbohydrates using NMR data is complicated by
the time-averaged nature of the NMR observables, it is therefore necessary to rely more
heavily upon modelling methods to calculate potential energy surfaces as an aid to
interpretation of NMR data. In order to explore the conformational space available to the
compounds conformational searches were carried out. The searches included systematic as
well as stochastic searches. The molecular mechanics calculations were performed using the
AMBER force field (188, 189) extended with Homans' carbohydrate parameters (190).
Calculations utilizing carbohydrate force-fields implicitly assume the existence of the
exo-anomeric effect via incorporation into the parameter set of the force-field. The
conformational behaviour of alpha and beta-anomeric linkages for C-, N- and S-glycosyl
compounds were studied by Tvaroska et. al. (191). Ab-initio calculations were carried out on
axially and equatorially 2-ethyl, 2-methylamino, 2-thiomethyl, and 2-methylammonio
substituted derivatives of tetrahydropyran as model compounds. The exo-anomeric effect was
found to decrease in the methoxy > methylamino > thiomethyl order, while the
62
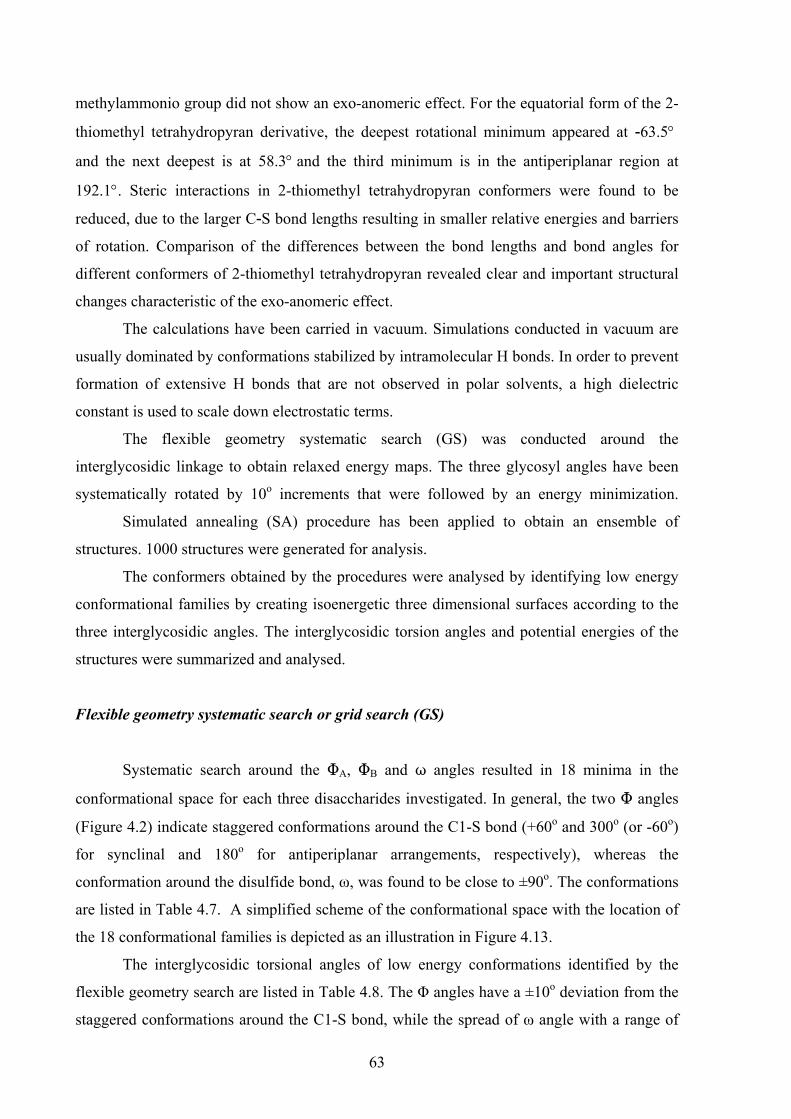
methylammonio group did not show an exo-anomeric effect. For the equatorial form of the 2-
thiomethyl tetrahydropyran derivative, the deepest rotational minimum appeared at -63.5°
and the next deepest is at 58.3° and the third minimum is in the antiperiplanar region at
192.1°. Steric interactions in 2-thiomethyl tetrahydropyran conformers were found to be
reduced, due to the larger C-S bond lengths resulting in smaller relative energies and barriers
of rotation. Comparison of the differences between the bond lengths and bond angles for
different conformers of 2-thiomethyl tetrahydropyran revealed clear and important structural
changes characteristic of the exo-anomeric effect.
The calculations have been carried in vacuum. Simulations conducted in vacuum are
usually dominated by conformations stabilized by intramolecular H bonds. In order to prevent
formation of extensive H bonds that are not observed in polar solvents, a high dielectric
constant is used to scale down electrostatic terms.
The flexible geometry systematic search (GS) was conducted around the
interglycosidic linkage to obtain relaxed energy maps. The three glycosyl angles have been
systematically rotated by 10o increments that were followed by an energy minimization.
Simulated annealing (SA) procedure has been applied to obtain an ensemble of
structures. 1000 structures were generated for analysis.
The conformers obtained by the procedures were analysed by identifying low energy
conformational families by creating isoenergetic three dimensional surfaces according to the
three interglycosidic angles. The interglycosidic torsion angles and potential energies of the
structures were summarized and analysed.
Flexible geometry systematic search or grid search (GS)
Systematic search around the MA, MB and T angles resulted in 18 minima in the
conformational space for each three disaccharides investigated. In general, the two M angles
(Figure 4.2) indicate staggered conformations around the C1-S bond (+60o and 300o (or -60o)
for synclinal and 180o for antiperiplanar arrangements, respectively), whereas the
conformation around the disulfide bond, ω, was found to be close to ±90o. The conformations
are listed in Table 4.7. A simplified scheme of the conformational space with the location of
the 18 conformational families is depicted as an illustration in Figure 4.13.
The interglycosidic torsional angles of low energy conformations identified by the
flexible geometry search are listed in Table 4.8. The Φ angles have a ±10o deviation from the
staggered conformations around the C1-S bond, while the spread of ω angle with a range of
63
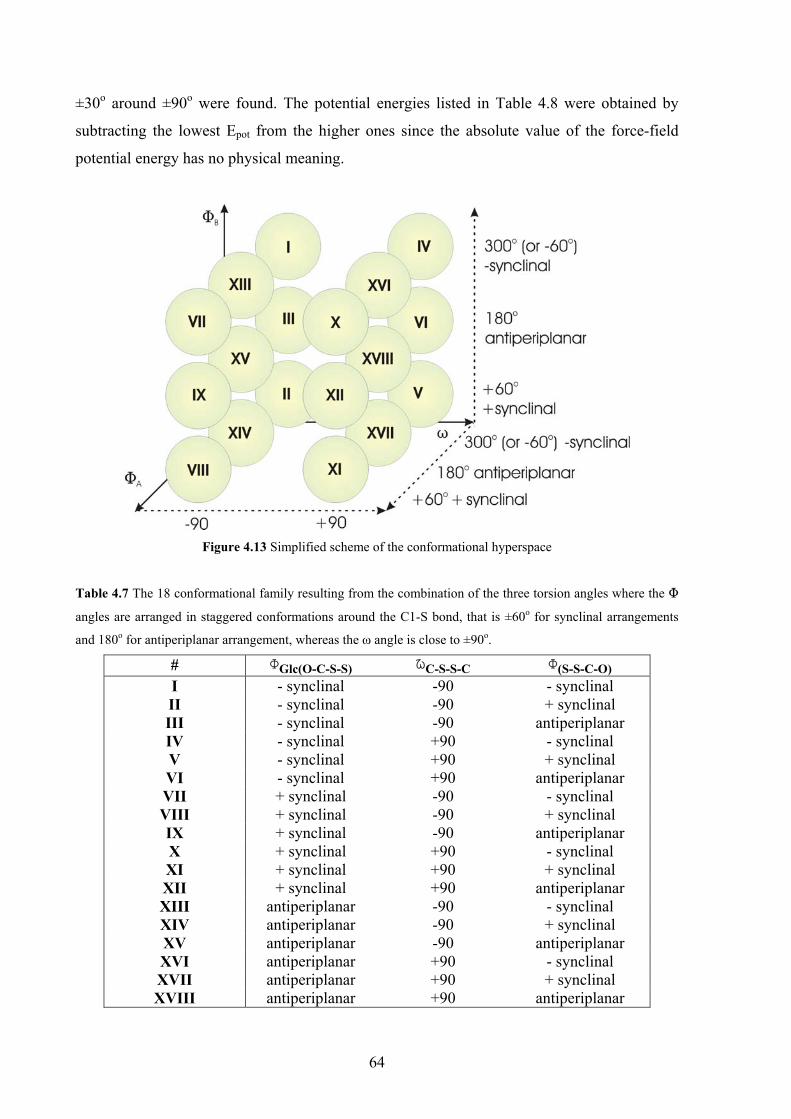
±30o around ±90o were found. The potential energies listed in Table 4.8 were obtained by
subtracting the lowest Epot from the higher ones since the absolute value of the force-field
potential energy has no physical meaning.
Figure 4.13 Simplified scheme of the conformational hyperspace
Table 4.7 The 18 conformational family resulting from the combination of the three torsion angles where the M
angles are arranged in staggered conformations around the C1-S bond, that is ±60o for synclinal arrangements
and 180o for antiperiplanar arrangement, whereas the ω angle is close to ±90o.
# MGlc(O-C-S-S) oC-S-S-C M(S-S-C-O) I - synclinal -90 - synclinal II - synclinal -90 + synclinal III - synclinal -90 antiperiplanar IV - synclinal +90 - synclinal V - synclinal +90 + synclinal VI - synclinal +90 antiperiplanar VII + synclinal -90 - synclinal VIII + synclinal -90 + synclinal IX + synclinal -90 antiperiplanar X + synclinal +90 - synclinal XI + synclinal +90 + synclinal XII + synclinal +90 antiperiplanar XIII antiperiplanar -90 - synclinal XIV antiperiplanar -90 + synclinal XV antiperiplanar -90 antiperiplanar XVI antiperiplanar +90 - synclinal XVII antiperiplanar +90 + synclinal XVIII antiperiplanar +90 antiperiplanar
64
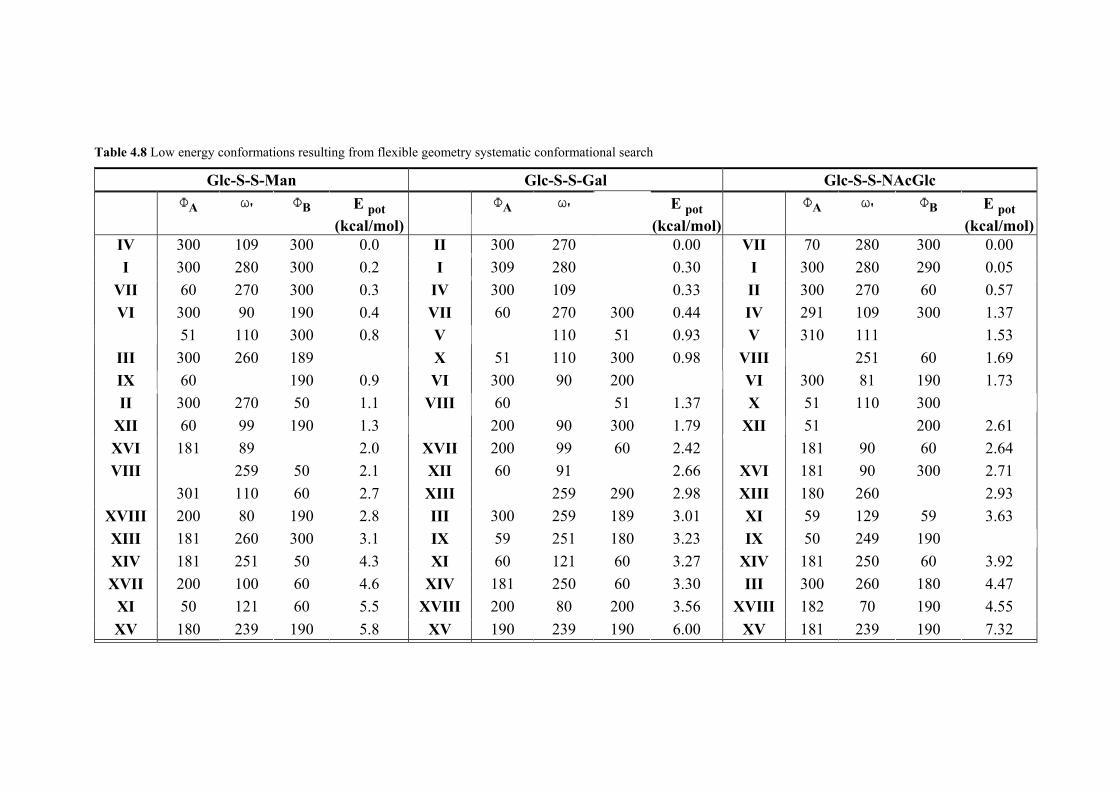
Table 4.8 Low energy conformations resulting from flexible geometry systematic conformational search
Glc-S-S-Man Glc-S-S-Gal Glc-S-S-NAcGlc MA T' MB E pot
(kcal/mol) MA MB E pot
(kcal/mol) MA T' MB E pot
(kcal/mol) IV 300 109 300 0.0 II 300 60 0.00 VII 70 280 300 0.00 I 300 280 300 0.2 I 309 300 0.30 I 300 280 290 0.05
VII 60 270 300 0.3 IV 300 300 0.33 II 300 270 60 0.57
T'
270 280 109
VI 300 90 190 0.4 VII 60 270 300 0.44 IV 291 109 300 X 51 110 300 0.8 300 110 51 0.93 V 310 50 1.53 III 300 260 0.9 X 51 110 300 0.98 60 251 60 1.69 IX 251 190 0.9 VI 300 90 1.25 VI 300 81 190 1.73 II 300 270 50 1.1 VIII 251 51 1.37 X 51 110 1.89
XII 60 99 190 XVI 200 90 300 1.79 XII 91 200 2.61 XVI 181 300 2.0 XVII 200 99 60 XVII 181 90 60 2.64
60 259 50 2.1 XII 60 190 2.66 XVI 181 90 300 V 301 110 60 2.7 190 259 290 2.98 XIII 180 300 2.93
1.37 V 111
189 VIII 60 200
60 300 1.3 51
89 2.42 VIII 91 2.71
XIII 260 XVIII 200 80 190 2.8 III 300 259 189 3.01 XI 59 129 59 3.63 XIII 181 260 300 3.1 IX 59 251 180 3.23 IX 50 249 3.82 XIV 181 251 50 4.3 XI 60 121 60 3.27 XIV 181 250 60 3.92 XVII 200 100 60 4.6 XIV 181 250 60 3.30 III 300 260 180 4.47
XI 50 121 60 5.5 XVIII 200 80 200 3.56 XVIII 182 70 190 4.55 XV 180 239 190 5.8 XV 190 239 190 6.00 XV 181 239 190 7.32
190
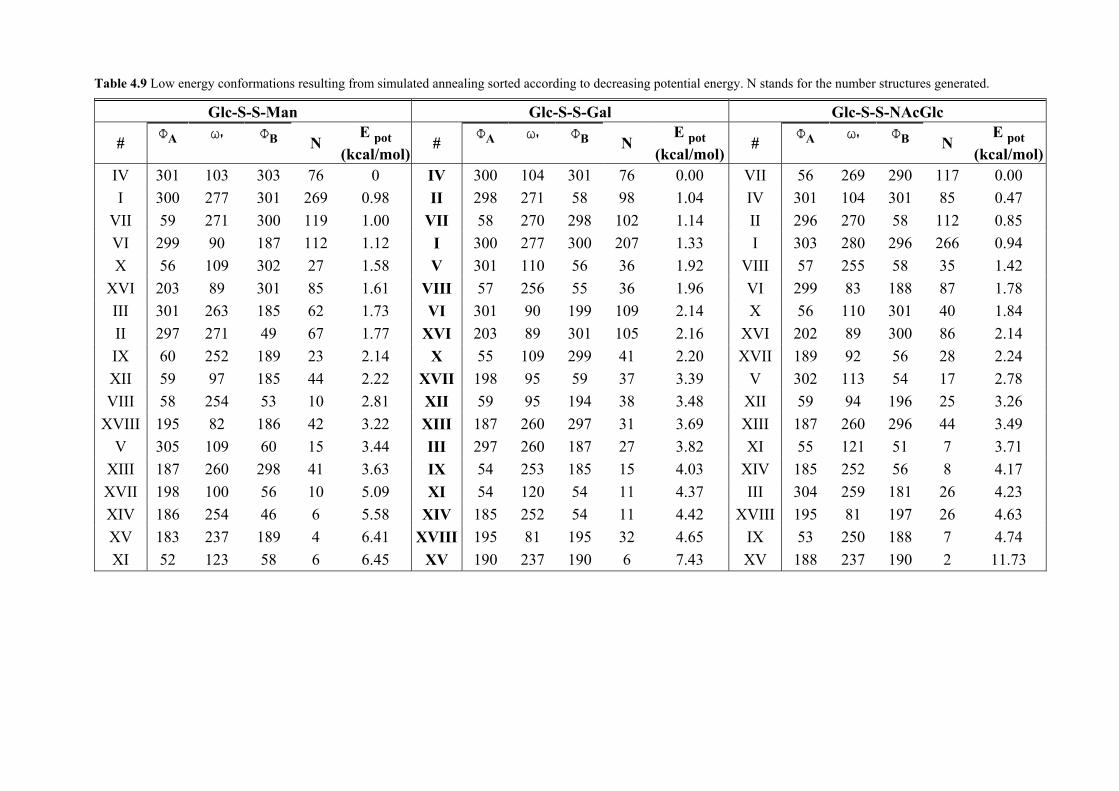
Table 4.9 Low energy conformations resulting from simulated annealing sorted according to decreasing potential energy. N stands for the number structures generated.
Glc-S-S-Man Glc-S-S-Gal Glc-S-S-NAcGlc
# MA T' MB N E pot
(kcal/mol)# MA T' MB N
E pot (kcal/mol)
# MA T' MB N E pot
(kcal/mol) IV 301 103 303 76 0 IV 300 104 301 76 0.00 VII 56 269 290 117 0.00 I 300 277 301 269 0.98 II 298 271 58 98 1.04 IV 301 104 301 85 0.47
VII 59 271 300 119 1.00 VII 58 270 298 102 1.14 II 296 270 58 112 0.85 VI 299 90 187 112 1.12 I 300 277 300 207 1.33 I 303 280 296 266 0.94 X 56 109 302 27 1.58 V 301 110 56 36 1.92 VIII 57 255 58 35 1.42
XVI 203 89 301 85 1.61 VIII 57 256 55 36 1.96 VI 299 83 188 87 1.78 III 301 263 185 62 1.73 VI 301 90 199 109 2.14 X 56 110 301 40 1.84 II 297 271 49 67 1.77 XVI 203 89 301 105 2.16 XVI 202 89 300 86 2.14 IX 60 252 189 23 2.14 X 55 109 299 41 2.20 XVII 189 92 56 28 2.24 XII 59 97 185 44 2.22 XVII 198 95 59 37 3.39 V 302 113 54 17 2.78 VIII 58 254 53 10 2.81 XII 59 95 194 38 3.48 XII 59 94 196 25 3.26
XVIII 195 82 186 42 3.22 XIII 187 260 297 31 3.69 XIII 187 260 296 44 3.49 V 305 109 60 15 3.44 III 297 260 187 27 3.82 XI 55 121 51 7 3.71
XIII 187 260 298 41 3.63 IX 54 253 185 15 4.03 XIV 185 252 56 8 4.17 XVII 198 100 56 10 5.09 XI 54 120 54 11 4.37 III 304 259 181 26 4.23 XIV 186 254 46 6 5.58 XIV 185 252 54 11 4.42 XVIII 195 81 197 26 4.63 XV 183 237 189 4 6.41 XVIII 195 81 195 32 4.65 IX 53 250 188 7 4.74 XI 52 123 58 6 6.45 XV 190 237 190 6 7.43 XV 188 237 190 2 11.73
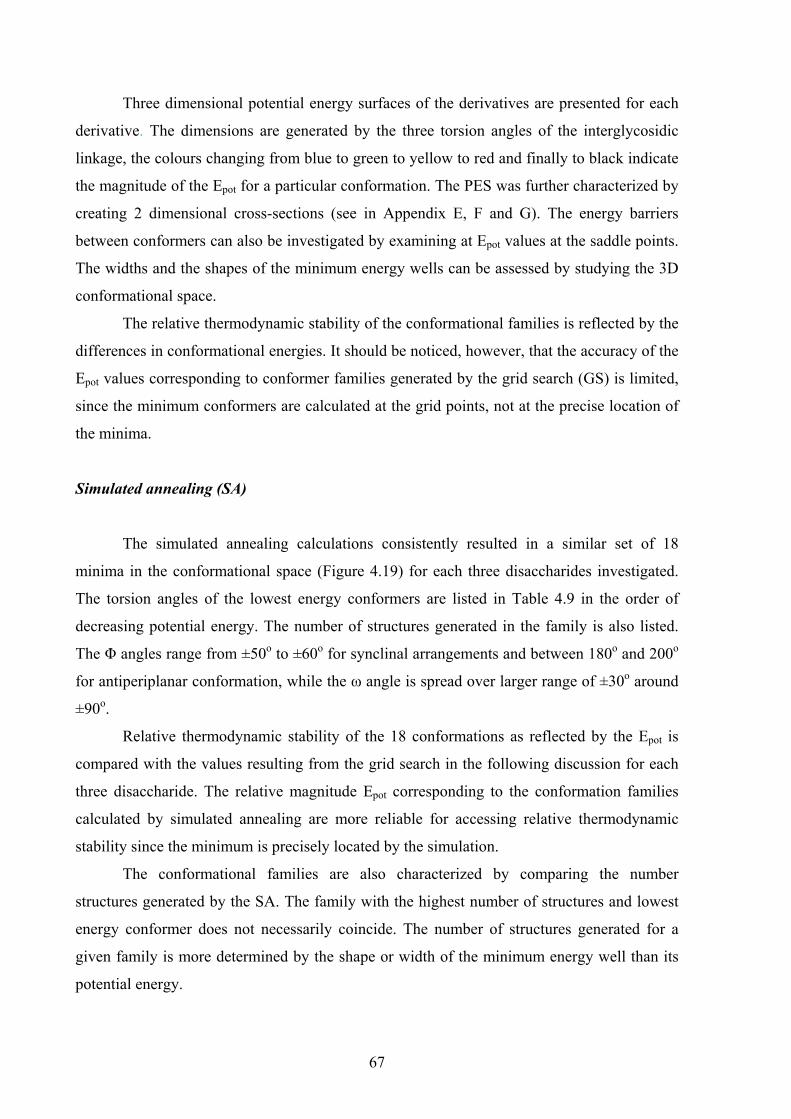
Three dimensional potential energy surfaces of the derivatives are presented for each
derivative. The dimensions are generated by the three torsion angles of the interglycosidic
linkage, the colours changing from blue to green to yellow to red and finally to black indicate
the magnitude of the Epot for a particular conformation. The PES was further characterized by
creating 2 dimensional cross-sections (see in Appendix E, F and G). The energy barriers
between conformers can also be investigated by examining at Epot values at the saddle points.
The widths and the shapes of the minimum energy wells can be assessed by studying the 3D
conformational space.
The relative thermodynamic stability of the conformational families is reflected by the
differences in conformational energies. It should be noticed, however, that the accuracy of the
Epot values corresponding to conformer families generated by the grid search (GS) is limited,
since the minimum conformers are calculated at the grid points, not at the precise location of
the minima.
Simulated annealing (SA)
The simulated annealing calculations consistently resulted in a similar set of 18
minima in the conformational space (Figure 4.19) for each three disaccharides investigated.
The torsion angles of the lowest energy conformers are listed in Table 4.9 in the order of
decreasing potential energy. The number of structures generated in the family is also listed.
The Φ angles range from ±50o to ±60o for synclinal arrangements and between 180o and 200o
for antiperiplanar conformation, while the ω angle is spread over larger range of ±30o around
±90o.
Relative thermodynamic stability of the 18 conformations as reflected by the Epot is
compared with the values resulting from the grid search in the following discussion for each
three disaccharide. The relative magnitude Epot corresponding to the conformation families
calculated by simulated annealing are more reliable for accessing relative thermodynamic
stability since the minimum is precisely located by the simulation.
The conformational families are also characterized by comparing the number
structures generated by the SA. The family with the highest number of structures and lowest
energy conformer does not necessarily coincide. The number of structures generated for a
given family is more determined by the shape or width of the minimum energy well than its
potential energy.
67
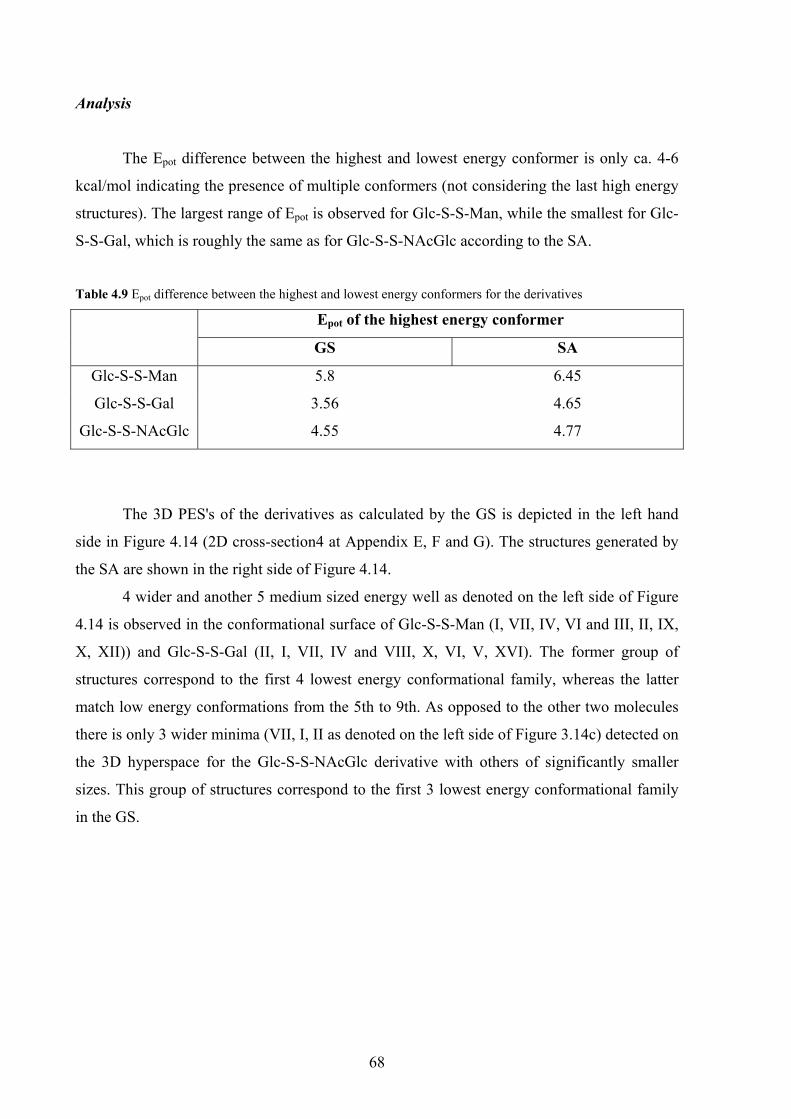
Analysis
The Epot difference between the highest and lowest energy conformer is only ca. 4-6
kcal/mol indicating the presence of multiple conformers (not considering the last high energy
structures). The largest range of Epot is observed for Glc-S-S-Man, while the smallest for Glc-
S-S-Gal, which is roughly the same as for Glc-S-S-NAcGlc according to the SA.
Table 4.9 Epot difference between the highest and lowest energy conformers for the derivatives
Epot of the highest energy conformer
GS SA
Glc-S-S-Man 5.8 6.45
Glc-S-S-Gal 3.56 4.65
Glc-S-S-NAcGlc 4.55 4.77
The 3D PES's of the derivatives as calculated by the GS is depicted in the left hand
side in Figure 4.14 (2D cross-section4 at Appendix E, F and G). The structures generated by
the SA are shown in the right side of Figure 4.14.
4 wider and another 5 medium sized energy well as denoted on the left side of Figure
4.14 is observed in the conformational surface of Glc-S-S-Man (I, VII, IV, VI and III, II, IX,
X, XII)) and Glc-S-S-Gal (II, I, VII, IV and VIII, X, VI, V, XVI). The former group of
structures correspond to the first 4 lowest energy conformational family, whereas the latter
match low energy conformations from the 5th to 9th. As opposed to the other two molecules
there is only 3 wider minima (VII, I, II as denoted on the left side of Figure 3.14c) detected on
the 3D hyperspace for the Glc-S-S-NAcGlc derivative with others of significantly smaller
sizes. This group of structures correspond to the first 3 lowest energy conformational family
in the GS.
68

0
100
200
300
0501001502002503003500
100
200
300
C-S-S-Cphi (O-C-S-S)
phi (
S-S
-C-O
)
I IV
VII II
a) Glc-S-S-Man
IV
VI
Figure
conf
VII
VII
4.14 Left
ormers ver
I
0
100
200
300
0501001502002503003500
100
200
300
C-S-S-Cphi (O-C-S-S)
phi (
S-S
-C-O
)
b) Glc-S-S-Gal
0
100
200
300
0501001502002503003500
100
200
300
C-S-S-Cphi (O-C-S-S)
phi (
S-S
-C-O
)
I
II
c) Glc-S-S-NAcGlc
: 3D PES resulting from flexible geometry conformational search by plotting energies of
sus interglycosidic torsion angles, Right: Structures from simulated annealing plotting
interglycosidic torsion angles of the structures generated.
69
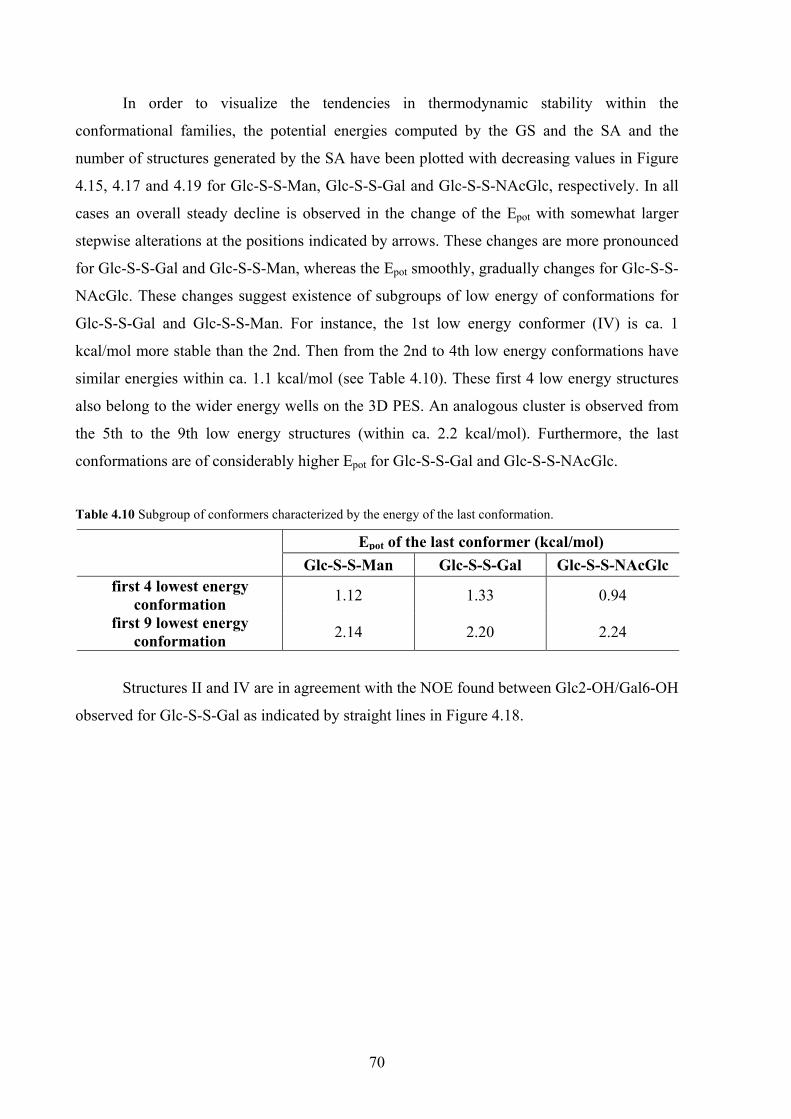
In order to visualize the tendencies in thermodynamic stability within the
conformational families, the potential energies computed by the GS and the SA and the
number of structures generated by the SA have been plotted with decreasing values in Figure
4.15, 4.17 and 4.19 for Glc-S-S-Man, Glc-S-S-Gal and Glc-S-S-NAcGlc, respectively. In all
cases an overall steady decline is observed in the change of the Epot with somewhat larger
stepwise alterations at the positions indicated by arrows. These changes are more pronounced
for Glc-S-S-Gal and Glc-S-S-Man, whereas the Epot smoothly, gradually changes for Glc-S-S-
NAcGlc. These changes suggest existence of subgroups of low energy of conformations for
Glc-S-S-Gal and Glc-S-S-Man. For instance, the 1st low energy conformer (IV) is ca. 1
kcal/mol more stable than the 2nd. Then from the 2nd to 4th low energy conformations have
similar energies within ca. 1.1 kcal/mol (see Table 4.10). These first 4 low energy structures
also belong to the wider energy wells on the 3D PES. An analogous cluster is observed from
the 5th to the 9th low energy structures (within ca. 2.2 kcal/mol). Furthermore, the last
conformations are of considerably higher Epot for Glc-S-S-Gal and Glc-S-S-NAcGlc.
Table 4.10 Subgroup of conformers characterized by the energy of the last conformation.
Epot of the last conformer (kcal/mol) Glc-S-S-Man Glc-S-S-Gal Glc-S-S-NAcGlc
first 4 lowest energy conformation 1.12 1.33 0.94
first 9 lowest energy conformation 2.14 2.20 2.24
Structures II and IV are in agreement with the NOE found between Glc2-OH/Gal6-OH
observed for Glc-S-S-Gal as indicated by straight lines in Figure 4.18.
70
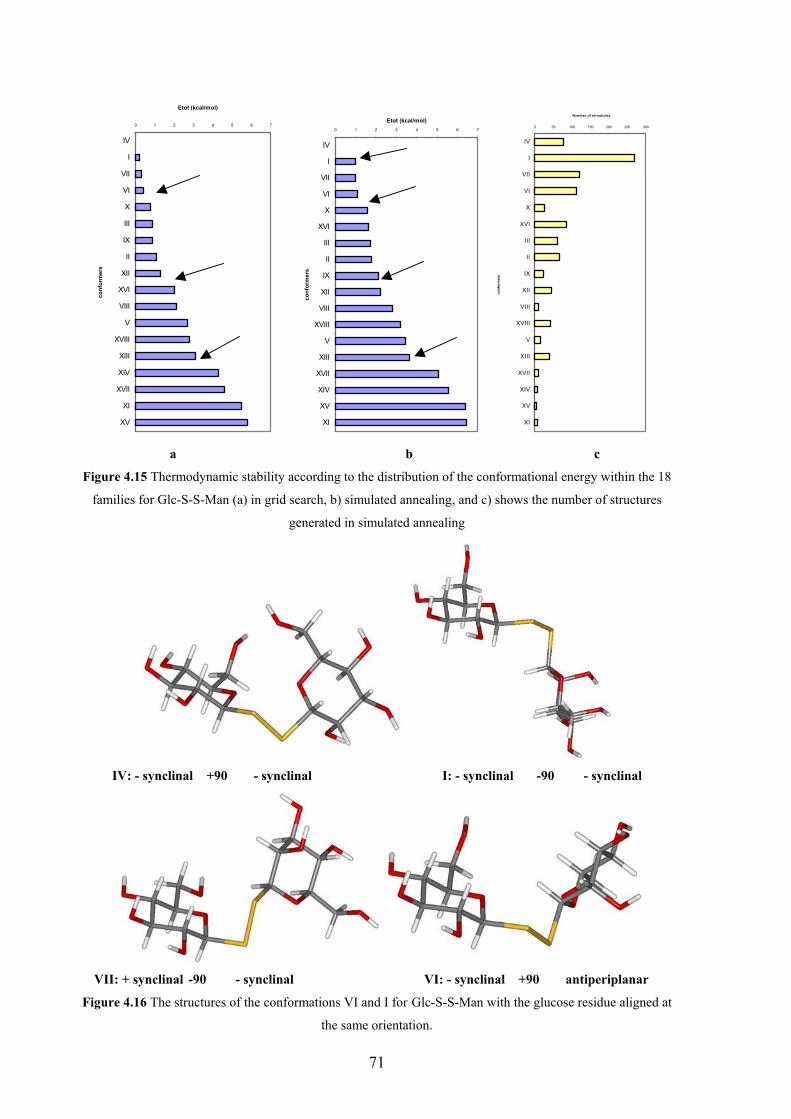
0 1 2 3 4 5 6 7
IV
I
VII
VI
X
III
IX
II
XII
XVI
VIII
V
XVIII
XIII
XIV
XVII
XI
XV
conf
orm
ers
Etot (kcal/mol)
0 1 2 3 4 5 6 7
IV
I
VII
VI
X
XVI
III
II
IX
XII
VIII
XVIII
V
XIII
XVII
XIV
XV
XI
conf
orm
ers
Etot (kcal/mol)
0 50 100 150 200 250 300
IV
I
VII
VI
X
XVI
III
II
IX
XII
VIII
XVIII
V
XIII
XVII
XIV
XV
XI
conf
orm
ers
Number of structures
a b c
Figure 4.15 Thermodynamic stability according to the distribution of the conformational energy within the 18
families for Glc-S-S-Man (a) in grid search, b) simulated annealing, and c) shows the number of structures
generated in simulated annealing
IV: - synclinal +90 - synclinal I: - synclinal -90 - synclinal
VII: + synclinal -90 - synclinal VI: - synclinal +90 antiperiplanar
Figure 4.16 The structures of the conformations VI and I for Glc-S-S-Man with the glucose residue aligned at
the same orientation.
71

0 1 2 3 4 5 6 7 8
IV
II
VII
I
V
VIII
VI
XVI
X
XVII
XII
XIII
III
IX
XI
XIV
XVIII
XV
conf
orm
ers
Epot (kcal/mol)
0 50 100 150 200 250
IV
II
VII
I
V
VIII
VI
XVI
X
XVII
XII
XIII
III
IX
XI
XIV
XVIII
XV
conf
orm
atio
ns
Number of structures
0 1 2 3 4 5 6 7
II
I
IV
VII
V
X
VI
VIII
XVI
XVII
XII
XIII
III
IX
XI
XIV
XVIII
XV
conf
orm
ers
Epot (kcal/mol)
a b c Figure 4.17 Thermodynamic stability according to the distribution of the conformational energy within the 18
families for Glc-S-S-Gal (a) in the grid search, b) simulated annealing, and c) shows the number of structures
generated in the simulated annealing
IV: - synclinal +90 - synclinal I: - synclinal -90 - synclinal
4
4
II: - synclinal -90 + synclinal VII: + synclinal -90 - synclinal
Figure 4.18 The structures of conformations I, VI, II, and VII for Glc-S-S-Gal with the glucose residue aligned
at the same orientation. 1H-1H distances observed experimentally are highligthed.
72
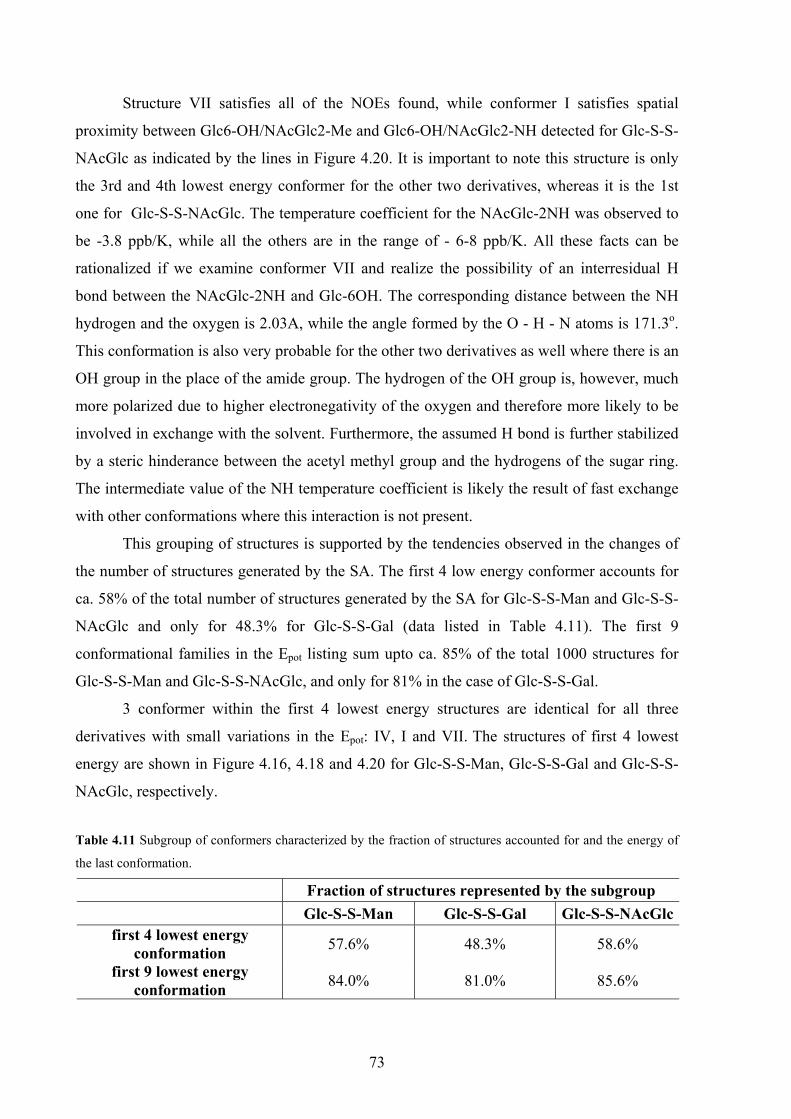
Structure VII satisfies all of the NOEs found, while conformer I satisfies spatial
proximity between Glc6-OH/NAcGlc2-Me and Glc6-OH/NAcGlc2-NH detected for Glc-S-S-
NAcGlc as indicated by the lines in Figure 4.20. It is important to note this structure is only
the 3rd and 4th lowest energy conformer for the other two derivatives, whereas it is the 1st
one for Glc-S-S-NAcGlc. The temperature coefficient for the NAcGlc-2NH was observed to
be -3.8 ppb/K, while all the others are in the range of - 6-8 ppb/K. All these facts can be
rationalized if we examine conformer VII and realize the possibility of an interresidual H
bond between the NAcGlc-2NH and Glc-6OH. The corresponding distance between the NH
hydrogen and the oxygen is 2.03A, while the angle formed by the O - H - N atoms is 171.3o.
This conformation is also very probable for the other two derivatives as well where there is an
OH group in the place of the amide group. The hydrogen of the OH group is, however, much
more polarized due to higher electronegativity of the oxygen and therefore more likely to be
involved in exchange with the solvent. Furthermore, the assumed H bond is further stabilized
by a steric hinderance between the acetyl methyl group and the hydrogens of the sugar ring.
The intermediate value of the NH temperature coefficient is likely the result of fast exchange
with other conformations where this interaction is not present.
This grouping of structures is supported by the tendencies observed in the changes of
the number of structures generated by the SA. The first 4 low energy conformer accounts for
ca. 58% of the total number of structures generated by the SA for Glc-S-S-Man and Glc-S-S-
NAcGlc and only for 48.3% for Glc-S-S-Gal (data listed in Table 4.11). The first 9
conformational families in the Epot listing sum upto ca. 85% of the total 1000 structures for
Glc-S-S-Man and Glc-S-S-NAcGlc, and only for 81% in the case of Glc-S-S-Gal.
3 conformer within the first 4 lowest energy structures are identical for all three
derivatives with small variations in the Epot: IV, I and VII. The structures of first 4 lowest
energy are shown in Figure 4.16, 4.18 and 4.20 for Glc-S-S-Man, Glc-S-S-Gal and Glc-S-S-
NAcGlc, respectively.
Table 4.11 Subgroup of conformers characterized by the fraction of structures accounted for and the energy of
the last conformation.
Fraction of structures represented by the subgroup Glc-S-S-Man Glc-S-S-Gal Glc-S-S-NAcGlc
first 4 lowest energy conformation 57.6% 48.3% 58.6%
first 9 lowest energy conformation 84.0% 81.0% 85.6%
73
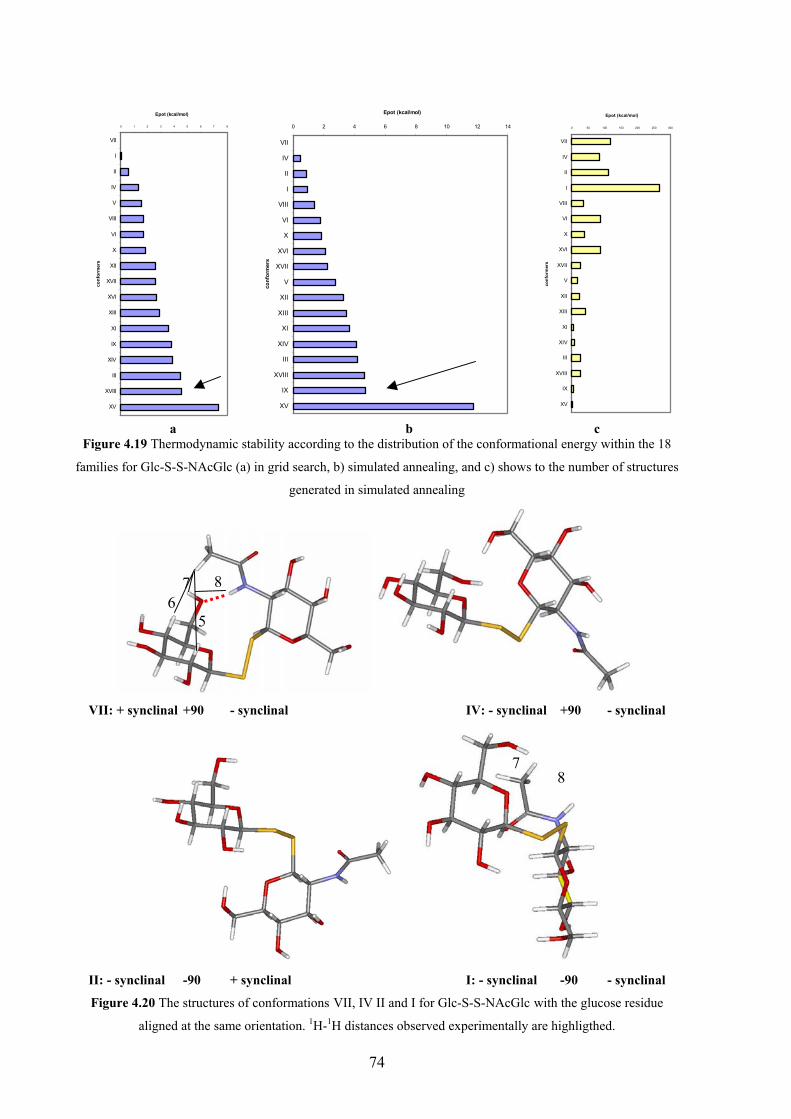
0 1 2 3 4 5 6 7 8
VII
I
II
IV
V
VIII
VI
X
XII
XVII
XVI
XIII
XI
IX
XIV
III
XVIII
XV
conf
orm
ers
Epot (kcal/mol)
0 2 4 6 8 10 12 14
VII
IV
II
I
VIII
VI
X
XVI
XVII
V
XII
XIII
XI
XIV
III
XVIII
IX
XV
conf
orm
ers
Epot (kcal/mol)
0 50 100 150 200 250 300
VII
IV
II
I
VIII
VI
X
XVI
XVII
V
XII
XIII
XI
XIV
III
XVIII
IX
XV
conf
orm
ers
Epot (kcal/mol)
a b c Figure 4.19 Thermodynamic stability according to the distribution of the conformational energy within the 18
families for Glc-S-S-NAcGlc (a) in grid search, b) simulated annealing, and c) shows to the number of structures
generated in simulated annealing
6
5
VII: + synclinal +90
II: - synclinal -90
Figure 4.20 The struc
aligned at the
8
7- synclinal IV: - synclinal +90 - synclinal
78
+ synclinal I: - synclinal -90 - synclinal
tures of conformations VII, IV II and I for Glc-S-S-NAcGlc with the glucose residue
same orientation. 1H-1H distances observed experimentally are highligthed.
74

Both conformer I and VI feature double exo-anomeric effects possessing -synclinal
arrangements at the Φ angles close to the sugar residues, whereas most of the conformers
among the first 9 low energy structures incorporate at least one exo-anomeric effect as listed
in Table 4.12. Conformations with exo-anomeric effects are marked with bold font in Table
4.12.
# MGlc(O-C-S-S) oC-S-S-C MMan(S-S-C-O) IV - synclinal +90 - synclinal I - synclinal -90 - synclinal
VII + synclinal -90 - synclinal VI - synclinal +90 antiperiplanar X + synclinal +90 - synclinal
XVI antiperiplanar -90 + synclinal III - synclinal -90 antiperiplanar II - synclinal -90 + synclinal IX + synclinal -90 antiperiplanar
# MGlc(O-C-S-S) oC-S-S-C MGal(S-S-C-O) IV - synclinal +90 - synclinal II - synclinal -90 + synclinal
VII + synclinal -90 - synclinal I - synclinal -90 - synclinal V - synclinal +90 + synclinal
VIII + synclinal -90 + synclinal VI - synclinal +90 antiperiplanar
XVI antiperiplanar +90 - synclinal X + synclinal +90 - synclinal
# MGlc(O-C-S-S) oC-S-S-C MNAcGlc(S-S-C-O) VII + synclinal -90 - synclinal IV - synclinal +90 - synclinal II - synclinal -90 + synclinal I - synclinal -90 - synclinal
VIII + synclinal -90 + synclinal VI - synclinal +90 antiperiplanar X + synclinal +90 - synclinal
XVI antiperiplanar +90 - synclinal XVII antiperiplanar +90 + synclinal
Table 4.12 Most probable conformers listed in the order of increasing Epot calculated by SA for Glc-S-S-Man
(first table), for Glc-S-S-NAcGlc (second table) and for Glc-S-S-Gal (third table)
75
4.5 Conclusion Temperature coefficients for the hydroxide and amide protons indicate that labile
protons were exposed to the solvent and not involved in hydrogen bonding. Only a few
conformationally relevant interannular NOEs contacts were found for all three derivatives.
Relative magnitudes of the intraresidue RDCs were interpreted in terms of the
stereochemistry at each carbon centre. The 5 one-bond 1H-13C RDCs measured for each
sugar ring provide 1 independent data for the glucose residue and 2 independent data for the
mannose and galactose residue. Since determination of alignment tensor for the individual
monosaccharide units which is required for flexible oligosaccharides were not possible with
lack of 1H-1H RDC data, therefore structure determination on the basis of RDCs was not
attempted thus far.
Systematic search around the MA, MB and T angles as well as simulated annealing
calculations consistently resulted in 18 minima in the conformational space for each of the 3
disaccharides investigated. The M angles close to the sugar residues are featuring the angles of
the staggered conformations around the C1-S bond, that is +60o and -60o) for synclinal
arrangements and 180o for antiperiplanar arrangement, whereas the conformation around the
disulfide bond, ω, were found to be close to ±90o.
On the basis of the distribution of the E pot and the number of structures generated by
SA conformational families were divided into subgroups of low energy of conformations. The
larger subgroup includes the first 9 lowest energy conformations. Within these, separate
subgroup incorporating the first 4 lowest energy structures can be distinguished. 3 conformers
IV, I and VII within the latter group were found to be identical for all three derivatives with
insignificant variation in the Epot. Conformers featuring exo-anomeric effect at their M angles dominate among the low
energy conformers. The conformations with double exo-anomeric effect are among the first 3
lowest energy conformers with conformer IV being the lowest energy conformer in the listing
of SA (with the exception for Glc-S-S-NAcGlc where VII is more stable by 0.47 kcal/mol)
and conformer I being the most abundant one in SA.
None of the minimum conformation can be used as 'single state model' to satisfactorily
account for the experimental data observed. It is shown the interglycosidic linkage in the
disulfide disaccharide derivatives must be treated as a flexible entity to account for the
experimental data. Intraresidual NOEs were found to be in agreement with conformations
among low energy structures.
76
Existence of H bonding interaction can be assumed in conformer VII in derivative
Glc-S-S-NAcGlc between with NAcGlc-2NH being the H donor and the acceptor provided by
the oxygen in the Glc-6OH group. This assumption is based on the intermediate value of the
temperature coefficient for NAcGlc-2NH, comparison of the Epot energy order between
derivatives, the presence of 4 interresidual NOEs which are satisfied by conformer VII and
finally by the arrangement of the three atoms involved which is characteristic of the geometry
of a H bond.
Experimental data suggested the presence of several different, time-averaged
conformations, however the computational results were indicative of definite conformational
preferences in these novel disulfide disaccharide mimics. Thus, the increase of the degrees of
motional freedom, expected a priori upon extension of the interglycosidic linkage, gets largely
offset by stereoelectronic effects, such as the exo-anomeric effect and the preference of the
disulfide torsion angle towards 90o.
77

78
IMPROVING METHODS
FOR DETERMINATION OF NMR PARAMETERS
79
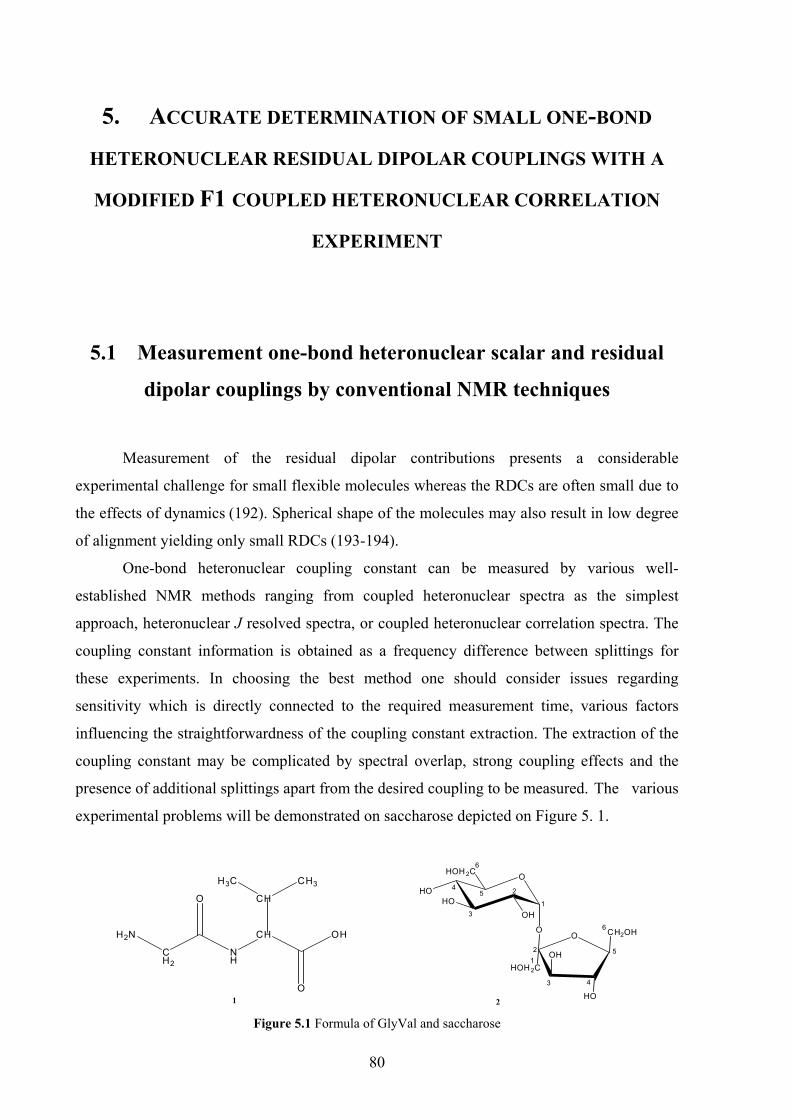
5. ACCURATE DETERMINATION OF SMALL ONE-BOND
HETERONUCLEAR RESIDUAL DIPOLAR COUPLINGS WITH A
MODIFIED F1 COUPLED HETERONUCLEAR CORRELATION
EXPERIMENT
5.1 Measurement one-bond heteronuclear scalar and residual
dipolar couplings by conventional NMR techniques
Measurement of the residual dipolar contributions presents a considerable
experimental challenge for small flexible molecules whereas the RDCs are often small due to
the effects of dynamics (192). Spherical shape of the molecules may also result in low degree
of alignment yielding only small RDCs (193-194).
One-bond heteronuclear coupling constant can be measured by various well-
established NMR methods ranging from coupled heteronuclear spectra as the simplest
approach, heteronuclear J resolved spectra, or coupled heteronuclear correlation spectra. The
coupling constant information is obtained as a frequency difference between splittings for
these experiments. In choosing the best method one should consider issues regarding
sensitivity which is directly connected to the required measurement time, various factors
influencing the straightforwardness of the coupling constant extraction. The extraction of the
coupling constant may be complicated by spectral overlap, strong coupling effects and the
presence of additional splittings apart from the desired coupling to be measured. The various
experimental problems will be demonstrated on saccharose depicted on Figure 5. 1.
1
2
3
45
6
12
43
5
6O
HO
O
HOOH
HOH 2C
O
HOH2COH
HO
CH2OH
2
OHCH
NH
CH2
H2N
O CH
H3C CH3
O1
Figure 5.1 Formula of GlyVal and saccharose
80
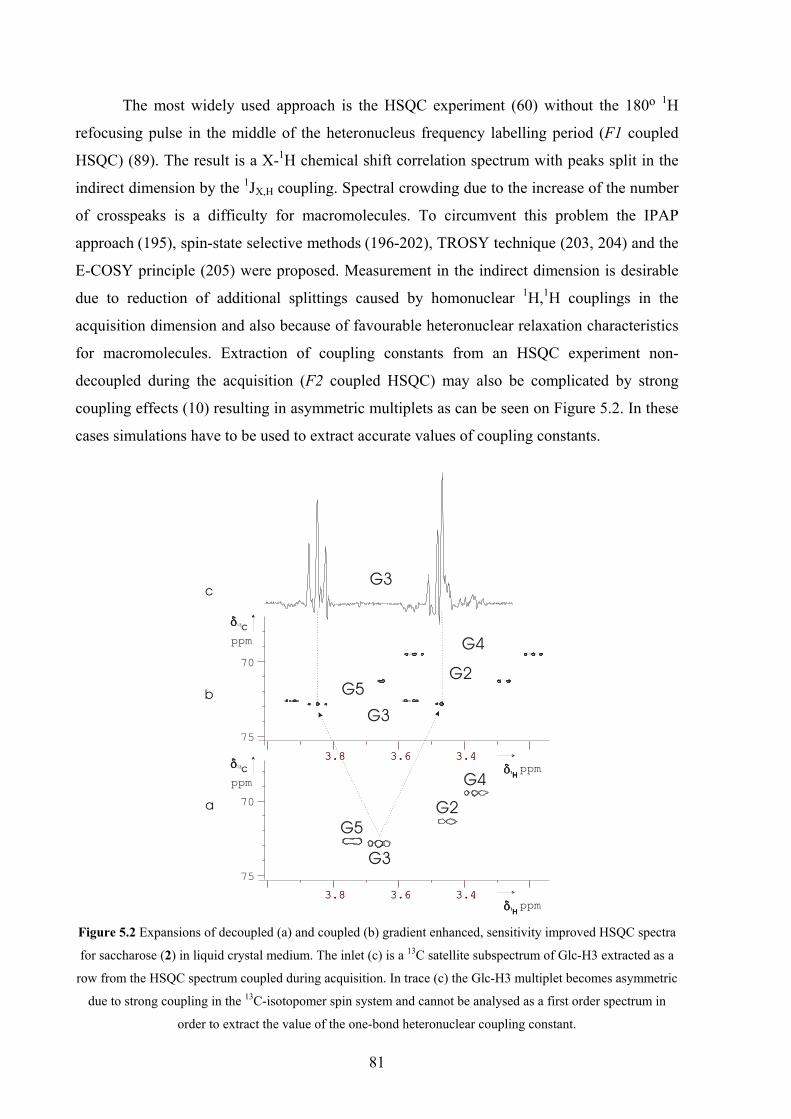
The most widely used approach is the HSQC experiment (60) without the 180o 1H
refocusing pulse in the middle of the heteronucleus frequency labelling period (F1 coupled
HSQC) (89). The result is a X-1H chemical shift correlation spectrum with peaks split in the
indirect dimension by the 1JX,H coupling. Spectral crowding due to the increase of the number
of crosspeaks is a difficulty for macromolecules. To circumvent this problem the IPAP
approach (195), spin-state selective methods (196-202), TROSY technique (203, 204) and the
E-COSY principle (205) were proposed. Measurement in the indirect dimension is desirable
due to reduction of additional splittings caused by homonuclear 1H,1H couplings in the
acquisition dimension and also because of favourable heteronuclear relaxation characteristics
for macromolecules. Extraction of coupling constants from an HSQC experiment non-
decoupled during the acquisition (F2 coupled HSQC) may also be complicated by strong
coupling effects (10) resulting in asymmetric multiplets as can be seen on Figure 5.2. In these
cases simulations have to be used to extract accurate values of coupling constants.
3.43.63.8 3.43.63.8
3.43.63.8 3.43.63.8
75
75
70
70
ppm
ppm
G5
G3
G4
G2
G5
G3
G4
G2
G3
a
b
c
**
**
ppm
** ppm**
Figure 5.2 Expansions of decoupled (a) and coupled (b) gradient enhanced, sensitivity improved HSQC spectra
for saccharose (2) in liquid crystal medium. The inlet (c) is a 13C satellite subspectrum of Glc-H3 extracted as a
row from the HSQC spectrum coupled during acquisition. In trace (c) the Glc-H3 multiplet becomes asymmetric
due to strong coupling in the 13C-isotopomer spin system and cannot be analysed as a first order spectrum in
order to extract the value of the one-bond heteronuclear coupling constant.
81

In order to achieve optimum precision, data must be collected for a period of time on
the order of the proton transverse relaxation time. Heteronuclear correlation experiments
coupled in the indirect F1 dimension are limited by the necessity of acquiring large number of
t1 points to achieve high digital resolution in a spectral window determined by the large
chemical shift dispersion of the heteronucleus, therefore making the experiment rather time-
consuming. J resolved spectroscopy can be employed to reduce the frequency span of the
indirect dimension and also to improve precision as field inhomogenity effects are refocused,
this is however, often compromised by overlap in the acquisition dimension even in case of
medium sized molecules.
72.4
72.6
72.8
73.0
73.2
73.4
73.6
73.8
4.054.10 4.054.10 4.054.10 4.054.10
a b c d e ppm**
ppm
**
Figure 5.3 Comparison of Glc-5 carbon multiplet of saccharose (2) in a liquid crystalline phase in non-
refocused, non-decoupled 13C INEPT (a), and in various gradient enhanced F1-coupled HSQC spectra without
sensitivity improvement (b), with sensitivity improvement (c), with G-BIRD(r) module in the t1 period (d), and
with both sensitivity improvement and G-BIRD(r) module (e). In a), b), and c) the carbon signal is split by the
one-bond 1J13C,1H coupling and by many long-range couplings resulting in a broad multiplet. The insertion of
the G-BIRD(r) element (d, e) effectively removes the splittings caused by the long-range interactions.
82
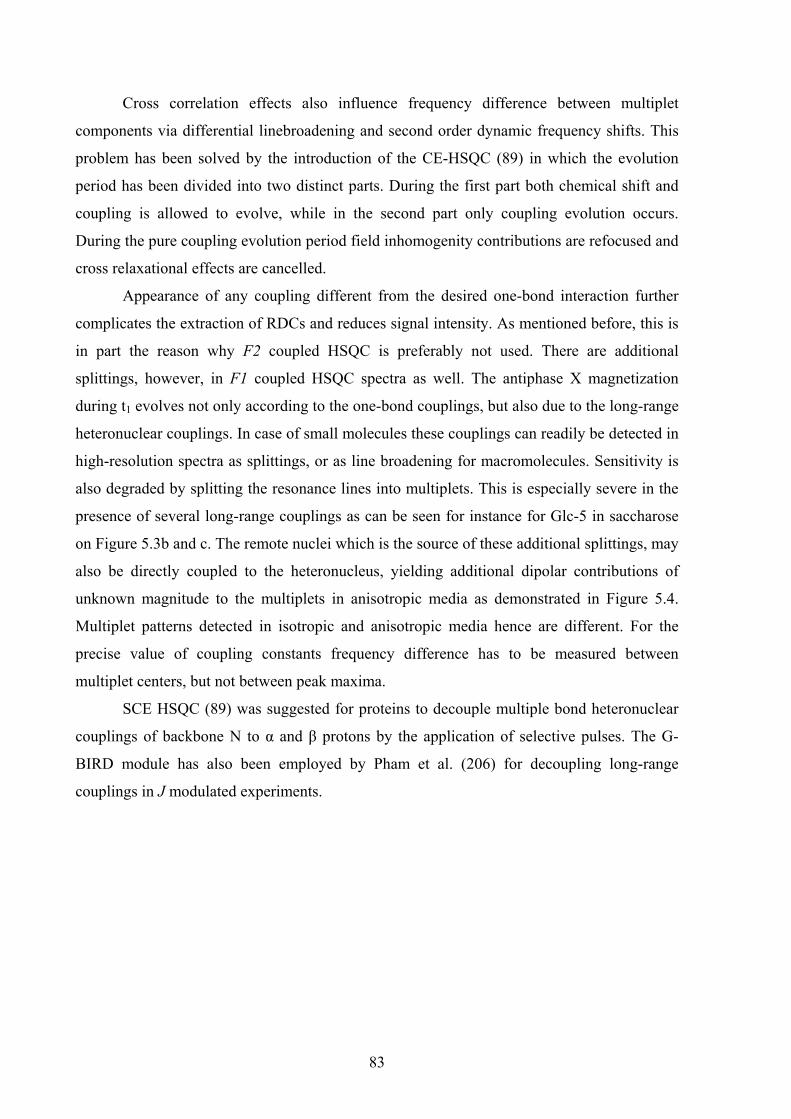
Cross correlation effects also influence frequency difference between multiplet
components via differential linebroadening and second order dynamic frequency shifts. This
problem has been solved by the introduction of the CE-HSQC (89) in which the evolution
period has been divided into two distinct parts. During the first part both chemical shift and
coupling is allowed to evolve, while in the second part only coupling evolution occurs.
During the pure coupling evolution period field inhomogenity contributions are refocused and
cross relaxational effects are cancelled.
Appearance of any coupling different from the desired one-bond interaction further
complicates the extraction of RDCs and reduces signal intensity. As mentioned before, this is
in part the reason why F2 coupled HSQC is preferably not used. There are additional
splittings, however, in F1 coupled HSQC spectra as well. The antiphase X magnetization
during t1 evolves not only according to the one-bond couplings, but also due to the long-range
heteronuclear couplings. In case of small molecules these couplings can readily be detected in
high-resolution spectra as splittings, or as line broadening for macromolecules. Sensitivity is
also degraded by splitting the resonance lines into multiplets. This is especially severe in the
presence of several long-range couplings as can be seen for instance for Glc-5 in saccharose
on Figure 5.3b and c. The remote nuclei which is the source of these additional splittings, may
also be directly coupled to the heteronucleus, yielding additional dipolar contributions of
unknown magnitude to the multiplets in anisotropic media as demonstrated in Figure 5.4.
Multiplet patterns detected in isotropic and anisotropic media hence are different. For the
precise value of coupling constants frequency difference has to be measured between
multiplet centers, but not between peak maxima.
SCE HSQC (89) was suggested for proteins to decouple multiple bond heteronuclear
couplings of backbone N to α and β protons by the application of selective pulses. The G-
BIRD module has also been employed by Pham et al. (206) for decoupling long-range
couplings in J modulated experiments.
83
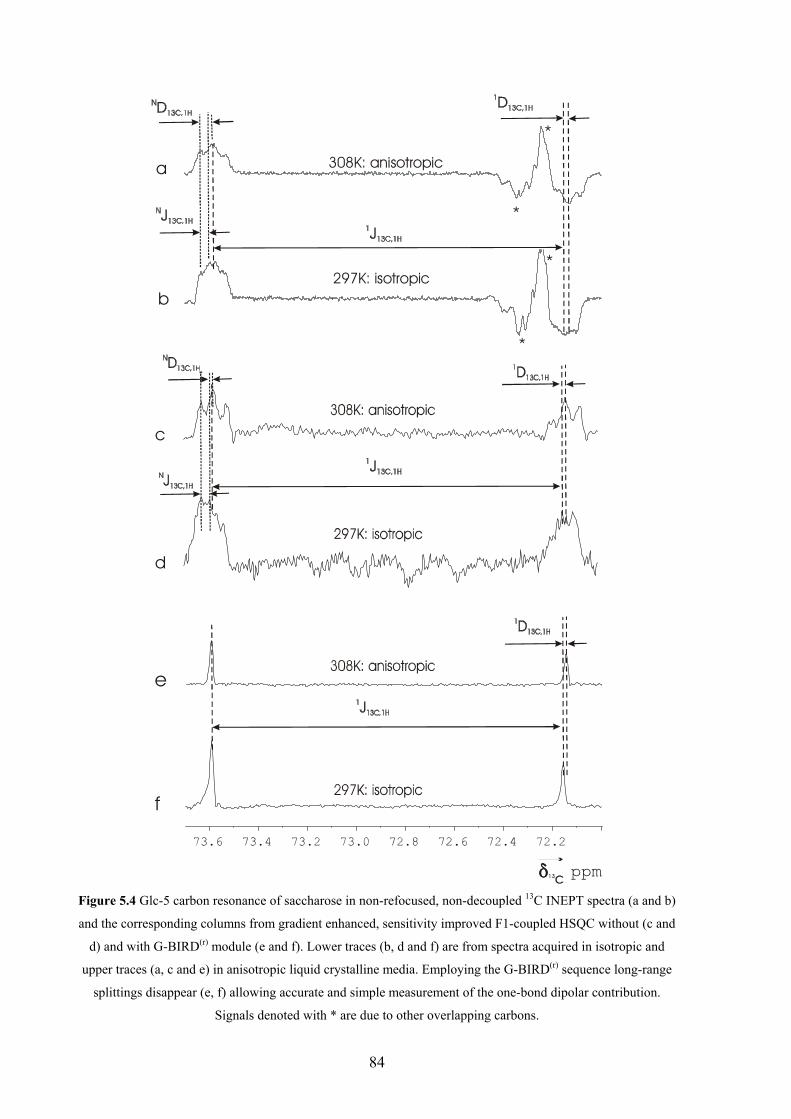
308K: anisotropic
297K: isotropic
*
*
*
*
a
d
b
c
e
ppm**
f
Figure 5.4 Glc-5 carbon resonance of saccharose in non-refocused, non-decoupled 13C INEPT spectra (a and b)
and the corresponding columns from gradient enhanced, sensitivity improved F1-coupled HSQC without (c and
d) and with G-BIRD(r) module (e and f). Lower traces (b, d and f) are from spectra acquired in isotropic and
upper traces (a, c and e) in anisotropic liquid crystalline media. Employing the G-BIRD(r) sequence long-range
splittings disappear (e, f) allowing accurate and simple measurement of the one-bond dipolar contribution.
Signals denoted with * are due to other overlapping carbons.
84
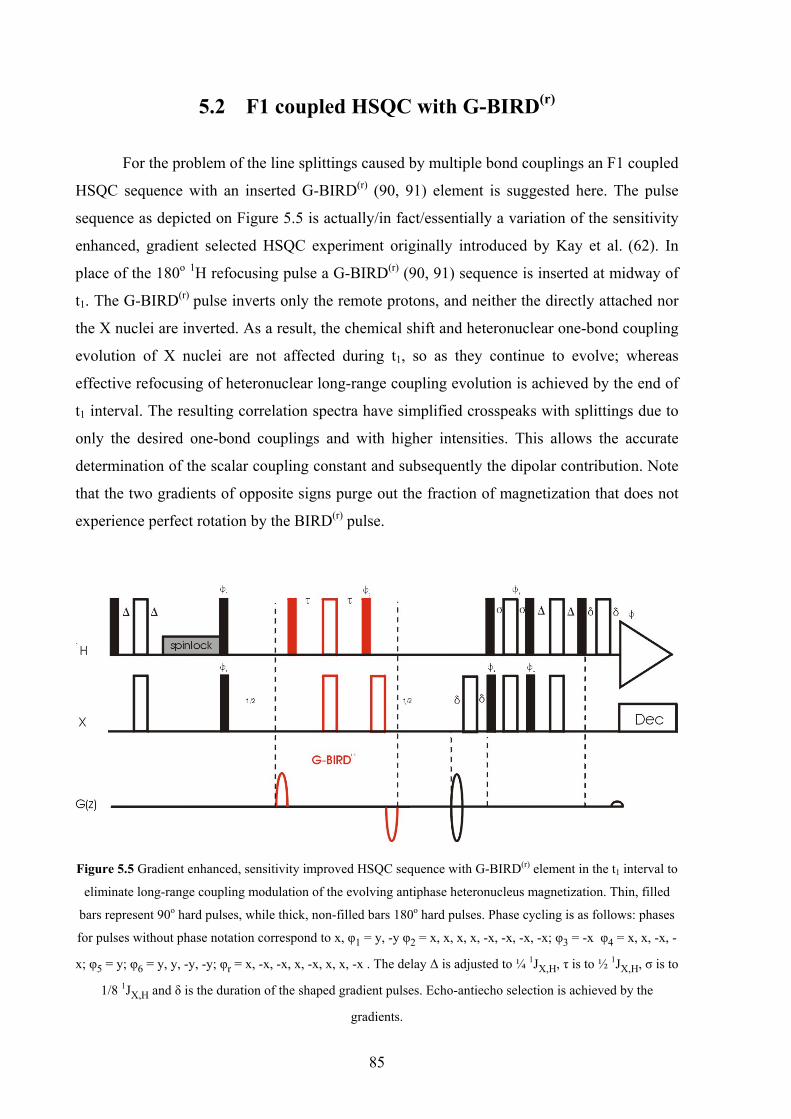
5.2 F1 coupled HSQC with G-BIRD(r)
For the problem of the line splittings caused by multiple bond couplings an F1 coupled
HSQC sequence with an inserted G-BIRD(r) (90, 91) element is suggested here. The pulse
sequence as depicted on Figure 5.5 is actually/in fact/essentially a variation of the sensitivity
enhanced, gradient selected HSQC experiment originally introduced by Kay et al. (62). In
place of the 180o 1H refocusing pulse a G-BIRD(r) (90, 91) sequence is inserted at midway of
t1. The G-BIRD(r) pulse inverts only the remote protons, and neither the directly attached nor
the X nuclei are inverted. As a result, the chemical shift and heteronuclear one-bond coupling
evolution of X nuclei are not affected during t1, so as they continue to evolve; whereas
effective refocusing of heteronuclear long-range coupling evolution is achieved by the end of
t1 interval. The resulting correlation spectra have simplified crosspeaks with splittings due to
only the desired one-bond couplings and with higher intensities. This allows the accurate
determination of the scalar coupling constant and subsequently the dipolar contribution. Note
that the two gradients of opposite signs purge out the fraction of magnetization that does not
experience perfect rotation by the BIRD(r) pulse.
Figure 5.5 Gradient enhanced, sensitivity improved HSQC sequence with G-BIRD(r) element in the t1 interval to
eliminate long-range coupling modulation of the evolving antiphase heteronucleus magnetization. Thin, filled
bars represent 90o hard pulses, while thick, non-filled bars 180o hard pulses. Phase cycling is as follows: phases
for pulses without phase notation correspond to x, φ1 = y, -y φ2 = x, x, x, x, -x, -x, -x, -x; φ3 = -x φ4 = x, x, -x, -
x; φ5 = y; φ6 = y, y, -y, -y; φr = x, -x, -x, x, -x, x, x, -x . The delay ∆ is adjusted to ¼ 1JX,H, τ is to ½ 1JX,H, σ is to
1/8 1JX,H and δ is the duration of the shaped gradient pulses. Echo-antiecho selection is achieved by the
gradients.
85

The method has been tested on isotropic samples of a model dipeptide glicine-valine
(GlyVal) and partially oriented anisotropic sample of saccharose, both of them are depicted
on Figure 5.1. In case of the peptide there is one single long-range coupling to the amide 15N
resulting in a clear doublet of doublet that can be seen on Figure 5.6a and b.
*
**
a b c**
Figure 5.6 Comparison of multiplicity and intensity of backbone 15N in a model dipeptide, GlyVal 1 in a) non-
refocused, non-decoupled 15N INEPT, b) gradient enhanced F1-coupled HSQC, and c) gradient enhanced F1-
coupled HSQC with G-BIRD(r) module in the t1 period. In a and b the 15N signal is split by the one-bond 1J15N,1H
coupling and by long-range coupling to Hα resulting in a well-resolved doublet. The insertion of the G-BIRD(r)
element (c) effectively removes the splitting caused by the long-range interaction. Comparing the peak
intensities in columns extracted from 2D spectra demonstrates that the decoupling of long-range interactions
considerably improves the sensitivity.
For a carbohydrate on the other hand, there are many long-range heteronuclear
interactions that yield an unresolved, broad multiplet (Figure 5.3.a,b,c). The one-bond
coupling constant is therefore extracted by measuring frequency difference between the
multiplet centers which is a relatively easy task in case of the peptide, but problematic for the
broad multiplet of the carbohydrate (see Figure 5.4). As seen on Figure 5.4 the Glc-5 carbon
signal is split by the one-bond coupling to the directly bonded proton (an antiphase splitting in
INEPT and an in-phase splitting in HSQC) and by the long-range couplings to all the multiple
bonded protons. Small increase of the one-bond coupling due to the dipolar contribution can
be detected in partially oriented phase by measuring differences between multiplet centers.
The multiplet patterns caused by the long-range couplings are also changing due to small
dipolar interaction between the relevant spins resulting in long-range RDCs (1D13C,1H). For
86
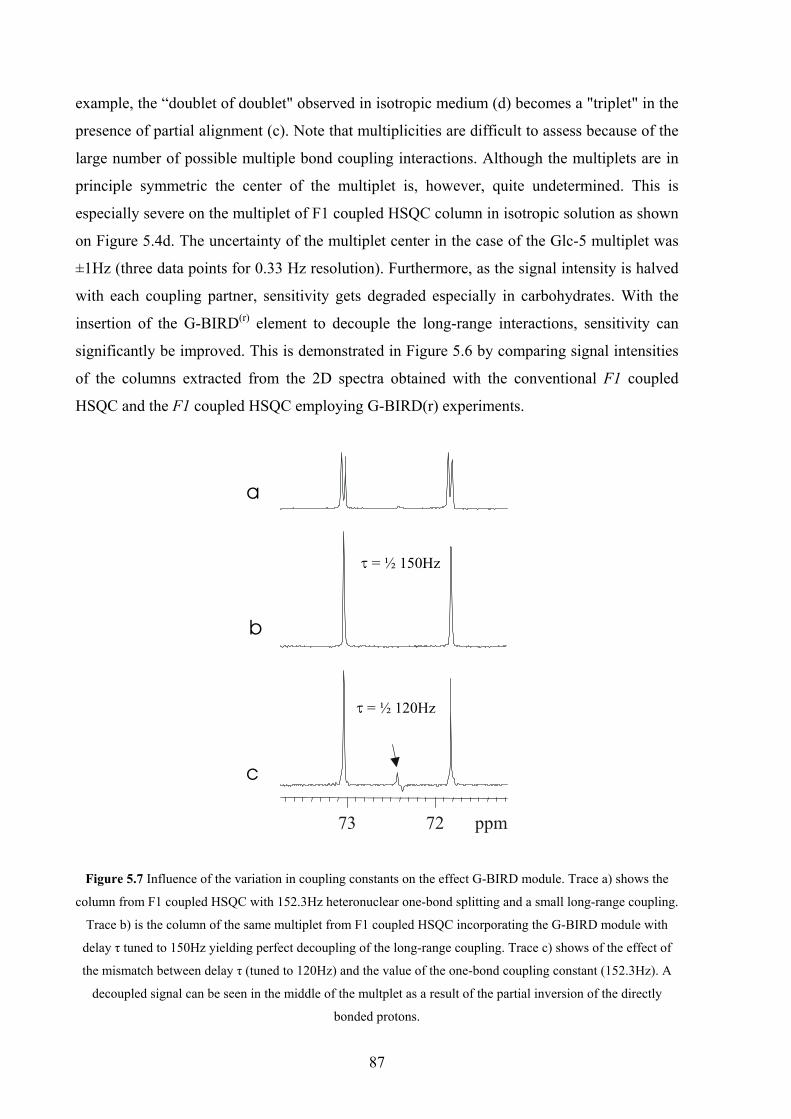
example, the “doublet of doublet" observed in isotropic medium (d) becomes a "triplet" in the
presence of partial alignment (c). Note that multiplicities are difficult to assess because of the
large number of possible multiple bond coupling interactions. Although the multiplets are in
principle symmetric the center of the multiplet is, however, quite undetermined. This is
especially severe on the multiplet of F1 coupled HSQC column in isotropic solution as shown
on Figure 5.4d. The uncertainty of the multiplet center in the case of the Glc-5 multiplet was
±1Hz (three data points for 0.33 Hz resolution). Furthermore, as the signal intensity is halved
with each coupling partner, sensitivity gets degraded especially in carbohydrates. With the
insertion of the G-BIRD(r) element to decouple the long-range interactions, sensitivity can
significantly be improved. This is demonstrated in Figure 5.6 by comparing signal intensities
of the columns extracted from the 2D spectra obtained with the conventional F1 coupled
HSQC and the F1 coupled HSQC employing G-BIRD(r) experiments.
7273 ppm
a
b
c
J = ½ 150Hz
J = ½ 120Hz
Figure 5.7 Influence of the variation in coupling constants on the effect G-BIRD module. Trace a) shows the
column from F1 coupled HSQC with 152.3Hz heteronuclear one-bond splitting and a small long-range coupling.
Trace b) is the column of the same multiplet from F1 coupled HSQC incorporating the G-BIRD module with
delay τ tuned to 150Hz yielding perfect decoupling of the long-range coupling. Trace c) shows of the effect of
the mismatch between delay τ (tuned to 120Hz) and the value of the one-bond coupling constant (152.3Hz). A
decoupled signal can be seen in the middle of the multplet as a result of the partial inversion of the directly
bonded protons.
87
The effect of the BIRD module in case of variations in the one-bond heteronuclear
coupling has been examined by setting the delay used in the G-BIRD module (τ) to a value 30
Hz smaller than the true value of 1J of a specific multiplet. As a result of the mismatch the
direct proton is partially inverted and hence decoupled by the BIRD yielding an ordinary
HSQC signal in the middle of the multiplet as can be seen on Figure 5.7. The intensity of the
decoupled signal depends on the deviation of the delay from the true value of the coupling
constant.
5.3 Conclusion
Small residual dipolar contributions between directly bonded nuclei can accurately be
measured by means of an HSQC sequence modified with a G-BIRD(r) module which
decouples all the long-range couplings of the heteronucleus while retaining the one bond
coupling to the directly bonded proton. Summarizing the advantages of the proposed
sequence: i) allows simple frequency difference extraction between peak maxima, ii) accurate
measurement of small one-bond heteronuclear dipolar couplings without complications
arising from other dipolar contributions or strong couplings, iii) improved sensitivity due to
simplification of multiplets, iv) easy implementation of the G-BIRD(r) module in any variant
of HSQC sequence.
88
6. BANDSELECTIVE SUPPRESSION OF UNWANTED SIGNALS
IN OLIGOSACCHARIDE SPECTRA
6.1 Signal overlap in the NMR spectra of oligosaccharides
Signal overlap in 1D NMR spectroscopy is a common obstacle to the analysis of all
but the simplest spectra. 1H NMR spectra of oligosaccharides notoriously feature narrow
ranges of chemical shifts for the ring protons (with the exception of the anomeric ones) even
at lower molecular masses (e.g., di- or trisaccharides). Anomeric proton signals tend to stand
out downfield of the bulk of resonances and can therefore be utilized as structure “reporter”
signals in cases where no detailed assignments are available (207). They are, on the other
hand, natural starting points for resonance assignments by 2D methods.
The synthesis of a specific carbohydrate molecule (e. g. an oligosaccharide) is often a
multistep procedure which require application of protecting groups. Regioselectivity and
stereochemistry of the product after each reaction step is most often monitored by NMR.
Difficulties arise when anomeric signals get buried by low-field shifted resonances arising
from protecting groups, such as benzylic methylenes or others used in oligosaccharide
synthesis (208, 209). It was shown recently that signals from protons not J-coupled to the spin
system of interest, e.g. those constituted by sugar backbone protons, can be selectively purged
from 1D spectra even in the case of severe overlap (210). The method is based on band-
selective suppression of all signals, including the “useful” ones, from one region of the
spectrum, followed by a TOCSY transfer to recover resonances of protons J-coupled to the
non-suppressed ones. For instance, signals of anomeric protons overlapped by OCH2’s in
carbohydrate benzyl ethers could be cleanly recovered while eliminating the latter disturbing
resonances (210).
Overlap is much less of a problem with 2D NMR but not uncommon even with
smaller molecules having unfavourable spectral properties such as compressed chemical shift
range. Signals originating from the protecting groups could further complicate NMR
investigations by causing severe overlap with signals of interest. This is exemplified by the
pseudo-tetrasaccharide depicted on Figure 6.1, bearing eight benzylic groups whose CH2
89
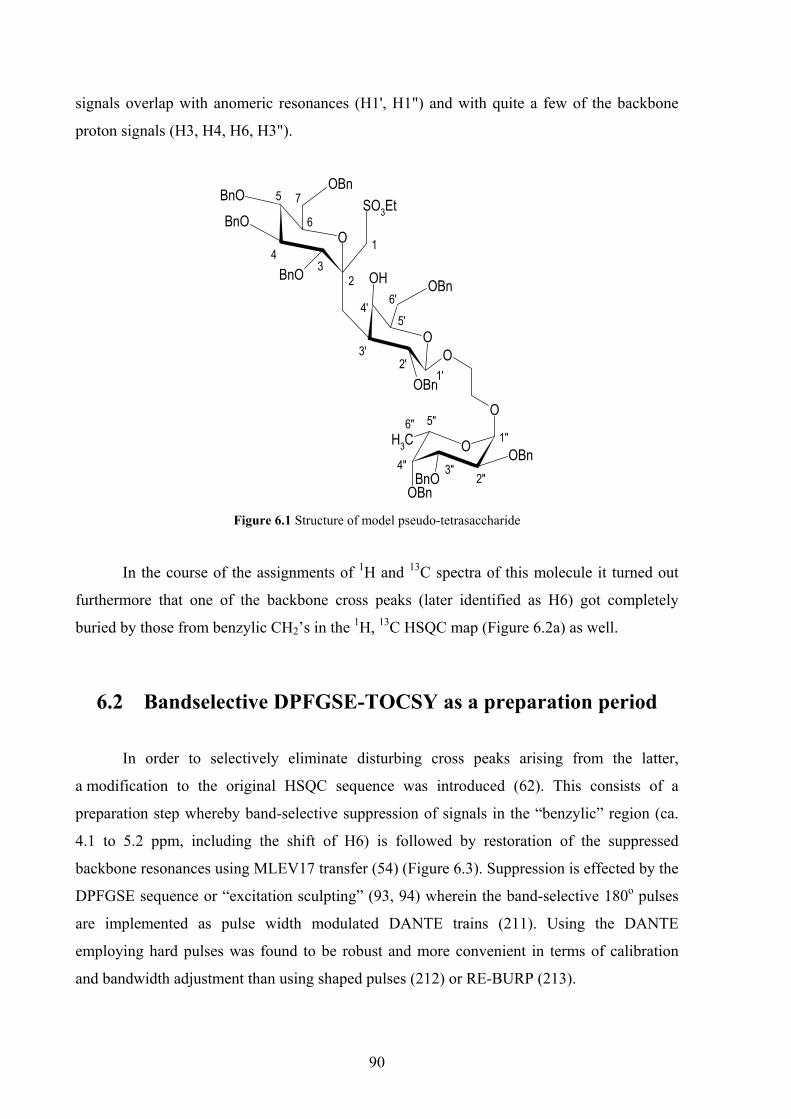
signals overlap with anomeric resonances (H1', H1") and with quite a few of the backbone
proton signals (H3, H4, H6, H3").
O
CH3 O
O
OH
OO
SO3EtOBn
BnOBnO
BnO
OBnBnO
OBn
OBn
OBn
1
23
4
5
6
7
1'2'
3'
4'5'
6'
1"
2"3"4"
5"6"
Figure 6.1 Structure of model pseudo-tetrasaccharide
In the course of the assignments of 1H and 13C spectra of this molecule it turned out
furthermore that one of the backbone cross peaks (later identified as H6) got completely
buried by those from benzylic CH2’s in the 1H, 13C HSQC map (Figure 6.2a) as well.
6.2 Bandselective DPFGSE-TOCSY as a preparation period
In order to selectively eliminate disturbing cross peaks arising from the latter,
a modification to the original HSQC sequence was introduced (62). This consists of a
preparation step whereby band-selective suppression of signals in the “benzylic” region (ca.
4.1 to 5.2 ppm, including the shift of H6) is followed by restoration of the suppressed
backbone resonances using MLEV17 transfer (54) (Figure 6.3). Suppression is effected by the
DPFGSE sequence or “excitation sculpting” (93, 94) wherein the band-selective 180o pulses
are implemented as pulse width modulated DANTE trains (211). Using the DANTE
employing hard pulses was found to be robust and more convenient in terms of calibration
and bandwidth adjustment than using shaped pulses (212) or RE-BURP (213).
90

ppm
4.44.64.85.05.2 ppm
74
76
78
ppm
74
76
78
a
b
H6
H2”
Figure 6.2 Partial plots of gradient-enhanced 1H,13C HSQC spectra of 1 displaying the spectral region
characteristic for benzylic CH2 resonances; without (a) and with (b) insertion of the band-selective suppression
element of Figure 3 before the HSQC sequence.
1H
G(z)
MLEV-17 HSQCTOCSYHMBC...
SLy SLyφ1
φ2
φ3
φ2
φ4
G1 G2 G3 G3G2G1
Figure 6.3 Band-suppressive excitation scheme serving as a preparation pulse in regular 2D experiments. Thin
and thick filled bars represent 1H 90o and 180o pulses, respectively. Shaped bars indicate band-selective
inversion pulses. The MLEV17 scheme is flanked by simultaneously switched gradient (G3) and spin-lock (Sly)
pulses in order to achieve pure phase excitation. The strengths of sine-bell shaped gradient pulses of 1 ms
duration were: G1=5 G/cm, G2=9 G/cm and G3= 10 G/cm. The phase cycling was set as φ1 = x, –x; φ2 = x, –x;
φ3 = x, –x; and φ4 = x, –x, y, –y.
91
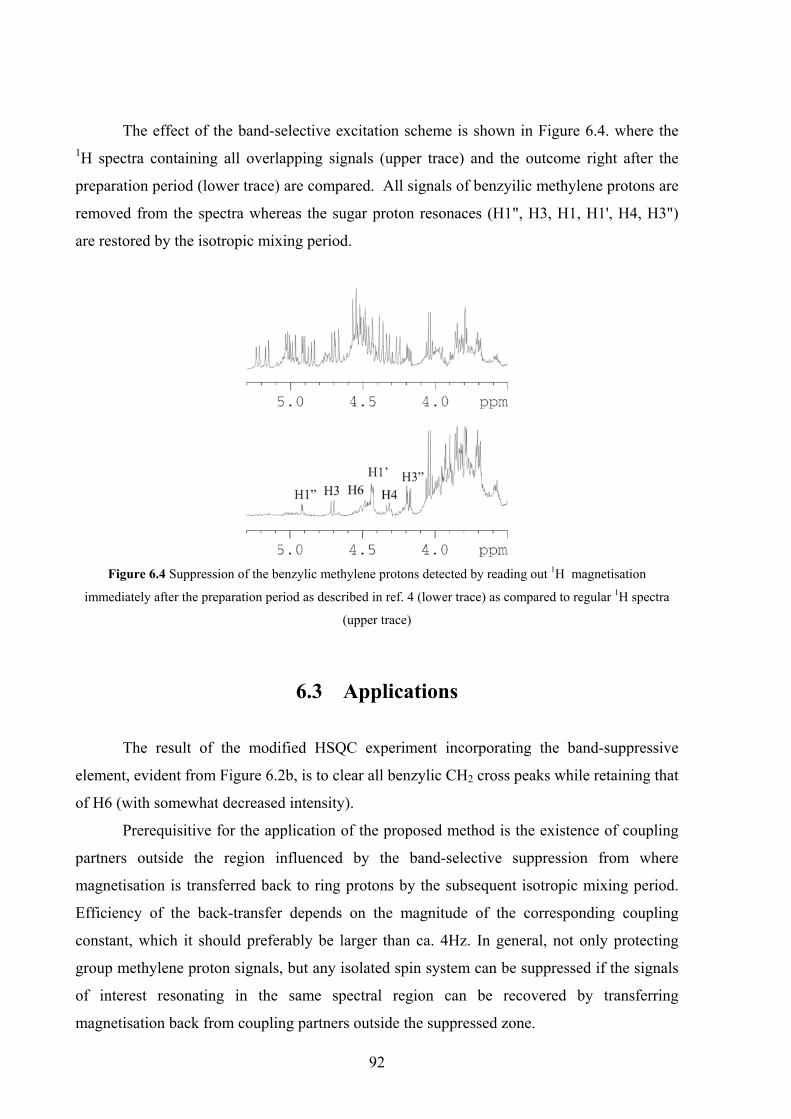
The effect of the band-selective excitation scheme is shown in Figure 6.4. where the 1H spectra containing all overlapping signals (upper trace) and the outcome right after the
preparation period (lower trace) are compared. All signals of benzyilic methylene protons are
removed from the spectra whereas the sugar proton resonaces (H1", H3, H1, H1', H4, H3")
are restored by the isotropic mixing period.
Figure 6.4 Suppression of the benzylic methylene protons detected by reading out 1H magnetisation
immediately after the preparation period as described in ref. 4 (lower trace) as compared to regular 1H spectra
(upper trace)
6.3 Applications
The result of the modified HSQC experiment incorporating the band-suppressive
element, evident from Figure 6.2b, is to clear all benzylic CH2 cross peaks while retaining that
of H6 (with somewhat decreased intensity).
Prerequisitive for the application of the proposed method is the existence of coupling
partners outside the region influenced by the band-selective suppression from where
magnetisation is transferred back to ring protons by the subsequent isotropic mixing period.
Efficiency of the back-transfer depends on the magnitude of the corresponding coupling
constant, which it should preferably be larger than ca. 4Hz. In general, not only protecting
group methylene proton signals, but any isolated spin system can be suppressed if the signals
of interest resonating in the same spectral region can be recovered by transferring
magnetisation back from coupling partners outside the suppressed zone.
92
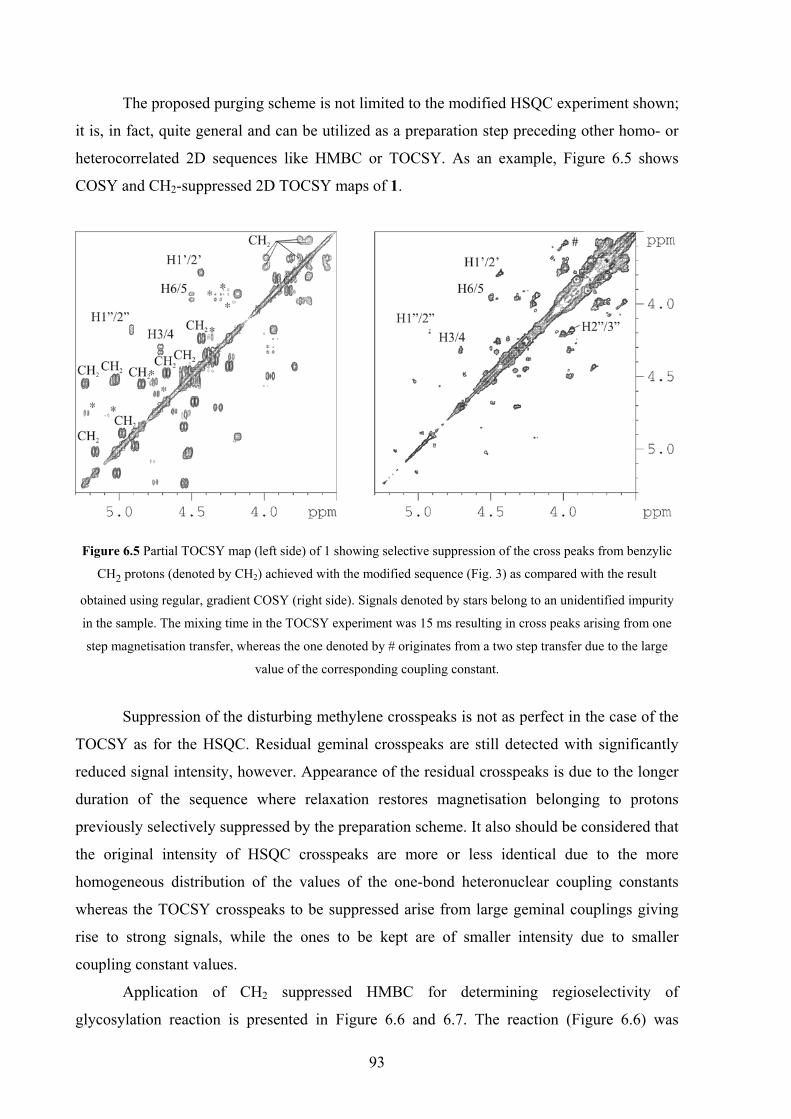
The proposed purging scheme is not limited to the modified HSQC experiment shown;
it is, in fact, quite general and can be utilized as a preparation step preceding other homo- or
heterocorrelated 2D sequences like HMBC or TOCSY. As an example, Figure 6.5 shows
COSY and CH2-suppressed 2D TOCSY maps of 1.
Figure 6.5 Partial TOCSY map (left side) of 1 showing selective suppression of the cross peaks from benzylic
CH2 protons (denoted by CH2) achieved with the modified sequence (Fig. 3) as compared with the result
obtained using regular, gradient COSY (right side). Signals denoted by stars belong to an unidentified impurity
in the sample. The mixing time in the TOCSY experiment was 15 ms resulting in cross peaks arising from one
step magnetisation transfer, whereas the one denoted by # originates from a two step transfer due to the large
value of the corresponding coupling constant.
Suppression of the disturbing methylene crosspeaks is not as perfect in the case of the
TOCSY as for the HSQC. Residual geminal crosspeaks are still detected with significantly
reduced signal intensity, however. Appearance of the residual crosspeaks is due to the longer
duration of the sequence where relaxation restores magnetisation belonging to protons
previously selectively suppressed by the preparation scheme. It also should be considered that
the original intensity of HSQC crosspeaks are more or less identical due to the more
homogeneous distribution of the values of the one-bond heteronuclear coupling constants
whereas the TOCSY crosspeaks to be suppressed arise from large geminal couplings giving
rise to strong signals, while the ones to be kept are of smaller intensity due to smaller
coupling constant values.
Application of CH2 suppressed HMBC for determining regioselectivity of
glycosylation reaction is presented in Figure 6.6 and 6.7. The reaction (Figure 6.6) was
93
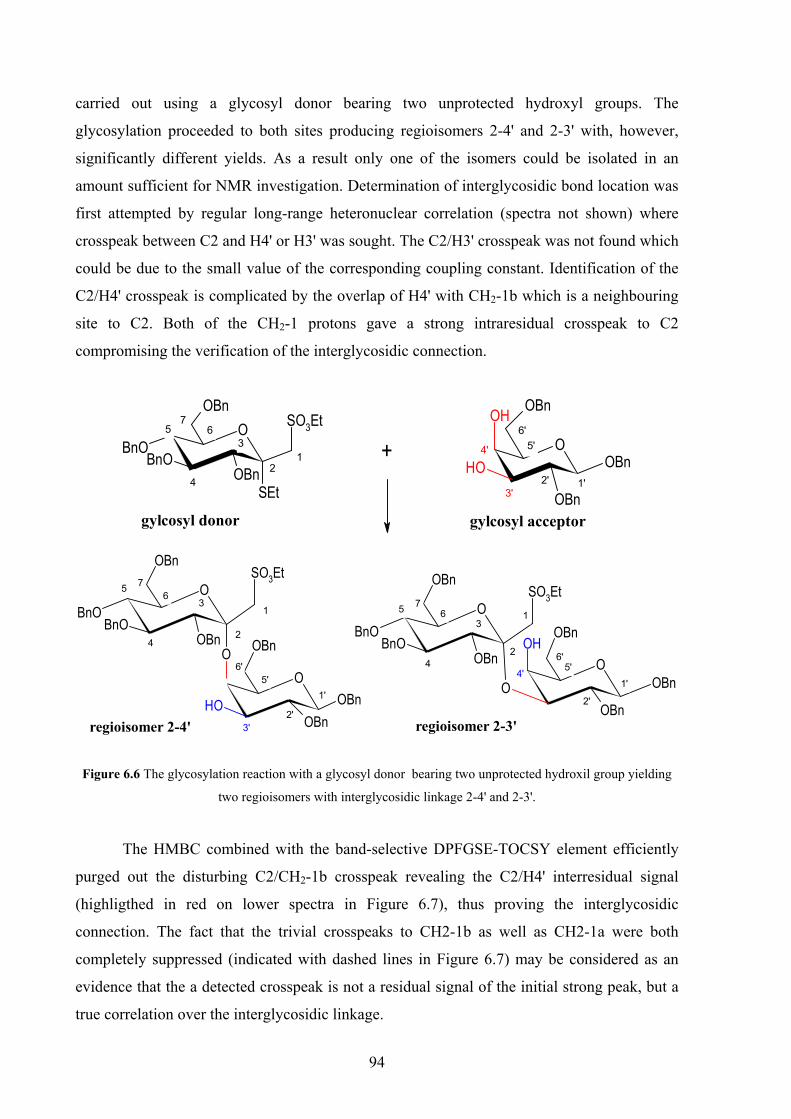
carried out using a glycosyl donor bearing two unprotected hydroxyl groups. The
glycosylation proceeded to both sites producing regioisomers 2-4' and 2-3' with, however,
significantly different yields. As a result only one of the isomers could be isolated in an
amount sufficient for NMR investigation. Determination of interglycosidic bond location was
first attempted by regular long-range heteronuclear correlation (spectra not shown) where
crosspeak between C2 and H4' or H3' was sought. The C2/H3' crosspeak was not found which
could be due to the small value of the corresponding coupling constant. Identification of the
C2/H4' crosspeak is complicated by the overlap of H4' with CH2-1b which is a neighbouring
site to C2. Both of the CH2-1 protons gave a strong intraresidual crosspeak to C2
compromising the verification of the interglycosidic connection.
O
OBn
OBn
OBn
SEt
O SO3Et
BnOBnO
OBn
OBn1
2
3
4
5 67
1'2'
5'6'
+
gylcosyl donor gylcosyl acceptor
OH
OH
3'
4'
4'
3'
OO
OH
OSO3Et
OBn
BnOBnO
OBn OBn
OBnOBn
O
O
OHO
SO3EtOBn
BnOBnO
OBn
OBn
OBn
OBn
1
2
3
4
56
7
1'
2'3'
5'6'
1
2
3
4
5 67
1'
2'
4' 5'6'
regioisomer 2-4' regioisomer 2-3'
Figure 6.6 The glycosylation reaction with a glycosyl donor bearing two unprotected hydroxil group yielding
two regioisomers with interglycosidic linkage 2-4' and 2-3'.
The HMBC combined with the band-selective DPFGSE-TOCSY element efficiently
purged out the disturbing C2/CH2-1b crosspeak revealing the C2/H4' interresidual signal
(highligthed in red on lower spectra in Figure 6.7), thus proving the interglycosidic
connection. The fact that the trivial crosspeaks to CH2-1b as well as CH2-1a were both
completely suppressed (indicated with dashed lines in Figure 6.7) may be considered as an
evidence that the a detected crosspeak is not a residual signal of the initial strong peak, but a
true correlation over the interglycosidic linkage.
94

Figure 6.7 HSQC (upper spectra) and CH2 suppressed HMBC (lower spectra) proving 2-4' connection between
monosaccharide units.
Finally it is interesting to note that, as another extension, the MLEV17 restoration
scheme can, in principle, be replaced by other sequences, like NOESY or ROESY, to recover
signals in the suppressed spectral region. NOESY or ROESY will, however, revive
resonances that are coupled by dipolar (or through-space), rather than by scalar-J (or through-
bond), mechanism to the spins in the unsuppressed region(s). This may offer a viable
alternative when through-bond transfer (by MLEV17) becomes inefficient because the
relevant scalar couplings are small.
95
7. EXPERIMENTAL
7.1 NMR measurements of the peptidoglycan derivatives
Samples
PGM was obtained from a penicillin-treated mutant of Brevibacterium divaricatum.
(114, 214) Derivatives Ad-PGM and BocTyr-PGM were synthesized from PGM according to
published procedures (138, 139). The NMR samples contained 4-8 mg of material dissolved
in 0.5ml of 99.9% DMSO-d6.
NMR measurements
NMR measurements have been carried out on a Bruker DRX-500 spectrometer using a 5
mm broad-band inverse probehead equipped with z-gradient coil. Spectra were recorded at a
temperature where the chemical shift distribution was dispersed optimally in the amide proton
region, that is at 300K for Ad-PGM and BocTyr-PGM and at 293K for PGM. Proton and
carbon chemical shift scales were calibrated to the DMSO-d6 solvent signal at 2.500 ppm for 1H and 39.95 ppm for 13C. The raw datasets typically consisted of 1-2K x 512 complex data
points.
NMR Assignments
In solution all three compounds exist as equilibrium mixtures of the α- and β anomeric
forms at the reducing MurNAc end of these molecules. Partial 1H NMR assignments have been
reported for the α anomeric form of PGM in DMSO solution (124) whereas tentative 13C
assignments were deduced, by comparison with model compounds, for the same in D2O
solution.(122) We have now achieved unambiguous full assignments of 1H- and 13C- signals
of the major α-anomeric forms, relying on various 2D measurements, for PGM, Ad-PGM and
BocTyr-PGM. 1H NMR assignments have been based on gradient COSY (52) and 2D
TOCSY experiments (56) recorded with different mixing times (50 and 80 ms). The doublet
signals of the anomeric protons served as starting points to derive assignments for the
disaccharide moiety. Individual side chain resonances for the peptide part have been identified
by characteristic cross peak patterns in the TOCSY maps. For the assignment of some of the
sugar ring protons HSQC-TOCSY measurements (59) were necessary. These assignments
have been cross-checked through 1D TOCSY measurements (71). Three-bond Hα/CO
correlations in the gradient HMBC spectra (65) and Hα/NH sequential cross peaks between
96
two Ala residues in the NOESY maps helped to establish sequential assignments for the three
Ala residues. Hε of m-Dap exhibited a four-bond coupling to εCONH2Z in the COSY/TOCSY
maps; this was further confirmed by appropriate HMBC cross peaks. HSQC measurements
(62) have furnished assignments for protonated carbons whereas 13C HMBC experiments
provided identification for the CO signals. The NMR chemical shift data are shown in Table
3.1 while Table 3.4 lists 3J(NH,Hα) values and temperature dependence of amide NH
chemical shifts.
NMR parameters 1H chemical shifts and conformationally important homonuclear coupling constants
were extracted from a resolution enhanced 1D spectrum or, in case of signal overlap, from
selective TOCSY experiments. Amide 1H chemical shift temperature coefficients have been
determined over a temperature range between 293K and 308K using 5K increments. 1H/1H
distance information was obtained using phase sensitive NOESY spectra. ROESY and T-
ROESY (215) have also been recorded to crosscheck for peaks resulting from coherent or mixed
magnetization transfer. NOE buildup curves were constructed from experiments with mixing
times of 50, 100, 150 and 300 ms; values up to 100 ms were found to be in the linear regime.
The cross peak intensities were determined by volume integration from the baseplane corrected
NOESY or ROESY spectra recorded with 100 ms mixing time.
Computational Procedures.
The cross-peaks obtained from NOESY and/or ROESY spectra were converted to
NOE distance restraints and used in distance geometry calculations followed by energy
minimization in the classical force field cvff (216) employing the DGII and DISCOVER
modules of InsightII (Accelrys Inc., 9685 Scranton Road, San Diego, CA), respectively. The
NOE distance restraints were divided in strong, medium and weak with upper limits of 2.6,
3.6 and 5 Å, respectively. The number of distance restraints used for the structure calculations
was: 64 for PGM, 67 for Ad-PGM and 76 for BocTyr-PGM. Only interresidual experimental
contacts are listed in Table 3.2. For pro-chiral protons or proton groups a pseudoatom
correction was applied.16 100 structures were calculated for each of the molecules and divided
in clusters of conformations according to values of the dihedral angles GlcNAc-φ’, GlcNAc-
ψ, MurNAc-ψ’, Lac-φ’, Lac-ψ’, Ala1-φ, Ala1-ψ, iGln2-φ, iGln2-ψ, iGln2-χ1 and iGln2-χ2 with a
tolerance of 30° [GlcNAc-φ’, C2–C1–O1–C4(MurNAc); GlcNAc-ψ, C1–O1–C4(MurNAc)–
C3(MurNAc); MurNAc-φ’, C4–C3–O3–Lac-"; Lac-φ’, C3–O3–Lac-"–Lac-C’; Lac-ψ’, O3–
97
Lac-"–Lac-C’–Ala1-N; the definition of the iGln dihedral angles is used irrespective of the
iGln2-Cγ–Dap3-N linkage]. The most populated cluster with low energy was chosen to
represent the preferred conformations. (217)
7.2 NMR measurements on isotropic diglycoside disulfide
samples
Samples
Samples for the NOE and temperature coefficient measurements were prepared by
dissolving 10 mg of the respective diglycoside disulfide in 500ul DMSO-d6 solvent
containing TMS as a reference material.
Assignments
Complete and unambiguous assignment of 1H and 13C resonances was achieved by the
combined use/analysis of COSY (52), phase sensitive pure absorption 2D TOCSY (56),
selective TOCSY (71) (isotropic mixing times of 15 and 50ms), edited HSQC (62) and
HMBC (65). The raw datasets typically consisted of 2K × 512 complex data points.
NMR parameters 1H chemical shift temperature coefficients for labile protons were obtained over a
temperature range between 298K and 318K using 5K increments. 1H/1H distance information
was obtained using T ROESY experiments (215) with 1.5KHz spinlock field strength. The
duration of the spin-lock pulse was 50ms.
7.3 Sample preparation and NMR measurements on partially
oriented samples
Diglycoside disulfide samples
For determination of residual dipolar couplings ~10 mg of the respective derivative
were used. NaN3 were used to prevent bacterial growth and DSS as a reference material. For
the alignment, bicelles were formed from CHAPSO/DMPC (218) at mass ratio of 1/3.5 and
total liqiud cryssatl concentrations 7.5%, 15% and 30%). CHAPSO (3-[(3-cholamidopropyil)
dimethylammonio]-2-hidroxy-1-propanasesulfonate) and DMPC (Dimyristoyl-DL-α-
98
phosphatidylcholine 1,2-ditetradecanoyl-rac-glycerol-3-phosphocholine) was purchased from
Sigma (Sigma-Aldrich) as dry powders and used without further purification.
Samples for testing F1 coupled HSQC with GBIRD(r) technique
The isotropic sample of dipeptide of glycine-valine used as model compound for
testing the proposed method described in chapter 5 was prepared by dissolving 25mg of
GlyVal in 700ul of D2O resulting in 205mM solution.
The use of the proposed technique for the extraction of RDCs was demonstrated on
liquid crystal sample of 100mM saccharose in 700µl anisotropic media.
Sample preparation procedure
The substance to be investigated was dissolved in 0.7ul D2O. Concentration of the
dissolved substance should lower than mol/l. The temperature region where the liquid crystal
phase exist considerably shrink at higher concentration of the dissolved substance. 1mg NaN3
and 1mg DSS has been added to the solution. Weigthed amount of DMPC were dissolved in
the previous solution resulting in a milky, but still easily flowing liquid. The solution was
carefully homogenized by vortexing, then premeasured amount of CHAPSO were added to
the solution. By adding the detergent the consistency changes giving a semi-transparent,
opalescent gel which practically does not flow. The mixture was homogenized by vortexing.
Thorough homogenization is crucial for obtaining a stable liquid crystal phase, however
mixing using ultrasound should be avoided. The presence of microscopic inhomogeneities
was checked by centrifuging at 4000G for 5 min. If centrifugation yielded phase separation,
additional cycles of vortexing/centrifuging were repeated. If the sample formed one,
homogeneious, semi-transparent, slightly opalescent phase, then it was cooled on ice which
reduces viscosity and makes it easier to transfer to the tube by a Pasteur pipette. Viscosity can
only be reduced by cooling the media, while warming up increases the viscosity. Warming the
mixture should anyway be avoided because above 325K irreversible disruption of the phase
has been observed in several cases. A stable media is perfectly clear, but extremely viscosous
under 299K (it practically does not flow, not even if the tube is turned up-side down), and
becomes milky above 299K where thermal induced phase transition from to gel to liquid
crystal occur.
99
NMR measurements on partially oriented samples
All experiments were performed on Bruker DRX-400, 600 and 700 spectrometers
(Bruker AG, Rheinstetten, Germany) equipped with TBI z-grad probes. All spectra were
processed with XWINNMR 3.1 (Bruker AG, Karlsruhe, Germany).
The temperature for measurements under isotropic conditions was set to 297 K while
for anisotropic conditions to 308K.
The deuterium signal of the solvent is split by the residual quadrupolar coupling.
Locking was performed using one signal component by manually optimizing parameters of
the lock channel. Magnetic field homogenizing was executed by shimming on 1H FID
integral.
For the measurement of 1H,13C residual dipolar couplings F1 coupled gradient
selected, sensitivity enhanced HSQC spectra modified with a G-BIRD module (219)
described in chapter 5 were used. The spectral window in the indirect dimension were
typically 20ppm giving a frequency span of 2000Hz at 400MHz, 2500Hz at 600MHz and
3500MHz at 700MHz. Acquiring 4K t1 experiment yielded ca. 0.49Hz, 0.61Hz and 0.85Hz
spectral resolution, respectively. Columns of the 2D map were extracted and inverse Fourier
transformed. Linear prediction and zero filling were used to increase digital resolution, then
time domain data were apodised with squared squared cosine window function prior to 2D
Fourier transformation to yield a digital resolution of 0.25Hz, 0.30Hz and 0.42Hz. Each 1D
trace was individually phased corrected. Peak maxima were identified using the peak picking
utility of the XWINNMR 3.1 program. MHz). In order to estimate the precision/random error
of the measurements, each spectrum was recorded twice.
Methods for conformational analysis
Conformational search has been carried out including systematic as well as stochastic
searches. The molecular mechanics calculations were carried out with the DISCOVER
program implemented in the InsightII 2000 (MSI, San Diego, CA). All calculations were
performed using the AMBER force field (188, 189) extended with Homans' carbohydrate
parameters (190). The calculations have been carried out in vacuum, a distance dependent
dielectric constant was used and 1-4 interactions were scaled by a factor of 0.5. All hydrogen
atoms were explicitly included into the calculations.
100

Systematic search
Flexible geometry systematic searches were carried out by optimising the structures
with fixed interglycosidic torsion angles. All three interglycosidic torsion angles were
systematically rotated in 10o increments. Conformations were forced to adopt the target
geometry by applying a biharmonic forcing potential. The sugar rings were constrained to the 4C1 conformation until the gradient reached 1 kcal/mol.Å and then released. The structures
were further optimised to a final gradient of < 0.001 kcal/mol.Å by the quasi-Newton-
Raphson (VA09A) minimization method. The next rotation has been done on the
unminimized structure not to bias the calculation by the geometry optimised towards the
previous conformer. InsightII DISCOVER input file for executing the simulation is attached
in Appendix C.
Simulated annealing
An initial minimization was applied to remove high strains from the starting structure
using a steepest descent algorithm until the gradient reached 10 kcal/mol.Å followed by a
quasi-Newton-Raphson minimization until 1 kcal/mol.Å. The system was then heated to
1000K in 1ps, equilbirated at high temperature for 5ps, then the temperature exponentially
decreased to 300K in 5ps. The resulting structures were energy minimized to 0.001
kcal/mol.Å as above. 1000 structures were generated for analysis. InsightII DISCOVER input
file for executing the simulation is attached in Appendix D.
7.4 NMR measurements on protected oligosaccharides
Samples
Samples for the measurements were prepared by dissolving 30-70 mg of the respective
protected oligosaccharide in 500ul benzene-d6 solvent containing TMS as a reference
material.
NMR measurements
The specifications of the equipment are described in paragraph 7.1. The temperature
was set to 300K. The pulse-width modulated DANTE train (92, 211) consisted of 32 pulse
elements of 20.6us, whereas the duration of the interpulse delay was 50us resulting in ca. +/-
2 ppm band-width.
101
8. SUMMARY
Two important classes of molecules, namely, new lipophilic derivatives of cell-wall
glycopeptides and novel disaccharide derivatives featuring disulfide interglycosidic linkage
were investigated by means of NMR spectroscopy and model calculations to reveal
conformational features of possible biological relevance. The results obtained can be
summarized as follows.
Conformational investigations of modified cell wall peptides
Polymeric peptidoglycans of bacterial cell walls, and smaller glycopeptides derived
from them, exhibit versatile biological activities including immunomodulating properties.
Peptidoglycan monomer (PGM) isolated from Brevibacterium divaricatum cell wall has the
following chemical structure:
D-GlcNAc - β(1→4) - D-MurNAc - L-Ala1 - D-isoGln2 - mesoDap(εNH2)3 - D-Ala4 - D-Ala5
The parent PGM molecule and novel lipophilic derivatives of PGM bearing either
(adamantyl-1-yl)-acetyl or Boc-Tyr substituents (Ad-PGM and BocTyr-PGM, respectively)
were investigated by NMR and molecular modelling methods.
Full assignments of the 1H and 13C spectra, using 2D NMR techniques, were obtained
for all three compounds in DMSO solutions. NOESY/ROESY experiments have provided
interproton distance restraints that were used in distance geometry modelling calculations to
derive conformational preferences for each of these molecules. These data were supplemented
with information available from chemical shifts, temperature dependence of amide proton
shifts and proton-proton scalar couplings.
Analyses of the results suggest that the lipophilic substituents attached to the Dap3-ε
amino group of the parent PGM molecule introduce changes to the conformational
preferences of the peptide moiety. In PGM electrostatic interactions between charged end
groups apparently promote folded conformations with participation of the long Dap side
chain. Derivatives wherein such interactions are suppressed by acylation of the Dap3-ε amino
group are characterized by more extended conformations of the peptide chain. The new
synthetic derivatives exhibit biological properties similar to those of the parent PGM. This
may indicate that peripheral parts of the peptide chain such as the C-terminal and end groups
102

of the long Dap side chain do not significantly contribute to the binding to receptors or
enzymes under physiological conditions.
Conformational preferences of diglycosyl disulfides
Conformational preferences of a novel class of glycomimetics, non-symmetric
oligosaccharides containing a three-bond disulfide linkage in place of the interglycosidic
oxygen were investigated by conformational analysis based on the comparison of NMR data
and modelling calculations.
SOHO
OHOH
S
OH RR
RR
O
OH
OH12
3
4
5
6
1'
2'
3'
5'6'
1
2
4
3
4'
R1 R2 R3 R4
Glc-S-S-Man H OH H OH
Glc-S-S-Gal OH H OH H
Glc-S-S-NAcGlc NAc H H OH
Temperature coefficients for the hydroxide and amide protons indicate that majority of
the labile protons was exposed to the solvent and not involved in hydrogen bonding. The
exchange with the solvent was found to be somewhat restricted in the case of the amide
proton in Glc-S-S-NAcGlc. Only a few conformationally relevant interannular NOEs contacts
were found for all three derivatives. Relative magnitudes of the intraresidue residual dipolar
couplings were interpreted only in terms of the stereochemistry at each carbon centre, but
structure determination on the basis of residual dipolar couplings was not attempted thus far.
Experimental NMR data were supplemented by force-field calculations. Systematic
search around the MA, MB and T angles as well as simulated annealing calculations resulted in
18 minima in the conformational space for each of the 3 disaccharides investigated. The M
angles around the bond connecting the anomeric carbon and the sulfur indicate staggered
conformations around the C1-S bond, that is +60o (+ synclinal) and 300o (- synclinal or -60o)
for synclinal arrangements and 180o for antiperiplanar arrangement. Conformers featuring
exo-anomeric effect at their M angles dominate among the low energy conformers. The
conformation around the disulfide bond, ω, was found to be close to ±90o. The kinetic energy
103

(kT) available for the molecules at room temperature is sufficient to overcome the low
conformational barriers. Consequently these data suggest the presence of several different,
time-averaged conformations.
On the basis of the distribution of the Epot and the number of structures generated by
SA conformational families were divided into subgroups of low energy of conformations. The
larger subgroup includes the first 9 lowest energy conformations. Within these, a separate
subgroup incorporating the first 4 lowest energy structures can be distinguished. 3 conformers
within the latter group were found to be identical for all three derivatives with insignificant
variation in the Epot. None of the minimum conformation can be used as 'single state model' to satisfactorily
account for the experimental data observed. The intraresidual NOEs observed were found to
be in agreement with conformations among low energy structures. A H bonding interaction
was found to exist/identified in the lowest energy conformer satisfying all the interresidual
NOEs for derivative Glc-S-S-NAcGlc.
Experimental data suggested the presence of several different, time-averaged
conformations, however the computational results were indicative of definite conformational
preferences in these novel disulfide disaccharide mimics. Thus, the increase of the degrees of
motional freedom, expected a priori upon extension of the interglycosidic linkage, gets largely
offset by stereoelectronic effects, such as the exo-anomeric effect, the preference of the
disulfide torsion angle towards ±90o and the existence of interresidual H bonding interactions.
The second part of the dissertation describes modifications of known NMR techniques
to aid/for measurements of residual one-bond 1H-13C dipolar couplings and assignment of
oligosaccharides featuring strong overlap in their NMR spectra.
Accurate determination of small one-bond heteronuclear residual dipolar couplings
A modification of the F1-coupled HSQC experiment was proposed for the accurate
determination of one-bond heteronuclear residual dipolar couplings. The modification
consists of inserting a G-BIRD(r) module which has been employed to refocus the long-range
coupling evolution of the heteronucleus during the t1 frequency labelling period. As a result,
the crosspeaks obtained are split only by the direct one-bond coupling that can be extracted by
104
measuring simple frequency differences between singlet maxima. Additionally the decoupling
of long-range multiple bond splittings leads to considerable sensitivity enhancement.
Bandselective suppression of unwanted signals in oligosaccharide spectra
Finally a general scheme was proposed for eliminating disturbing signals of some
protecting groups from the 2D NMR spectra of oligosaccharides by making use of a band-
selective suppression – restoration sequence that serves as a preparation step to various 2D
NMR experiments. This consists of a preparation step whereby band-selective suppression of
unwanted signals is followed by a TOCSY transfer to recover useful resonances in the
spectral region of interest. When the element is inserted in the place of the initial 90o 1H pulse
of any sequence, it yields a transverse magnetisation arising from the useful signals that is
further manipulated by the remaining parts of the specific sequence. Modified versions of 2D
methods commonly used for assignment (such as COSY, TOCSY, HSQC, HMBC) yielded
spectra dsiplaying signals of useful anomeric and sugar ring protons without disturbing
signals arising from protecting groups, thus, unambiguous assignments of the substances
become possible.
105
ÖSSZEFOGLALÁS
Az értekezés első része sejtfal glikopeptidek és diszulfid interglikozidos hidat
tartalmazó diszacharidok konformaciós sajátságainak vizsgálatával foglalkozik. NMR és
molekula modellezési módszerek kapcsolt alkalmazásával vizsgáltuk a molekulák
konformációs jellemzőit, amelyek biológiai kölcsönhatásokban is jelentős szerepet
játszhatnak.
Módosított sejtfal glikopeptidek konformációs vizsgálata
A bakteriális sejtfal polimer peptidoglikánjai valamint a belőlük származó kisebb
fragmensek változatos biológiai tulajdonságokkal rendelkeznek. A Brevibacterium
divaricatum baktérium törzsből izolált peptidoglikán monomer a következő szerkezettel
rendelkezik:
D-GlcNAc - β(1→4) - D-MurNAc - L-Ala1 - D-isoGln2 - mesoDap(εNH2)3 - D-Ala4 - D-Ala5
Tanulmányoztuk a peptidoglikán monomer és két új lipofil származék szerkezetét, amelyek
adamatil-1-acetil- illetve BocTyr- csoportokat tartalmaznak.
Elvégeztünk a származékok 1H és 13C spektrumainak teljes jelhozzárendelését DMSO
oldatban. NOESY és ROESY kísérletekből nyert proton-proton távolság kényszerfeltételek
alapján távolság-geometria számításokkal meghatároztuk a molekulák konformációs
jellemzőit. A model számításokon kívül felhasználtuk a kémiai eltolódásból, az amid
protonok kemiai eltolódásásnak hőmérséklet függéséből és a proton-proton skaláris
csatolásokból származó szerkezeti információkat is. Az adatok elemzése azt mutatta, hogy az
eredeti PGM molekulához a Dap3-ε amino csoporton keresztül kapcsolt lipofil szubstituensek
konformációs változásokat idéznek elő a molekulák peptid részén. Az elektrosztatikus
kölcsönhatások a Dap oldallánc az elektromos töltéssel rendelkező végcsoportok (DAla5-
COO-) között ezen csoportok térközelségével jellemzett konformációkat hoznak létre a PGM
molekulában. Nyújtottabb konformációk jellemzők a két származékra, ahol a Dap3-ε amino
csoport acilezve van. Az új szintetikus származékok az eredeti PGM molekulához hasonló
biológiai tulajdonságokkal bírnak. Ez a tény arra utal, hogy a peptid lánc periferális részei és a
hosszú Dap oldallánc végcsoportjai fiziológiás körülmények között feltehetőleg nem
játszanak szerepet a receptorokhoz és enzimekhez kötődés során.
106

Diglikozil diszulfidok konformációs jellemzői
Új tipusú glikomimetikumok konformációjanak analízisét végeztük el NMR
vizsgálatok és a molekula modellezés eredményeinek összehasonlításával. A vizsgált
glikomimetikumok az interglikozidos oxigén helyett három kötéses diszulfid hidat tartalmazó
asszimmetrukus oligoszacharidok voltak.
SOHO
OHOH
S
OH RR
RR
O
OH
OH12
3
4
5
6
1'
2'
3'
5'6'
1
2
4
3
4'
R1 R2 R3 R4
Glc-S-S-Man H OH H OH
Glc-S-S-Gal OH H OH H
Glc-S-S-NAcGlc NAc H H OH
A hidroxil és amid protonok hőmérsekleti együtthatói azt mutatták, hogy a cserélhető
protonok többsége az oldószerrel áll kölcsönhatásban és nincs hidrogén kötésben. Az
oldószerrel való gyors cserélődés némiképpen gátolt az amid proton esetén a Glc-S-S-
NAcGlc molekulában. Mindhárom származék esetén csak néhány, monoszaccharid egységek
közötti NOE-t észleltünk. A gyengén orientálódó folyadékkristályos közegben mért maradék
dipoláris csatolások értékeinek nagyságát a 1H-13C kötésvektorok a cukor gyűrűre jellemző
irányítotttsága szempontjából elemeztük. A maradék dipoláris csatolások alapján
szerkezetszámolásokat egyenlőre nem végeztünk.
Az NMR kísérleti adatokat molekula mechanika számításokkal egészítettük ki. A MA,
MB és T szögek körül végzett szisztematikus keresések és a szimulált hűtést alkalmazó
számítások egyaránt 18 minimumot eredményeztek a konformációs térben. A monoszaccharid
gyűrűkhöz közeli M szögek a C1-S kötés körül a nyitott konformációra jellemző értékeket
vettek fel, azaz, +60o (+ szinklinális) és 300o (- szinklinális or -60o) értékeket szinklinális és
180o antiperiplnáris elrendeződés esetén. Az alacsony energiájú konformerek között
dominálnak az exo-anomer effektusnak megfelelő M szöggel bíró szerkezetek. A diszulfid híd
körüli T szög ±90o körül változott.
A konformációs családok potenciális energia sorrendje és szimulált hűtés által
létrehozott szerkezetek száma alapján a konformációs családokat alcsoportokba soroltuk. A
107

legnagyobb alcsoport az első 9 legalacsonyabb energiájú konformert foglalja magába. Ezen
belül egy külön alcsoportot alkot az első 4 legkisebb energiájú szerkezet. Ez utóbbi csoporton
belül három konformer - némiképpen eltérő potenciális energiával - megjelenik mindhárom
származék esetén.
Noha az önmagában a minimum energiájú konformációk egyike sem elegendő az
észlelt kísérleti adatok értelmezéséhez, azonban az észlelt egységek közötti NOE-kat
kielégítik a alacsony energiájú konformerekben mérhető 1H-1H távolságok. A Glc-S-S-
NAcGlc legalacsonyabb energiájú konformációját, amely egyszerre teljesíti valamennyi NOE
távolságfeltételt, valószínűleg H hidas kölcsönhatás stabilizálja.
Noha a kísérleti adatok számos időátlagolt konformáció jelenlétét mutatja, azonban a
konformációs analízis határozott konformációs preferenciákat eredményezett mindhárom
diszulfid diszaccharid származék esetén. A hosszabb interglikozidos kötés esetén várható
megnövekedett mozgási szabadságot tehát korlátozzák a sztereoelektronikus effectusok, mint
az exo-anomer effektus, diszulfid torziós szög ±90o felé irányuló preferenciája és a
feltételezhető H kötés jelenléte.
A disszertáció második része ismert NMR mérési módszerek módosításaival
foglalkozik, az egykötéses heteronukleáris maradék dipoláris csatolások pontos mérése,
illetve erősen átfedő jeleket tartalmazó NMR spektrumok jelhozzárendelésének elősegítése
céljából.
Egykötéses heteronukleáris maradék dipoláris csatolási állandók pontos meghatározása
Az egykötéses heteronukleáris maradék dipoláris csatolások pontos meghatározása
érdekében javasoltuk az F1 dimezióban csatolt HSQC szekvencia módosítását. A módosítás
során egy G-BIRD(r) elemet illesztettünk a szekvencába, amely refókuszálja távolható
heteronukláris csatolások evolúcióját a t1 idő alatt. Ennek eredményeképpen a spektrumban
kapott keresztcsúcsok csak a kívánt egykötéses csatolás szerint hasadtak fel, amely a
szingulett csúcsok közötti frekvencia különbség meghatározása révén pontosan és egyszerűen
mérhető. A távolható csatolások ily módon történő eltávolítása jelentős érzékenység
növekedést is eredményezett.
Sávszelektív jelelnyomás alkalmazása zavaró jelek kiszűrésésre
108
Végezetül, egy általánosan alkalmazható sémát javasoltunk oligoszaccharidok
védőcsoportjaitól származó zavaró jelek elnyomására, amelyek megnehezítik a 2D
spektrumok analízisét. A módszer sávszelektív elnyomáson majd azt követő szelektív
mágnesezettség átvitelen alapszik, és bármely 2D NMR kísérletben előkészítő periódusként
alkalmazható. Első lépésben a zavaró jelek teljes sávszelektív elnyomása történik amelyet egy
izotróp keverési periódus követ. Ez utóbbi segítségével visszanyerjük az ugyanazon spektrális
tartományban levő a hasznos jeleket. A jelhozzárendelésre általánosan használt NMR
módszerek, mint pl. COSY, TOCSY, HSQC, HMBC kísérletek módosításai által elértük,
hogy az anomer és más cukorváz protonok rezonancia jelei zavaró jelektől mentesen
jelenjenek meg, lehetővé téve ezáltal az egyértelmű hozzárendelést.
109
9. REFERENCES
1. Lewitt M. H. Spin Dynamics: Basics of Nuclear Magnetic resonance John Wiley & Sons; (2001) 2. Gaemers, S. and A. Bax, Morphology of three lyotropic liquid crystalline biological NMR media studied by translational diffusion anisotropy. J. Am. Chem. Soc. 123, 12343-12352 (2001). 3. Buckingham AD and Lovering EG, 1962, Tans. Faraday Soc. 58:2077, 4. Ruessink, B. H. and C. Maclean, Electric-Field NMR - a Method to Measure the Molecular Polarizability. Mol. Phys. 60, 1059-1066 (1987). 5. Prestegard JH, Tolman JR, Al-Hachimi HM, Andrec M Protein structure and dynamics from field induced residual dipolar couplings. In Biological Magnetic Resonance, Vol 17, Structure Computation and Dynamics in Protein NMR, (Eds Krishna NR, Berliner LJ) Chapter 8, 311-355. Plenum, New York (1996) 6. H. C. Kung, K. Y. Wang, I. Goljer, and P. H. Bolton, Magnetic alignment of duplex and quadruplex DNAs. J. Magn. Reson. B 109, 323 (1995). 7. Tjandra, N., J. G. Omichinski, A. M. Gronenborn, G. M. Clore and A. Bax, Use of dipolar H-1-N-15 and H-1-C-13 couplings in the structure determination of magnetically oriented macromolecules in solution. Nat. Struct. Biol. 4, 732-738 (1997). 8. Tolman, J. R., J. M. Flanagan, M. A. Kennedy and J. H. Prestegard, Nuclear Magnetic Dipole Interactions in Field-Oriented Proteins - Information for Structure Determination in Solution. Proc. Natl. Acad. Sci. U. S. A. 92, 9279-9283 (1995)., 9. Tolman, J. R., J. M. Flanagan, M. A. Kennedy and J. H. Prestegard, NMR evidence for slow collective motions in cyanometmyoglobin. Nat. Struct. Biol. 4, 292-297 (1997). 10. Tjandra, N., S. Grzesiek and A. Bax, Magnetic field dependence of nitrogen-proton J splittings in N- 15-enriched human ubiquitin resulting from relaxation interference and residual dipolar coupling. J. Am. Chem. Soc. 118, 6264-6272 (1996). 11. Van zijl, P. C. M., C. Maclean and A. A. Bothnerby, Angular-Correlation and Diamagnetic Susceptibilities Studied by High-Field Nmr. J. Chem. Phys. 83, 4410- 4417 (1985). 12. Saupe, A. and G. Englert, High-Resolution Nuclear Magnetic Resonance Spectra of Orientated Molecules. Phys. Rev. Lett. 11, 462-& (1963). 13. Emsley JW, Lindon JC, NMR Spectroscopy Using Liquid Crystal Solvents Pergamon New York, (1975),
110
14. Diehl P in Nuclear Magnetic Resonance of Liquid Crystals Emsley JW, Ed. Reidel, Dordrecht, Netherlands, 147-180. (1985) 15. Bax, A. and N. Tjandra, High-resolution heteronuclear NMR of human ubiquitin in an aqueous liquid crystalline medium. J. Biomol. NMR 10, 289-292 (1997). 16. Prestegard, J. H., New techniques in structural NMR - anisotropic interactions. Nat. Struct. Biol. 5, 517-522 (1998). 17. Bax, A. and N. Tjandra, Are proteins even floppier than we thought? Nat. Struct. Biol. 4, 254-256 (1997). 18. Tjandra, N. and A. Bax, Direct measurement of distances and angles in biomolecules by NMR in a dilute liquid crystalline medium. Science 278, 1111-1114 (1997). 19. Clore, G. M. and A. M. Gronenborn, New methods of structure refinement for macromolecular structure determination by NMR. Proc. Natl. Acad. Sci. U. S. A. 95, 5891-5898 (1998). 20. Sanders, C. R. and J. P. Schwonek, Characterization of Magnetically Orientable Bilayers in Mixtures of Dihexanoylphosphatidylcholine and Dimyristoylphosphatidylcholine by Solid-State Nmr. Biochemistry 31, 8898-8905 (1992). 21. Prosser, R. S., J. A. Losonczi and I. V. Shiyanovskaya, Use of a novel aqueous liquid crystalline medium for high- resolution NMR of macromolecules in solution. J. Am. Chem. Soc. 120, 11010-11011 (1998). 22. Barrientos, L. G., C. Dolan and A. M. Gronenborn, Characterization of surfactant liquid crystal phases suitable for molecular alignment and measurement of dipolar couplings. J. Biomol. NMR 16, 329-337 (2000). 23. Ruckert, M. and G. Otting, Alignment of biological macromolecules in novel nonionic liquid crystalline media for NMR experiments. J. Am. Chem. Soc. 122, 7793 (2000). 24. Clore, G. M., M. R. Starich and A. M. Gronenborn, Measurement of residual dipolar couplings of macromolecules aligned in the nematic phase of a colloidal suspension of rod- shaped viruses. J. Am. Chem. Soc. 120, 10571-10572 (1998). 25. Hansen, M. R., L. Mueller and A. Pardi, Tunable alignment of macromolecules by filamentous phage yields dipolar coupling interactions. Nat. Struct. Biol. 5, 1065-1074 (1998). 26. Sass, J., F. Cordier, A. Hoffmann, A. Cousin, J. G. Omichinski, H. Lowen and S. Grzesiek, Purple membrane induced alignment of biological macromolecules in the magnetic field. J. Am. Chem. Soc. 121, 2047-2055 (1999). 27. Koenig, B. W., J. S. Hu, M. Ottiger, S. Bose, R. W. Hendler and A. Bax, NMR measurement of dipolar couplings in proteins aligned by transient binding to purple membrane fragments. J. Am. Chem. Soc. 121, 1385-1386 (1999).
111
28. Fleming, K., D. Gray, S. Prasannan and S. Matthews, Cellulose crystallites: A new and robust liquid crystalline medium for the measurement of residual dipolar couplings. J. Am. Chem. Soc. 122, 5224-5225 (2000). 29. Fleming, K., D. G. Gray and S. Matthews, Cellulose crystallites. Chem.-Eur. J. 7, 1831-1835 (2001). 30. Tycko, R., F. J. Blanco and Y. Ishii, Alignment of biopolymers in strained gels: A new way to create detectable dipole-dipole couplings in high-resolution biomolecular NMR. J. Am. Chem. Soc. 122, 9340-9341 (2000). 31. Friebolin, H. Basic One- and Two-dimensional NMR spectroscopy, Wiley-VCH, Weinheim, Basel, p. 41-51 (1993). 32. Wehrli, FW and Wirthlin, T. Interpretation of Carbon 13 NMR spectra, Heyden, London, New York, p. 22-39 (1976) and references therein. 33. Soth, M. J. and J. S. Nowick, A peptide/oligourea/azapeptide hybrid that adopts a hairpin turn. J. Org. Chem. 64, 276-281 (1999).and references therein. 34. Thomas, W. A., Unravelling molecular structure and conformation - The modern role of coupling constants. Prog. Nucl. Magn. Reson. Spectrosc. 30, 183-207 (1997). and references therein. 35. Edison, A. S., J. L. Markley and F. Weinhold, Calculations of One-Bond, 2-Bond and 3-Bond Nuclear Spin-Spin Couplings in a Model Peptide and Correlations with Experimental-Data. J. Biomol. NMR 4, 519-542 (1994). 36. Edison, A. S., F. Weinhold, W. M. Westler and J. L. Markley, Estimates of Phi- Torsion and Psi-Torsion Angles in Proteins from One-Bond, 2-Bond and 3-Bond Nuclear Spin-Spin Couplings - Application to Staphylococcal Nuclease. J. Biomol. NMR 4, 543-551 (1994). 37. Hansen, P. E., Carbon-Hydrogen Spin-Spin Coupling-Constants. Prog. Nucl. Magn. Reson. Spectrosc. 14, 175-296 (1981). 38. Bock, K. and C. Pedersen, Study of Ch-13 Coupling-Constants in Pentopyranoses and Some of Their Derivatives. Acta Chemica Scandinavica Series B-Organic Chemistry and Biochemistry B 29, 258-264 (1975). 39. Karplus, M. J. Am. Chem. Soc., 85, 2870-2871 (1963). 40. Bystrov, V. F. Spin-Spin Coupling and the Conformational States of Peptide Systems. Prog. NMR Spectrosc., 10, 41-81 (1976). 41. Derome, AE. Organic Chemistry Series: Modern NMR Techniques for Chemistry Research, Pergamon, Kidlington, Oxford, (1995). 42. Neuhaus, D and Williamson, MP. The nuclear Overhauser effect in structural and conformational analysis, VCH Publishers, New York,Weinheim, Cambridge, (1989).
112

43. Bax, A. and D. G. Davis, Practical Aspects of Two-Dimensional Transverse Noe Spectroscopy. J. Magn. Reson. 63, 207-213 (1985). 44. Wüthrich, K. NMR of Proteins and Nucleic Acids, Wiley and Sons, New York, (1986). 45. Prestegard, J. H., H. M. Al-Hashimi and J. R. Tolman, NMR structures of biomolecules using field oriented media and residual dipolar couplings. Q. Rev. Biophys. 33, 371-424 (2000). 46. Gronenborn, A. M., The importance of being ordered: improving NMR structures using residual dipolar couplings. C. R. Biol. 325, 957-966 (2002). 47. de Alba, E. and N. Tjandra, NMR dipolar couplings for the structure determination of biopolymers in solution. Prog. Nucl. Magn. Reson. Spectrosc. 40, 175-197 (2002). 48. Case, D. A. Calculations of NMR dipolar coupling strengths in model peptides. J. Biomol. NMR 15, 95-102. (1999). 49. Saupe, A. Recent results in the field of liquid crystals. Angew. Chem. Int. Ed. Engl. 7, 97-112. (1968). 50. Claridge T. D. W. High-Resolution NMR techniques in Organic Chemistry, Pergamon, Amsterdam, p. 8-12, (1999) 51. J. Jeener, Ampere International Summer School, Basko Polje, 1971 (proposal) 52. von Kienlin, M., C. T. W. Moonen, A. Vandertoorn and P. C. M. van Zijl, Rapid Recording of Solvent-Suppressed 2d Cosy Spectra with Inherent Quadrature Detection Using Pulsed Field Gradients. J. Magn. Reson. 93, 423-429 (1991). 53. Braunschweiler, L. and R. R. Ernst, Coherence Transfer by Isotropic Mixing - Application to Proton Correlation Spectroscopy. J. Magn. Reson. 53, 521-528 (1983). 54. Bax, A. and D. G. Davis, Mlev-17-Based Two-Dimensional Homonuclear Magnetization Transfer Spectroscopy. J. Magn. Reson. 65, 355-360 (1985). 55. Davis, D. G. and A. Bax, Assignment of Complex H-1-Nmr Spectra Via Two- Dimensional Homonuclear Hartmann-Hahn Spectroscopy. J. Am. Chem. Soc. 107, 2820-2821 (1985). 56. Kövér, K. E., D. Uhrin and V. J. Hruby, Guadient- and sensitivity-enhanced TOCSY experiments. J. Magn. Reson. 130, 162-168 (1998). 57. Otting, G. and K. Wuthrich, Efficient Purging Scheme for Proton-Detected Heteronuclear Two- Dimensional Nmr. J. Magn. Reson. 76, 569-574 (1988). 58. Kövér, K. E., O. Prakash and V. J. Hruby, Z-Filtered Heteronuclear Coupled-Hsqc- Tocsy Experiment as a Means for Measuring Long-Range Heteronuclear Coupling- Constants. J. Magn. Reson. Ser. A 103, 92-96 (1993).
113
59. Kövér, K. E., V. J. Hruby and D. Uhrin, Sensitivity- and gradient-enhanced heteronuclear coupled/decoupled HSQC-TOCSY experiments for measuring long- range heteronuclear coupling constants. J. Magn. Reson. 129, 125-129 (1997). 60. Bodenhausen, G. and D. J. Ruben, Natural Abundance N-15 Nmr by Enhanced Heteronuclear Spectroscopy. Chem. Phys. Lett. 69, 185-189 (1980). 61. Palmer, A. G., J. Cavanagh, P. E. Wright and M. Rance, Sensitivity Improvement in Proton-Detected 2-Dimensional Heteronuclear Correlation Nmr-Spectroscopy. J. Magn. Reson. 93, 151-170 (1991). 62. Kay, L. E., P. Keifer and T. Saarinen, Pure Absorption Gradient Enhanced Heteronuclear Single Quantum Correlation Spectroscopy with Improved Sensitivity. J. Am. Chem. Soc. 114, 10663-10665 (1992). 63. Kontaxis, G., J. Stonehouse, E. D. Laue and J. Keeler, The Sensitivity of Experiments Which Use Gradient Pulses for Coherence-Pathway Selection. J. Magn. Reson. Ser. A 111, 70-76 (1994). 64. Bax, A. and M. F. Summers, H-1 and C-13 Assignments from Sensitivity-Enhanced Detection of Heteronuclear Multiple-Bond Connectivity by 2d Multiple Quantum Nmr. J. Am. Chem. Soc. 108, 2093-2094 (1986). 65. Willker, W., D. Leibfritz, R. Kerssebaum and W. Bermel, Gradient Selection in Inverse Heteronuclear Correlation Spectroscopy. Magn. Reson. Chem. 31, 287-292 (1993). 66. Ruizcabello, J., G. W. Vuister, C. T. W. Moonen, P. Vangelderen, J. S. Cohen and P. C. M. VanZijl, Gradient-Enhanced Heteronuclear Correlation Spectroscopy - Theory and Experimental Aspects. J. Magn. Reson. 100, 282-302 (1992). 67. Kessler, H., H. Oschkinat and C. Griesinger, Transformation of Homonuclear Two- Dimensional Nmr Techniques into One-Dimensional Techniques Using Gaussian Pulses. J. Magn. Reson. 70, 106-133 (1986). 68. Sklenar, V. and J. Feigon, Simplification of DNA Proton Nuclear-Magnetic- Resonance Spectra by Homonuclear Hartmann-Hahn Edited 2-Dimensional Nuclear Overhauser Enhancement Spectroscopy. J. Am. Chem. Soc. 112, 5644-5645 (1990). 69. Kessler, H., S. Mronga and G. Gemmecker, Multidimensional Nmr Experiments Using Selective Pulses. Magn. Reson. Chem. 29, 527-557 (1991). 70. Poppe, L. and H. Vanhalbeek, Noe Measurements on Carbohydrates in Aqueous- Solution by Double-Selective Pseudo-3d Tocsy-Roesy and Tocsy-Noesy - Application to Gentiobiose. J. Magn. Reson. 96, 185-190 (1992). 71. Facke, T. and S. Berger, Application of Pulsed-Field Gradients in an Improved Selective Tocsy Experiment. J. Magn. Reson. Ser. A 113, 257-259 (1995).
114

72. Jeener, J., B. H. Meier, P. Bachmann and R. R. Ernst, Investigation of Exchange Processes by 2-Dimensional NMR Spectroscopy. J. Chem. Phys. 71, 4546-4553 (1979). 73. reference 41. at p.253-305 74. Wagner, R. and S. Berger, Gradient-selected NOESY - A fourfold reduction of the measurement time for the NOESY experiment. J. Magn. Reson. Ser. A 123, 119-121 (1996). 75. Parella, T., F. SanchezFerrando and A. Virgili, Quick recording of pure absorption 2D TOCSY, ROESY, and NOESY spectra using pulsed field gradients. J. Magn. Reson. 125, 145-148 (1997). 76. Bothnerby, A. A., R. L. Stephens, J. M. Lee, C. D. Warren and R. W. Jeanloz, Structure Determination of a Tetrasaccharide - Transient Nuclear Overhauser Effects in the Rotating Frame. J. Am. Chem. Soc. 106, 811-813 (1984). 77. Hwang, T. L. and A. J. Shaka, Cross Relaxation without Tocsy - Transverse Rotating- Frame Overhauser Effect Spectroscopy. J. Am. Chem. Soc. 114, 3157-3159 (1992). 78. Hwang, T. L., M. Kadkhodaei, A. Mohebbi and A. J. Shaka, Coherent and Incoherent Magnetization Transfer in the Rotating Frame. Magn. Reson. Chem. 30, S24-S34 (1992). 79. Bax, A. and D. G. Davis, Practical Aspects of Two-Dimensional Transverse Noe Spectroscopy. J. Magn. Reson. 63, 207-213 (1985). 80. reference 41. at p. 312-327 81. Eberstadt, M., G. Gemmecker, D. F. Mierke and H. Kessler, Scalar Coupling- Constants - Their Analysis and Their Application for the Elucidation of Structures. Angew. Chem.-Int. Edit. Engl. 34, 1671-1695 (1995). 82. Montelione, G. T. and G. Wagner, Accurate Measurements of Homonuclear H-N-H- Alpha Coupling- Constants in Polypeptides Using Heteronuclear 2d Nmr Experiments. J. Am. Chem. Soc. 111, 5474-5475 (1989). 83. Billeter, M., D. Neri, G. Otting, Y. Q. Qian and K. Wuthrich, Precise Vicinal Coupling-Constants 3jhn-Alpha in Proteins from Nonlinear Fits of J-Modulated [N- 15,H-1]-Cosy Experiments. J. Biomol. NMR 2, 257-274 (1992). 84. Vuister, G. W., F. Delaglio and A. Bax, The Use of 1C-alpha-H-alpha Coupling- Constants as a Probe for Protein Backbone Conformation. J. Biomol. NMR 3, 67-80 (1993). 85. Vuister, G. W. and A. Bax, Quantitative J Correlation - a New Approach for Measuring Homonuclear 3-Bond J(H(N)H(Alpha) Coupling-Constants in N-15- Enriched Proteins. J. Am. Chem. Soc. 115, 7772-7777 (1993).,
115
86. Bax A, Vuister GW, Grzesiek S, Delaglio F, Wang AC, tschuldin R, Zhu G, Meth. Enzymol, 239:79, (1994) 87. Prestegard JH, Tolman JR, Al-Hachimi HM, Andrec M Protein structure and Dynamics from Field.induced residual Dipolar Couplings in Biological Magnetic Resonance, Vol 17, Structure, Computation and Dynamics in Protein NMR, Chapter 8, 311. (1996) 88. Abragam A Principles of Nuclear Magnetism, Caledron Press, Oxford, (1961) 89. Tolman, J. R. and J. H. Prestegard, Measurement of amide N-15-H-1 one-bond couplings in proteins using accordion heteronuclear-shift-correlation experiments. J. Magn. Reson. Ser. B 112, 269-274 (1996). 90. J. R. Garbow, D. P. Weitekamp, A. Pines, Bilinear Rotation Decoupling of Homonuclear Scalar Interactions. Chem. Phys. Lett. 93(5), 504-509 (1982). 91. D. Uhrin, T. Liptaj, K. E. Kövér, Modified Bird Pulses and Design of Heteronuclear Pulse Sequences. J. Magn. Reson. Series A 101(1), 41-46 (1993). 92. Morris, G. A. and R. Freeman, Selective Excitation in Fourier-Transform Nuclear Magnetic- Resonance. J. Magn. Reson. 29, 433-462 (1978). 93. Hwang, T. L. and A. J. Shaka, Water Suppression That Works - Excitation Sculpting Using Arbitrary Wave-Forms and Pulsed-Field Gradients. J. Magn. Reson. Ser. A 112, 275-279 (1995). 94. Stott, K., J. Stonehouse, J. Keeler, T. L. Hwang and A. J. Shaka, Excitation Sculpting in High-Resolution Nuclear-Magnetic- Resonance Spectroscopy - Application to Selective Noe Experiments. J. Am. Chem. Soc. 117, 4199-4200 (1995). 95. Leach A.R Molecular Modelling: Principles and Applications, 2nd edition, Prentice Hall, (2001) 96. Forcefield-Based Simulations, InsightII Manual, Acceryls Inc., San Diego, CA, (1998) 97. Homans, S. W., Oligosaccharide Conformations - Application of Nmr and Energy Calculations. Prog. Nucl. Magn. Reson. Spectrosc. 22, 55-81 (1990). 98. Perez, S., M. Kouwijzer, K. Mazeau and S. B. Engelsen, Modeling polysaccharides: Present status and challenges. J. Mol. Graph. 14, 307-& (1996). 99. Lemieux, R. U.; Pavia, A. A.; Martin, J. C.; Watanabe, K. A. Can. J. Chem., 47, 4427- 2239, (1969), 100. Tvaroska, I. and T. Bleha, Anomeric and Exoanomeric Effects in Carbohydrate- Chemistry. Adv. Carbohydr. Chem. Biochem. 47, 45-123 (1989). 101. G.A. Jeffrey and W. Saenger. Hydrogen Bonding in Biological Structures. Springer Verlag, Heidelberg, (1991).
116
102. Kouwijzer, M. and P. D. J. Grootenhuis, Parametrization and Application of Cheat95, an Extended Atom Force-Field for Hydrated (Oligo)Saccharides. J. Phys. Chem. 99, 13426-13436 (1995). 103. Orozco, M., J. M. Lopez, C. Colomines, C. Alhambra, M. A. Busquets and F. J. Luque, Theoretical representation of solvation in biochemical systems: From discrete solute-solvent interactions to bulk solvation. Int. J. Quantum Chem. 60, 1179-1187 (1996). 104. Seidl, P. H., Schleifer, K. H. Biological properties of peptidoglycans; W.de Gruyter: Berlin, (1986). 105. Ellouz, F., A. Adam, R. Ciorbaru and E. Lederer, Minimal structure requirement for adjuvant activity of peptidoglycan derivatives. Biochem. Biophys. Res. Commun. 59, 1317-1325 (1974). 106. Azuma, I., Synthetic immunoadjuvants: application to non-specific host stimulation and potentiation of vaccine immunogenicity. Vaccine 10, 1000-1006 (1992). 107. Stewart-Tull, D., Immunostimulation with peptidoglycan or its synthetic derivatives. Prog. Drug Res 32, 305-328 (1988). 108. Baschang, G., Muramylpeptides and lipopeptides: Studies towards immunostimulants. Tetrahedron 45, 6331-6360 (1989). 109. Roshni Mitra, Sarvjeet Singh and Ashok Khar Roshni Mitra, Sarvjeet Singh and Ashok Khar Antitumour immune responses Expert Reviews in molecular medicine Vol 5. at http://www.expertreviews.org/ (2003), 110. Sava, G., S. Pacor, B. Vranesic, J. Tomasic and M. Cocchietto, Modification of the Growth of Mca Mammary-Carcinoma of Cba Mouse by New Adamantylpeptides. Int. J. Oncol. 2, 607-612 (1993). 111. Ladeçic, B., S. Perovic and I. Hrçak, Pharmacokinetics of an Immunomodulator Peptidoglycan Monomer in Mice After Intravenous Administration. Int.J.Immunopharmac. 15, 145-150 (1993). 112. Vraneçic, B., J. Tomaçic, D. Ljevakovic and I. Hrsak Biological Activity of Novel Adamantyl Tripeptides with Emphasis on their Immunorestorative Effect. New York Basel, Hong Kong, Marcel Dekker, Inc. (1994) 113. Keglević D., Ladešić B., Tomašić J., Valinger Z., Naumski R. Isolation procedure and properties of monomer unit from lysozyme digest of peptidoglycan complex excreted into the medium by penicillin-treated Brevibacterium divaricatum mutant. Biochim. Biophys. Acta 629 77-82. (1979), 114. Tomašić J., Sesartić Lj., Martin S.A., Valinger Z., Ladešić B. Comparative susceptibility of a peptidoglycan monomer from Brevibacterium divaricatum and its anhydromuramyl analogue to hydrolysis with N-acetylmuramyl-L-alanine amidase. J. Chromatogr. 440 405-414. (1988)
117
115. Tomašić J. and Hršak I. Peptidoglycan monomer originating from Brevibacterium divaricatum - its metabolism and biological activities in the host. In Surface Structures of Microorganisms and Their Interaction with the Mammalian Host (E. Schrinner, M.H. Richmond, G. Seidl and U. Schwartz, Eds.) 113-121. VCH Gesellschaft., (1988). 116. J. Tomašić, I. Hanzl-Dujmović, B. Špoljar, B. Vranešić, M. Šantak, A. Jovičić. Comparative study of the effects of peptidoglycan monomer and structurally related adamantyltripeptides on humoral immune response to ovalbumin in the mouse. Vaccine 18 1236-1243. (2000), 117. Sava, G., T. Giraldi, J. Tomasic and I. Hrsak, Immunotherapy of Lewis Lung- Carcinoma with Hydrosoluble Peptidoglycan Monomer (Pgm). Cancer Immunol. Immunother. 15, 84-86 (1983). 118. Hrsak, I., J. Tomasic and M. Osmak, Immunotherapy of B-16 Melanoma with Peptidoglycan Monomer. European Journal of Cancer & Clinical Oncology 19, 681- 686 (1983). 119. Sava, G., J. Tomasic and I. Hrsak, Antitumor and Antimetastatic Activity of the Immunoadjuvant Peptidoglycan Monomer Pgm in Mice Bearing Mca Mammary- Carcinoma. Cancer Immunol. Immunother. 18, 49-53 (1984). 120. Martin, S. A., M. L. Karnovsky, J. M. Krueger, J. R. Pappenheimer and K. Biemann, Peptidoglycans as Promoters of Slow-Wave Sleep .1. Structure of the Sleep-Promoting Factor Isolated from Human-Urine. J. Biol. Chem. 259, 2652-2658 (1984). 121. Tomaçi†, J. and I. Hrçak, Peptidoglycan monomer originating from Brevibacterium divaricatum - its metabolism and biological activities in the host. Preceedings of the Eigtheenh Workshop Conference Hoechst, 113, (1987). 122. Klaić, B., 13C NMR studies of a natural immunoadjuvant,peptidoglycan monomer and related compounds. Carbohydr. Res. 110, 320-325 (1982). 123. Klaić, B., B. Ljubi†, B. Metelko and M. Pongra†i†, NMR titration of a natural immonuadjuvant,disaccharide-pentapeptide,peptidoglycan monomer and related compounds. Carbohydr. Res. 123, 168-172 (1983). 124. Klaić, B., Domenick, R. L. 1H-NMR Studies of a Natural Immunoadjuvant Peptidoglycan Monomer:Proposed Structure in Solution in Methyl Sulfoxide. Carbohydr. Res. 196, 19-27 (1990). 125. Matter, H., L. Szilágyi, P. Forgó, Z. Marinić and B. Klaić, Structure and dynamics of a peptidoglycan monomer ihem. Soc. 119, 2212-2223 (1997). 126. Halls, T. D. J., M. S. Raju, E. Wenkert, M. Zuber, P. Lefrancier and E. Lederer, The Anomeric Configuration of the Immunostimulant N- Acetylmuramoyl-Dipeptide and Some of Its Derivatives. Carbohydr. Res. 81, 173-176 (1980). 127. Chapman, B. E., M. Batley and J. W. Redmond, Proton N.M.R. of the Muramyl Dipeptide Adjuvant in Dimethyl Sulfoxide. Aust. J. Chem. 35, 489-493 (1982).
118
128. McFarlane, E. F. and C. Martinic, 400-MHz 1H NMR of Adjuvant Muramyl Dipeptide in Dimethylsulfoxide. Aust. J. Chem. 36, 1087-1096 (1983)., 129. Fermandjian, S., B. Perly, M. Level and P. Lefrancier, A comparative 1H-NMR study of MurNAc-L-Ala-D-DiGln (MDP) and its analogue Murabutide: evidence for a structure involving two successive beta turns in MDP. Carbohydr. Res. 162, 23-32 (1987). 130. Sizun, P., B. Perly, M. Level, P. Lefrancier and S. Fermandjian, Solution Conformations of the Immunomodulator Muramyl Peptides. Tetrahedron 44, 991-997 (1988). 131. Harb, V., J. Mavri, J. Kidric and D. Hadzi, Solution Conformation of the Immunomodulator Muramyl Dipeptide - Restrained Molecular-Dynamics Based on Nuclear-Magnetic- Resonance Data and Semiempirical Mo Study. Croatica Chemica Acta 64, 551-559 (1991). 132. Pristovsek, P., J. Kidric, J. Mavri and D. Hadzi, Nmr and Molecular-Dynamics Study of 4 Carbocyclic Muramyl Dipeptide Analogs. Biopolymers 33, 1149-1157 (1993). 133. Pristovsek, P. and J. Kidric, NMR and Molecular Dynamics Study of Muroctasin- Implications for the Bioactive Conformation. Biopolymers 42, 659-671 (1997). 134. Tonkovič, M., O. Had§ija, B. Ladeçič, B. Klaič and S. Musič, Preparation and Properties of the Complex of Fe(III) with Peptidoglycan Monomer. Inorg. Chim. Acta 161, 81-85 (1989). 135. Suskovic, B., Z. Vajtner and R. Naumski, Synthesis and Biological Activities of some Peptidoglycan Monomer Derivatives. Tetrahedron 47, 8407-8416 (1991). 136. Merser C, Sinay P, Adam A, Total synthesis and adjuvant activity of bacterial peptidoglycan derivatives. Biochem. Biophys. Res. Commun. 66:1316, (1975), 137. Adam A, Lederer E, Muramylpeptides as immunomodulators. ISI atlas of Science: Immunology. 1-205 (1985) 138. Levakovic, D., J. Tomasic, V. Sporec, B. H. Spoljar and I. Hanzl-Dujmovic, Synthesis of novel adamantylacetyl derivative of peptidoglycan monomer - Biological evaluation of immunomodulatory peptidoglycan monomer and respective derivatives with lipophilic substituents on amino group. Bioorg. & Medic. Chem. 8, 2441-2449 (2000). 139. Hršak, I.; Ljevaković, D.; Tomašić, J.; Vranešić, B. In Immunotherapy of Infections; Masihi, N., Ed.; Marcel Dekker, Inc.:; pp 249-257. (1994), 140. Vraneçic, B., D. C, J. Tomaçic and B. Ladeçic, A comperetive radioimmunoassay for peptidoglycan monomer. Clin.Chim.A 202, 23-38 (1991). 141. Dyson, H. J., G. Merutka, J. P. Waltho, R. A. Lerner and P. E. Wright, Folding of Peptide-Fragments Comprising the Complete Sequence of Proteins - Models for Initiation of Protein Folding .1. Myohemerythrin. J. Mol. Biol. 226, 795-817 (1992).
119
142. Malkin, V. G., O. L. Malkina, M. E. Casida and D. R. Salahub, Nuclear-Magnetic- Resonance Shielding Tensors Calculated with a Sum-over-States Density-Functional Perturbation-Theory. J. Am. Chem. Soc. 116, 5898-5908 (1994). 143. Weimar, T., U. C. Kreis, J. S. Andrews and B. M. Pinto, Conformational analysis of maltoside heteroanalogues using high-quality NOE data and molecular mechanics calculations. Flexibility as a function of the interglycosidic chalcogen atom. Carbohydr. Res. 315, 222-233 (1999). and the references cited therein 144. Jimenez-Barbero, J., J. F. Espinosa, J. L. Asensio, F. J. Canada and A. Poveda The conformation of C-glycosyl compounds. Advances in Carbohydrate Chemistry and Biochemistry, Vol 56. 56: 235-284. (2001). and the references cited therein 145. Babirad, S. A., Y. Wang, P. G. Goekjian and Y. Kishi, Preferred Conformation of C- Glycosides .3. Preferred Conformation of Carbon Analogs of 1,4-Disaccharides. J. Org. Chem. 52, 4825-4827 (1987). 146. Goekjian, P. G., T. C. Wu, H. Y. Kang and Y. Kishi, Preferred Conformation of C- Glycosides .2. Preferred Conformation of Carbon Analogs of Isomaltose and Gentiobiose. J. Org. Chem. 52, 4823-4825 (1987). 147. Goekjian, P. G., T. C. Wu, H. Y. Kang and Y. Kishi, Preferred Conformation of C- Glycosides .7. Preferred Conformation of Carbon Analogs of Isomaltose and Gentiobiose. J. Org. Chem. 56, 6422-6434 (1991). 148. Goekjian, P. G., T. C. Wu and Y. Kishi, Preferred Conformation of C-Glycosides .6. Conformational Similarity of Glycosides and Corresponding C-Glycosides. J. Org. Chem. 56, 6412-6422 (1991). 149. Haneda, T., P. G. Goekjian, S. H. Kim and Y. Kishi, Preferred Conformation of C- Glycosides .10. Synthesis and Conformational-Analysis of Carbon Trisaccharides. J. Org. Chem. 57, 490-498 (1992). 150. Miller, W. H., D. M. Ryckman, P. G. Goekjian, Y. Wang and Y. Kishi, Preferred Conformation of C-Glycosides .5. Experimental Support for the Conformational Similarity between C-Disaccharides and O-Disaccharides. J. Org. Chem. 53, 5580- 5582 (1988). 151. Oleary, D. J. and Y. Kishi, Preferred Conformation of C-Glycosides .11. C-Sucrose - New Practical Synthesis, Structural Reassignment, and Solid-State and Solution Conformation of Its Octaacetate. J. Org. Chem. 58, 304-306 (1993). 152. Oleary, D. J. and Y. Kishi, Preferred Conformation of C-Glycosides .13. A Comparison of the Conformational Behavior of Several C-Furanosides, N- Furanosides, and O-Furanosides. J. Org. Chem. 59, 6629-6636 (1994). 153. Wang, Y., P. G. Goekjian, D. M. Ryckman and Y. Kishi, Preferred Conformation of C-Glycosides .4. Importance of 1,3- Diaxial-Like Interactions around the Nonglycosidic Bond - Prediction and Experimental Proof. J. Org. Chem. 53, 4151- 4153 (1988).
120
154. Wei, A., A. Haudrechy, C. Audin, H. S. Jun, N. Haudrechybretel and Y. Kishi, Preferred Conformation of C-Glycosides .14. Synthesis and Conformational-Analysis of Carbon Analogs of the Blood-Group Determinant H-Type-Ii. J. Org. Chem. 60, 2160-2169 (1995). 155. Wei, A. and Y. Kishi, Preferred Conformation of C-Glycosides .12. Synthesis and Conformational-Analysis of Alpha,Alpha-, Alpha,Beta-, and Beta,Beta-C-Trehaloses. J. Org. Chem. 59, 88-96 (1994). 156. Wu, T. C., P. G. Goekjian and Y. Kishi, Preferred Conformation of C-Glycosides .1. Conformational Similarity of Glycosides and Corresponding C-Glycosides. J. Org. Chem. 52, 4819-4823 (1987). 157. Yuan, W., S. A. Babirad and Y. Kishi, Preferred Conformation of C-Glycosides .8. Synthesis of 1,4- Linked Carbon Disaccharides. J. Org. Chem. 57, 468-481 (1992). 158. Yuan, W., P. G. Goekjian, D. M. Ryckman, W. H. Miller, S. A. Babirad and Y. Kishi, Preferred Conformation of C-Glycosides .9. Conformational- Analysis of 1,4-Linked Carbon Disaccharides. J. Org. Chem. 57, 482-489 (1992). 159. X=C, Y=N: Andrews, J. S., T. Weimar, T. P. Frandsen, B. Svensson and B. M. Pinto, Novel Disaccharides Containing Sulfur in the Ring and Nitrogen in the Interglycosidic Linkage - Conformation of Methyl 5'- Thio-4-N-Alpha-Maltoside Bound to Glucoamylase and Its Activity as a Competitive Inhibitor. J. Am. Chem. Soc. 117, 10799-10804 (1995). 160. X=Y=C: Dondoni, A., H. M. Zuurmond and A. Boscarato, Synthesis of alpha- and beta-D-(1->-6)-C-disaccharides by Wittig olefination of formyl C-glycosides with glycopyranose 6- phosphoranes. J. Org. Chem. 62, 8114-8124 (1997). 161. X=Y=C, X=C, Y=S: Griffin, F. K., D. E. Paterson and R. J. K. Taylor, Ramberg- Backlund approaches to the synthesis of C-linked disaccharides. Angew. Chem.-Int. Edit. 38, 2939-2942 (1999). 162. X=N, Y=O: calicheamicins and esperamicins, for a review see: Smith, A. L. and K. C. Nicolaou, The enediyne antibiotics. J. Med. Chem. 39, 2103-2117 (1996). 163. X=C, Y=O: namenamicin: Weinstein, D. S. and K. C. Nicolaou, Synthesis of the namenamicin A-C disaccharide: towards the total synthesis of namenamicin. J. Chem. Soc.-Perkin Trans. 1, 545-557 (1999). 164. Stanek, J.; Sindlerova, M.; Cerny´, M. Coll. Czech. Chem. Comm., 30, 297–303; (1965) 165. Bell, R. H.; Horton, D.; Miller, M. J. Carbohydr. Res., 9, 201–214. (1969) 166. Wenzl, I., H. Kahlig, F. R. Unger and W. Schmid, A novel approach to beta-(1 -> 4)- linked thiodisaccharides starting from disulfide sugars. Mon. Chem. 130, 1137-1145 (1999).
121
167. Hough, L.; Sinchareonkul, L. V.; Richardson, A. C.; Akhtar, F.; Drew, M. G. B. Carbohydr. Res., 9, 145–160. (1969) 168. Davis, B. G., R. C. Lloyd and J. B. Jones, Controlled site-selective glycosylation of proteins by a combined site-directed mutagenesis and chemical modification approach. J. Org. Chem. 63, 9614-9615 (1998). 169. Macindoe, W. M., A. H. van Oijen and G. J. Boons, A unique and highly facile method for synthesising disulfide linked neoglycoconjugates: a new approach for remodelling of peptides and proteins. Chem. Commun., 847-848 (1998). 170. Szilagyi, L., T. Z. Illyes and P. Herczegh, Elaboration of a novel type of interglycosidic linkage: syntheses of disulfide disaccharides. Tetrahedron Lett. 42, 3901-3903 (2001). 171. Sears, P. and C. H. Wong, Carbohydrate mimetics: A new strategy for tackling the problem of carbohydrate-mediated biological recognition. Angew. Chem.-Int. Edit. 38, 2301-2324 (1999). 172. Perez, S., M. Kouwijzer, K. Mazeau and S. B. Engelsen, Modeling polysaccharides: Present status and challenges. J. Mol. Graph. 14, 307-& (1996). 173. Walker, S., D. Gange, V. Gupta and D. Kahne, Analysis of Hydroxylamine Glycosidic Linkages - Structural Consequences of the No Bond in Calicheamicin. J. Am. Chem. Soc. 116, 3197-3206 (1994). 174. Lees, W. J.; Whitesides, G. M. J. Am. Chem. Soc., 115, 1860–1869 Lees, W. J. and G. M. Whitesides, Interpretation of the Reduction Potential of 6,6'-Dithiosucrose Cyclic Disulfide by Comparison of the Conformations of 6,6'- Dithiosucrose Cyclic Disulfide, 6,6'-Dithiosucrose, and Sucrose in Aqueous-Solution. J. Am. Chem. Soc. 115, 1860-1869 (1993). and references cited therein. 175. Homans, S. W., Oligosaccharide Conformations - Application of Nmr and Energy Calculations. Prog. Nucl. Magn. Reson. Spectrosc. 22, 55-81 (1990). 176. Croasmun W. R., Carlson R. M. K. Two-Dimensioanl and related NMR methods in Structural Analyses of Oligisaccharides and Polysaccharides, VCH Publishers, New York, Chapter 8. by Dabrovsky J: Two Dimenesional and Related NMR Methods in Structural Analysis of Oligosaccharides and Polysaccharides, p.741-783, (1994) 177. Sandstrom, C., H. Baumann and L. Kenne, The use of chemical shifts of hydroxy protons of oligosaccharides as conformational probes for NMR studies in aqueous solution. Evidence for persistent hydrogen bond interaction in branched trisaccharides. J. Chem. Soc.-Perkin Trans. 2, 2385-2393 (1998). 178. de la Paz, M. L., J. Jimenez-Barbero and C. Vicent, Hydrogen bonding and cooperativity effects on the assembly of carbohydrates. Chem. Commun., 465-466 (1998). 179. Bernet, B. and A. Vasella, Intra- and intermolecular H-bonds of alcohols in DMSO - H-1-NMR analysis of inter-residue H-bonds in selected oligosaccharides: Cellobiose,
122
lactose, N,N '-diacetylchitobiose, maltose, sucrose, agarose, and hyaluronates. Helv. Chim. Acta 83, 2055-2071 (2000). 180. Cumming, D. A. and J. P. Carver, Virtual and Solution Conformations of Oligosaccharides. Biochemistry 26, 6664-6676 (1987). 181. Woods, R. J., Computational carbohydrate chemistry: what theoretical methods can tell us. Glycoconjugate J. 15, 209-216 (1998). 182. Martin-Pastor, M. and C. A. Bush, Conformational studies of human milk oligosaccharides using H- 1-C-13 one-bond NMR residual dipolar couplings. Biochemistry 39, 4674-4683 (2000). 183. Neubauer, H., J. Meiler, W. Peti and C. Griesinger, NMR structure determination of saccharose and raffinose by means of homo- and heteronuclear dipolar couplings. Helv. Chim. Acta 84, 243-258 (2001). 184. Tian, F., H. M. Al-Hashimi, J. L. Craighead and J. H. Prestegard, Conformational analysis of a flexible oligosaccharide using residual dipolar couplings. J. Am. Chem. Soc. 123, 485-492 (2001). 185. Tjandra, N., S. Grzesiek and A. Bax, Magnetic field dependence of nitrogen-proton J splittings in N- 15-enriched human ubiquitin resulting from relaxation interference and residual dipolar coupling. J. Am. Chem. Soc. 118, 6264-6272 (1996). 186. Martin-Pastor, M. and C. A. Bush, The use of NMR residual dipolar couplings in aqueous dilute liquid crystalline medium for conformational studies of complex oligosaccharides. Carbohydr.Res. 323, 147-155 (2000). 187. Martin-Pastor, M. and C. A. Bush, Conformational studies of human milk oligosaccharides using H- 1-C-13 one-bond NMR residual dipolar couplings. Biochemistry 39, 4674-4683 (2000). 188. Weiner, S. J.; Kollman, P. A.; Case, D. A.; Singh, U. C.; Ghio, C.; Alagona, G.; Profeta, S. Jr.; Weiner, P. A new force field for molecular mechanical simulation of nucleic acids and proteins, J. Am. Chem. Soc., 106, 765–784 (1984). 189. Weiner, S. J.; Kollman, P. A.; Nguyen, D. T.; Case, D. A. An all atom forcefield for simulations of proteins and nucleic acid, J. Comp. Chem., 7, 230–252 (1986). 190. Homans, S. W., A molecular mechanical force field for the conformational analysis of oligosaccharides: Comparison of theoretical and crystal structures of Man α1–3 Man β1–4 GlcNAc, Biochemistry, 29, 9110–9118 (1990). 191. Tvaroska, I. and J. P. Carver, Ab initio molecular orbital calculation of carbohydrate model compounds .5. Anomeric, exo-anomeric, and reverse anomeric effects in C-, N- , and S-glycosyl compounds. J. Phys. Chem. 100, 11305-11313 (1996). 192. J. R. Tolman, J. M. Flanagan, M. A. Kennedy, J. H.Prestegard, Nuclear Magnetic Dipole Interactions in Field-Oriented Proteins - Information for Structure Determination in Solution. Proc. Natl. Acad. Sci. USA 92(20), 9279-9283 (1995).
123
193. M. Zweckstetter, and A. Bax, Prediction of sterically induced alignment in a dilute liquid crystalline phase: Aid to protein structure determination by NMR. J. Am. Chem. Soc. 122(15), 3791-3792 (2000). 194. M. X. Fernandes, P. Berando, M. Pons and J. G. de la Torre, An analytical solution to the problem of the orientation of rigid particles by planar obstacles. Application to membrane systems and to the calculation of dipolar couplings in protein NMR spectroscopy. J. Am. Chem. Soc. 123, 12037-12047 (2001). 195. M. Ottiger, F. Delaglio, A. Bax, Measurement of J and dipolar couplings from simplified two- dimensional NMR spectra. J. Magn. Reson. 131(2), 373-378 (1998). 196. P. Andersson, J. Weigelt, G. Otting, Spin-state selection filters for the measurement of heteronuclear one-bond coupling constants. J. Biomol. NMR 12, 435-441 (1998). 197. P. Addersson, K. Nordstrand, M. Sunnerhagen, E. Liepinsh, I. Turovskis, G. Otting, Heteronuclear correlation experiments for the determination of one-bond coupling constants. J. Biomol. NMR 11, 445-450 (1998). 198. M. D. Sorensen, A. Meissner, O. W. Sorensen, C-13 natural abundance (SE)-E-3 and (SCT)-C-3 experiments for measurement of J coupling constants between C-13(alpha) or H- 1(alpha) and other protons in a protein. J. Magn. Reson. 137(1), 237-242 (1999). 199. P. Andersson, A. Annila, G. Otting, An alpha/beta Experiment for Spin-Selective Editing of IS Cross Peaks. J. Magn. Reson. 133, 364-367 (1998). 200. B. Brutscher, J. Boisbouvier, A. Pardi, D. Marion, J. P. Simorre, Improved sensitivity and resolution in H-1-C-13 NMR experiments of RNA. J. Am. Chem. Soc. 120(46), 11845-11851 (1998). 201. M. H. Lerche, A. Meissner, F. M. Poulsen, O. W. Sorensen, Pulse sequences for measurement of one-bond N-15-H-1 coupling constants in the protein backbone. J. Magn. Reson. 140(1), 259-263 (1999). 202. F. Cordier, A. J. Dingley, S. Grzesiek, A doublet-separated sensitivity-enhanced HSQC for the determination of scalar and dipolar one-bond J-couplings. J. Biomol. NMR 13(2), 175-180 (1999). 203. K. Pervushin, R. Riek, G. Wider, and K. Wuthrich, Attenuated T-2 Relaxation by Mutual Cancellation of Dipole-dipole Coupling and Chemical Shift Anisotropy Indicates an Avenue to NMR Structures of Very Large Biological Macromolecules in Solution. Proc. Natl. Acad. Sci. U. S. A. 94, 12366-12371 (1997). 204. J. Weigelt, Single Scan, Sensitivity- and Gradient-enhanced TROSY for Multidimensional NMR Experiments. J. Am. Chem. Soc. 120, 10778-10779 (1998). M. Czisch and R. Boelens, Sensitivity Enhancement in the TROSY Experiment. J. Magn. Reson. 134, 158-160 (1998).
124

205. C. Griesinger, O. W. Sorensen, R. R. Ernst, Practical Aspects of the E-Cosy Technique - Measurement of Scalar Spin Spin Coupling-Constants in Peptides. J. Magn. Reson. 75(3), 474-492. (1987). 206. T. N. Pham, T. Liptaj, K. Bromek, D. Uhrin, Measurement of small one-bond proton- carbon residual dipolar coupling constants in partially oriented C-13 natural abundance oligosaccharide samples: Analysis of heteronuclear (1)J(CH)- modulated spectra with the BIRD inversion pulse. J. Magn. Reson. 157(2), 200-209 (2002). 207. Vliegenthart, J. F. G., L. Dorland and H. van Halbeek, High-Resolution, H-1-Nuclear Magnetic-Resonance Spectroscopy as a Tool in the Structural-Analysis of Carbohydrates Related to Glycoproteins. Adv.Carbohydr.Chem.Biochem. 41, 209-374 (1983). 208. Jobron, L. and O. Hindsgaul, Novel para-substituted benzyl ethers for hydroxyl group protection. J. Am. Chem. Soc. 121, 5835-5836 (1999). 209. Fukase, K., Y. Nakai, K. Egusa, J. A. Porco and S. Kusumoto, A novel oxidatively removable linker and its application to alpha-selective solid-phase oligosaccharide synthesis on a macroporous polystyrene support. Synlett, 1074-1078 (1999). 210. Rutherford, T. J., K. P. R. Kartha, S. K. Readman, P. Cura and R. A. Field, Iodine and its' interhalogen compounds: Useful reagents in carbohydrate chemistry - X. Adaptation of an NMR signal suppression pulse sequence for the selective removal of benzylic methylene signals of benzyl ether protected carbohydrates. Tetrahedron Lett. 40, 2025-2028 (1999). 211. Roumestand, C., J. Mispelter, C. Austruy and D. Canet, The Use of Band Filtering in Multidimensional Nmr - Evaluation of 2 User-Friendly Techniques. J. Magn. Reson. Ser. B 109, 153-163 (1995). 212. Emsley, L. in Methods in Enzymology; Oppenheimer, N.J.; James, T.L., Eds.; Academic Press: San Diego, 1994; Vol. 239, pp. 207-246. 213. Geen, H. and R. Freeman, Band-Selective Radiofrequency Pulses. J. Magn. Reson. 93, 93-141 (1991). 214. Keglevic, D., B. Ladesic, O. Hadzija, J. Tomasic, Z. Valinger, M. Pokorny and R. Naumski, Isolation and Study of Composition of a Peptidoglycan Complex Excreted by Biotin-Requiring Mutant of Brevibacterium- Divaricatum Nrrl-2311 in Presence of Penicillin. European Journal of Biochemistry 42, 389-400 (1974). 215. Hwang, T. L. and A. J. Shaka, Reliable 2-Dimensional Rotating-Frame Cross- Relaxation Measurements in Coupled Spin Systems. J. Magn. Reson. Ser. B 102, 155- 165 (1993). 216. Dauber-Ogusthorpe, P.; Roberts, V. A.; Ogusthorpe, D. J.; Wolff, D. J.; Genest, M.; Hagler, A. T. Proteins: Structure, Function, and Genetics, 4, 31-47. (1988)
125
217. Pristovsek, P., J. Kidric and D. Hadzi, Bioactive Conformations of Small Peptides - a Method for Selection of Candidates Based on Conformations of Active and Inactive Analogs and Its Application to Muramyl Dipeptide. J. Chem. Inf. Comput. Sci. 35, 633-639 (1995). 218. Sanders, C. R. and J. H. Prestegard, Magnetically Orientable Phospholipid-Bilayers Containing Small Amounts of a Bile-Salt Analog, Chapso. Biophys. J. 58, 447-460 (1990). 219. Fehér K, Berger S, Kövér KE (2003). "Accurate determination of small one-bond heteronuclear residual dipolar couplings by F1 coupled HSQC modified with a G- BIRD(r) module", Journal of Magnetic Resonance 163 (2003)
126

9. APPENDIX
Content
Appendix A Table 3.1 1H and 13C chemical shift data for PGM, Ad-PGM and BocTyr-PGM Appendix B Table 3.2 NOESY/ROESY cross peak intensities for PGM, Ad-PGM and BocTyr-PGM
Appendix C Insight II input file for F DISCOVER for flexible geometry systematic search Appendix D Insight II input file for F DISCOVER for simulated annealing Appendix E 2D crosssection of the 3D potential energy surface for the Glc-S-S-Man derivative. Appendix F 2D crosssection of the 3D potential energy surface for the Glc-S-S-Gal derivative. Appendix G 2D crosssection of the 3D potential energy surface for the Glc-S-S- NAcGlc derivative.
127

Appendix A
Table 3.1 1H and 13C chemical shift data for PGM, Ad-PGM and BocTyr-PGMa
PGM Ad-PGM BocTyr-PGM
*1H *13C *1H *13C *1H *13C
$-GlcNAc-1 4.414 100.20 4.428 100.07 4.427 100.07
$-GlcNAc-2 3.404 55.81 3.409 56.03 3.396 56.14
$-GlcNAc-3 3.067b 76.53b 3.411 75.02 3.396 73.50
$-GlcNAc-4 3.396 73.46 3.074 76.41 3.067 70.84
$-GlcNAc-5 3.057b 70.70b 3.073 70.85 3.067 76.51
$-GlcNAc-6 3.722 60.99 3.740 61.29 3.715 61.31
$-GlcNAc-6' 3.462 60.99 3.480 61.29 3.462 61.31
$-GlcNAc(CH3) 1.787 22.73 1.796 22.68 1.792 22.75
$-GlcNAc(NH) 7.808 - 7.768 - 7.821 -
$-GlcNAc(CO) - 169.27 - - 169.77
$-GlcNAc-3OH 5.063c - 4.928 - f -
$-GlcNAc-4OH 5.003c - 4.971 - f -
$-GlcNAc-6OH 4.343 - 4.239 - f -
"-MurNAc-1 5.117 89.59 5.119 89.56 5.091 89.71
"-MurNAc-2 3.477 52.38 3.488 53.99 3.502 53.99
"-MurNAc-3 3.401 74.95 3.395 75.03 3.527 71.04
"-MurNAc-4 3.672 75.67 3.683 75.66 3.425d 74.96d
"-MurNAc-5 3.506 70.93 3.533 71.04 3.670d 75.67d
"-MurNAc-6 3.602 59.32 3.603 59.38 3.583 59.53
"-MurNAc-6' 3.532 59.32 3.550 59.38 3.539 59.53
"-MurNAc-1OH 6.596 - 6.517 - -
"-MurNAc(CH3) 1.804 22.73 1.807 22.68 1.805 22.75
"-MurNAc(NH) 8.454 - 8.395 - 8.423 -
"-MurNAc(CO) - 169.27 - 169.31 - 169.77
"-MurNAc-6OH 4.610 - 4.570 -
D-Lac-" 4.462 75.42 4.470 75.38 4.454 75.40
D-Lac-$ 1.270 19.17 1.262 19.09 1.253 19.05
D-Lac-CO - 174.40 - e - 174.79
128

L-Ala1-NH 8.026 - 7.961 - 8.088 -
L-Ala1-" 4.351 48.14 4.349 48.10 4.329 48.26
L-Ala1-$ 1.241 18.03 1.233 18.05 1.241 18.11
L-Ala1-CO - 172.20 - 172.19 - 172.61
D-iGln2-NH 8.293 - 8.240 - 8.333 -
D-iGln2-" 4.137 51.93 4.147 51.997 4.115 52.40
D-iGln2-"CO - 173.15 - 173.04
D-iGln2-NH2E 7.355 - 7.289 - 7.359 -
D-iGln2-NH2Z 7.008 - 6.956 - 7.016 -
D-iGln2-$ 1.711 27.35 1.935 27.55 1.996 27.21
D-iGln2-$' 2.004 27.35 1.709 27.55 1.709 27.21
D-iGln2-(,(' 2.183 31.51 2.144 31.48 2.172 31.38
D-iGln2-*CO - 171.67 - 171.67 -
m-Dap3-NH 7.969 - 7.998 - 7.857 -
m-Dap3-" 4.174 53.09 4.161 52.50 4.115 52.40
m-Dap3-αCO - 171.11 - 171.14 -
m-Dap3-$ 1.634 31.63 1.589 31.34 1.533 31.31
m-Dap3-$' 1.577 31.63 1.471 31.34 1.586 31.31
m-Dap3-( 1.413 20.83 1.302 21.64 1.134 21.40
m-Dap3-(' 1.350 20.83 1.216 21.64 1.110 21.40
m-Dap3-* 1.669 32.20 1.895 27.83 1.615 31.13
m-Dap3-*' 1.555 32.20 1.895 27.83 1.373 31.13
m-Dap3-ε 3.489 53.79 4.133 51.89 4.012 52.04
m-Dap3-εCO - e - 173.80 - 172.96
m-Dap3-εCONH2E 8.107 - 7.248 - 7.355 -
m-Dap3-εCONH2Z 7.287 - 6.912 - 6.938 -
m-Dap3-εNH 7.878 - 7.647 - 8.073 -
Ad- CH2-CO - - - 169.66 - -
Ad-CH2(") - - 1.879 49.42 - -
129
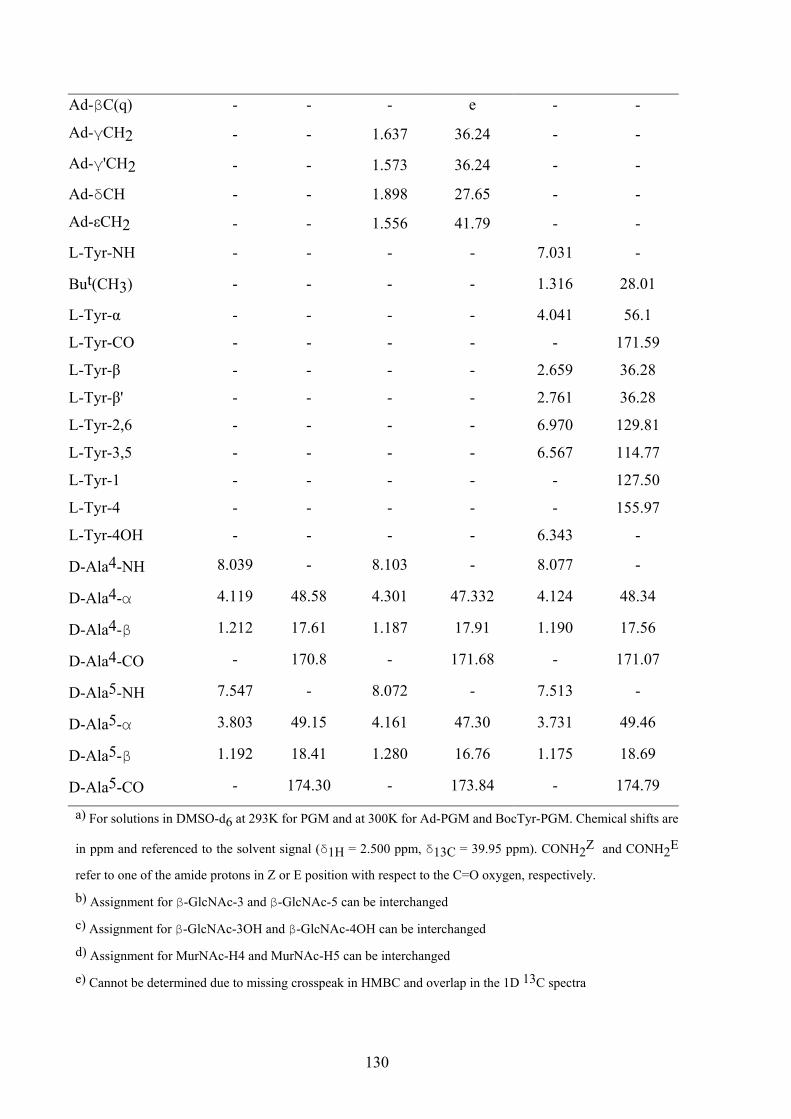
Ad-$C(q) - - - e - -
Ad-(CH2 - - 1.637 36.24 - -
Ad-('CH2 - - 1.573 36.24 - -
Ad-*CH - - 1.898 27.65 - -
Ad-εCH2 - - 1.556 41.79 - -
L-Tyr-NH - - - - 7.031 -
But(CH3) - - - - 1.316 28.01
L-Tyr-α - - - - 4.041 56.1
L-Tyr-CO - - - - - 171.59
L-Tyr-β - - - - 2.659 36.28
L-Tyr-β' - - - - 2.761 36.28
L-Tyr-2,6 - - - - 6.970 129.81
L-Tyr-3,5 - - - - 6.567 114.77
L-Tyr-1 - - - - - 127.50
L-Tyr-4 - - - - - 155.97
L-Tyr-4OH - - - - 6.343 -
D-Ala4-NH 8.039 - 8.103 - 8.077 -
D-Ala4-" 4.119 48.58 4.301 47.332 4.124 48.34
D-Ala4-$ 1.212 17.61 1.187 17.91 1.190 17.56
D-Ala4-CO - 170.8 - 171.68 - 171.07
D-Ala5-NH 7.547 - 8.072 - 7.513 -
D-Ala5-" 3.803 49.15 4.161 47.30 3.731 49.46
D-Ala5-$ 1.192 18.41 1.280 16.76 1.175 18.69
D-Ala5-CO - 174.30 - 173.84 - 174.79
a) For solutions in DMSO-d6 at 293K for PGM and at 300K for Ad-PGM and BocTyr-PGM. Chemical shifts are
in ppm and referenced to the solvent signal (*1H = 2.500 ppm, *13C = 39.95 ppm). CONH2Z and CONH2E
refer to one of the amide protons in Z or E position with respect to the C=O oxygen, respectively.
b) Assignment for $-GlcNAc-3 and $-GlcNAc-5 can be interchanged
c) Assignment for $-GlcNAc-3OH and $-GlcNAc-4OH can be interchanged
d) Assignment for MurNAc-H4 and MurNAc-H5 can be interchanged
e) Cannot be determined due to missing crosspeak in HMBC and overlap in the 1D 13C spectra
130
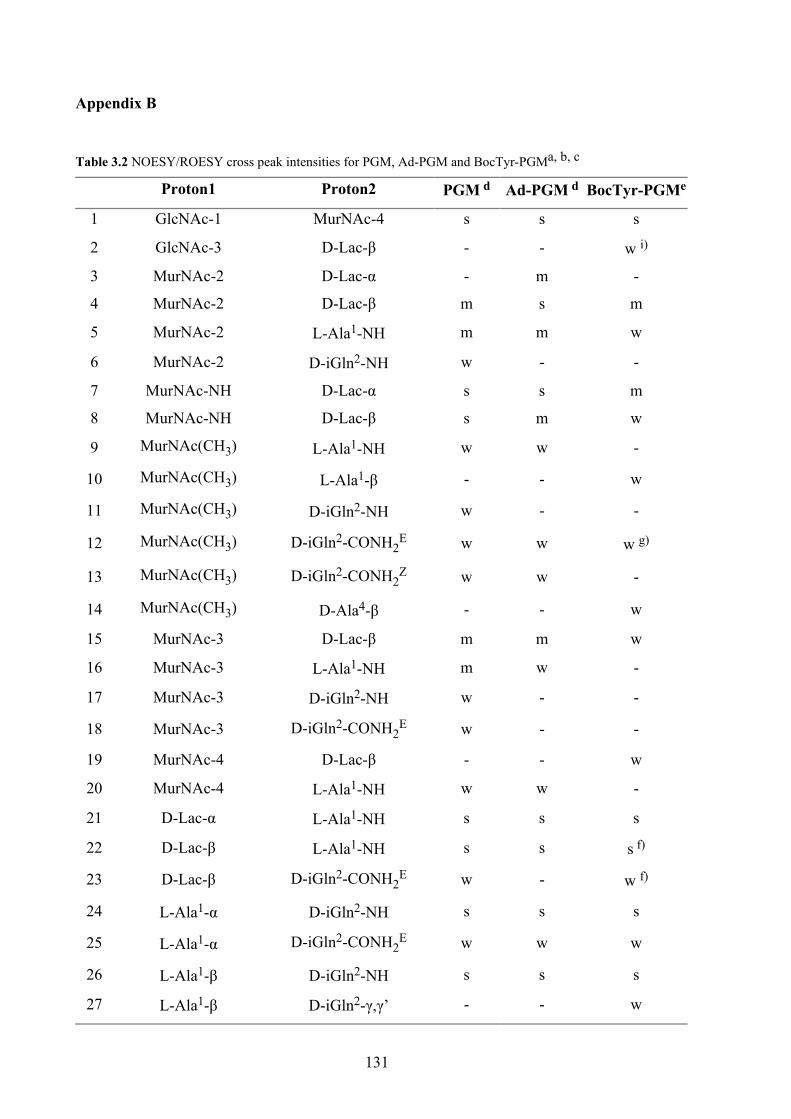
Appendix B
Table 3.2 NOESY/ROESY cross peak intensities for PGM, Ad-PGM and BocTyr-PGMa, b, c
Proton1 Proton2 PGM d Ad-PGM d BocTyr-PGMe
1 GlcNAc-1 MurNAc-4 s s s
2 GlcNAc-3 D-Lac-β - - w i)
3 MurNAc-2 D-Lac-α - m -
4 MurNAc-2 D-Lac-β m s m
5 MurNAc-2 L-Ala1-NH m m w
6 MurNAc-2 D-iGln2-NH w - -
7 MurNAc-NH D-Lac-α s s m
8 MurNAc-NH D-Lac-β s m w
9 MurNAc(CH3) L-Ala1-NH w w -
10 MurNAc(CH3) L-Ala1-β - - w
11 MurNAc(CH3) D-iGln2-NH w - -
12 MurNAc(CH3) D-iGln2-CONH2E w w w g)
13 MurNAc(CH3) D-iGln2-CONH2Z w w -
14 MurNAc(CH3) D-Ala4-β - - w
15 MurNAc-3 D-Lac-β m m w
16 MurNAc-3 L-Ala1-NH m w -
17 MurNAc-3 D-iGln2-NH w - -
18 MurNAc-3 D-iGln2-CONH2E w - -
19 MurNAc-4 D-Lac-β - - w
20 MurNAc-4 L-Ala1-NH w w -
21 D-Lac-α L-Ala1-NH s s s
22 D-Lac-β L-Ala1-NH s s s f)
23 D-Lac-β D-iGln2-CONH2E w w f)
24 L-Ala1-α D-iGln2-NH s s s
25 L-Ala1-α D-iGln2-CONH2E w w w
26 L-Ala1-β D-iGln2-NH s s s
27 L-Ala1-β D-iGln2-γ,γ’ - - w
-
131
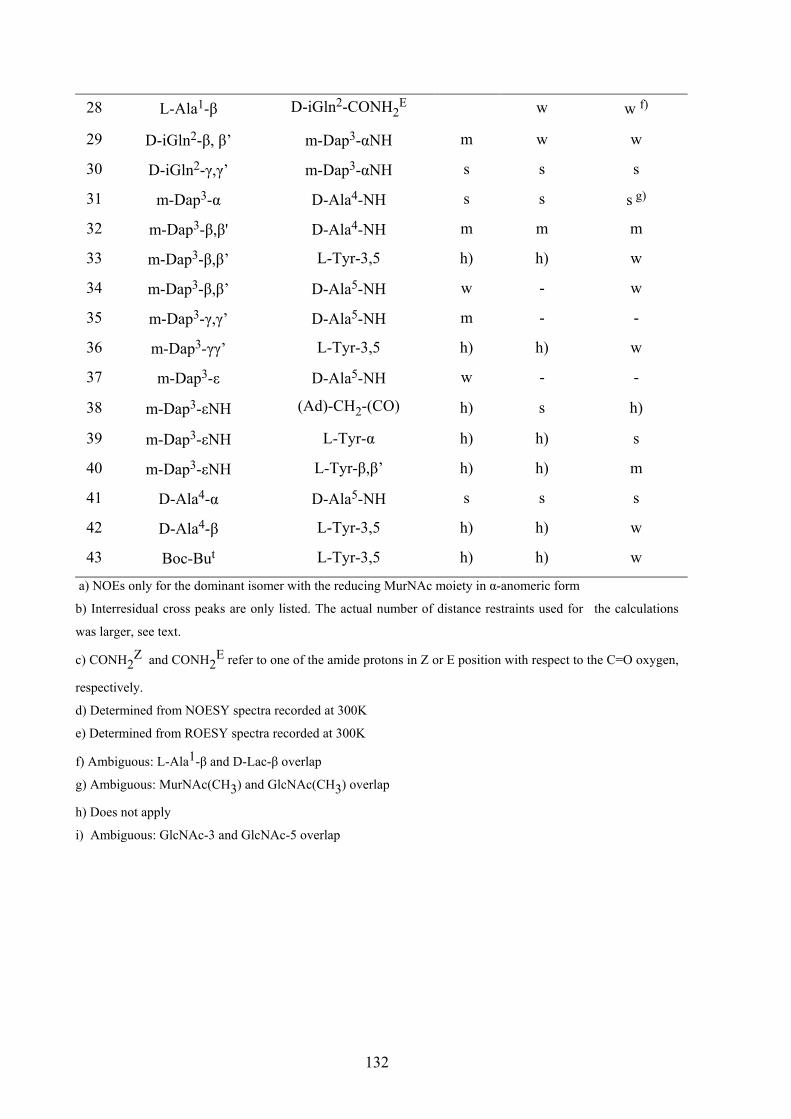
28 L-Ala1-β D-iGln2-CONH2E w w f)
29 D-iGln2-β, β’ m-Dap3-αNH m w w
30 D-iGln2-γ,γ’ m-Dap3-αNH s s s
31 m-Dap3-α D-Ala4-NH s s s g)
32 m-Dap3-β,β' D-Ala4-NH m m m
33 m-Dap3-β,β’ L-Tyr-3,5 h) h) w
34 m-Dap3-β,β’ D-Ala5-NH w - w
35 m-Dap3-γ,γ’ D-Ala5-NH m - -
36 m-Dap3-γγ’ L-Tyr-3,5 h) h) w
37 m-Dap3-ε D-Ala5-NH w - -
38 m-Dap3-εNH (Ad)-CH2-(CO) h) s h)
39 m-Dap3-εNH L-Tyr-α h) h) s
40 m-Dap3-εNH L-Tyr-β,β’ h) h) m
41 D-Ala4-α D-Ala5-NH s s s
42 D-Ala4-β L-Tyr-3,5 h) h) w
43 Boc-But L-Tyr-3,5 h) h) w
a) NOEs only for the dominant isomer with the reducing MurNAc moiety in α-anomeric form
b) Interresidual cross peaks are only listed. The actual number of distance restraints used for the calculations
was larger, see text.
c) CONH2Z and CONH2
E refer to one of the amide protons in Z or E position with respect to the C=O oxygen,
respectively.
d) Determined from NOESY spectra recorded at 300K
e) Determined from ROESY spectra recorded at 300K
f) Ambiguous: L-Ala1-β and D-Lac-β overlap
g) Ambiguous: MurNAc(CH3) and GlcNAc(CH3) overlap
h) Does not apply
i) Ambiguous: GlcNAc-3 and GlcNAc-5 overlap
132
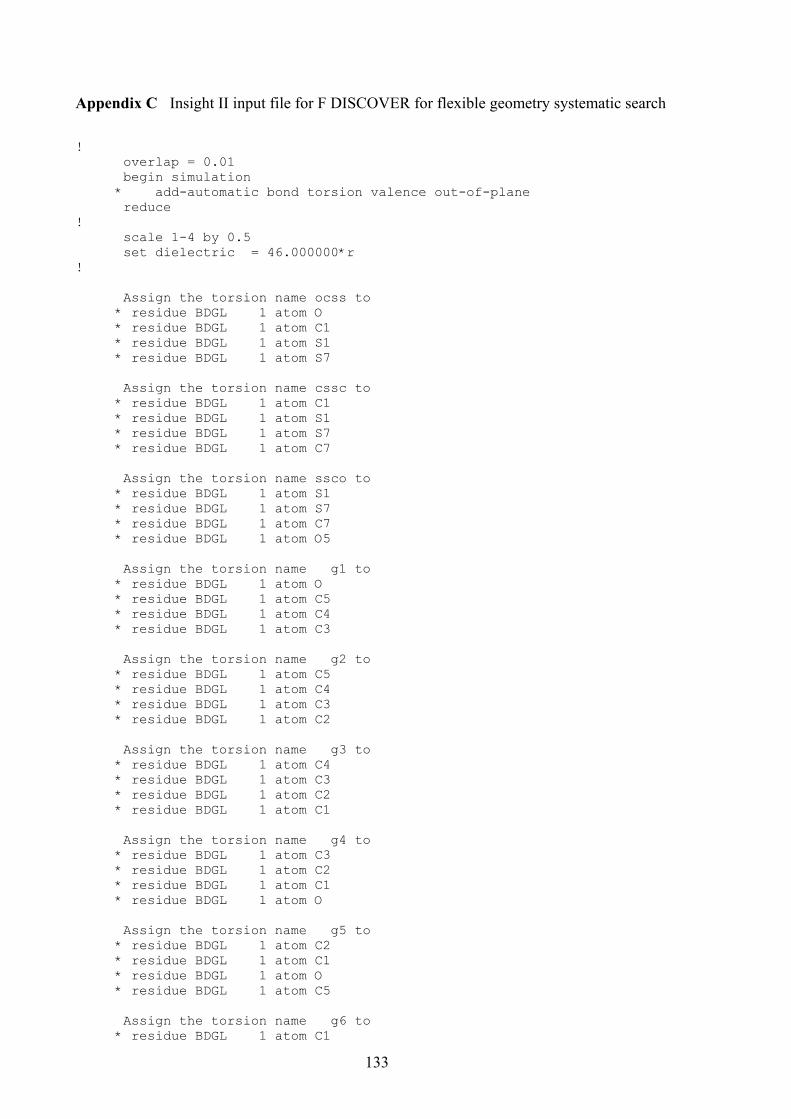
Appendix C Insight II input file for F DISCOVER for flexible geometry systematic search
! overlap = 0.01 begin simulation * add-automatic bond torsion valence out-of-plane reduce ! scale 1-4 by 0.5 set dielectric = 46.000000*r ! Assign the torsion name ocss to * residue BDGL 1 atom O * residue BDGL 1 atom C1 * residue BDGL 1 atom S1 * residue BDGL 1 atom S7 Assign the torsion name cssc to * residue BDGL 1 atom C1 * residue BDGL 1 atom S1 * residue BDGL 1 atom S7 * residue BDGL 1 atom C7 Assign the torsion name ssco to * residue BDGL 1 atom S1 * residue BDGL 1 atom S7 * residue BDGL 1 atom C7 * residue BDGL 1 atom O5 Assign the torsion name g1 to * residue BDGL 1 atom O * residue BDGL 1 atom C5 * residue BDGL 1 atom C4 * residue BDGL 1 atom C3 Assign the torsion name g2 to * residue BDGL 1 atom C5 * residue BDGL 1 atom C4 * residue BDGL 1 atom C3 * residue BDGL 1 atom C2 Assign the torsion name g3 to * residue BDGL 1 atom C4 * residue BDGL 1 atom C3 * residue BDGL 1 atom C2 * residue BDGL 1 atom C1 Assign the torsion name g4 to * residue BDGL 1 atom C3 * residue BDGL 1 atom C2 * residue BDGL 1 atom C1 * residue BDGL 1 atom O Assign the torsion name g5 to * residue BDGL 1 atom C2 * residue BDGL 1 atom C1 * residue BDGL 1 atom O * residue BDGL 1 atom C5 Assign the torsion name g6 to * residue BDGL 1 atom C1
133
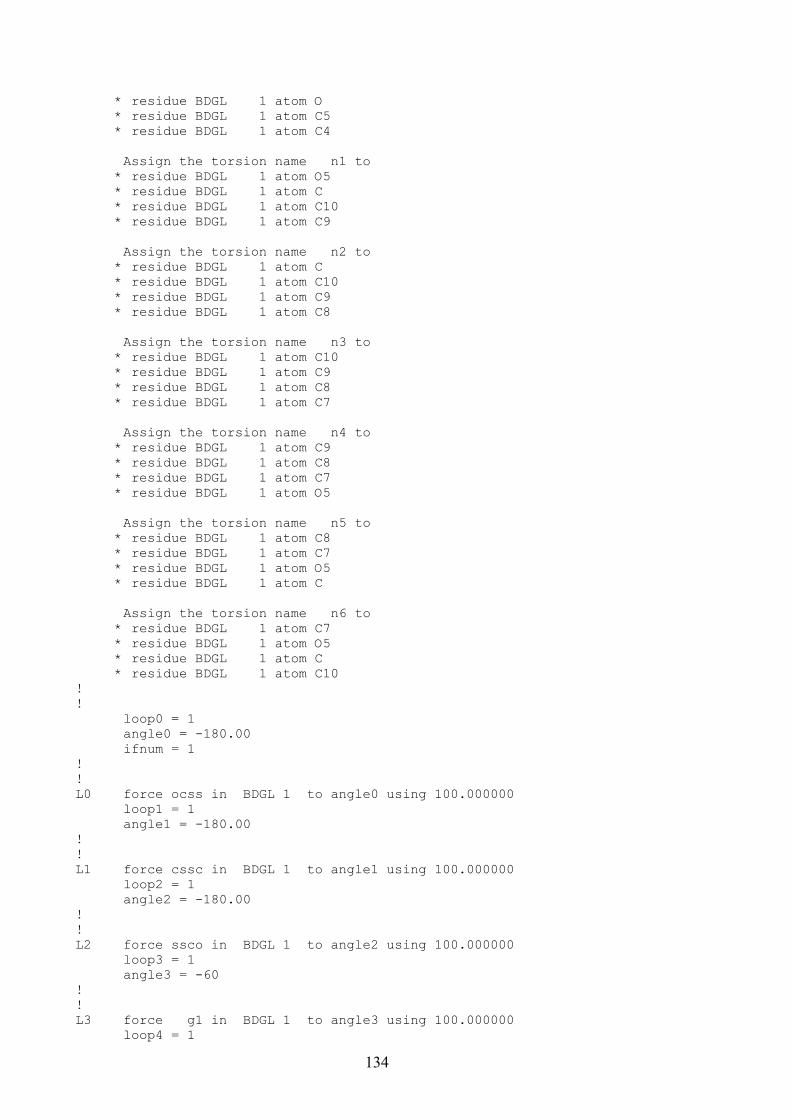
* residue BDGL 1 atom O * residue BDGL 1 atom C5 * residue BDGL 1 atom C4 Assign the torsion name n1 to * residue BDGL 1 atom O5 * residue BDGL 1 atom C * residue BDGL 1 atom C10 * residue BDGL 1 atom C9 Assign the torsion name n2 to * residue BDGL 1 atom C * residue BDGL 1 atom C10 * residue BDGL 1 atom C9 * residue BDGL 1 atom C8 Assign the torsion name n3 to * residue BDGL 1 atom C10 * residue BDGL 1 atom C9 * residue BDGL 1 atom C8 * residue BDGL 1 atom C7 Assign the torsion name n4 to * residue BDGL 1 atom C9 * residue BDGL 1 atom C8 * residue BDGL 1 atom C7 * residue BDGL 1 atom O5 Assign the torsion name n5 to * residue BDGL 1 atom C8 * residue BDGL 1 atom C7 * residue BDGL 1 atom O5 * residue BDGL 1 atom C Assign the torsion name n6 to * residue BDGL 1 atom C7 * residue BDGL 1 atom O5 * residue BDGL 1 atom C * residue BDGL 1 atom C10 ! ! loop0 = 1 angle0 = -180.00 ifnum = 1 ! ! L0 force ocss in BDGL 1 to angle0 using 100.000000 loop1 = 1 angle1 = -180.00 ! ! L1 force cssc in BDGL 1 to angle1 using 100.000000 loop2 = 1 angle2 = -180.00 ! ! L2 force ssco in BDGL 1 to angle2 using 100.000000 loop3 = 1 angle3 = -60 ! ! L3 force g1 in BDGL 1 to angle3 using 100.000000 loop4 = 1
134
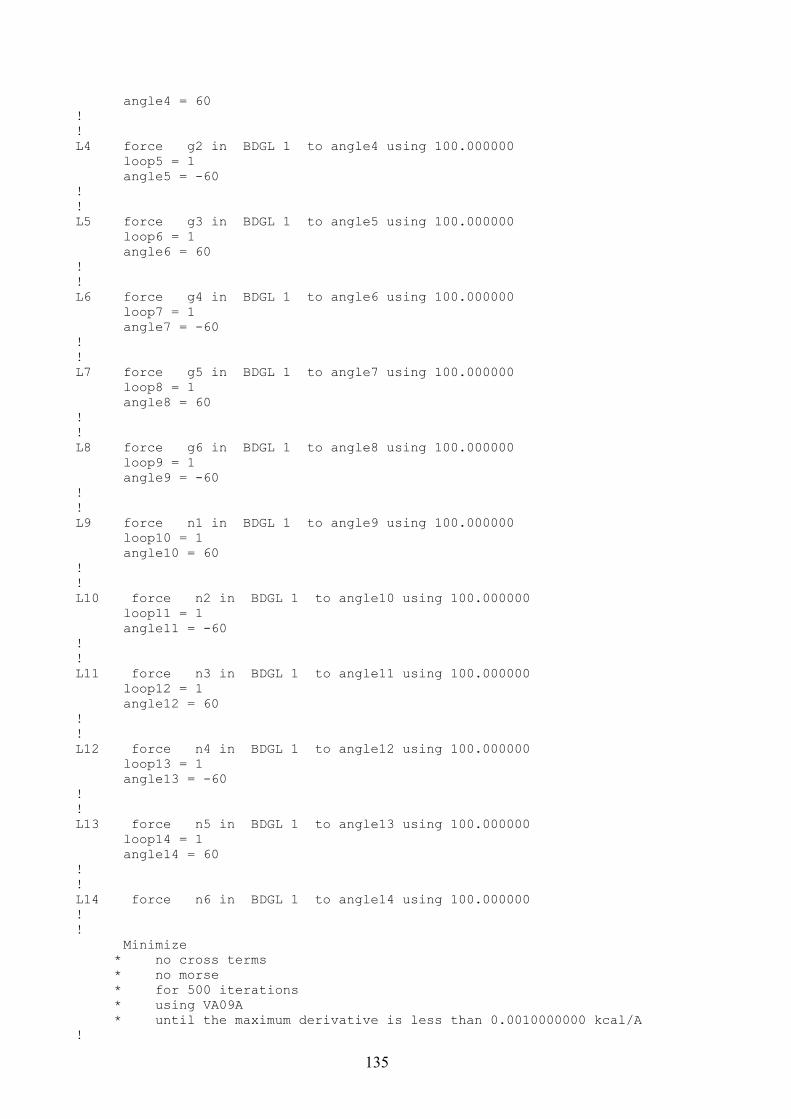
angle4 = 60 ! ! L4 force g2 in BDGL 1 to angle4 using 100.000000 loop5 = 1 angle5 = -60 ! ! L5 force g3 in BDGL 1 to angle5 using 100.000000 loop6 = 1 angle6 = 60 ! ! L6 force g4 in BDGL 1 to angle6 using 100.000000 loop7 = 1 angle7 = -60 ! ! L7 force g5 in BDGL 1 to angle7 using 100.000000 loop8 = 1 angle8 = 60 ! ! L8 force g6 in BDGL 1 to angle8 using 100.000000 loop9 = 1 angle9 = -60 ! ! L9 force n1 in BDGL 1 to angle9 using 100.000000 loop10 = 1 angle10 = 60 ! ! L10 force n2 in BDGL 1 to angle10 using 100.000000 loop11 = 1 angle11 = -60 ! ! L11 force n3 in BDGL 1 to angle11 using 100.000000 loop12 = 1 angle12 = 60 ! ! L12 force n4 in BDGL 1 to angle12 using 100.000000 loop13 = 1 angle13 = -60 ! ! L13 force n5 in BDGL 1 to angle13 using 100.000000 loop14 = 1 angle14 = 60 ! ! L14 force n6 in BDGL 1 to angle14 using 100.000000 ! ! Minimize * no cross terms * no morse * for 500 iterations * using VA09A * until the maximum derivative is less than 0.0010000000 kcal/A !
135
! archive as file number ifnum ifnum = ifnum + 1 ! ! R0 loop14 = loop14 + 1 angle14 = angle14 + 0.00 if loop14 .le. 1 then L14 loop13 = loop13 + 1 angle13 = angle13 + 0.00 if loop13 .le. 1 then L13 loop12 = loop12 + 1 angle12 = angle12 + 0.00 if loop12 .le. 1 then L12 loop11 = loop11 + 1 angle11 = angle11 + 0.00 if loop11 .le. 1 then L11 loop10 = loop10 + 1 angle10 = angle10 + 0.00 if loop10 .le. 1 then L10 loop9 = loop9 + 1 angle9 = angle9 + 0.00 if loop9 .le. 1 then L9 loop8 = loop8 + 1 angle8 = angle8 + 0.00 if loop8 .le. 1 then L8 loop7 = loop7 + 1 angle7 = angle7 + 0.00 if loop7 .le. 1 then L7 loop6 = loop6 + 1 angle6 = angle6 + 0.00 if loop6 .le. 1 then L6 loop5 = loop5 + 1 angle5 = angle5 + 0.00 if loop5 .le. 1 then L5 loop4 = loop4 + 1 angle4 = angle4 + 0.00 if loop4 .le. 1 then L4 loop3 = loop3 + 1 angle3 = angle3 + 0.00 if loop3 .le. 1 then L3 loop2 = loop2 + 1 angle2 = angle2 + 10.00 if loop2 .le. 37 then L2 loop1 = loop1 + 1 angle1 = angle1 + 10.00 if loop1 .le. 37 then L1 loop0 = loop0 + 1 angle0 = angle0 + 10.00 if loop0 .le. 37 then L0 ! ! end
136
Appendix D Insight II input file for F DISCOVER for simulated annealing ! Simulated Annealing Protocol ! overlap = 0.01 ! Change the next line to the cutoff value that you want to use: cutoff = 100.000000 ! cutdis = cutoff - 1 cutdis = 100.000000 ! swtdis is always 1.5 swtdis = 1.5 ! timtmp is the exponential rate constant during ! the "Initialize dynamics" and "resume dynamics" steps. ! Default timtmp = 0.1 ! For the initial heating, we usually do this fairly quickly and ! establish equilibrium, so we don't change TIMTMP when initializing ! dynamics. ! Uncomment and edit the next line if you want to change this. ! timtmp = 0.1 ! begin simulation * add-automatic bond torsion valence out-of-plane reduce ! scale 1-4 by 0.5 ! Change the dielectric constant to the value you want to use. ! distance-dependent dielectrics: set dielectric = 1.0*r set dielectric = 46.000000*r ! ! ! First minimization to reduce very high energies. ! If you want charges, delete the "and no charges" line. Minimize * no cross terms * no morse * for 100 iterations * using steep descents * until the maximum derivative is less than 10.000000001 kcal/A ! ! ! Second minimization to drive to a low minimum. ! We don't need to minimize REALLY low, since we are about to ! heat up the molecule. ! If you want charges, delete the "and no charges" line. ! If you have > 200 nin-fixed atoms, change "VA09A" to ! "conjugate gradient". Minimize * no cross terms * no morse * for 5000 iterations * using VA09A * until the maximum derivative is less than 1.000000001 kcal/A ! ! ! The "for ### iterations" line specifies the number of ! fsec for heating and equilibration. ! Change the temperature to suit your molecule. If ! your molecule is restrained (e.g., rings, ! double bonds, etc), then 1000-1500K is usually good. ! If your molecule is unconstrained, 600-1000K is good. ! Steps of 1 fsec are required. ! Set timtmp to 6* the time over which the temperature will change.
137
! This results in a final temperature within 1.5% of your final ! temperature. According to the manual, "the temperature difference ! between the initial and final temperature is 1/2 of the initial ! difference after TIMTMP". ! See also the TIMTMP note at the beginning of this file. timtmp = 1.0 ! If you want charges, delete the "and no charges" line. ! The "write history" line reduces the history file output, which is ! highly recommended unless you want to restart the calculation if it fails. initialize dynamics * write history file every 9000000 steps * for 5000 iterations * at 1000.000 K * steps of 1.000 * no cross terms * no morse ! ! ! Dynamics Loop ! ifile = 1 ! ! ! The next line specifies how many fsec to run the dynamics ! before cooling the structure. ! Also includes the heating step for each iteration ! If you want charges, delete the "and no charges" line. ! See also the TIMTMP note at the beginning of this file. loop timtmp = 1.0 resume dynamics * for 5000 iterations * at 1000.000 K * no cross terms * no morse ! * and no charges ! The next lines specify how many fsec to cool the dynamics ! before minimizing the structure. ! The cooling occurs for ~1 psec, with an exponential decay ! to the final temperature. ! If you want charges, delete the "and no charges" line. ! See also the TIMTMP note at the beginning of this file. timtmp = 1.0 ! You can also repeat this step, in order to cool to an intermediate ! temperature, then a final temperature. ! resume dynamics * for 5000 iterations * at 300.000 K * steps of 1.000 * no cross terms * no morse ! ! ! First minimization to reduce very high energies. ! If you want charges, delete the "and no charges" line. Minimize * no cross terms * no morse * for 500 iterations * using steep descents * until the maximum derivative is less than 10.000000000 kcal/A !
138
! ! Second minimization to drive to a low minimum. ! Adjust the "maximum derivative is less than ###" ! number to suit the level of minimization you require. ! If you have > 200 atoms, change "VA09A" to ! "conjugate gradient". ! If you want charges, delete the "and no charges" line. Minimize * no cross terms * no morse * for 5000 iterations * using VA09A * until the maximum derivative is less than 0.001000001 kcal/A ! ! Record Results ! print energy summary archive as file number ifile ifile = ifile + 1 ! ! ! The next line specifies how many fsec to heat the structure ! back to the dynamics temperature. ! See also the TIMTMP note at the beginning of this file. timtmp = 1.0 ! If you want charges, delete the "and no charges" line. resume dynamics * for 5000 iterations * at 1000.000 K * no cross terms * no morse ! ! Change the number below (currently 1000) to the number ! of structures you want to calculate if ifile .le. 1000 then loop ! print timings
END
139

Appendix E 2D crosssection of the 3D potential energy surface for the Glc-S-S-Man
derivative. The crosssections were created by slicing the 3D surface with a plane
perpendicular to the axis of the torsion angle that is held constant.
a) φ (Oring-C1-S-S) is
held constant at 300o
b) ω (C1-S-S-C1) is held
constant at 109o
c) φ (C1-S-S-Oring) is held
constant at 300o
a) φ (Oring-C1-S-S)= 300o 0
100
200
300
050100150200250300350-10
0
10
20
30
40
50
phi (S-S-C-O)C-S-S-C
Eto
t (kc
al/m
ol)
at ω (C1-S-S-C1) = 109o0
100
200
300
050100150200250300350-10
0
10
20
30
40
50
phi (S-S-C-O)phi (O-C-S-S)
Eto
t (kc
al/m
ol)
at φ (C1-S-S-Oring) = 300o 0 50 100 150 200 250 300 350
0
100
200
300
-10
0
10
20
30
40
50
omega (C-S-S-C)phi (O-C-S-S)
Eto
t (kc
al/m
ol)
140
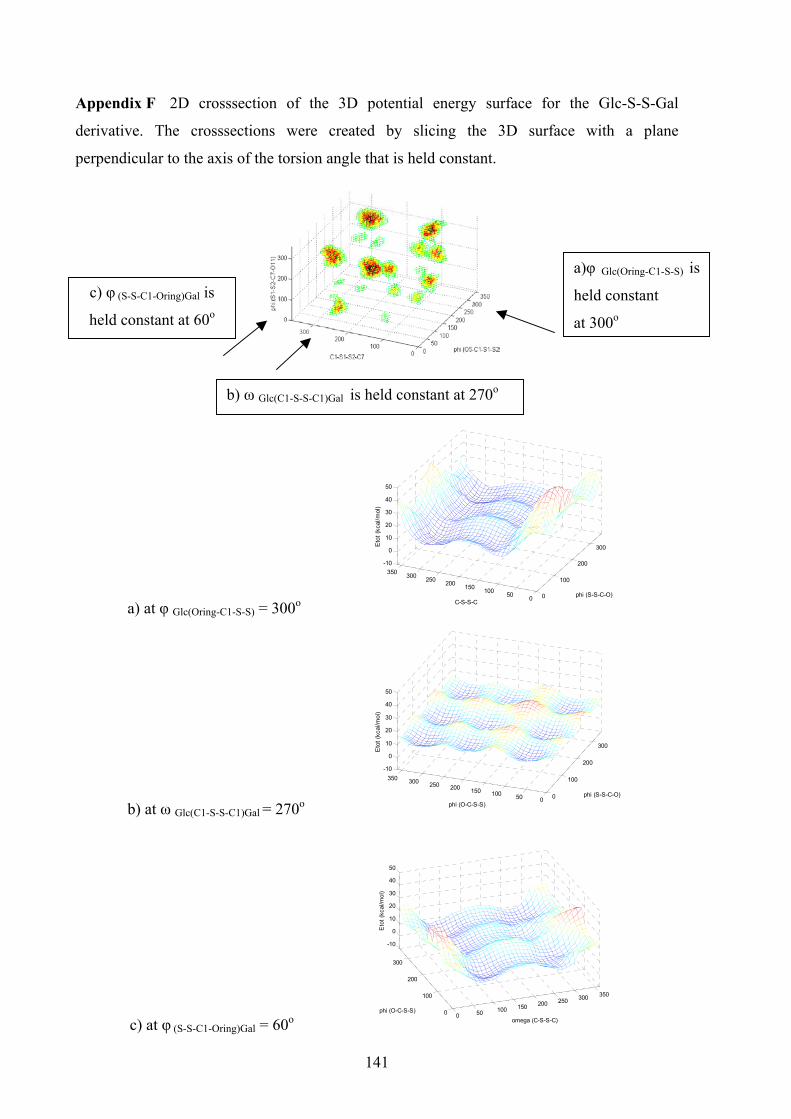
Appendix F 2D crosssection of the 3D potential energy surface for the Glc-S-S-Gal
derivative. The crosssections were created by slicing the 3D surface with a plane
perpendicular to the axis of the torsion angle that is held constant.
a) at φ Glc(Oring-C1-S-S) = 300o 0
10
050100150200250300350-10
0
10
20
30
40
50
C-S-S-C
Eto
t (kc
al/m
ol)
b) at ω Glc(C1-S-S-C1)Gal = 270o 0050100150200250300350
-10
0
10
20
30
40
50
phi (O-C-S-S)
Eto
t (kc
al/m
ol)
c) at φ (S-S-C1-Oring)Gal = 60o 0 50 100 150 200 250
0
100
200
300
-10
0
10
20
30
40
50
omega (C-S-S-C)phi (O-C-S-S)
Eto
t (kc
al/m
ol)
141
a)φ Glc(Oring-C1-S-S) is
held constant
at 300o
b) ω Glc(C1-S-S-C1)Gal is held constant at 270o
c) φ (S-S-C1-Oring)Gal is
held constant at 60o
0
200
300
phi (S-S-C-O)
100
200
300
phi (S-S-C-O)
300 350
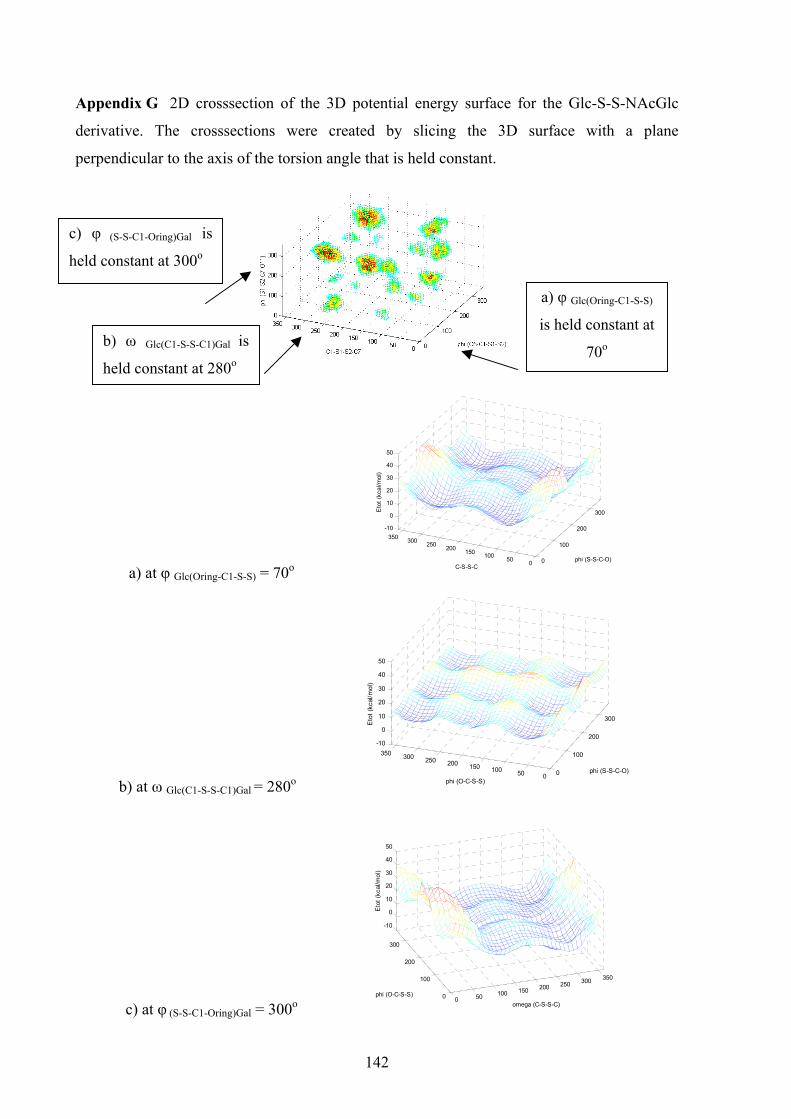
142
Appendix G 2D crosssection of the 3D potential energy surface for the Glc-S-S-NAcGlc
derivative. The crosssections were created by slicing the 3D surface with a plane
perpendicular to the axis of the torsion angle that is held constant.
a) at φ Glc(Oring-C1-S-S) = 70o 050100150200250300350
-10
0
10
20
30
40
50
C-S-S-C
Eto
t (kc
al/m
ol)
b) at ω Glc(C1-S-S-C1)Gal = 280o 50100150200250300350
-10
0
10
20
30
40
50
phi (O-C-S-S)
Eto
t (kc
al/m
ol)
c) at φ (S-S-C1-Oring)Gal = 300o 0 50 100 150
0
100
200
300
-10
0
10
20
30
40
50
omega phi (O-C-S-S)
Eto
t (kc
al/m
ol)
a) φ Glc(Oring-C1-S-S)
is held constant at
70o
b) ω Glc(C1-S-S-C1)Gal isheld constant at 280o
c) φ (S-S-C1-Oring)Gal is
held constant at 300o
0
100
200
300
phi (S-S-C-O)
0
100
200
300
0phi (S-S-C-O)
200 250 300 350
(C-S-S-C)

STUDIES OF CARBOHYDRATES AND PEPTIDES BY NMR SPECTROSCOPY AND MOLECULAR
MODELLING
Értekezés a doktori (Ph.D.) fokozat megszerzése érdekében
kémia tudományágban
Írta: Fehér Krisztina
okleveles vegyész, angol-magyar szakforditó
Készült a Debreceni Egyetem Kémia doktori iskolája
Heterociklusos vegyületek programja keretében
Témavezető: Dr. Szilágyi László
A doktori szigorlati bizottság:
elnök: Dr. Antus Sándor ........................................................
tagok: Dr. Perczel András ........................................................
Dr. Dinya Zoltán ........................................................
A doktori szigorlat időpontja: Az értekezés bírálói:
................................................... ........................................................
................................................... ........................................................
A bírálóbizottság:
elnök: ................................................... ........................................................
tagok: ................................................... ........................................................
................................................... ........................................................
................................................... ........................................................
Az értekezés védésének időpontja:
143

144