large-scale sap businessobjectsâ„¢ bi 4 platform deployment over
TRANSCRIPT
White Paper SAP Co-Innovation Lab
.
LARGE-SCALE SAP®
BUSINESSOBJECTS™ BI 4
PLATFORM DEPLOYMENT OVER SAP SYBASE®
ASE
AND SAP SYBASE IQ DATABASES
OPTIMAL SIZING AND CONFIGURATION FOR UP TO 10,000 CONCURRENT USERS
Editors
Jay Thoden van Velzen
David Cruickshank
Dhimant Chokshi
Abhay Kale
Jacques Buchholz
Kevin Liu
Henri Kong
Veronique L’Helguen Smahi
September 2012
Version 1.0
Large-Scale SAP BusinessObjects BI 4 Platform Deployment on SAP Sybase ASE and SAP Sybase IQ Databases 2
Acknowledgements
This document is the work of a virtual project team at SAP Co-Innovation Lab with members from multiple companies:
F5: Craig Hovey, Marcel Noyes, Matt Quill, Mike Schrock Intel: Scott Allen Red Hat: Christine Puccio, Sherry Yu SAP: Jacques Buchholz, Dhimant Chokshi, Johnny Chow, Mike Crocker, David Cruickshank, Abhay Kale, Henri Kong, Veronique L'Helguen Smahi, Kevin Liu, Roehl Obaldo, Bill Sullivan, Jay Thoden van Velzen, Andrew Valega, Corey Wilkie SOASTA: Kenneth Holcomb, Robert Holcomb, Dave Pachla, Ed Salazar, Corey Walsh, Brad Johnson Supermicro: Kanti Bhabuthmal, Gloria Sun
The project team would like to thank the members of the SAP Co-Innovation Lab data center team and all the colleagues from various SAP groups and the participating companies who have helped with the design and execution of this project.
Large-Scale SAP BusinessObjects BI 4 Platform Deployment on SAP Sybase ASE and SAP Sybase IQ Databases 3
Content
1 Introduction .................................................................................................................................................... 4
2 Goals and Objectives .................................................................................................................................... 4
3 Testing Approach........................................................................................................................................... 6 3.1 Intelligence tier scaling to 10,000 concurrent users ......................................................................................... 6 3.2 Confirming successful operation at lower usage levels ................................................................................... 7 3.3 Expanding to 10,000 concurrent users .......................................................................................................... 10 3.4 Consolidation of the environment .................................................................................................................. 11
4 Test Scenario................................................................................................................................................ 17
5 Performance Results ................................................................................................................................... 20
6 Hardware Infrastructure .............................................................................................................................. 22 6.1 Single rack configuration ................................................................................................................................ 22 6.2 BI 4 platform single-rack test environment .................................................................................................... 23
7 BI 4 Platform Best Practices ....................................................................................................................... 23 7.1 BI platform ...................................................................................................................................................... 23 7.2 Tomcat ........................................................................................................................................................... 24 7.3 A small note on setting start-up Java heap size (-Xms) ................................................................................ 26
8 SAP BusinessObjects Web Intelligence Configuration Best Practices ................................................. 26
9 BI Platform Sizing Verification .................................................................................................................... 28
10 SAP Sybase ASE Best Practices ................................................................................................................ 30 10.1 Configuration and tuning ................................................................................................................................ 30
11 SAP Sybase IQ Best Practices ................................................................................................................... 31 11.1 Configuration and tuning ................................................................................................................................ 31
12 Project Management and Administrative Best Practices ........................................................................ 32 12.1 An ecosystem-based approach ..................................................................................................................... 32
13 Conclusion .................................................................................................................................................... 33
Large-Scale SAP BusinessObjects BI 4 Platform Deployment on SAP Sybase ASE and SAP Sybase IQ Databases 4
1 Introduction
This white paper describes the outcome of a project enabled by SAP Co-Innovation Lab to validate the
performance and scalability of a large-scale deployment of the SAP® BusinessObjects™ Business Intelligence
(BI) platform, release 4, capable of sustaining thousands of concurrent users. The SAP BusinessObjects BI
platform and database technologies were configured to run over a standard enterprise-ready open source
operating system from Red Hat (RHEL 6), using enterprise data center–ready Intel® Xeon® processor-based
hardware from Supermicro (TwinBlades and SuperServers) and an application delivery control system from F5.
We generated all of the simulated user traffic with SOASTA CloudTest, affording the project team the flexibility
to dynamically assign load levels and ramp-up, and yet reveal deep insight into the underlying systems,
behaviors, and response times based upon the load generated.
This project took an ecosystem-based approach, allowing the project team to both broadly and deeply examine
the performance of a system designed to support up to 10,000 concurrent users for the BI 4 platform release
where one or more text workflows could be combined with the necessary infrastructure resources necessary to
validate such a large-scale deployment. The tacit knowledge exchange occurring between all project
participants contributed to more thorough testing, clearing bottlenecks and identifying optimal configuration
settings across the stack as well as what constitutes best practices for those responsible for implementing a
large-scale BI 4 platform deployment.
Given the emerging trends in businesses worldwide to tackle “Big Data,” it is becoming imperative not only to
make analysis of extremely large data sets easier for a wider audience of users but additionally to make it
possible for larger and larger numbers of concurrent users to perform data manipulation and analysis without
being inhibited by performance issues or insufficient response times.
2 Goals and Objectives
This project’s goals and objectives for the testing exercise were to show how the SAP BusinessObjects BI
platform could be scaled to user levels not previously seen, and to document the team’s experience for those
interested in deploying larger centralized BI systems. Over the past five or more years, SAP has seen a strong
trend toward centralization of BI systems, as organizations look to rationalize their departmental deployments
and begin to operate more and more internationally as collaboration and comparing data in different
geographies is becoming more common. At the same time, centralization of systems aims to reduce
maintenance, hardware, and software costs associated with running multiple instances around the world.
Additionally, there is an emerging trend where business intelligence is getting more pervasive in organizations,
both in the sense of giving increasingly more individuals access to BI content and of increasing each
individual‘s use of business intelligence. To provide some context to this notion, several years ago, a single
environment might only serve 50, 100, or, perhaps as a high watermark, 200 live concurrent users at any given
time. This number only continues to increase. Reliance upon advanced analytics and key metrics has become
fundamental for many firms today, resulting in more and more end users accessing BI content via an array of
mobile phones and tablets.
Prior to this project, SAP’s largest benchmark on the BI platform (release 3.x) reached 5,000 concurrent users.
The findings are available on SAP Developer Network (SDN), entitled “Architecture and Performance for
Enterprise Business Intelligence: SAP Business Objects XI on the IBM Power6 Stack with Many Users.”
Challenges identified from that study served as the impetus for pursuing this important follow-on project.
When we refer to “concurrent users,” we mean the number of users logged onto the system and sending
requests to the server. In our tests, “concurrent users” refers to the virtual test users making requests onto the
environment every 30 seconds, cycling repeatedly through the test scenario.
Large-Scale SAP BusinessObjects BI 4 Platform Deployment on SAP Sybase ASE and SAP Sybase IQ Databases 5
In order to anticipate current trends as much as possible, for this project we ambitiously doubled that number to
10,000 concurrent users. We did so having no idea what to expect under such conditions. It effectively meant
10,000 users actively using the system: logging in, navigating around the system, and opening, viewing, and
then refreshing reports.
A relatively standard concurrency rate is 10%, but experience shows that with higher user base numbers, the
actual concurrency rate tends to drop to 5%, or even below that – due to 24x7 uptime with users dispersed
around the world, as well as a lower overall rate of business analysts (whose primary job is to do data analysis)
and more “casual” users once we hit the larger numbers. Using the 10% and 5% concurrency rate, though, we
can see that these 10,000 users are equivalent to a total user base of 100,000 to 200,000 or more users.
(100%/10%) = 10 x 10,000 = 100,000 (10% concurrency rate)
(100%/5%) = 20 x 10,000 = 200,000 (5% concurrency rate)
(100%/3%) = 33.33.. x 10,000 = 333,333 (3% concurrency rate)
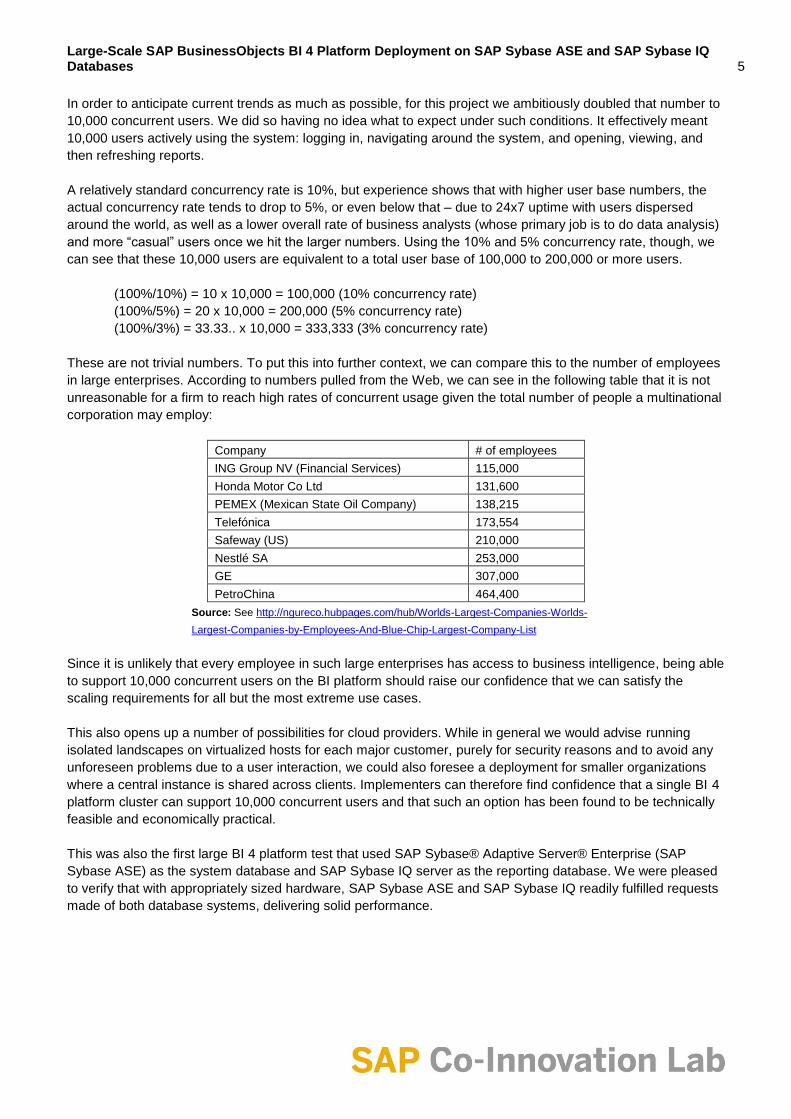
These are not trivial numbers. To put this into further context, we can compare this to the number of employees
in large enterprises. According to numbers pulled from the Web, we can see in the following table that it is not
unreasonable for a firm to reach high rates of concurrent usage given the total number of people a multinational
corporation may employ:
Company # of employees
ING Group NV (Financial Services) 115,000
Honda Motor Co Ltd 131,600
PEMEX (Mexican State Oil Company) 138,215
Telefónica 173,554
Safeway (US) 210,000
Nestlé SA 253,000
GE 307,000
PetroChina 464,400
Source: See http://ngureco.hubpages.com/hub/Worlds-Largest-Companies-Worlds-
Largest-Companies-by-Employees-And-Blue-Chip-Largest-Company-List
Since it is unlikely that every employee in such large enterprises has access to business intelligence, being able
to support 10,000 concurrent users on the BI platform should raise our confidence that we can satisfy the
scaling requirements for all but the most extreme use cases.
This also opens up a number of possibilities for cloud providers. While in general we would advise running
isolated landscapes on virtualized hosts for each major customer, purely for security reasons and to avoid any
unforeseen problems due to a user interaction, we could also foresee a deployment for smaller organizations
where a central instance is shared across clients. Implementers can therefore find confidence that a single BI 4
platform cluster can support 10,000 concurrent users and that such an option has been found to be technically
feasible and economically practical.
This was also the first large BI 4 platform test that used SAP Sybase® Adaptive Server® Enterprise (SAP
Sybase ASE) as the system database and SAP Sybase IQ server as the reporting database. We were pleased
to verify that with appropriately sized hardware, SAP Sybase ASE and SAP Sybase IQ readily fulfilled requests
made of both database systems, delivering solid performance.

Large-Scale SAP BusinessObjects BI 4 Platform Deployment on SAP Sybase ASE and SAP Sybase IQ Databases 6
3 Testing Approach
From the beginning of this project, the team was aware we were treading into territory not previously traversed.
It therefore became imperative for us to ensure we conducted our testing in a structured and systematic way, in
order to uncover any problems as the environment scaled out toward demonstrating a single instance running
10,000 concurrent users. We therefore structured the test in four main steps:
1. Scale the intelligence tier component and its dependencies to handle a 10,000 concurrent user load
2. Confirm successful operation of logon and report viewing, and refresh on lower concurrent user levels
3. Expand the landscape over the available hardware and work toward the 10,000-user goal
4. Consolidate the environment on the least amount of required hardware while still supporting the 10,000
concurrent users
Before actual testing commenced, a number of initial assumptions were assigned based upon the sizing of the
system where the project had secured an overabundance of hardware (allowing for a high number of total
available hosts) so that this would at no point represent a physical constraint. We then adjusted the
configuration as needed to perform all tests.
3.1 Intelligence tier scaling to 10,000 concurrent users
As the overall performance and stability of the SAP BusinessObjects BI 4 platform is highly dependent on the
underlying intelligence tier, the first objective was to scale the intelligence tier – that is, the central management
system (CMS) and its dependencies – to support a 10,000 concurrent user load.
In order to keep the number of dependencies to a minimum, the user load was simulated using core intelligence
tier operations, such as logon, BI launchpad navigation, and logoff, which allowed the focus to be on scaling the
CMS and SAP Sybase ASE repository database.
Large-Scale SAP BusinessObjects BI 4 Platform Deployment on SAP Sybase ASE and SAP Sybase IQ Databases 7
Starting off with two CMS instances each running on dedicated hardware, we systematically scaled up the
number of users, while monitoring the overall response time, system metrics, and resource usage of the
system.
As the existing CMS instance became fully utilized (denoted by an increasing DB queue metric length), our first
option was to vertically scale the existing CMS instances to utilize more of the large amount of hardware
resources available with only a single machine. This was achieved by increasing the number of CMS DB
connections to 125 and increasing the number of CMS CORBA worker threads to 150.
This option should rarely be used in most typical BI 4 platform environments, as simply adding an additional
CMS instance, with the default optimized settings, will be sufficient. This is the recommended approach for
most BI 4 platform deployments and was our next step. We added another CMS instance to the landscape on
dedicated hardware only when it was determined that CMS had become the bottleneck using the wide range of
metrics collected during scaling up the number of users. The load was automatically balanced across the CMS
cluster, with the additional CMS taking on its equal share of requests and providing some breathing room to the
previously overloaded CMS instances.
Similarly, SAP Sybase ASE, which was running on its own dedicated hardware, was closely monitored and
when necessary scaled and tuned to handle increased number of CMS connections/requests and remove any
identified bottlenecks. This involved methodically increasing the number of SAP Sybase ASE engines, as well
as optimizing the performance of some of the CMS queries being executed.
This process was continued until we reached our goal of 10,000 concurrent users, which required using eight
separate CMS instances, all connected up to SAP Sybase ASE, using 20 engines, for the repository database.
Reaching this milestone with the intelligence tier–focused workflow gave us confidence in CMS, SAP Sybase
ASE, and the underlying infrastructure. Having a solid foundation on which to build the processing tier for the
workflow focused on SAP BusinessObjects Web Intelligence software was one of the key factors in making this
project successful. 3.2 Confirming successful operation at lower usage levels
Once the SAP BusinessObjects BI platform team confirmed 10,000 concurrent user sessions as part of the
intelligence tier scaling tests and the number of CMS servers required, we wanted to slowly scale up the end-to-
end test scenario described below in the “Test Scenario” section toward the 10,000 concurrent user goal. We
realized in advance that we needed to perform tuning and optimization by increasing the number of instances of
key components in the landscape as we started to make more demands on the environment, and by closely
monitoring CPU and memory usage to avoid any bottlenecks in the environment.
It cannot be overstated how important it became for the team to develop a rational methodology to add users
incrementally until hitting the target upper bound. Our team established its own methodology as a way to help
explain what we were tracking for each test run (for example, all the resource utilization metrics, internal server
metrics, and performance numbers) and how the team could then use this collected information to examine and
compare throughput and response times across the key components of each tier (such as to narrow down
problems or to validate test runs). This methodology comprised four elements:
1.) Ensure that the system is clean before starting a test
Before the start of any test, the environment is recycled.
BI 4 platform servers are stopped as well as all Tomcat instances prior to the test in order to achieve repeatable
test results.
Large-Scale SAP BusinessObjects BI 4 Platform Deployment on SAP Sybase ASE and SAP Sybase IQ Databases 8
BI 4 platform servers and Tomcat instances are all restarted while monitoring closely via the Central Management
Console (CMC), the admin Web application for the BI 4 platform, to ensure that all components and hosts join the
cluster correctly.
Once all services are started, we run a quick login and report refresh validation to ensure that everything is
operating as expected. No test is started until this has been verified.
2.) Capture vital metrics during test runs
We specifically monitored the following metrics:
Resource utilization (CPU and memory usage, as well as network monitoring)
Throughput per second and number of transactions
Response times for all scenario steps
Internal metrics within the environment, specifically for CMS and SAP BusinessObjects Web
Intelligence
3.) Gradually scale up number of users
We discovered very quickly that trying to start off with our 10,000 target would make it difficult for us to
understand what was going on in the environment should we encounter any problems. Instead, we started off
small with just 200 users, then increased to 500. We then raised the number of users by increments of 500 until
we finally hit the 10,000 concurrent user mark.
During the course of this exercise, we resolved many issues around database scaling, Tomcat, CMS, and SAP
BusinessObjects Web Intelligence. We ran multiple tests to confirm that the environment was operating and
behaving as expected, without system bottlenecks or other problems.
4.) Analyze the test results using the collected metrics
After each test run, we reviewed the test results to identify any bottlenecks in particular components before
running additional tests. If we saw an increase in response times for report refreshes, we would look closer at
the reporting database layer in SAP Sybase IQ and any infrastructural aspects related to it. If we saw
decreased throughput, we would verify that all components in the environment had enough resource capacity
assigned to it and add further instances of server components where necessary.
During our testing we made a few adjustments based on findings along our way:
It was important to change the think time (up/down) as a mechanism for examining resource usage
across all tiers.
Beginning with the first test runs, system think time was set at 9 seconds, which was considered very
aggressive. This think time setting was not a consideration for change until hitting the first apparent
resource constraints, encountered at around 5,000 concurrent users. The think time was increased to 20
seconds for the 5,000-user test, and at later stage, around 7,000–7,500 concurrent users, the think time
was increased to 30 seconds to simulate business users, as described in the SAP BusinessObjects BI 4
Sizing Companion Guide available from SAP Service Marketplace.
There were also adjustments made to ramp-up time. The time allowed for the target load of concurrent
users to all become active on the system. Initially the ramp-up time was set to 7 minutes, and at a later
stage approaching 7,000 concurrent users, it was pushed up to 30 minutes, The team found at the 7,000-
user load level that a shorter ramp-up time was adding considerable load to the CMS servers. With such a
short ramp-up time, we found that most of the virtual users were sleeping/waking up at the same time,
resulting in the system being either under heavy load or virtually idle. A larger ramp-up time allowed the
user load to be spread more evenly over time, resulting in a more consistent load.
Large-Scale SAP BusinessObjects BI 4 Platform Deployment on SAP Sybase ASE and SAP Sybase IQ Databases 9
Simplify the workflow with fewer refreshes, meaning less end-to-end workload on the system.
The team additionally made efforts to simplify workflows as one way to clear performance bottlenecks. We originally and aggressively, with intent, triggered multiple refreshes of the query results as part of the test script but then realized that was likely an excessive usage scenario for a live production environment of this size. A large concurrent user group of up to 10,000 users is likely to consist of a largely mixed population of BI 4 platform end users, where use of the system will be vary by user role. The data scientists, statisticians, and BI analysts (power users) will be the power users in terms of query complexity and overall system access and use. The larger balance of users will be comprised of product managers, sales representatives, and others (business users, more consumers than producers of BI content) in need of quick information, who regularly consume static reports and rarely if ever need to perform data manipulation.
The project team tracked a variety of metrics for each test run, including resource utilization metrics, internal server metrics, and performance numbers. We kept track of resource consumption (memory and CPU usage) for different modules in the landscape.
During every run, we kept track of operation timing using Introscope to figure out which module in the landscape was the bottleneck.
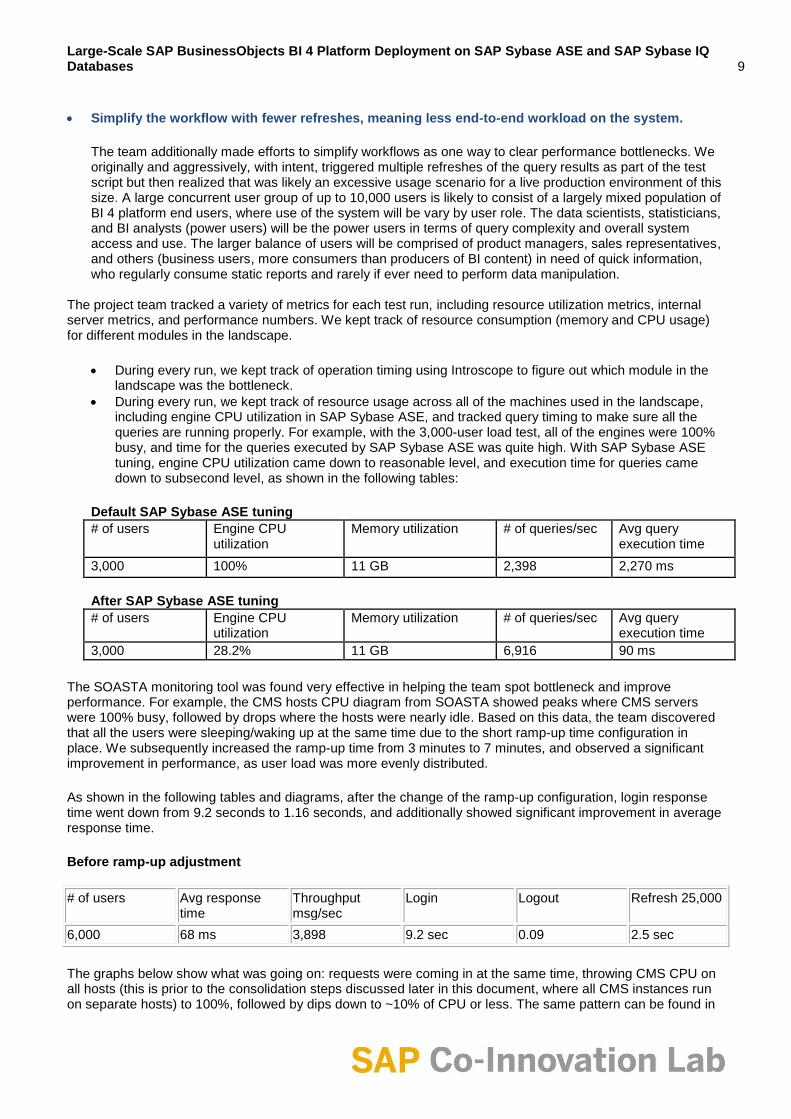
During every run, we kept track of resource usage across all of the machines used in the landscape, including engine CPU utilization in SAP Sybase ASE, and tracked query timing to make sure all the queries are running properly. For example, with the 3,000-user load test, all of the engines were 100% busy, and time for the queries executed by SAP Sybase ASE was quite high. With SAP Sybase ASE tuning, engine CPU utilization came down to reasonable level, and execution time for queries came down to subsecond level, as shown in the following tables:
Default SAP Sybase ASE tuning
# of users Engine CPU utilization
Memory utilization # of queries/sec Avg query execution time
3,000 100% 11 GB 2,398 2,270 ms
After SAP Sybase ASE tuning
# of users Engine CPU utilization
Memory utilization # of queries/sec Avg query execution time
3,000 28.2% 11 GB 6,916 90 ms
The SOASTA monitoring tool was found very effective in helping the team spot bottleneck and improve performance. For example, the CMS hosts CPU diagram from SOASTA showed peaks where CMS servers were 100% busy, followed by drops where the hosts were nearly idle. Based on this data, the team discovered that all the users were sleeping/waking up at the same time due to the short ramp-up time configuration in place. We subsequently increased the ramp-up time from 3 minutes to 7 minutes, and observed a significant improvement in performance, as user load was more evenly distributed.
As shown in the following tables and diagrams, after the change of the ramp-up configuration, login response time went down from 9.2 seconds to 1.16 seconds, and additionally showed significant improvement in average response time.
Before ramp-up adjustment
# of users Avg response time
Throughput msg/sec
Login Logout Refresh 25,000
6,000 68 ms 3,898 9.2 sec 0.09 2.5 sec
The graphs below show what was going on: requests were coming in at the same time, throwing CMS CPU on all hosts (this is prior to the consolidation steps discussed later in this document, where all CMS instances run on separate hosts) to 100%, followed by dips down to ~10% of CPU or less. The same pattern can be found in

Large-Scale SAP BusinessObjects BI 4 Platform Deployment on SAP Sybase ASE and SAP Sybase IQ Databases 10
the send rate chart. We send a lot of requests, then wait for them to be processed, which creates the “dips”, followed by new spikes.
After ramp-up adjustment
# of users Avg response time
Throughput msg/sec
Login Logout Refresh 25,000
6,000 39 ms 3,610 1.168 0.08 2.3 sec
After the adjustment, the system operated much smoother and consistently, average response time was nearly halved, and the logon time dropped by a considerable amount. The CPU graphs for the various hosts are much more consistent and close together, and you can see that the overall CPU is much lower (between ~10% and 20%). While the peak send rate is now just over half of the send rate before the adjustment, it is much more even across time than before.
3.3 Expanding to 10,000 concurrent users
Once we confirmed that the environment was operating as expected under lighter user loads, we moved on
toward the 10,000-user testing. This again raised the bar, and while CPU and memory usage was low on the BI
platform at 5,000 users and remained that way under the 10,000-user load, this did require some additional
tuning on SAP Sybase ASE in order to avoid it becoming a bottleneck in report refresh and CMS response
times. This was necessary due to the new CMS queries being sent for the SAP BusinessObjects Web
Intelligence workflows that weren’t included in the initial intelligence tier–focused test, where the goal was
Large-Scale SAP BusinessObjects BI 4 Platform Deployment on SAP Sybase ASE and SAP Sybase IQ Databases 11
simply to prove we could support 10,000 concurrent sessions. We also tuned SAP BusinessObjects Web
Intelligence memory consumption and number of threads to ensure we never ran out of available jobs for the
10,000 users we needed to support.
We ran multiple tests for 10,000 users, looking for no or a minimal number of errors (that could be reduced to
non-environment-specific problems or features of the testing environment) with a 30-minute ramp-up and
typically around an hour and a half runtime at full load. Our response times were good starting off (subsecond
for most requests, around 5–6 seconds for the report refresh) and remained that way throughout our testing.
The “Test Scenario” section shows our response times for the final consolidated test, and these are
representative of response times throughout our testing cycle.
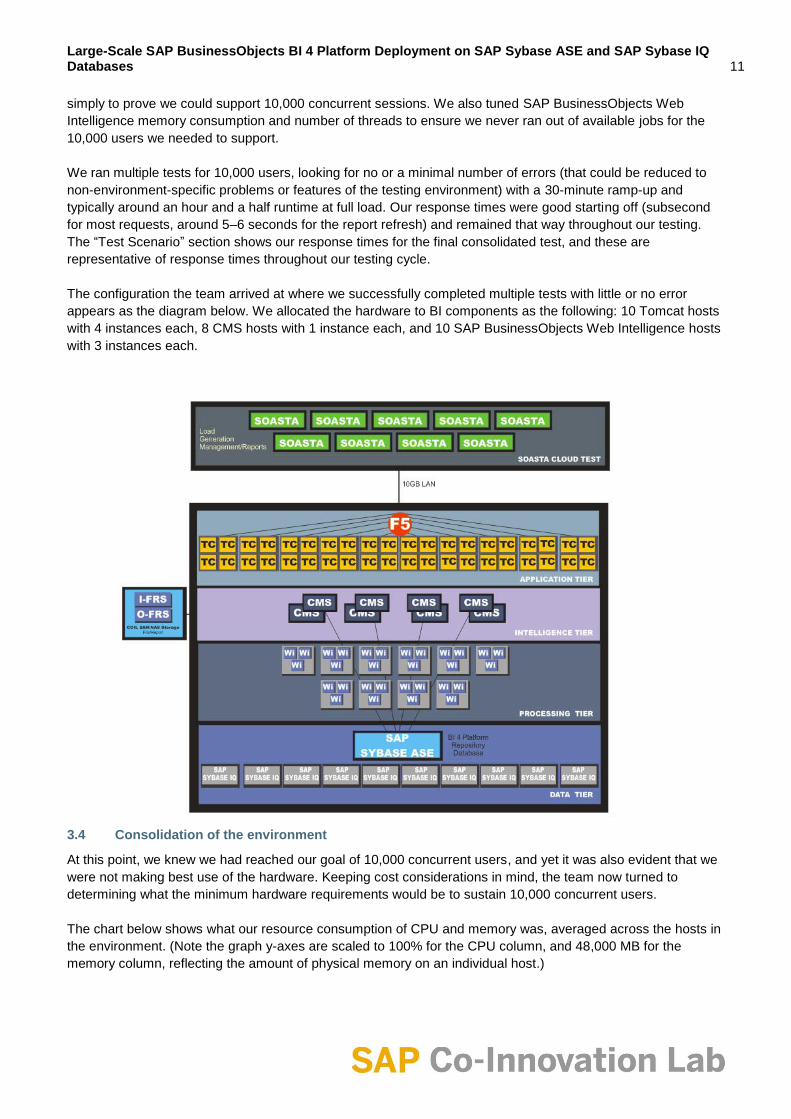
The configuration the team arrived at where we successfully completed multiple tests with little or no error
appears as the diagram below. We allocated the hardware to BI components as the following: 10 Tomcat hosts
with 4 instances each, 8 CMS hosts with 1 instance each, and 10 SAP BusinessObjects Web Intelligence hosts
with 3 instances each.
3.4 Consolidation of the environment
At this point, we knew we had reached our goal of 10,000 concurrent users, and yet it was also evident that we
were not making best use of the hardware. Keeping cost considerations in mind, the team now turned to
determining what the minimum hardware requirements would be to sustain 10,000 concurrent users.
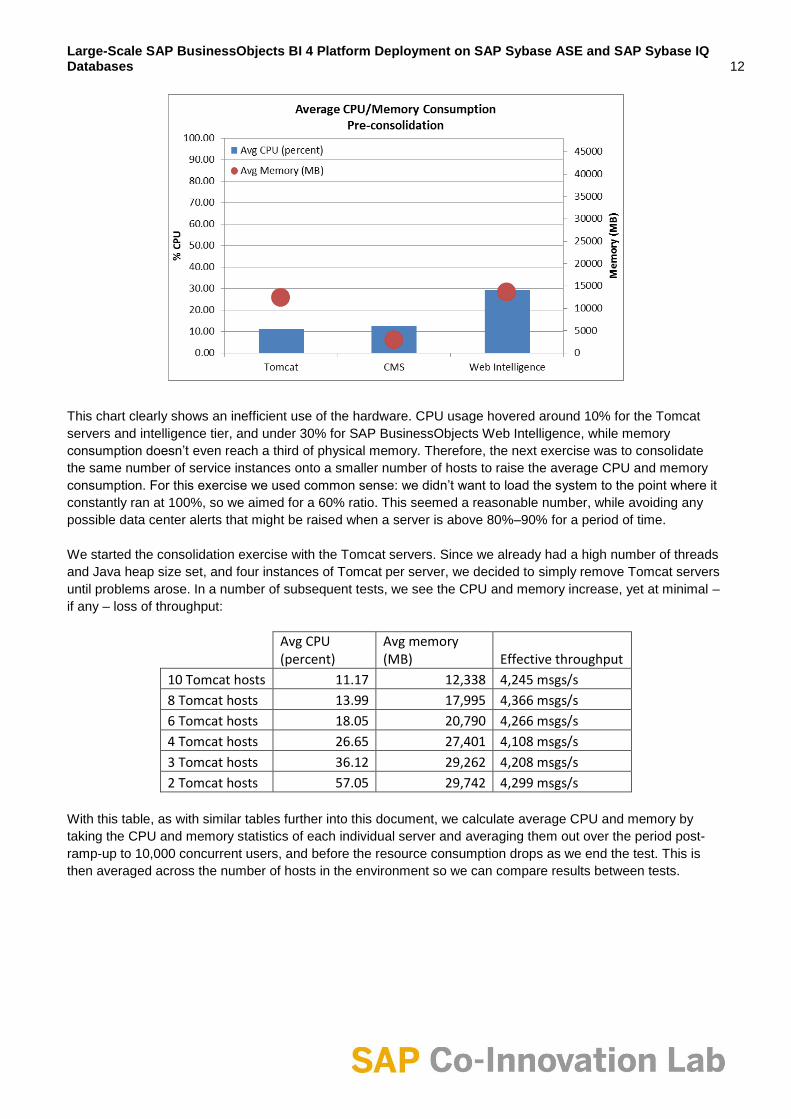
The chart below shows what our resource consumption of CPU and memory was, averaged across the hosts in
the environment. (Note the graph y-axes are scaled to 100% for the CPU column, and 48,000 MB for the
memory column, reflecting the amount of physical memory on an individual host.)
Large-Scale SAP BusinessObjects BI 4 Platform Deployment on SAP Sybase ASE and SAP Sybase IQ Databases 12
This chart clearly shows an inefficient use of the hardware. CPU usage hovered around 10% for the Tomcat
servers and intelligence tier, and under 30% for SAP BusinessObjects Web Intelligence, while memory
consumption doesn’t even reach a third of physical memory. Therefore, the next exercise was to consolidate
the same number of service instances onto a smaller number of hosts to raise the average CPU and memory
consumption. For this exercise we used common sense: we didn’t want to load the system to the point where it
constantly ran at 100%, so we aimed for a 60% ratio. This seemed a reasonable number, while avoiding any
possible data center alerts that might be raised when a server is above 80%–90% for a period of time.
We started the consolidation exercise with the Tomcat servers. Since we already had a high number of threads
and Java heap size set, and four instances of Tomcat per server, we decided to simply remove Tomcat servers
until problems arose. In a number of subsequent tests, we see the CPU and memory increase, yet at minimal –
if any – loss of throughput:
Avg CPU (percent)
Avg memory (MB) Effective throughput
10 Tomcat hosts 11.17 12,338 4,245 msgs/s
8 Tomcat hosts 13.99 17,995 4,366 msgs/s
6 Tomcat hosts 18.05 20,790 4,266 msgs/s
4 Tomcat hosts 26.65 27,401 4,108 msgs/s
3 Tomcat hosts 36.12 29,262 4,208 msgs/s
2 Tomcat hosts 57.05 29,742 4,299 msgs/s
With this table, as with similar tables further into this document, we calculate average CPU and memory by
taking the CPU and memory statistics of each individual server and averaging them out over the period post-
ramp-up to 10,000 concurrent users, and before the resource consumption drops as we end the test. This is
then averaged across the number of hosts in the environment so we can compare results between tests.

Large-Scale SAP BusinessObjects BI 4 Platform Deployment on SAP Sybase ASE and SAP Sybase IQ Databases 13
This resulted in a change of the environment to 2 Tomcat hosts with 4 instances each, 8 CMS hosts with 1
instance each, and 10 SAP BusinessObjects Web Intelligence hosts with 3 instances each, as shown in the
following diagram:
We then moved on to the consolidation of SAP BusinessObjects Web Intelligence servers, by adding SAP
BusinessObjects Web Intelligence instances onto a smaller number of servers. We started with 10 SAP
BusinessObjects Web Intelligence servers with 3 instances each, tested 8 SAP BusinessObjects Web
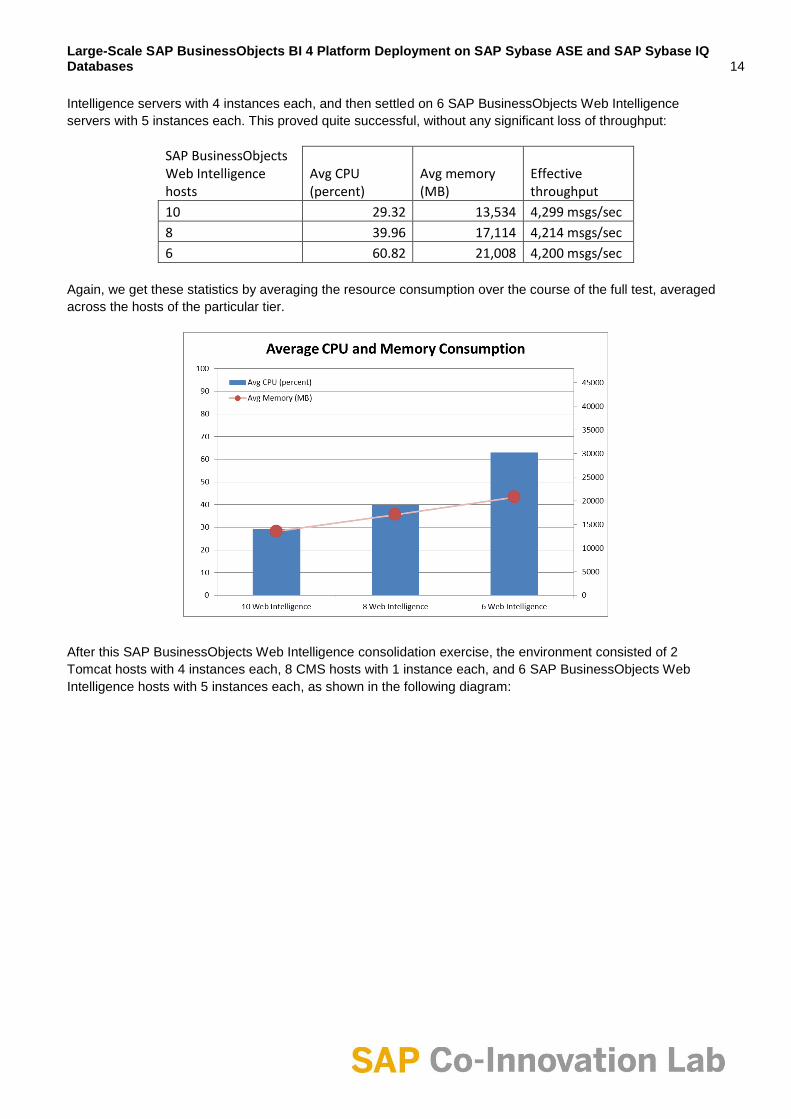
Large-Scale SAP BusinessObjects BI 4 Platform Deployment on SAP Sybase ASE and SAP Sybase IQ Databases 14
Intelligence servers with 4 instances each, and then settled on 6 SAP BusinessObjects Web Intelligence
servers with 5 instances each. This proved quite successful, without any significant loss of throughput:
SAP BusinessObjects Web Intelligence hosts
Avg CPU (percent)
Avg memory (MB)
Effective throughput
10 29.32 13,534 4,299 msgs/sec
8 39.96 17,114 4,214 msgs/sec
6 60.82 21,008 4,200 msgs/sec
Again, we get these statistics by averaging the resource consumption over the course of the full test, averaged
across the hosts of the particular tier.
After this SAP BusinessObjects Web Intelligence consolidation exercise, the environment consisted of 2
Tomcat hosts with 4 instances each, 8 CMS hosts with 1 instance each, and 6 SAP BusinessObjects Web
Intelligence hosts with 5 instances each, as shown in the following diagram:
Large-Scale SAP BusinessObjects BI 4 Platform Deployment on SAP Sybase ASE and SAP Sybase IQ Databases 15
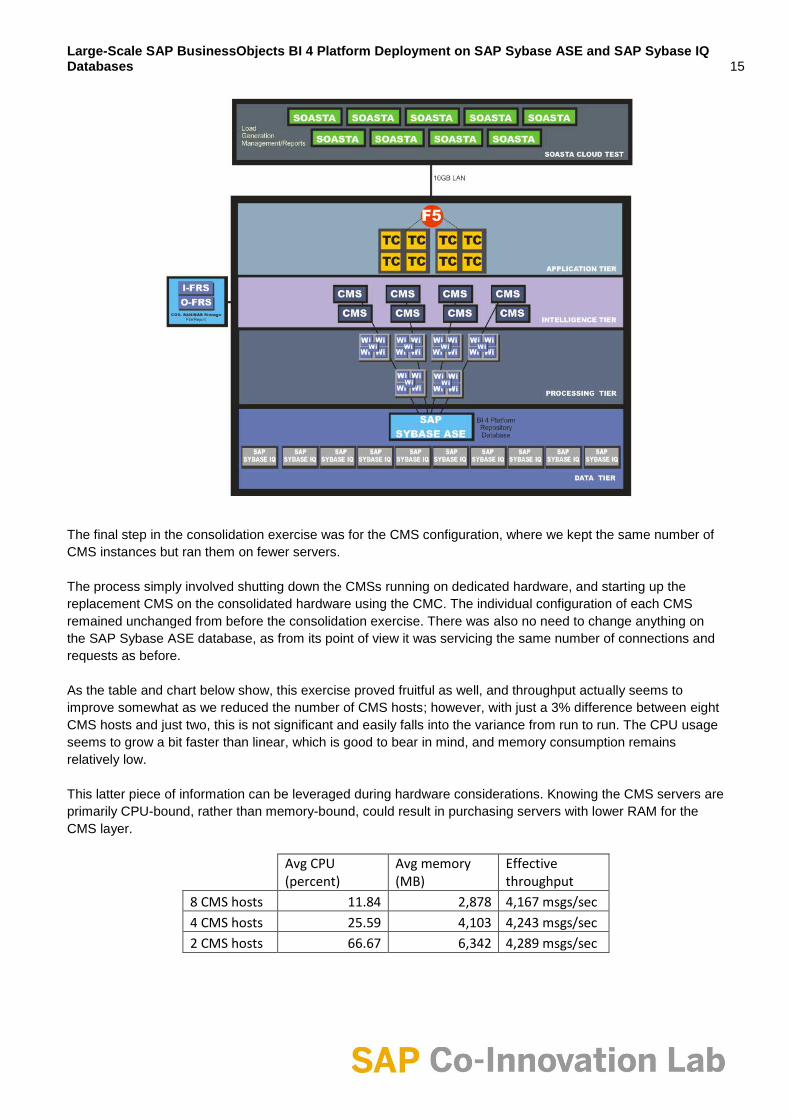
The final step in the consolidation exercise was for the CMS configuration, where we kept the same number of
CMS instances but ran them on fewer servers.
The process simply involved shutting down the CMSs running on dedicated hardware, and starting up the
replacement CMS on the consolidated hardware using the CMC. The individual configuration of each CMS
remained unchanged from before the consolidation exercise. There was also no need to change anything on
the SAP Sybase ASE database, as from its point of view it was servicing the same number of connections and
requests as before.
As the table and chart below show, this exercise proved fruitful as well, and throughput actually seems to
improve somewhat as we reduced the number of CMS hosts; however, with just a 3% difference between eight
CMS hosts and just two, this is not significant and easily falls into the variance from run to run. The CPU usage
seems to grow a bit faster than linear, which is good to bear in mind, and memory consumption remains
relatively low.
This latter piece of information can be leveraged during hardware considerations. Knowing the CMS servers are
primarily CPU-bound, rather than memory-bound, could result in purchasing servers with lower RAM for the
CMS layer.
Avg CPU (percent)
Avg memory (MB)
Effective throughput
8 CMS hosts 11.84 2,878 4,167 msgs/sec
4 CMS hosts 25.59 4,103 4,243 msgs/sec
2 CMS hosts 66.67 6,342 4,289 msgs/sec
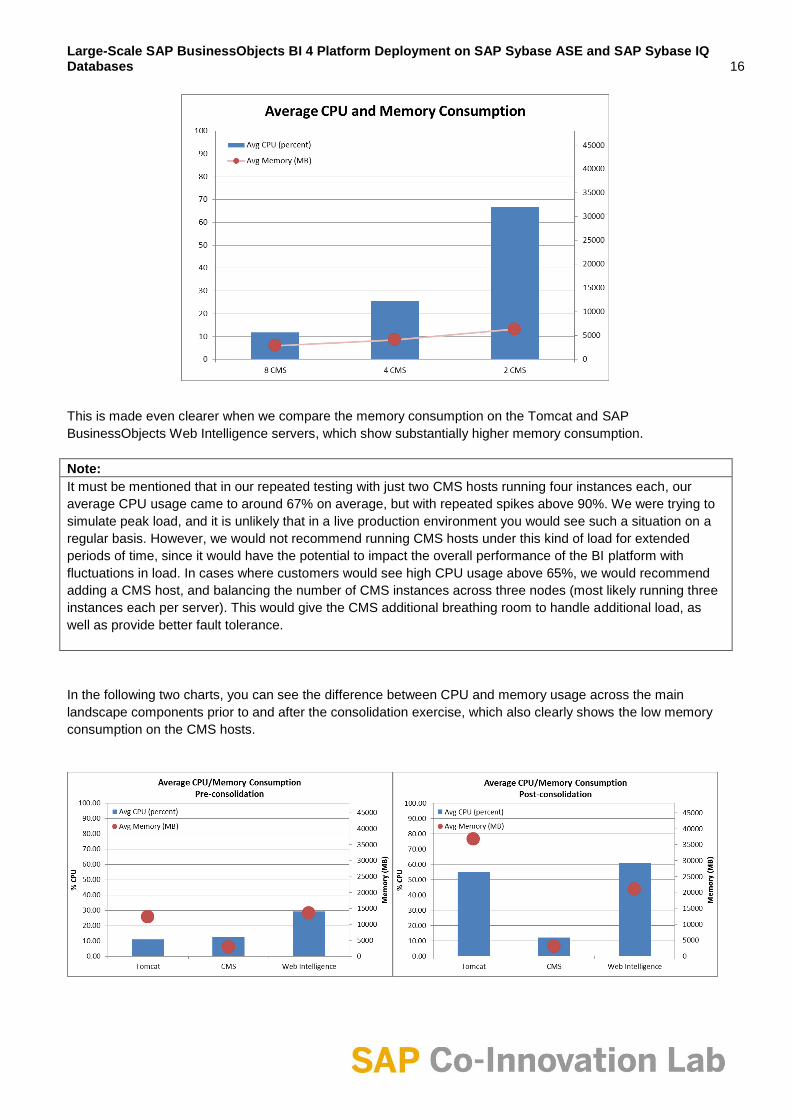
Large-Scale SAP BusinessObjects BI 4 Platform Deployment on SAP Sybase ASE and SAP Sybase IQ Databases 16
This is made even clearer when we compare the memory consumption on the Tomcat and SAP
BusinessObjects Web Intelligence servers, which show substantially higher memory consumption.
Note:
It must be mentioned that in our repeated testing with just two CMS hosts running four instances each, our
average CPU usage came to around 67% on average, but with repeated spikes above 90%. We were trying to
simulate peak load, and it is unlikely that in a live production environment you would see such a situation on a
regular basis. However, we would not recommend running CMS hosts under this kind of load for extended
periods of time, since it would have the potential to impact the overall performance of the BI platform with
fluctuations in load. In cases where customers would see high CPU usage above 65%, we would recommend
adding a CMS host, and balancing the number of CMS instances across three nodes (most likely running three
instances each per server). This would give the CMS additional breathing room to handle additional load, as
well as provide better fault tolerance.
In the following two charts, you can see the difference between CPU and memory usage across the main
landscape components prior to and after the consolidation exercise, which also clearly shows the low memory
consumption on the CMS hosts.
Large-Scale SAP BusinessObjects BI 4 Platform Deployment on SAP Sybase ASE and SAP Sybase IQ Databases 17
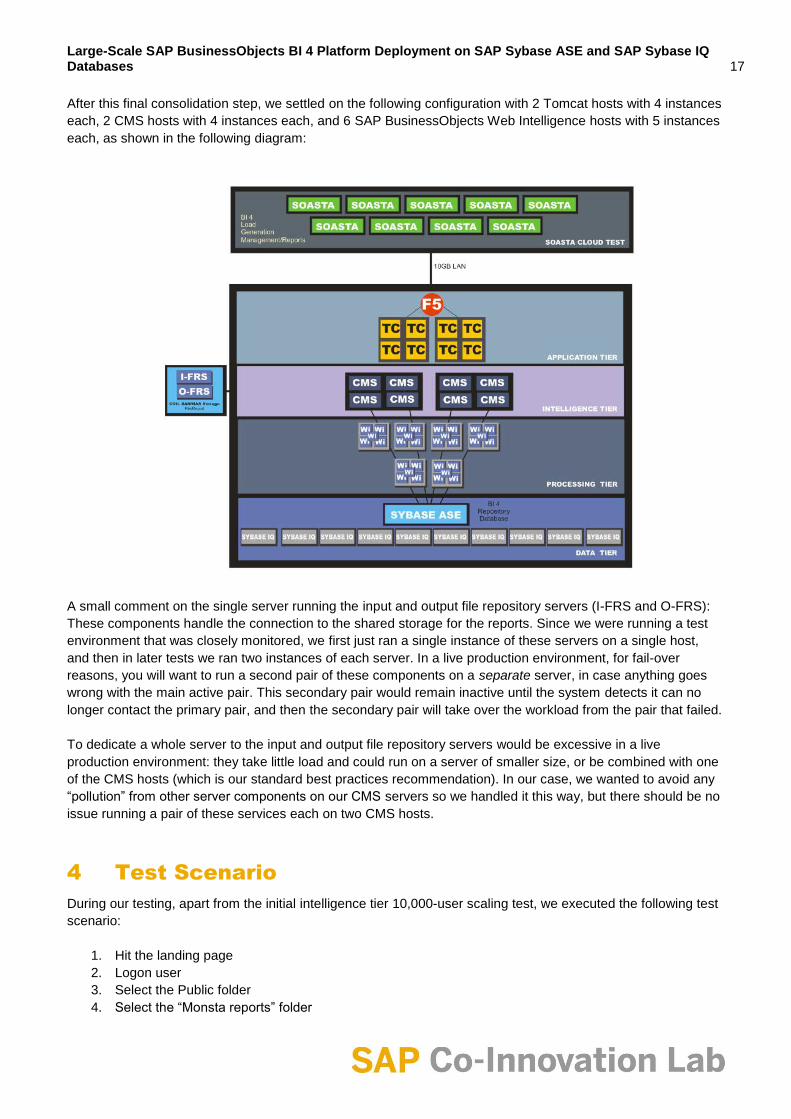
After this final consolidation step, we settled on the following configuration with 2 Tomcat hosts with 4 instances
each, 2 CMS hosts with 4 instances each, and 6 SAP BusinessObjects Web Intelligence hosts with 5 instances
each, as shown in the following diagram:
A small comment on the single server running the input and output file repository servers (I-FRS and O-FRS):
These components handle the connection to the shared storage for the reports. Since we were running a test
environment that was closely monitored, we first just ran a single instance of these servers on a single host,
and then in later tests we ran two instances of each server. In a live production environment, for fail-over
reasons, you will want to run a second pair of these components on a separate server, in case anything goes
wrong with the main active pair. This secondary pair would remain inactive until the system detects it can no
longer contact the primary pair, and then the secondary pair will take over the workload from the pair that failed.
To dedicate a whole server to the input and output file repository servers would be excessive in a live
production environment: they take little load and could run on a server of smaller size, or be combined with one
of the CMS hosts (which is our standard best practices recommendation). In our case, we wanted to avoid any
“pollution” from other server components on our CMS servers so we handled it this way, but there should be no
issue running a pair of these services each on two CMS hosts.
4 Test Scenario
During our testing, apart from the initial intelligence tier 10,000-user scaling test, we executed the following test
scenario:
1. Hit the landing page
2. Logon user
3. Select the Public folder
4. Select the “Monsta reports” folder
Large-Scale SAP BusinessObjects BI 4 Platform Deployment on SAP Sybase ASE and SAP Sybase IQ Databases 18
5. Open SAP BusinessObjects Web Intelligence report with 2,500 rows of data
6. Navigate to the next page
7. Close report
8. Open SAP BusinessObjects Web Intelligence report with 5,000 rows of data
9. Navigate to the next page
10. Close report
11. Open SAP BusinessObjects Web Intelligence report with 10,000 rows of data
12. Navigate to the next page
13. Close report
14. Open SAP BusinessObjects Web Intelligence report with 25,000 rows of data
15. Refresh the report
16. Navigate to the next page
17. Close report
18. Logoff
Between each individual step there are 30 seconds of think time, which is equivalent to the “business user”
profile described in the SAP BusinessObjects BI 4 Sizing Companion Guide, and represents a fairly intensive
yet typical usage of the system. The idea here is to create a representative flow of user actions that is
comparable with real-life usage of the system. It takes time for a user to navigate around the application, and
we should assume that when a report is accessed, the user spends a certain amount of time absorbing the
results in it.
The reports were based around the standard TPC-H benchmarking data base, though the test itself is not a
TPC-H benchmark. The database is only used as a dataset to support our testing. The practice of using reports
of 2,500, 5,000, 10,000, and 25,000 rows of data is a common practice in BI platform testing, and is typically the
size of reports that are used in benchmarks and performance testing of the BI platform. Our DB environment
was comprised of:
TPC-H scale factor 30
34 GB data
4.5 million customers
300,000 vendors
180 million line items
45 million orders
400 simultaneous connections for the multiplex
Note that we focused our efforts on SAP BusinessObjects Web Intelligence. We considered other reporting
components, like SAP Crystal Reports®, SAP BusinessObjects Explorer®, or SAP BusinessObjects
Dashboards software, but each of those report formats poses its own issues in performance testing. SAP
BusinessObjects Dashboards is a Shockwave/Flash component that is notoriously difficult to script for
automated testing tools, as it handles its own interaction back to the server. It is theoretically possible to capture
the exchange between the Flash component and the back-end server, but the scripting issues involved and the
time required to trace down the network interaction and set it up proved prohibitive and was deemed not worth
the effort. SAP BusinessObjects Explorer was a possibility, and we considered including SAP Crystal Reports,
but given the size and complexity of the environment and the scope of the overall test, we wanted to avoid
having to trace down any problems we encountered in multiple separate report components.
Response times for the consolidated landscape were as follows:
Avg response times (sec)
90th percentile max. response (sec)
Landing page 0.069 0.422
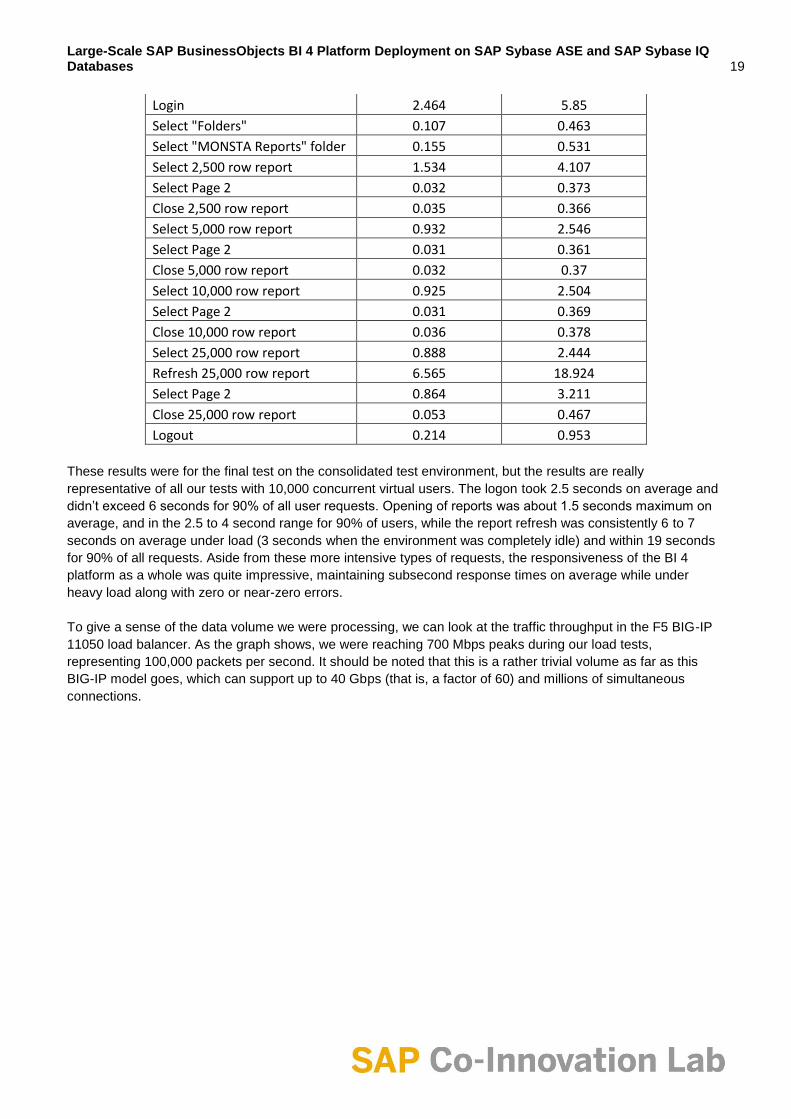
Large-Scale SAP BusinessObjects BI 4 Platform Deployment on SAP Sybase ASE and SAP Sybase IQ Databases 19
Login 2.464 5.85
Select "Folders" 0.107 0.463
Select "MONSTA Reports" folder 0.155 0.531
Select 2,500 row report 1.534 4.107
Select Page 2 0.032 0.373
Close 2,500 row report 0.035 0.366
Select 5,000 row report 0.932 2.546
Select Page 2 0.031 0.361
Close 5,000 row report 0.032 0.37
Select 10,000 row report 0.925 2.504
Select Page 2 0.031 0.369
Close 10,000 row report 0.036 0.378
Select 25,000 row report 0.888 2.444
Refresh 25,000 row report 6.565 18.924
Select Page 2 0.864 3.211
Close 25,000 row report 0.053 0.467
Logout 0.214 0.953
These results were for the final test on the consolidated test environment, but the results are really
representative of all our tests with 10,000 concurrent virtual users. The logon took 2.5 seconds on average and
didn’t exceed 6 seconds for 90% of all user requests. Opening of reports was about 1.5 seconds maximum on
average, and in the 2.5 to 4 second range for 90% of users, while the report refresh was consistently 6 to 7
seconds on average under load (3 seconds when the environment was completely idle) and within 19 seconds
for 90% of all requests. Aside from these more intensive types of requests, the responsiveness of the BI 4
platform as a whole was quite impressive, maintaining subsecond response times on average while under
heavy load along with zero or near-zero errors.
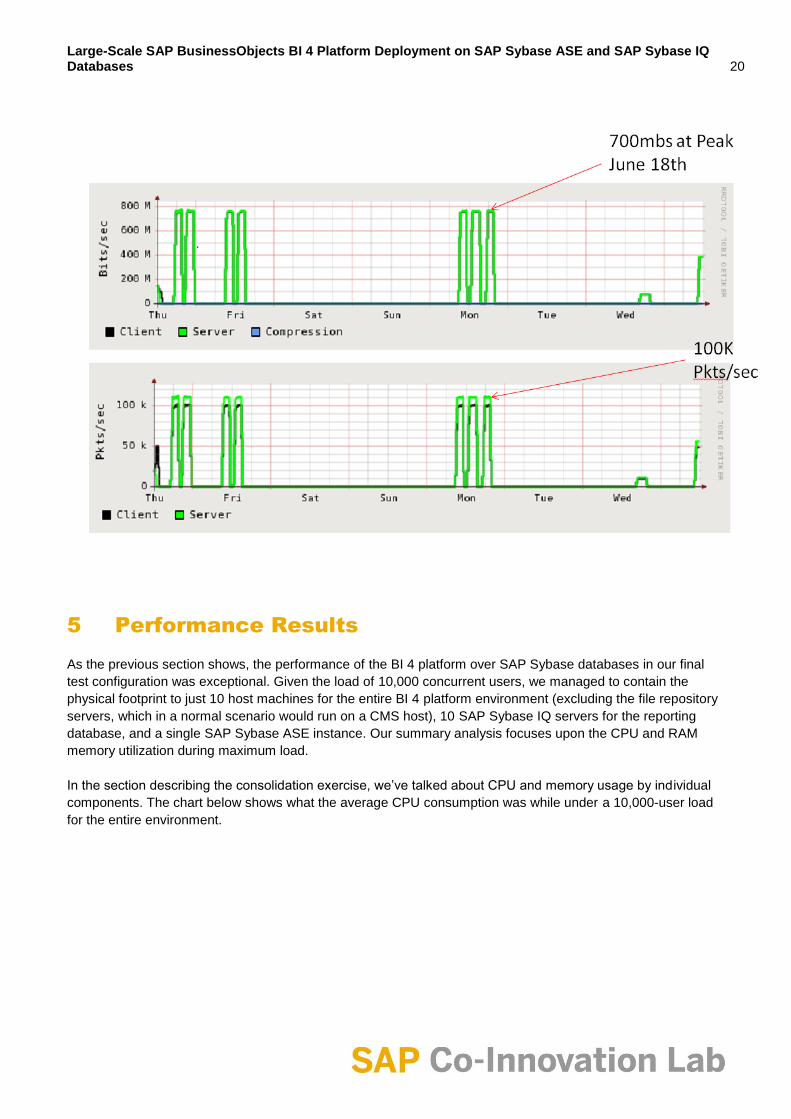
To give a sense of the data volume we were processing, we can look at the traffic throughput in the F5 BIG-IP
11050 load balancer. As the graph shows, we were reaching 700 Mbps peaks during our load tests,
representing 100,000 packets per second. It should be noted that this is a rather trivial volume as far as this
BIG-IP model goes, which can support up to 40 Gbps (that is, a factor of 60) and millions of simultaneous
connections.
Large-Scale SAP BusinessObjects BI 4 Platform Deployment on SAP Sybase ASE and SAP Sybase IQ Databases 20
5 Performance Results
As the previous section shows, the performance of the BI 4 platform over SAP Sybase databases in our final
test configuration was exceptional. Given the load of 10,000 concurrent users, we managed to contain the
physical footprint to just 10 host machines for the entire BI 4 platform environment (excluding the file repository
servers, which in a normal scenario would run on a CMS host), 10 SAP Sybase IQ servers for the reporting
database, and a single SAP Sybase ASE instance. Our summary analysis focuses upon the CPU and RAM
memory utilization during maximum load.
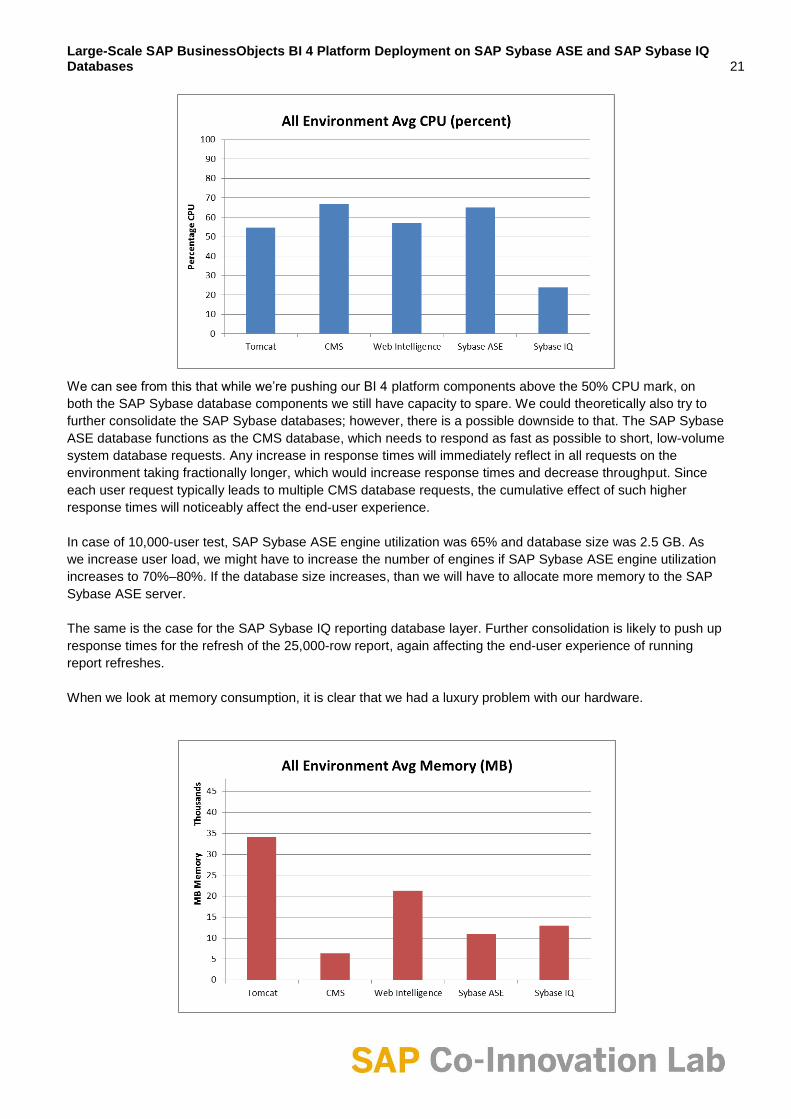
In the section describing the consolidation exercise, we’ve talked about CPU and memory usage by individual
components. The chart below shows what the average CPU consumption was while under a 10,000-user load
for the entire environment.
Large-Scale SAP BusinessObjects BI 4 Platform Deployment on SAP Sybase ASE and SAP Sybase IQ Databases 21
We can see from this that while we’re pushing our BI 4 platform components above the 50% CPU mark, on
both the SAP Sybase database components we still have capacity to spare. We could theoretically also try to
further consolidate the SAP Sybase databases; however, there is a possible downside to that. The SAP Sybase
ASE database functions as the CMS database, which needs to respond as fast as possible to short, low-volume
system database requests. Any increase in response times will immediately reflect in all requests on the
environment taking fractionally longer, which would increase response times and decrease throughput. Since
each user request typically leads to multiple CMS database requests, the cumulative effect of such higher
response times will noticeably affect the end-user experience.
In case of 10,000-user test, SAP Sybase ASE engine utilization was 65% and database size was 2.5 GB. As
we increase user load, we might have to increase the number of engines if SAP Sybase ASE engine utilization
increases to 70%–80%. If the database size increases, than we will have to allocate more memory to the SAP
Sybase ASE server.
The same is the case for the SAP Sybase IQ reporting database layer. Further consolidation is likely to push up
response times for the refresh of the 25,000-row report, again affecting the end-user experience of running
report refreshes.
When we look at memory consumption, it is clear that we had a luxury problem with our hardware.
Large-Scale SAP BusinessObjects BI 4 Platform Deployment on SAP Sybase ASE and SAP Sybase IQ Databases 22
On the Tomcat side, we are using most of the
available memory of all tiers in the environment,
but we are not exhausting the 48 GB available to
us on each server. We should be able to get
away with equivalent hardware with just 36 GB
of RAM. For the SAP BusinessObjects Web
Intelligence processing tier, 24 GB should be
enough, whereas for the intelligence tier or
CMS, we wouldn’t need more than 8 GB per
host machine, depending on what other
intelligence tier components are running.
For the SAP Sybase IQ servers running the
reporting database, 16 GB should be sufficient.
Given the typical small size of a CMS database,
the SAP Sybase ASE layer is a possible
candidate for lower memory requirements for its
hardware, as we used up to 11 GB out of the
available 16 GB in the SuperServer. However,
we have to bear in mind that larger CMS
databases with more content in them would
require more memory than we perceived in our
tests, where the number of reports was restricted
to just the test reports.
6 Hardware
Infrastructure
6.1 Single rack configuration
Thanks to the generous support and
collaboration of our partners (Supermicro, Intel,
Red Hat, and F5), we had plenty of physical
hardware and infrastructure to conduct our tests.
Since we did not know from the start what it was
we were going to need to support this exercise,
we truly appreciated the overall contribution of
infrastructure assets and the level of support we
received from each of the participant firms. In the
end, we were able to reach our goal with substantially less hardware than was available to us, but we wanted to
make sure that no component was a bottleneck in the environment and especially that we did not see ourselves
limited by too little available hardware for our system and reporting databases – which can easily corrupt and/or
limit test results.
The test system was comprised of 80 hosts – 40 Supermicro TwinBlades SBI-7226T-T2 each with 4 Intel®
Xeon® 6-core processors (Intel® Xeon® Processor X5650 equipped with 12M Cache, 2.40 GHz, 5.86 GT/s
Intel® QPI) and 96 GB RAM – for a total of 960 cores, 3.8 TB RAM, and 60 TB of HDD. With use of the
TwinBlades, the project readily took advantage of the double density in each of the blade enclosures, allowing
us to contain the entire implementation to a single 42U rack. With 20 nodes per 7U enclosure, we simplified the
architecture and deployed a reliable cost-effective computational platform for the BI 4 platform.
Twelve of the blade nodes were allocated to SOASTA CloudTest Maestro to manage all load generation, load
monitoring, and reporting. The SAP Co-Innovation Lab project team’s assessment involved the careful
Large-Scale SAP BusinessObjects BI 4 Platform Deployment on SAP Sybase ASE and SAP Sybase IQ Databases 23
monitoring of CPU usage, memory consumption, disk I/O, and more. The team used CloudTest to look at all of
these dimensions across the different tiers of the BI platform as our tests ramped up the total number of
concurrent users.
Twenty-one of the hosts were allocated for SAP Sybase IQ as the reporting DB. The balance of blades were
allocated to the BI 4 platform (that is, CMS, Tomcat and SAP BusinessObjects Web Intelligence).
Initially 20 hosts were allocated for SAP Sybase IQ databases. However, the database did not need that much
firepower to support 10,000 users. Subsequently, six hosts were used for SAP Sybase IQ.
One Supermicro 2U SuperServer [SYS-8026B-6RF] with 4 Intel Xeon 10-core processors – for a total of 40
core and16 GB RAM – was dedicated to SAP Sybase ASE as CMS DB. This server’s performance was
exceptional, contributing to fast response times and overall uptime for the system. In nearly eight months of
continuous server operation saw less than two hours of planned downtime.
6.2 BI 4 platform single-rack test environment
It was a benefit to the project to have built this entire deployment using Red Hat’s technologies. For example, Red Hat Enterprise Linux 6.2 provides higher levels of efficiency realized through resource management and performance optimization, along with enhanced business agility through additional security enhancements. Using the Smart Management Add-On, when coupled with Red Hat Network (RHN) Satellite, provided a central management platform to allow quick provisioning, easy management, and precise monitoring. With 81 nodes to manage, the Smart Management Add-On and RHN Satellite are strongly recommended for setting up a large-scale environment and for easy management of the complete lifecycle of the Red Hat Enterprise Linux systems. In such a complex environment, simplicity and automation are the key to high efficiency. Since everything in Linux happens with scripts, the team could actually script the scripts. At one point, the BI environment alone consisted of 10 Tomcat, 8 CMS, 10 SAP BusinessObjects Web Intelligence, and 1 I/O FRS servers equivalent to 29 individual hosts. Stopping and starting those manually before tests would have required a lot of time, whereas after scripting it was a question of running a single script, and then just verifying in CMS that everything had started correctly. Additionally noteworthy is the benefit the project drew from working with the F5 BIG-IP appliance and the F5 team assigned to the project. The F5 BIG-IP Local Traffic Manager monitored the SAP portal server pools for availability and intelligently directed new user connections to the most available server. The BIG-IP 11050 device utilized in the SAP Co-Innovation Lab testing environment was more than effective, sustaining over 10,000 simultaneous user connections.
7 BI 4 Platform Best Practices
7.1 BI platform
Recommendations for configuring the BI platform with large-scale deployment are as follows:
1. Refer to the BI 4 Sizing Estimator and Companion Guide found under help.sap.com, which will provide
you with a starting point for the hardware requirements and server configuration depending on the BI
client(s) you are using.
2. Methodically “build out” the system:
a. Start with a smaller landscape, using a smaller number of users to gain confidence in your
landscape, and gradually increase the load in increments of 50 to 200 users, only adding
services/servers as necessary.
b. Carefully monitor and analyze the performance and resource usage across the entire
landscape, including the CMS repository DB, the Web application tier, and any other SAP BI 4
platform servers involved in the test to identify various bottlenecks in either the underlying
infrastructure or server configuration. Then take the appropriate action (for example, adding
another CMS host if CMS CPU utilization is above 80%).
Large-Scale SAP BusinessObjects BI 4 Platform Deployment on SAP Sybase ASE and SAP Sybase IQ Databases 24
c. Immediately jumping to thousands of users where multiple bottlenecks could be encountered
will make identifying the root cause challenging.
3. The CMS DB is key to the overall performance and scalability of the BI platform:
a. A dedicated CMS DB running on dedicated hardware is recommended.
b. Work with your DBA to ensure the CMS DB is correctly sized, configured, and monitored by
referring to DB vendor materials on sizing. A summary of specific guidelines for SAP Sybase
ASE are included in this documentation.
4. The underlying infrastructure, including machines and network, is critical to the overall performance and
scalability of the BI platform; work with your infrastructure administrators to ensure the environment is
correctly sized, configured, and monitored.
5. When starting your SAP landscape, it’s recommended to methodically start each of your server
intelligence agent (SIA) nodes and ensure all servers are correctly started before starting another node.
7.2 Tomcat
The configuration for Tomcat consisted of two separate items: first, the configuration of individual Tomcat
instance parameters for Java heap size and number of threads, and second, the running of multiple instances
per host.
Starting with the configuration of the Tomcat parameters, we made two changes to the default configuration.
First, we set the Java heap size to 10 GB. The default setting is 2,048 MB, or 2 GB, which was chosen to
handle most customers’ needs without a bigger memory footprint. On 64-bit systems, we can set the Java heap
size substantially higher without causing stability issues; we ran our tests with the 10 GB setting and never
exhausted that. During our testing, actual memory usage at maximum got to just around 9 GB per instance on
average when running only two Tomcat hosts with four instances each, for a total memory consumption per
host of just under 37 GB. We also set the -XX:+UseParallelOldGC flag, which instructs the JVM to use parallel
garbage collection.
JAVA_OPTS="$JAVA_OPTS -Xmx10g -XX:+UseParallelOldGC -XX:MaxPermSize=384m
The second configuration change was to increase the number of threads per instance. The default number here
is 200, and we increased this to 1,500. Since a lot of HTTP requests to the BI platform are for JavaScript, CSS,
and image files, we needed to ensure we had enough threads available to support all requests made by the
virtual users. With a total of eight instances, 1,500 threads per instance gave us 12,000 threads total, which
proved sufficient.
<Connector port="8080" protocol="HTTP/1.1" maxThreads="1500"
connectionTimeout="20000" redirectPort="8443" compression="on"
URIEncoding="UTF-8" compressionMinSize="2048"
noCompressionUserAgents="gozilla, traviata"
compressableMimeType="text/html,text/xml,text/plain,text/css,text/javascript
,text/json,application/json"/>
In order to make full use of the 24 CPU cores and 48 GB of memory per host, we configured four instances
each of the Tomcat configuration above for the Tomcat hosts. This is easily achieved on *nix platforms by
copying the “tomcat” folder in the BI platform install directory several times:
1. Copy the tomcat folder and save it with a new name (tomcat2, tomcat3, tomcat4).
2. Open the server.xml file in the conf directory, and change the shutdown port and the main HTTP/1.1
Connector port (<Server port=”<shutdown port>” shutdown=”SHUTDOWN”> and <Connector
port=”<HTTP port>” protocol=”HTTP/1.1”… />). In our case, we used 8080, 9080, 6080, and 7080, with
the first instance running on the default port. (Note that in case you are using a Web server and an APJ
Large-Scale SAP BusinessObjects BI 4 Platform Deployment on SAP Sybase ASE and SAP Sybase IQ Databases 25
1.3 Connector, you will need to change the port for that particular connector from the default 8009. We
did actually set those in our server.xml files but did not use them.)
3. Copy the tomcatstartup.sh and tomcatshutdown.sh scripts, save them with a new name
(tomcat2startup.sh, tomcat2shutdown.sh, and so on), and make sure that they are executable.
4. Open the new .sh files and update the folder and logfile names as appropriate:
Start-up script:
#!/bin/sh
# The Install Directory
TEMPDIR=`dirname "$0"`
BOBJEDIR=`cd "${TEMPDIR?}"; pwd`
. $BOBJEDIR/setup/env.sh
if [ ! -d "$BOBJEDIR/tomcat2/logs" ]; then
mkdir -p "$BOBJEDIR/tomcat2/logs"
fi
if [ ! -d "$BOBJEDIR/logging" ]; then
mkdir -p "$BOBJEDIR/logging"
fi
date > "$BOBJEDIR/logging/tomcat2startup.log"
TEMPDIR=`pwd`
cd "$BOBJEDIR/tomcat2/bin"
$CE_CMDLINE_PREFIX nohup sh "$BOBJEDIR/tomcat2/bin/startup.sh" >>
"$BOBJEDIR/logging/tomcat2startup.log" 2>&1
cd "$TEMPDIR"
Shutdown script:
#!/bin/sh
TEMPDIR=`dirname "$0"`
BOBJEDIR=`cd "${TEMPDIR?}"; pwd`
. $BOBJEDIR/setup/env.sh
date > "$BOBJEDIR/logging/tomcat2shutdown.log"
TEMPDIR=`pwd`
cd "$BOBJEDIR/tomcat2/bin"
$CE_CMDLINE_PREFIX nohup sh "$BOBJEDIR/tomcat2/bin/shutdown.sh" >>
"$BOBJEDIR/logging/tomcat2shutdown.log" 2>&1
cd "$TEMPDIR"
This allows us to start four instances of Tomcat on the same host, simply by calling the tomcatstartup.sh,
tomcat2startup.sh, tomcat3startup.sh, and tomcat4startup.sh scripts.
The configuration discussed here should serve as a guideline, bearing in mind the size of the hardware
involved. This was appropriate for hosts with 24 CPU cores and 48 GB RAM. If your hardware is of a different
configuration, you will have to adjust your Tomcat configuration accordingly. The key metric to bear in mind is
the number of threads. All Tomcat instances combined across all hosts in your environment collectively need to
have enough threads available to support the users making use of the system. Divide this number by 1,500 and
Large-Scale SAP BusinessObjects BI 4 Platform Deployment on SAP Sybase ASE and SAP Sybase IQ Databases 26
you have the total number of instances you need to run across all hosts. Then evaluate the size of the individual
hosts to determine how many instances you need to run per host. For the Java heap size configuration, you will
want to make sure that the total amount of memory allocated across all instances per host doesn’t exceed the
server’s physical memory to avoid performance issues due to virtual memory swapping.
7.3 A small note on setting start-up Java heap size (-Xms)
In the vast majority of our testing, we only set the maximum Java heap size (to 10 GB). However, since there
has been a long-running practice to set the start-up Java heap size equal to the maximum,1 we did want to see
the effect of doing so and confirm whether this was a good practice or not.
When setting the start-up Java heap size to the same 10 GB size as the maximum Java heap, we observed two
things:
1. Tomcat took substantially longer to start because it started to reserve the full 10 GB of memory before
accepting requests.
2. After the initial load, memory started to get released, until we returned to normal operation as if we had
never set the -Xms start-up heap size.
Interestingly, during the documentation of our testing, we came across a posting on java-monitor.com2 that very
much shows the same behavior we observed. We also didn’t observe any increased predictability of JVM
behavior, and in fact it actually seemed less stable.
We therefore do not see a reason to specify the start-up Java heap size, and we do not recommend this
practice.
8 SAP BusinessObjects Web Intelligence
Configuration Best Practices
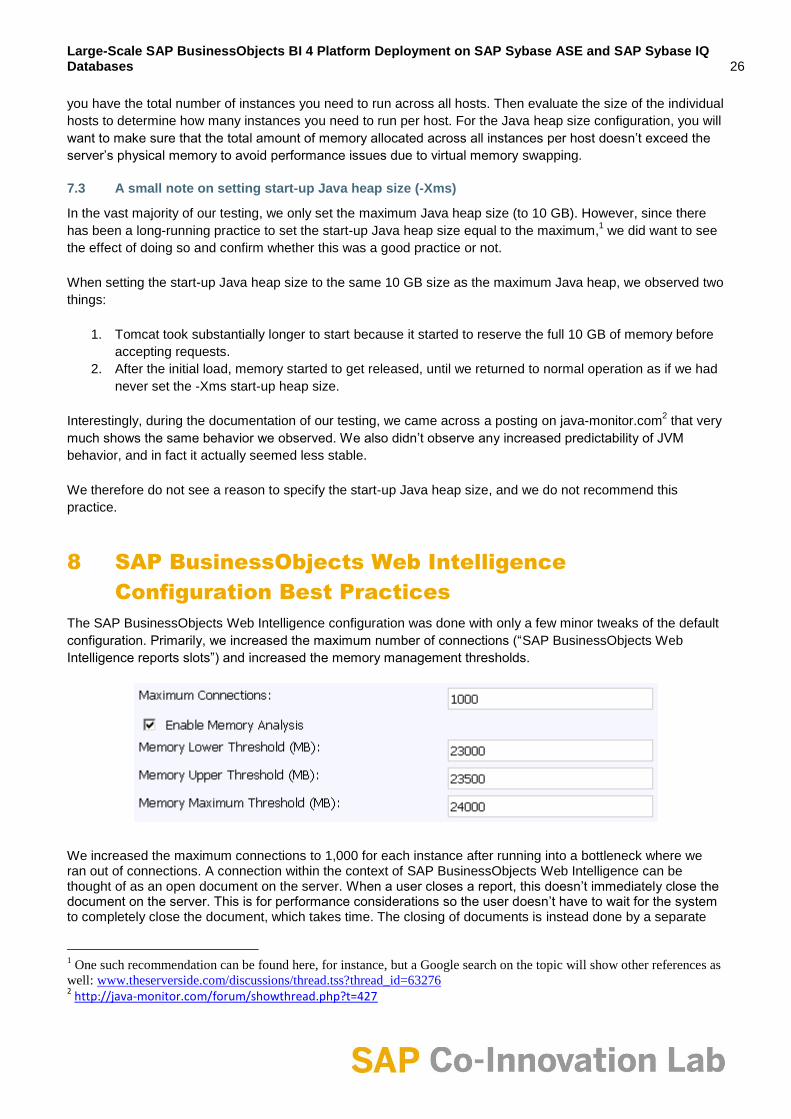
The SAP BusinessObjects Web Intelligence configuration was done with only a few minor tweaks of the default
configuration. Primarily, we increased the maximum number of connections (“SAP BusinessObjects Web
Intelligence reports slots”) and increased the memory management thresholds.
We increased the maximum connections to 1,000 for each instance after running into a bottleneck where we ran out of connections. A connection within the context of SAP BusinessObjects Web Intelligence can be thought of as an open document on the server. When a user closes a report, this doesn’t immediately close the document on the server. This is for performance considerations so the user doesn’t have to wait for the system to completely close the document, which takes time. The closing of documents is instead done by a separate
1 One such recommendation can be found here, for instance, but a Google search on the topic will show other references as
well: www.theserverside.com/discussions/thread.tss?thread_id=63276 2 http://java-monitor.com/forum/showthread.php?t=427

Large-Scale SAP BusinessObjects BI 4 Platform Deployment on SAP Sybase ASE and SAP Sybase IQ Databases 27
pooling thread, while end users are already making new requests on the system. This means that the documents remain open a bit longer beyond the user requests to close them – that is, until they are closed by the pooling thread. As a result, we need more connections than the number of documents processed at a given time. Under high load, therefore, the opened and not-yet-closed documents across all SAP BusinessObjects Web Intelligence instances in the environment are likely to be higher than the number of concurrent users making requests on the system. When we exceed the number of available connections, this could lead to system instability, and the system stops accepting further requests until it has forced a cleanup of resources.
In our situation, running with 10,000 concurrent users and 30 SAP BusinessObjects Web Intelligence instances,
we found a peak of 19,229 open documents in the environment, as the graph below illustrates.
Seeing this top number gives us a rough indication how many connections we need. By taking the total number
of connections and dividing it by the number of SAP BusinessObjects Web Intelligence instances, we have an
initial guideline for what this number should be. When we divide 19,229 by 30, we get 641 connections.
However, we need some leeway, as not all servers are equally busy at all times. We tried a test with 700
connections per SAP BusinessObjects Web Intelligence instance but still occasionally encountered this
problem, as we found that some SAP BusinessObjects Web Intelligence instances would still reach the 700
number.3 Once we raised the number of open connections to 1,000, we no longer encountered this issue.
With the memory analysis, we also set the threshold so high that it was unlikely we would ever reach it. The
“Memory Upper Threshold” parameter is used by SAP BusinessObjects Web Intelligence as a protection to
reject new requests (manifested by the “Server is busy” error message). When this threshold is reached, SAP
BusinessObjects Web Intelligence will stop accepting further requests, remove sessions still held in its cache,
and stop any ongoing current calculations in cubes. The threshold should be set to lower than the physical
memory and higher than the real memory consumption for the instance. In our situation, the total memory
consumption for the server running five SAP BusinessObjects Web Intelligence instances only got to about 24
GB, half of the available memory on each host.
Obviously, with five SAP BusinessObjects Web Intelligence instances per host, eventually the total memory
would exceed the actual physical memory on the server, but given the actual memory consumption, we never
came close to reaching any of these thresholds.
3 SAP BusinessObjects Web Intelligence instances operate independently from each other, and the only system
component that ties them together is the CMS. The CMS cluster decides which session is handled by which SAP BusinessObjects Web Intelligence instance on the basis of existing server load. Each SAP BusinessObjects Web Intelligence instance therefore grows its number of open documents independently, and closes documents when instructed to do so by the pooling thread. There is a time factor involved in this, so individual instances can grow their list of open documents before receiving the instructions to close documents. Such imbalance is unlikely to be seen in small environments but can certainly manifest itself in a large environment such as this one.
Large-Scale SAP BusinessObjects BI 4 Platform Deployment on SAP Sybase ASE and SAP Sybase IQ Databases 28
In a live production environment, it is wise to set these memory thresholds high enough so that those thresholds will not be reached easily. At same time, ensure the upper threshold is lower than machine physical memory in order to avoid any instability or performance impact.
However, be sure not to set the thresholds so low that they are reached easily. In a live production environment
where load varies, it is possible to survive a “Server is busy” condition until the system has retrieved memory by
closing documents, clearing its session cache, and so on. However, in a load test where the load is constantly
at maximum, never varying or experiencing a “breathing space,” this will force remaining SAP BusinessObjects
Web Intelligence servers to handle the requests, typically forcing them into the same condition. We would
recommend, therefore, setting thresholds high enough so that the condition is not triggered other than in the
most extreme circumstances.
Deciding on the right number of instances for the SAP BusinessObjects Web Intelligence processing server per
host follows this kind of thinking: throughput is slightly better with fewer instances and higher number of
connections, while stability and fault tolerance improve when we run more instances. We therefore want to run
the number of instances we need, without having an excessive number of instances, but also without raising the
number of connections so high that an individual process needs to handle an enormous amount of reports.
However, we also want to make sure we make full use of available hardware.
As mentioned above, 1,000 connections worked out well for us during testing. We would not recommend going
higher on the number of connections without thoroughly testing for stability. Our situation was somewhat unique
since we had a large amount of hardware available for us to go through the consolidation exercise. This is
unlikely to be the case in typical implementations. However, the same principles apply: we consolidated the
SAP BusinessObjects Web Intelligence server instances on increasingly fewer hosts running the same user
load, until the CPU (or memory, in situations where the hosts have less physical memory available) reached an
appropriate server load. Rather than first settling on the number of users (as in our tests), you would run load
tests of increasing numbers of users while monitoring closely for any throughput bottlenecks, exhausting the
number of available connections and CPU usage, and increase the number of instances as appropriate, until
the right number of users is achieved and CPU usage on average is in the 60% range.
There is one other reason to run multiple instances per host that is especially relevant in system landscapes
where servers are of different size. In that scenario, the number of instances can help balance the load
appropriately over the various hosts in the landscape. Suppose we have three servers with 24 CPU cores and
48 GB of RAM, as well as two servers with 16 CPUs and 36 GB RAM. We could decide to run five SAP
BusinessObjects Web Intelligence instances on the larger servers and three instances on the smaller servers.
9 BI Platform Sizing Verification
After we settled on our configuration based on a number of successful tests with the 10,000-user load, we can
perform a sizing verification by comparing the actual environment with whatever a sizing exercise comes up
with.
The official way of doing BI 4 platform sizing is through an SAP Application Performance Standard or SAPS
calculation. This standard is a hardware-independent unit that describes the performance of a system
configuration in the SAP environment. It is derived from the sales and distribution benchmark, where 100 SAPS
is defined as 2,000 fully business processed order line items per hour. For BI platform SAPS sizing, SAP ran a
number of sizing tests on hardware of known SAPS in order to calculate the required SAPS for a particular
usage scenario and a particular load. The outcomes of those tests have resulted in the BI 4 Sizing Estimator
and Companion Guide that were referenced earlier in this document.
Large-Scale SAP BusinessObjects BI 4 Platform Deployment on SAP Sybase ASE and SAP Sybase IQ Databases 29
Unfortunately, there were upper limits to those tests, and just as the size of the system itself had already gotten
us into uncharted territory, we couldn’t rely on previous tests or sizing estimates for substantially fewer
concurrent users to size the environment using SAPS.4
In order to be able to provide a sizing estimate at all, we reverted back to the old method of “CPU units” in order
to be able to compare any estimate with our eventual outcome. This sizing method was the standard for
previous versions of the BI platform (BOE 3.x, XI R2, XI R1, CE10, and so on) but does not take a number of
architectural changes into account that were introduced with the BI 4 release. CPU units are used so we can
compare different multicore CPUs meaningfully. To calculate a CPU unit, take the number of cores in a
multicore CPU, count the first as one CPU, and count the remainder as half a CPU. (The same approach is
used for licensing purposes as well). That means a dual-core CPU counts as 1.5 CPU units, a quad-core as 2.5
(1 + 3 x 0.5), and a hexacore – the CPU in our Supermicro TwinBlades – as 3.5 (1 + 5 x 0.5).
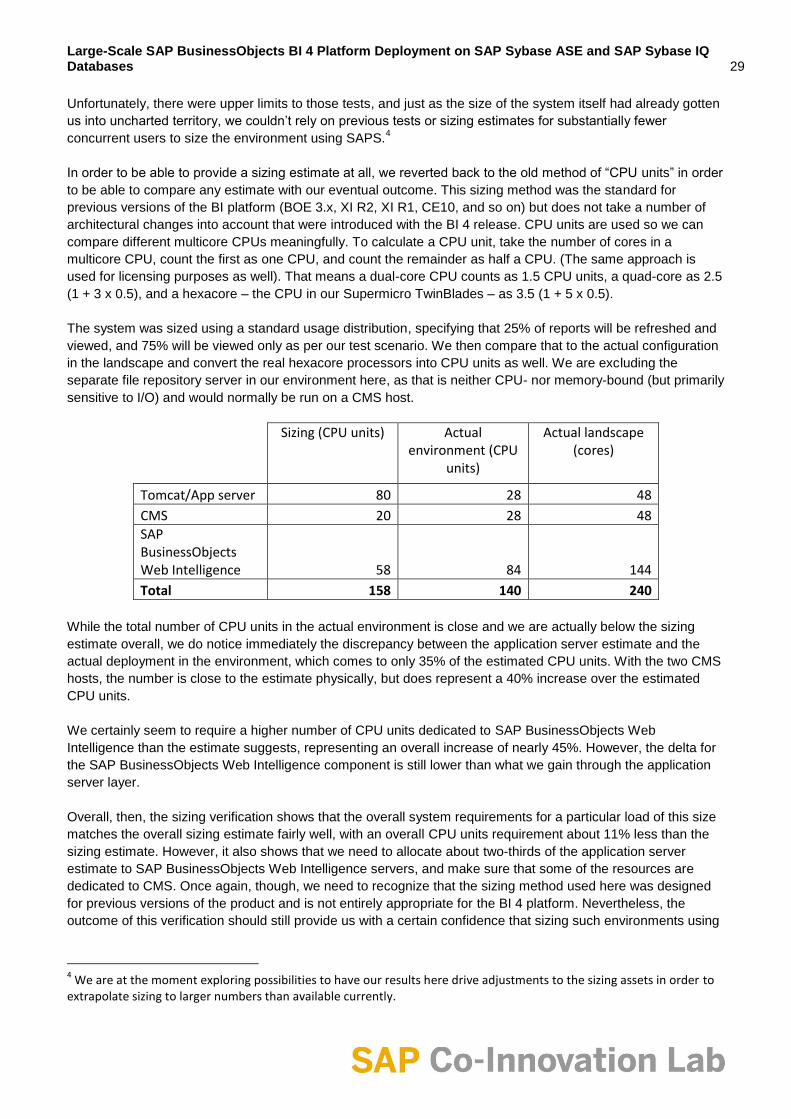
The system was sized using a standard usage distribution, specifying that 25% of reports will be refreshed and
viewed, and 75% will be viewed only as per our test scenario. We then compare that to the actual configuration
in the landscape and convert the real hexacore processors into CPU units as well. We are excluding the
separate file repository server in our environment here, as that is neither CPU- nor memory-bound (but primarily
sensitive to I/O) and would normally be run on a CMS host.
Sizing (CPU units) Actual environment (CPU
units)
Actual landscape (cores)
Tomcat/App server 80 28 48
CMS 20 28 48
SAP BusinessObjects Web Intelligence 58 84 144
Total 158 140 240
While the total number of CPU units in the actual environment is close and we are actually below the sizing
estimate overall, we do notice immediately the discrepancy between the application server estimate and the
actual deployment in the environment, which comes to only 35% of the estimated CPU units. With the two CMS
hosts, the number is close to the estimate physically, but does represent a 40% increase over the estimated
CPU units.
We certainly seem to require a higher number of CPU units dedicated to SAP BusinessObjects Web
Intelligence than the estimate suggests, representing an overall increase of nearly 45%. However, the delta for
the SAP BusinessObjects Web Intelligence component is still lower than what we gain through the application
server layer.
Overall, then, the sizing verification shows that the overall system requirements for a particular load of this size
matches the overall sizing estimate fairly well, with an overall CPU units requirement about 11% less than the
sizing estimate. However, it also shows that we need to allocate about two-thirds of the application server
estimate to SAP BusinessObjects Web Intelligence servers, and make sure that some of the resources are
dedicated to CMS. Once again, though, we need to recognize that the sizing method used here was designed
for previous versions of the product and is not entirely appropriate for the BI 4 platform. Nevertheless, the
outcome of this verification should still provide us with a certain confidence that sizing such environments using
4 We are at the moment exploring possibilities to have our results here drive adjustments to the sizing assets in order to
extrapolate sizing to larger numbers than available currently.
Large-Scale SAP BusinessObjects BI 4 Platform Deployment on SAP Sybase ASE and SAP Sybase IQ Databases 30
this method is within reason, until we have the opportunity to expand the sizing estimator for such large system
landscapes.
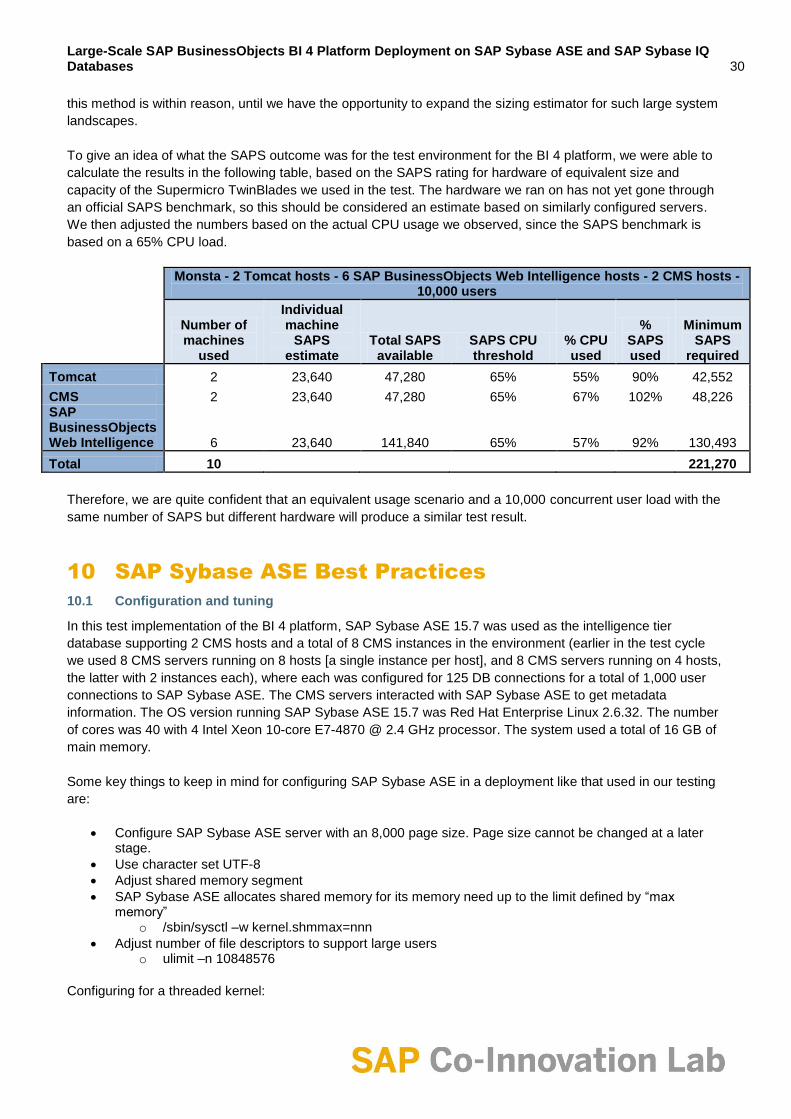
To give an idea of what the SAPS outcome was for the test environment for the BI 4 platform, we were able to
calculate the results in the following table, based on the SAPS rating for hardware of equivalent size and
capacity of the Supermicro TwinBlades we used in the test. The hardware we ran on has not yet gone through
an official SAPS benchmark, so this should be considered an estimate based on similarly configured servers.
We then adjusted the numbers based on the actual CPU usage we observed, since the SAPS benchmark is
based on a 65% CPU load.
Monsta - 2 Tomcat hosts - 6 SAP BusinessObjects Web Intelligence hosts - 2 CMS hosts -
10,000 users
Number of machines
used
Individual machine
SAPS estimate
Total SAPS available
SAPS CPU threshold
% CPU used
% SAPS used
Minimum SAPS
required
Tomcat 2 23,640 47,280 65% 55% 90% 42,552
CMS 2 23,640 47,280 65% 67% 102% 48,226 SAP BusinessObjects Web Intelligence 6 23,640 141,840 65% 57% 92% 130,493
Total 10
221,270
Therefore, we are quite confident that an equivalent usage scenario and a 10,000 concurrent user load with the
same number of SAPS but different hardware will produce a similar test result.
10 SAP Sybase ASE Best Practices
10.1 Configuration and tuning
In this test implementation of the BI 4 platform, SAP Sybase ASE 15.7 was used as the intelligence tier
database supporting 2 CMS hosts and a total of 8 CMS instances in the environment (earlier in the test cycle
we used 8 CMS servers running on 8 hosts [a single instance per host], and 8 CMS servers running on 4 hosts,
the latter with 2 instances each), where each was configured for 125 DB connections for a total of 1,000 user
connections to SAP Sybase ASE. The CMS servers interacted with SAP Sybase ASE to get metadata
information. The OS version running SAP Sybase ASE 15.7 was Red Hat Enterprise Linux 2.6.32. The number
of cores was 40 with 4 Intel Xeon 10-core E7-4870 @ 2.4 GHz processor. The system used a total of 16 GB of
main memory.
Some key things to keep in mind for configuring SAP Sybase ASE in a deployment like that used in our testing
are:
Configure SAP Sybase ASE server with an 8,000 page size. Page size cannot be changed at a later stage.
Use character set UTF-8
Adjust shared memory segment
SAP Sybase ASE allocates shared memory for its memory need up to the limit defined by “max memory”
o /sbin/sysctl –w kernel.shmmax=nnn
Adjust number of file descriptors to support large users o ulimit –n 10848576
Configuring for a threaded kernel:

Large-Scale SAP BusinessObjects BI 4 Platform Deployment on SAP Sybase ASE and SAP Sybase IQ Databases 31
Used new kernel that uses single-process thread-based model o Threaded kernel streamlined I/O handling
Each engine is a thread running as a single process
20 engines were configured o Engines/threads executes user tasks
Additional threads for handling I/Os o 2 threads for disks I/Os o 3 threads for network I/Os
Configuration used in benchmark
[Thread Pool:syb_default_pool] o Number of threads = 20 o Idle timeout = 1000
[Thread Pool:syb_blocking_pool] o Number of threads = 4
Tuning tips for a threaded kernel:
Keep data server engines on as few sockets as possible
Cross-socket migration is not CPU cache friendly o Use numactl to bind engines to sockets
I/O threads consume CPU cycles; factor I/O thread CPU consumption into configuration
Engines do less work, so you may need fewer engines o This can offset I/O CPU load
Look in Sysmon report for high I/O busy counter, unbalanced engine CPU or network usage
You may need to adjust file descriptors for large-scale user configuration o ulimit –S/H –n 1048576
Don’t overconfigure the number of engines; leave some breathing room for OS tasks
11 SAP Sybase IQ Best Practices
11.1 Configuration and tuning
In this project, SAP Sybase IQ was used as the reporting database for the system. It was comprised of six SAP
Sybase IQ servers, each configured for multiplex: one coordinator and five readers. The BI servers interacted
with the SAP Sybase IQ servers for report refreshes, and one common database was used by all the servers.
Things learned from the project relevant to SAP Sybase IQ installations include:
Configure SAP Sybase IQ server with 128,000 page size; page size cannot be changed at a later stage
Use character set UTF-8
Adjust shared memory segment
o The SAP Sybase IQ memory map is fixed at server start
o The total memory allocated to IQ should be 70% of available memory if the database is on file
system
For query intensive application, Main/Temp should be 30/70
Set –gm parameter to twice the number of expected users
Use the SAP Sybase IQ Sizing Guide for detailed configuration tips
For a multiplex configuration such as the one featured in our test bed, keep the following things in mind:
SAP Sybase IQ multiplex configuration was used to consolidate use of a single database
One coordinator and 19 reader nodes were configured
o The number of reader nodes was determined via load estimates at the start of the benchmark.
Based on findings, the number of reader nodes could be greatly reduced.
All nodes used same hardware and configuration
Apart from memory allocation and number of users, no other parameters were changed
Large-Scale SAP BusinessObjects BI 4 Platform Deployment on SAP Sybase ASE and SAP Sybase IQ Databases 32
Index advisor was used to create additional indexes for optimal query performance
SAP Sybase IQ 15.3 was used as it was the generally available release at the time the project started.
SAP Sybase IQ 15.4 will give the same or better results.
Configuration used in the project:
o -iqmc 10,000 (10 GB for main storage)
o -iqtc 26,000 (26 GB for temp storage)
o -gm 300 (maximum user count 300)
o -c 128m (128 MB memory for catalog)
Further tuning tips:
In query-dominated configuration, temp storage is used to keep pages in memory. Disk read is only
forced when pages are not in temp memory. So, increasing the temp allocation can enhance query
efficiency.
Main space is mainly used for sorting and catalog. If the queries use massive sorting and aggregation
and limited output, trading some temporary cache from temp to main may be needed.
The SAP Sybase IQ Sizing Guide is solely devoted to configuration and tuning tips.
Things to keep in mind while configuring SAP Sybase IQ for such an environment include:
Make sure that adequate memory is allocated to SAP Sybase IQ at start-up.
o SAP Sybase IQ does not consume memory as needed. So if there is not enough memory when
the server starts, performance may suffer.
No other applications should run on the server.
o The SAP Sybase IQ model is based on it being the only application on the server.
o Running other applications may result in memory starvation and degraded performance.
12 Project Management and Administrative Best
Practices
12.1 An ecosystem-based approach
This was a major project based upon a number of dimensions ranging from an attempt to verify things that had
never been attempted before, to orchestrating people, processes, and technology spread across four major
SAP organizations and multiple firms, to overseeing a virtual team comprised of several subject matter and
domain-level experts. While the SAP Co-Innovation Lab is organized and equipped to manage co-innovation
efforts, overall project size and complexity always present unique challenges. As such, some of the lessons
learned from this project team are extended here to any team saddled with the goal of pulling together a large-
scale SAP BusinessObjects BI 4 platform implementation:
The SAP Co-Innovation Lab infrastructure team provided overall guidance for specifying requirements
for provisioning the test environment in the SAP Co-Innovation Lab computing center.
It was essential to ensure all application architects, subject matter experts, and key partners (Red Hat,
Intel, Supermicro,F5, and SOASTA) worked together with the data center engineers to understand
project requirements, goals, and objectives.
Project planning is crucial, as is making sure enough time is allocated for a project design workshop so
that everyone critical to the project is aware of how specific requirements relate to key dependencies:
o Hardware and software engineers do not always fluently communicate with one another.
o Facilitate communications with use of a suitable online collaboration platform. Do not rely upon
conference calls and e-mail alone.
o Tacit knowledge is valuable – document ideas, concerns, and key findings.
Large-Scale SAP BusinessObjects BI 4 Platform Deployment on SAP Sybase ASE and SAP Sybase IQ Databases 33
Leverage social media tools to regularly communicate key milestones and as an aid to tap into more
subject matter experts in times when the core team hits roadblocks inhibiting the ability to problem
solve.
13 Conclusion
With all the chatter about Big Data today, it is clear that companies everywhere are now forced to grapple with
velocity, volume, and variation of data and will continue to do so for the foreseeable future. The data isn’t going
to go away.
In addition, as more and more companies learn to benefit from advanced analytics and as the technology
improves in ways that simplify analysis and visualization, more everyday business users will want and require
access to this data. This project served to forge a path forward in demonstrating the exceptional scale-out
capacity of the SAP BusinessObjects BI 4 platform over SAP Sybase databases running on commercially
available enterprise data center–ready hardware.
We have undertaken this project at a point in time when there is a demonstrated need to convey confidence in
the fact that the system sits prepared to scale to the needs of businesses everywhere as they seek to gain new
and valuable insights from extremely large data sets of both structured and unstructured data. Working with Big
Data is a challenge today, and yet that challenge is rapidly being overcome. As this occurs, it will be imperative
that more users can access data from anywhere at any time, and these first proof points are an indication that
such wide-scale use is achievable.
Copyright/Trademark