lecture 10 the high growth era
TRANSCRIPT
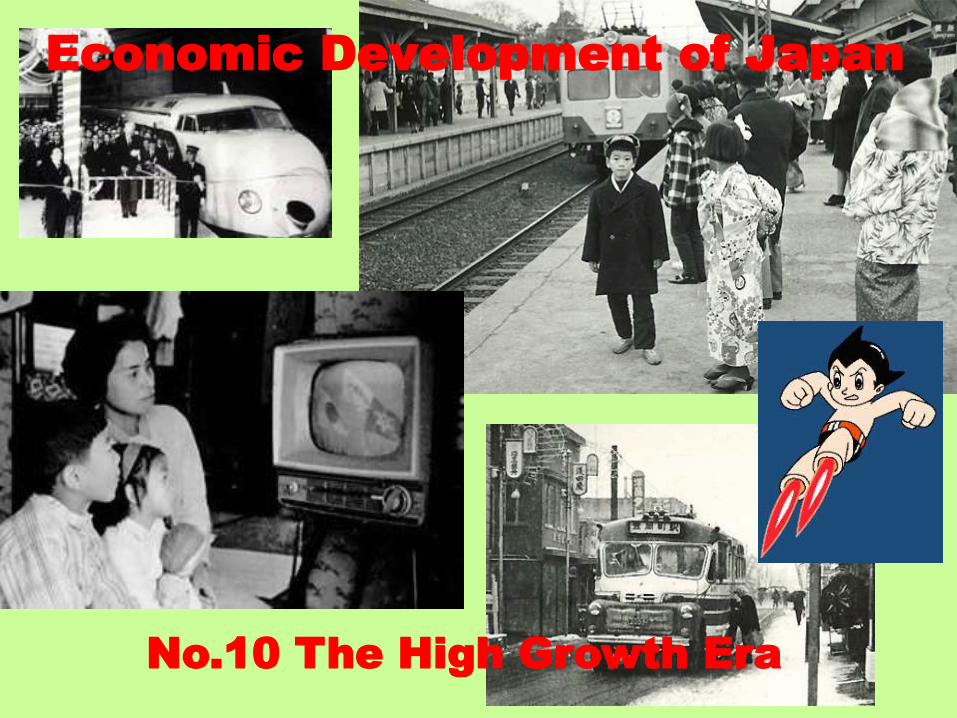
Economic Development of Japan
No.10 The High Growth Era
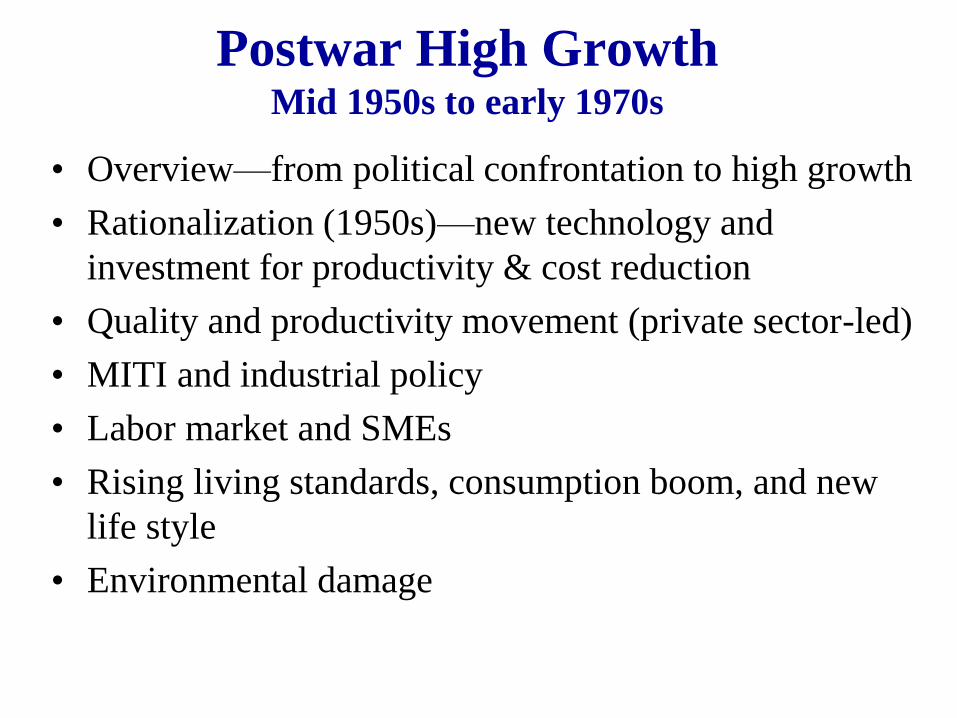
Postwar High GrowthMid 1950s to early 1970s
• Overview—from political confrontation to high growth
• Rationalization (1950s)—new technology and
investment for productivity & cost reduction
• Quality and productivity movement (private sector-led)
• MITI and industrial policy
• Labor market and SMEs
• Rising living standards, consumption boom, and new
life style
• Environmental damage
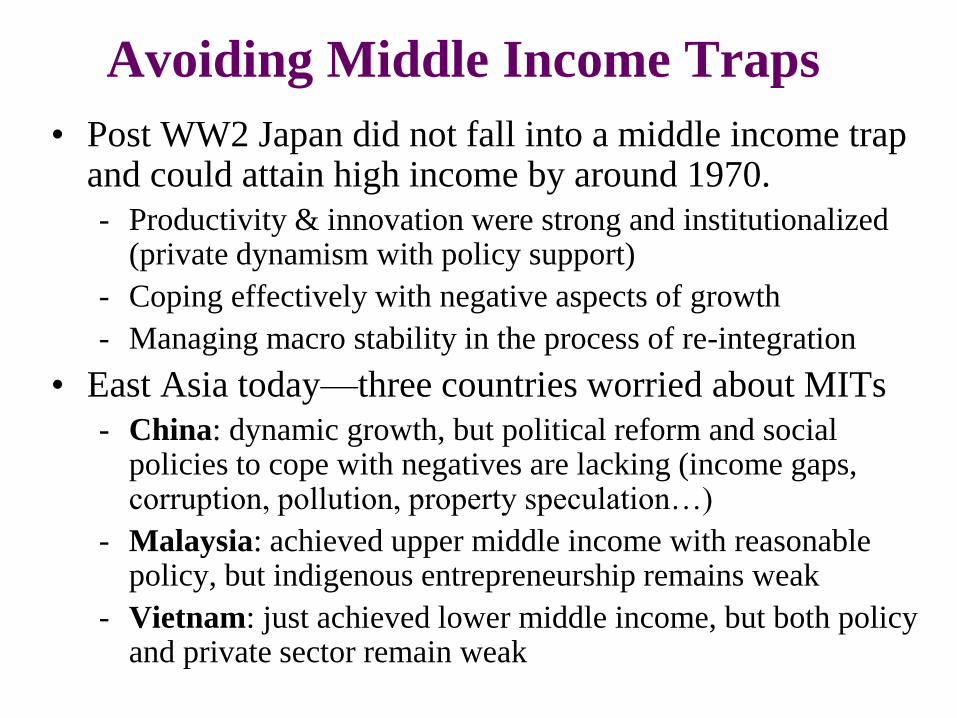
Avoiding Middle Income Traps
• Post WW2 Japan did not fall into a middle income trap and could attain high income by around 1970.
- Productivity & innovation were strong and institutionalized (private dynamism with policy support)
- Coping effectively with negative aspects of growth
- Managing macro stability in the process of re-integration
• East Asia today—three countries worried about MITs
- China: dynamic growth, but political reform and social policies to cope with negatives are lacking (income gaps, corruption, pollution, property speculation…)
- Malaysia: achieved upper middle income with reasonable policy, but indigenous entrepreneurship remains weak
- Vietnam: just achieved lower middle income, but both policy and private sector remain weak
Cum
ula
tiv
e his
tory
, E
do a
chie
vem
ents
,
nat
ional
unit
y a
nd n
atio
nal
ism
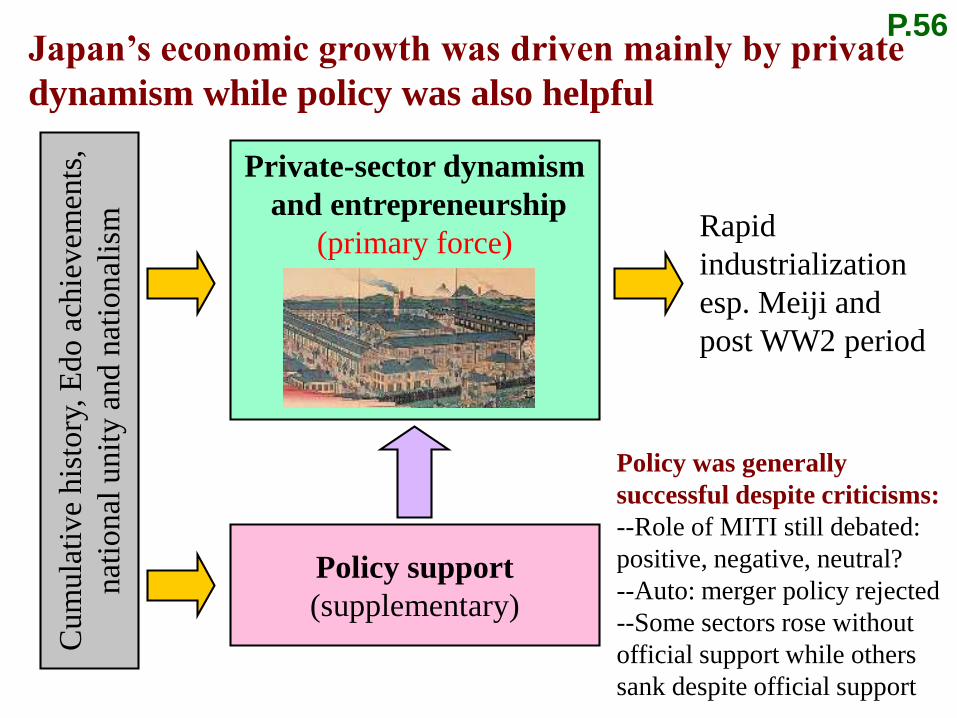
Private-sector dynamism
and entrepreneurship
(primary force)
Policy support
(supplementary)
Japan’s economic growth was driven mainly by private
dynamism while policy was also helpful
Policy was generally
successful despite criticisms:
--Role of MITI still debated:
positive, negative, neutral?
--Auto: merger policy rejected
--Some sectors rose without
official support while others
sank despite official support
Rapid
industrialization
esp. Meiji and
post WW2 period
P.56
-4%
-2%
0%
2%
4%
6%
8%
10%
12%
14%19
53
1956
1959
1962
1965
1968
1971
1974
1977
1980
1983
1986
1989
1992
1995
1998
2001
2004
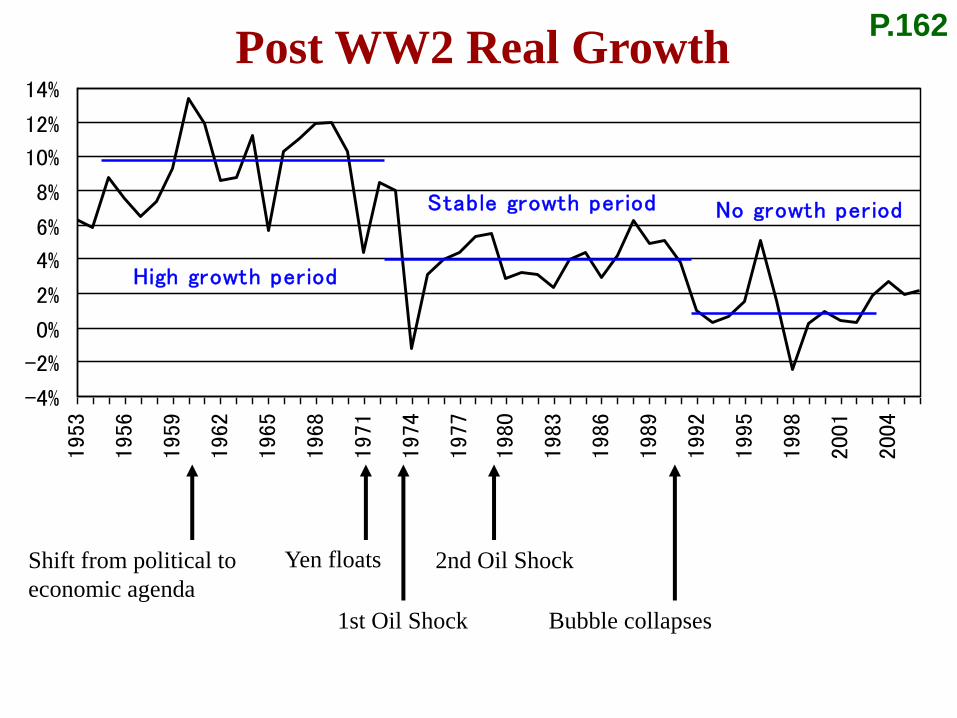
High growth period
Stable growth period No growth period
Shift from political to
economic agenda
Post WW2 Real Growth
1st Oil Shock
2nd Oil ShockYen floats
Bubble collapses
P.162
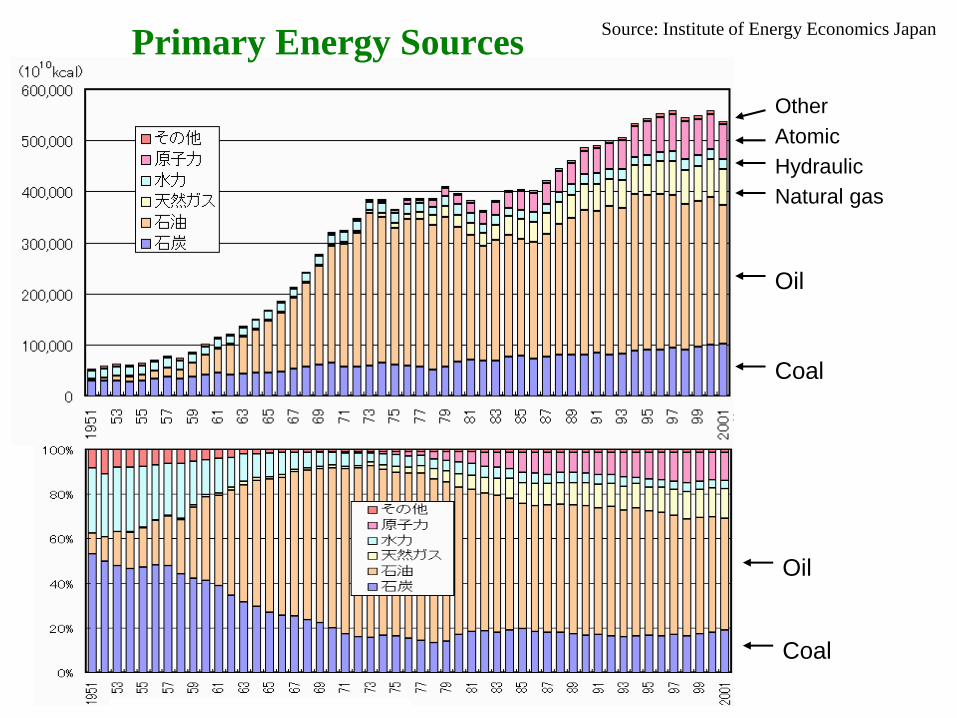
Primary Energy Sources
Coal
Oil
Natural gas
Hydraulic
Atomic
Other
Coal
Oil
Source: Institute of Energy Economics Japan
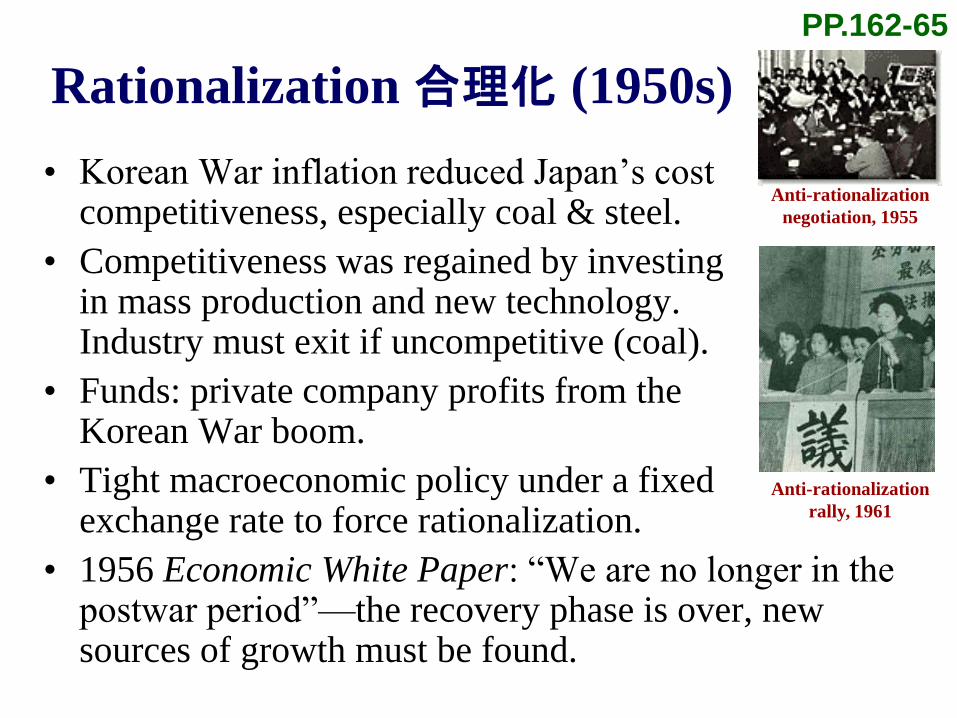
Rationalization 合理化 (1950s)
• Korean War inflation reduced Japan’s cost competitiveness, especially coal & steel.
• Competitiveness was regained by investingin mass production and new technology.Industry must exit if uncompetitive (coal).
• Funds: private company profits from theKorean War boom.
• Tight macroeconomic policy under a fixedexchange rate to force rationalization.
• 1956 Economic White Paper: “We are no longer in the postwar period”—the recovery phase is over, new sources of growth must be found.
PP.162-65
Anti-rationalization
negotiation, 1955
Anti-rationalization
rally, 1961
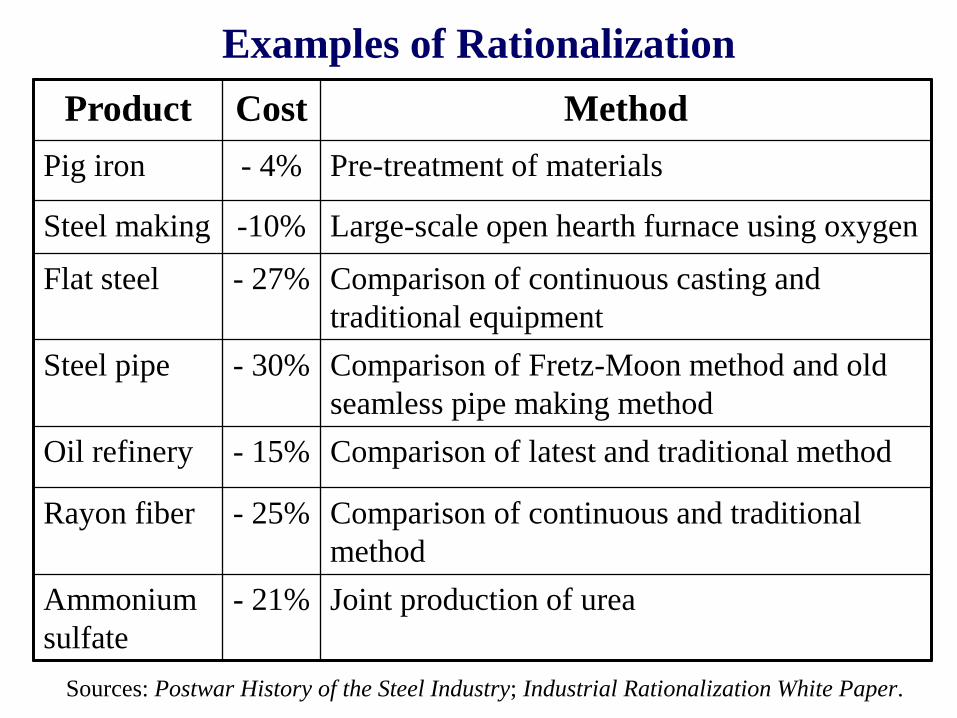
Product Cost Method
Pig iron - 4% Pre-treatment of materials
Steel making -10% Large-scale open hearth furnace using oxygen
Flat steel - 27% Comparison of continuous casting and
traditional equipment
Steel pipe - 30% Comparison of Fretz-Moon method and old
seamless pipe making method
Oil refinery - 15% Comparison of latest and traditional method
Rayon fiber - 25% Comparison of continuous and traditional
method
Ammonium
sulfate
- 21% Joint production of urea
Examples of Rationalization
Sources: Postwar History of the Steel Industry; Industrial Rationalization White Paper.
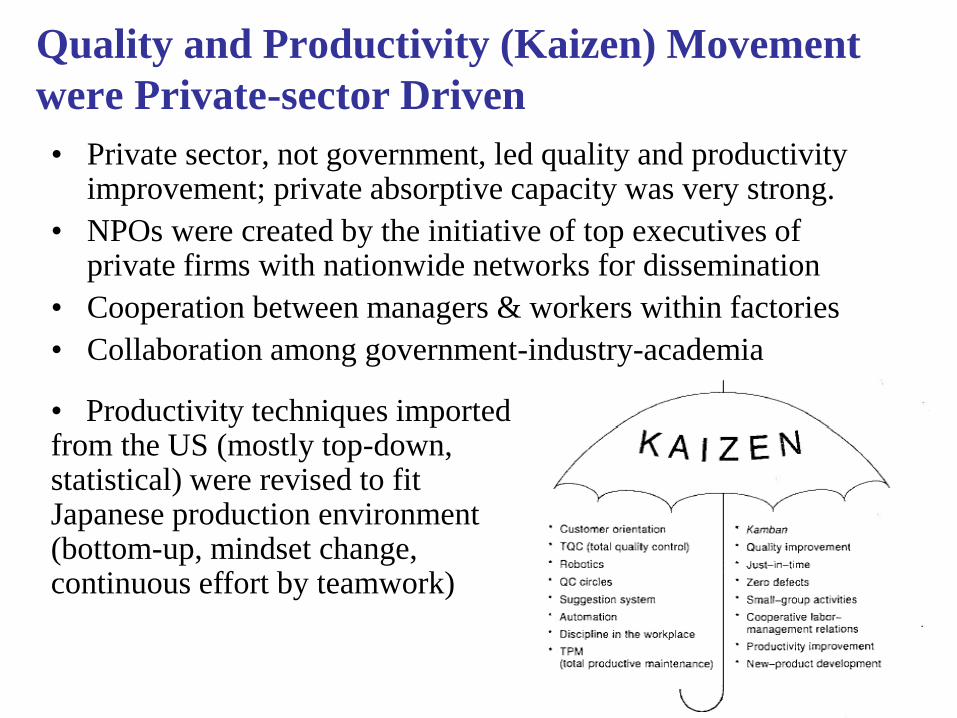
Quality and Productivity (Kaizen) Movement
were Private-sector Driven
• Private sector, not government, led quality and productivity improvement; private absorptive capacity was very strong.
• NPOs were created by the initiative of top executives of private firms with nationwide networks for dissemination
• Cooperation between managers & workers within factories
• Collaboration among government-industry-academia
• Productivity techniques imported from the US (mostly top-down, statistical) were revised to fit Japanese production environment (bottom-up, mindset change, continuous effort by teamwork)
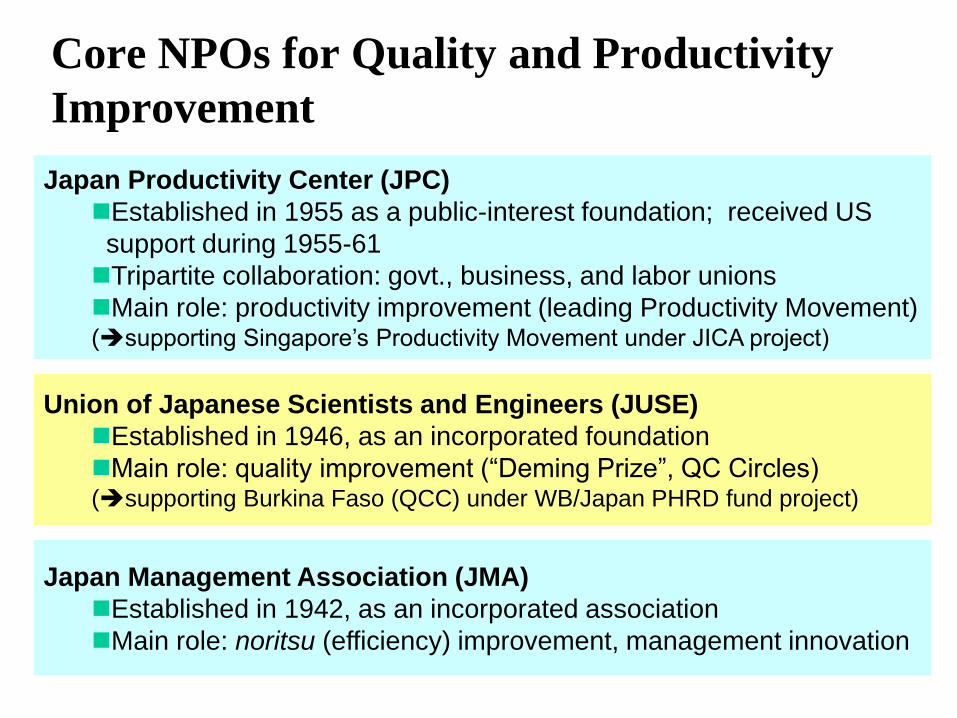
Core NPOs for Quality and Productivity
Improvement
Japan Productivity Center (JPC)
Established in 1955 as a public-interest foundation; received US
support during 1955-61
Tripartite collaboration: govt., business, and labor unions
Main role: productivity improvement (leading Productivity Movement) (supporting Singapore’s Productivity Movement under JICA project)
Union of Japanese Scientists and Engineers (JUSE)
Established in 1946, as an incorporated foundation
Main role: quality improvement (“Deming Prize”, QC Circles)(supporting Burkina Faso (QCC) under WB/Japan PHRD fund project)
Japan Management Association (JMA)
Established in 1942, as an incorporated association
Main role: noritsu (efficiency) improvement, management innovation
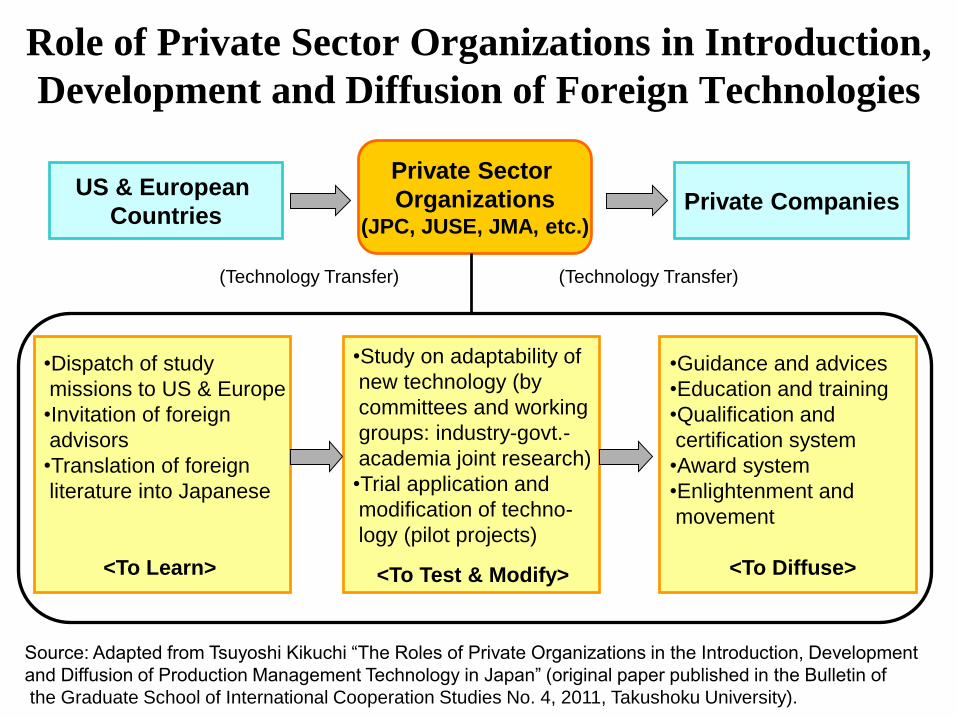
Role of Private Sector Organizations in Introduction,
Development and Diffusion of Foreign Technologies
US & European
CountriesPrivate Companies
Source: Adapted from Tsuyoshi Kikuchi “The Roles of Private Organizations in the Introduction, Development
and Diffusion of Production Management Technology in Japan” (original paper published in the Bulletin of
the Graduate School of International Cooperation Studies No. 4, 2011, Takushoku University).
Private Sector
Organizations(JPC, JUSE, JMA, etc.)
•Dispatch of study
missions to US & Europe
•Invitation of foreign
advisors
•Translation of foreign
literature into Japanese
<To Learn>
•Study on adaptability of
new technology (by
committees and working
groups: industry-govt.-
academia joint research)
•Trial application and
modification of techno-
logy (pilot projects)
<To Test & Modify>
•Guidance and advices
•Education and training
•Qualification and
certification system
•Award system
•Enlightenment and
movement
<To Diffuse>
(Technology Transfer) (Technology Transfer)
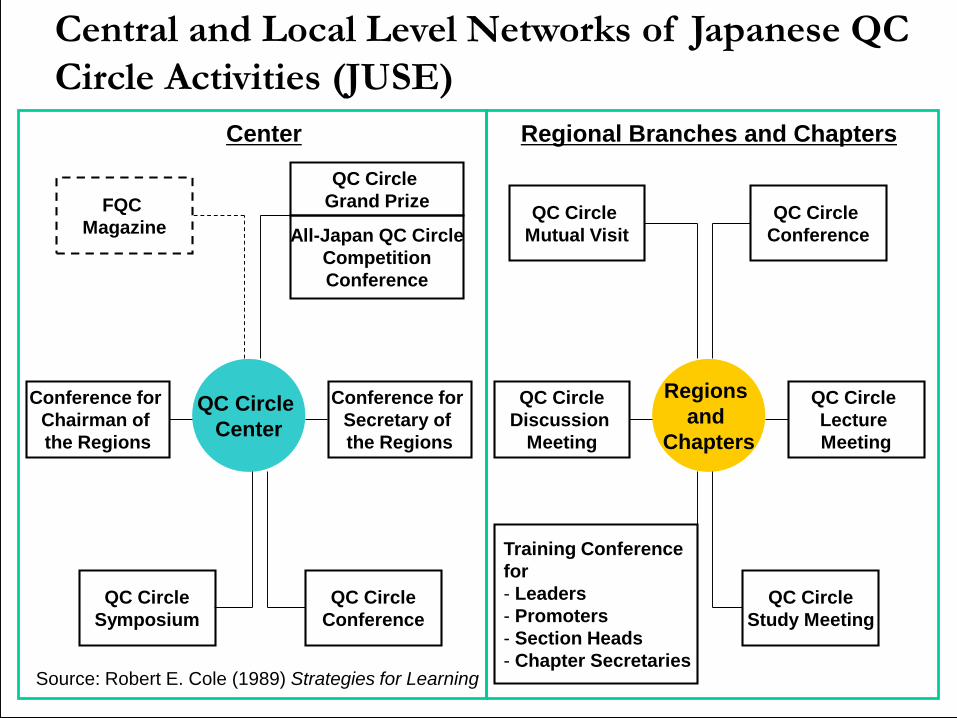
Central and Local Level Networks of Japanese QC
Circle Activities (JUSE)
QC Circle
Center
Conference for
Chairman of
the Regions
QC Circle
Symposium
QC Circle
Conference
Conference for
Secretary of
the Regions
All-Japan QC Circle
Competition
Conference
QC Circle
Grand PrizeFQC
Magazine
Regions
and
Chapters
QC Circle
Lecture
Meeting
QC Circle
Discussion
Meeting
Training Conference
for
- Leaders
- Promoters
- Section Heads
- Chapter Secretaries
QC Circle
Study Meeting
QC Circle
Mutual Visit
QC Circle
Conference
Source: Robert E. Cole (1989) Strategies for Learning
Center Regional Branches and Chapters
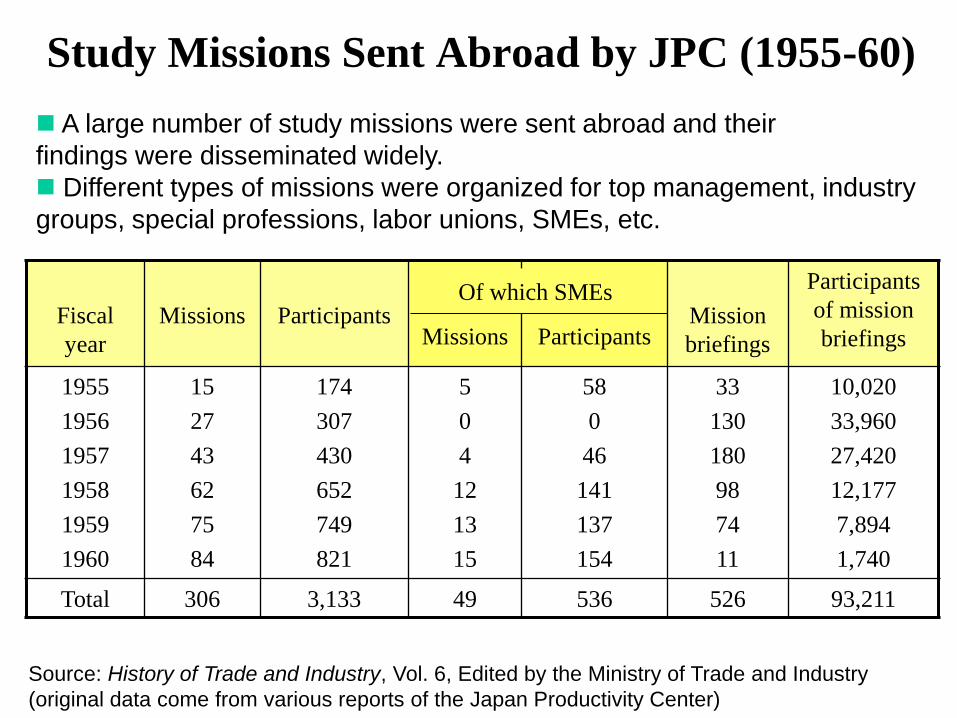
Study Missions Sent Abroad by JPC (1955-60)
Fiscal
year
Missions ParticipantsMissions Participants
Mission
briefings
Participants
of mission
briefings
1955
1956
1957
1958
1959
1960
15
27
43
62
75
84
174
307
430
652
749
821
5
0
4
12
13
15
58
0
46
141
137
154
33
130
180
98
74
11
10,020
33,960
27,420
12,177
7,894
1,740
Total 306 3,133 49 536 526 93,211
Of which SMEs
Source: History of Trade and Industry, Vol. 6, Edited by the Ministry of Trade and Industry
(original data come from various reports of the Japan Productivity Center)
A large number of study missions were sent abroad and their
findings were disseminated widely.
Different types of missions were organized for top management, industry
groups, special professions, labor unions, SMEs, etc.
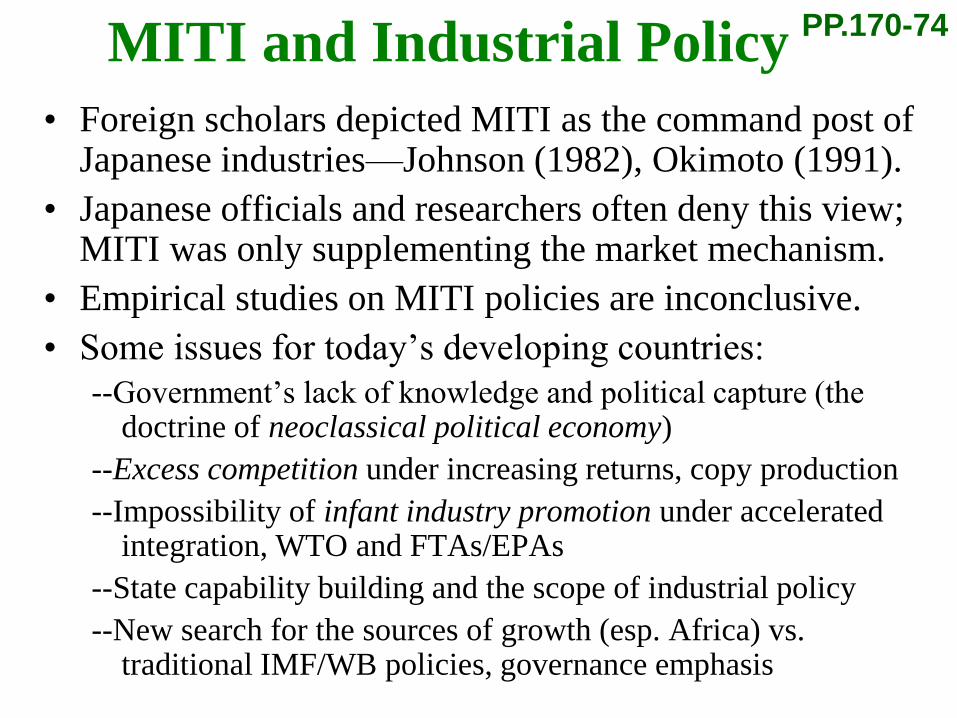
MITI and Industrial Policy
• Foreign scholars depicted MITI as the command post of Japanese industries—Johnson (1982), Okimoto (1991).
• Japanese officials and researchers often deny this view; MITI was only supplementing the market mechanism.
• Empirical studies on MITI policies are inconclusive.
• Some issues for today’s developing countries:
--Government’s lack of knowledge and political capture (the doctrine of neoclassical political economy)
--Excess competition under increasing returns, copy production
--Impossibility of infant industry promotion under accelerated integration, WTO and FTAs/EPAs
--State capability building and the scope of industrial policy
--New search for the sources of growth (esp. Africa) vs. traditional IMF/WB policies, governance emphasis
PP.170-74
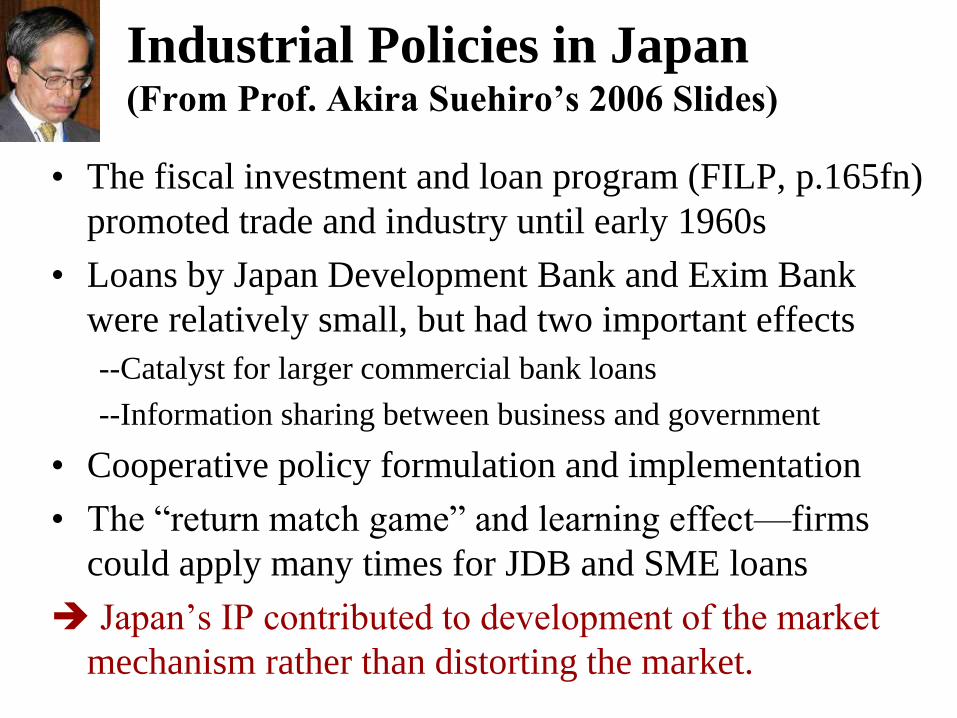
Industrial Policies in Japan(From Prof. Akira Suehiro’s 2006 Slides)
• The fiscal investment and loan program (FILP, p.165fn)
promoted trade and industry until early 1960s
• Loans by Japan Development Bank and Exim Bank
were relatively small, but had two important effects
--Catalyst for larger commercial bank loans
--Information sharing between business and government
• Cooperative policy formulation and implementation
• The “return match game” and learning effect—firms
could apply many times for JDB and SME loans
Japan’s IP contributed to development of the market
mechanism rather than distorting the market.
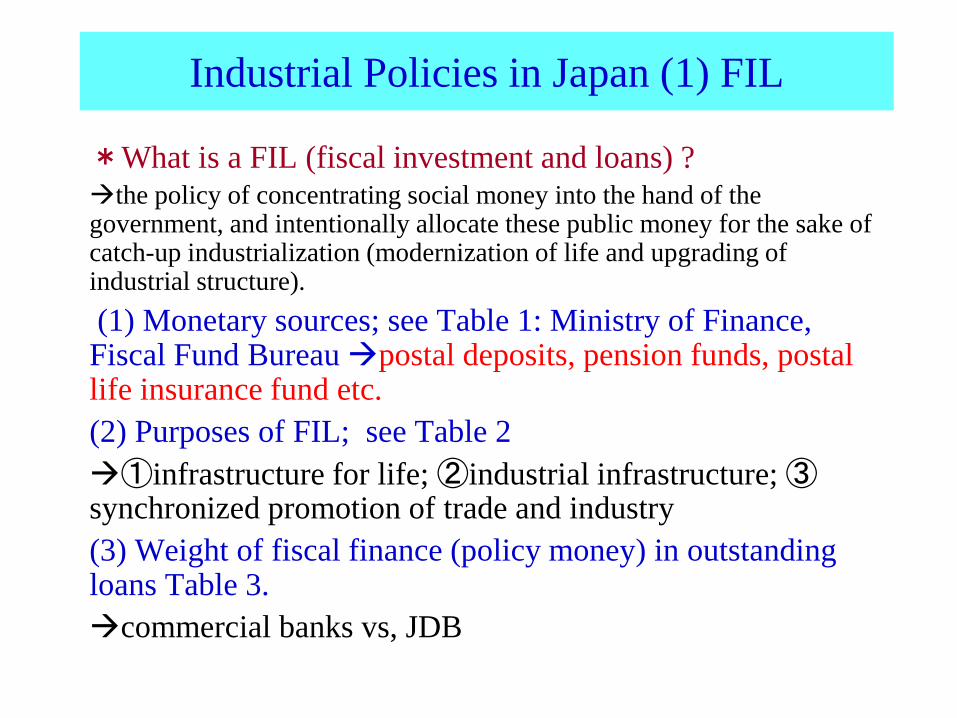
Industrial Policies in Japan (1) FIL
*What is a FIL (fiscal investment and loans) ? the policy of concentrating social money into the hand of the government, and intentionally allocate these public money for the sake of catch-up industrialization (modernization of life and upgrading of industrial structure).
(1) Monetary sources; see Table 1: Ministry of Finance, Fiscal Fund Bureau postal deposits, pension funds, postal life insurance fund etc.
(2) Purposes of FIL; see Table 2
①infrastructure for life; ②industrial infrastructure; ③synchronized promotion of trade and industry
(3) Weight of fiscal finance (policy money) in outstanding loans Table 3.
commercial banks vs, JDB
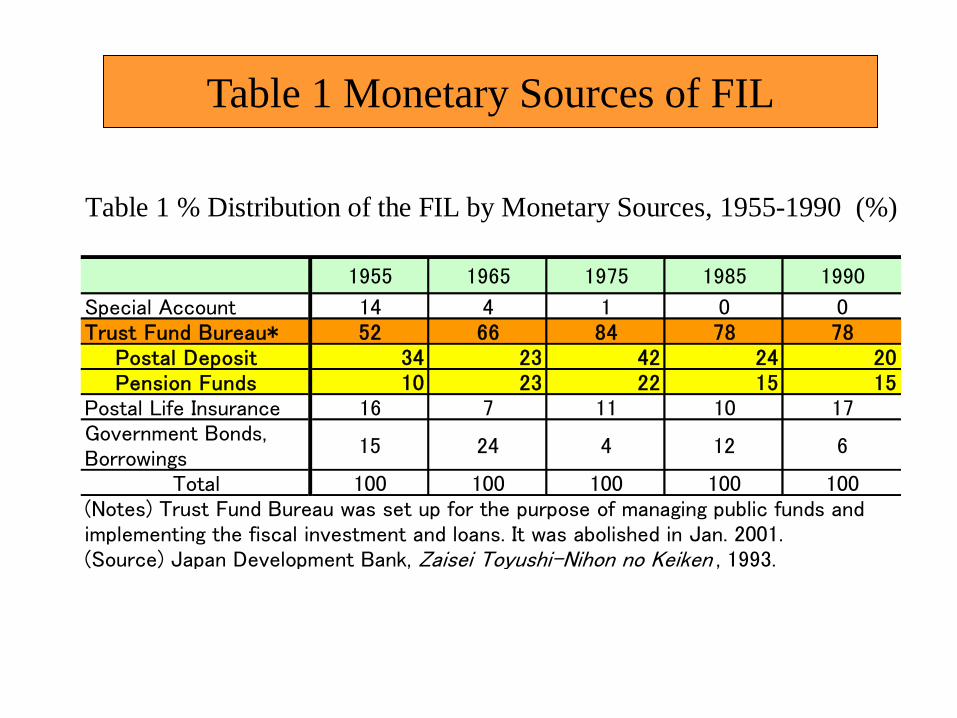
Table 1 Monetary Sources of FIL
1955 1965 1975 1985 1990
Special Account 14 4 1 0 0Trust Fund Bureau* 52 66 84 78 78 Postal Deposit 34 23 42 24 20 Pension Funds 10 23 22 15 15Postal Life Insurance 16 7 11 10 17Government Bonds,Borrowings
15 24 4 12 6
Total 100 100 100 100 100(Notes) Trust Fund Bureau was set up for the purpose of managing public funds andimplementing the fiscal investment and loans. It was abolished in Jan. 2001.(Source) Japan Development Bank, Zaisei Toyushi-Nihon no Keiken , 1993.
Table 1 % Distribution of the FIL by Monetary Sources, 1955-1990 (%)
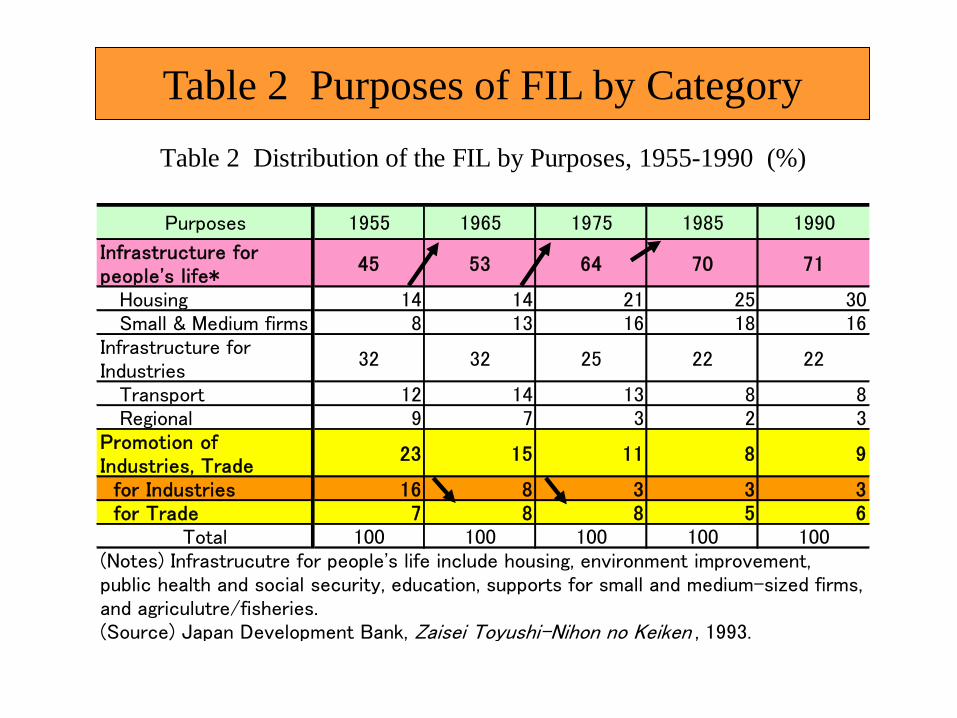
Table 2 Purposes of FIL by Category
Purposes 1955 1965 1975 1985 1990
Infrastructure forpeople's life*
45 53 64 70 71
Housing 14 14 21 25 30 Small & Medium firms 8 13 16 18 16Infrastructure forIndustries
32 32 25 22 22
Transport 12 14 13 8 8 Regional 9 7 3 2 3Promotion ofIndustries, Trade
23 15 11 8 9
for Industries 16 8 3 3 3 for Trade 7 8 8 5 6
Total 100 100 100 100 100(Notes) Infrastrucutre for people's life include housing, environment improvement, public health and social security, education, supports for small and medium-sized firms, and agriculutre/fisheries.(Source) Japan Development Bank, Zaisei Toyushi-Nihon no Keiken , 1993.
Table 2 Distribution of the FIL by Purposes, 1955-1990 (%)
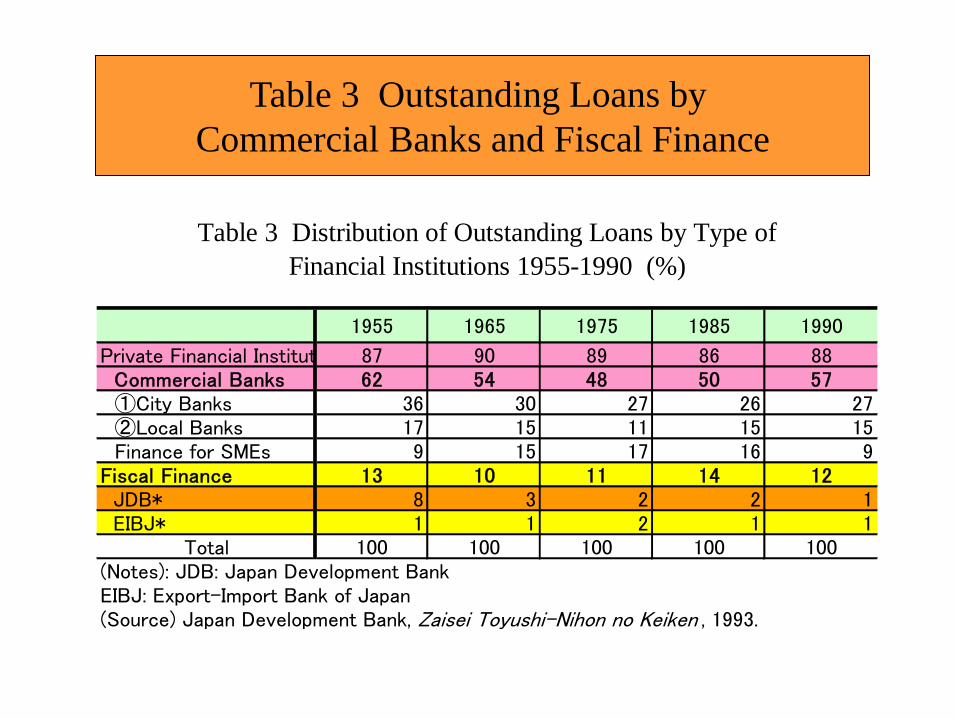
Table 3 Outstanding Loans by
Commercial Banks and Fiscal Finance
1955 1965 1975 1985 1990
Private Financial Institutions 87 90 89 86 88 Commercial Banks 62 54 48 50 57 ①City Banks 36 30 27 26 27 ②Local Banks 17 15 11 15 15 Finance for SMEs 9 15 17 16 9Fiscal Finance 13 10 11 14 12 JDB* 8 3 2 2 1 EIBJ* 1 1 2 1 1
Total 100 100 100 100 100(Notes): JDB: Japan Development BankEIBJ: Export-Import Bank of Japan(Source) Japan Development Bank, Zaisei Toyushi-Nihon no Keiken , 1993.
Table 3 Distribution of Outstanding Loans by Type of
Financial Institutions 1955-1990 (%)
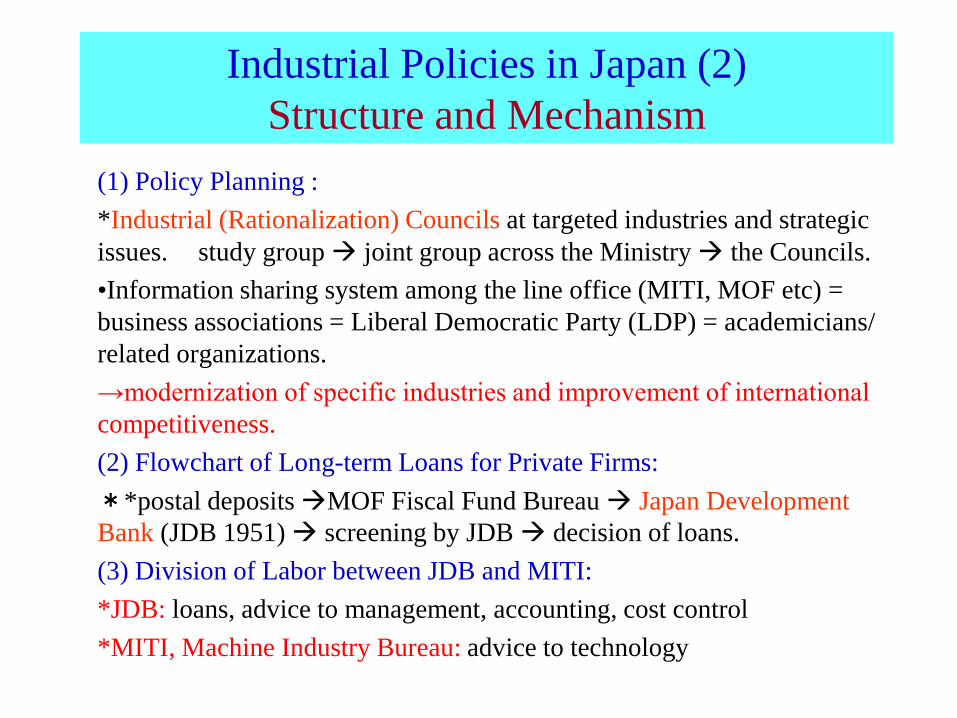
Industrial Policies in Japan (2)
Structure and Mechanism
(1) Policy Planning :
*Industrial (Rationalization) Councils at targeted industries and strategic
issues. study group joint group across the Ministry the Councils.
•Information sharing system among the line office (MITI, MOF etc) =
business associations = Liberal Democratic Party (LDP) = academicians/
related organizations.
→modernization of specific industries and improvement of international
competitiveness.
(2) Flowchart of Long-term Loans for Private Firms:
**postal deposits MOF Fiscal Fund Bureau Japan Development
Bank (JDB 1951) screening by JDB decision of loans.
(3) Division of Labor between JDB and MITI:
*JDB: loans, advice to management, accounting, cost control
*MITI, Machine Industry Bureau: advice to technology
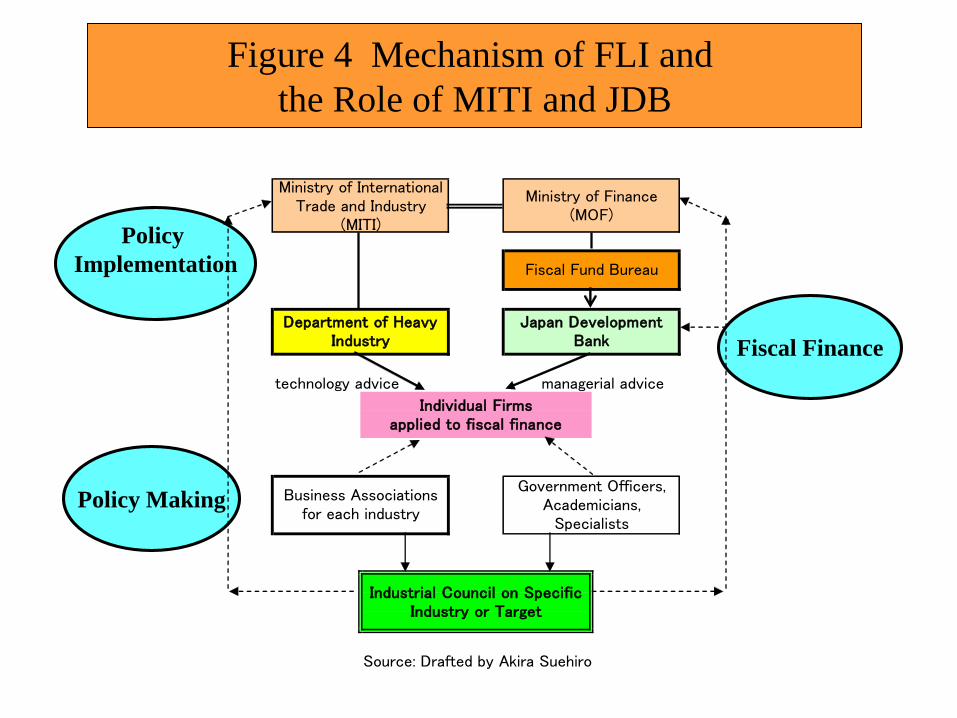
Figure 4 Mechanism of FLI and
the Role of MITI and JDB
Policy Making
Policy
Implementation
Fiscal Finance
technology advice managerial advice
Source: Drafted by Akira Suehiro
Individual Firmsapplied to fiscal finance
Industrial Council on SpecificIndustry or Target
Government Officers,Academicians,
Specialists
Business Associationsfor each industry
Japan DevelopmentBank
Department of HeavyIndustry
Ministry of InternationalTrade and Industry
(MITI)
Ministry of Finance(MOF)
Fiscal Fund Bureau
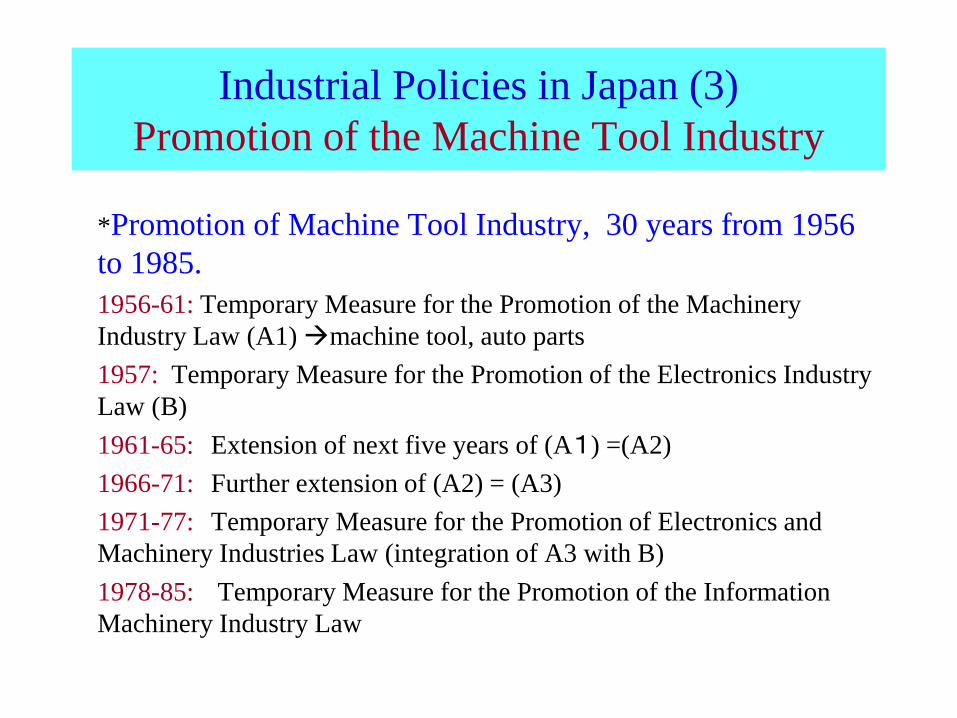
Industrial Policies in Japan (3)
Promotion of the Machine Tool Industry
*Promotion of Machine Tool Industry, 30 years from 1956
to 1985.
1956-61: Temporary Measure for the Promotion of the Machinery
Industry Law (A1) machine tool, auto parts
1957: Temporary Measure for the Promotion of the Electronics Industry
Law (B)
1961-65: Extension of next five years of (A1) =(A2)
1966-71: Further extension of (A2) = (A3)
1971-77: Temporary Measure for the Promotion of Electronics and
Machinery Industries Law (integration of A3 with B)
1978-85: Temporary Measure for the Promotion of the Information
Machinery Industry Law
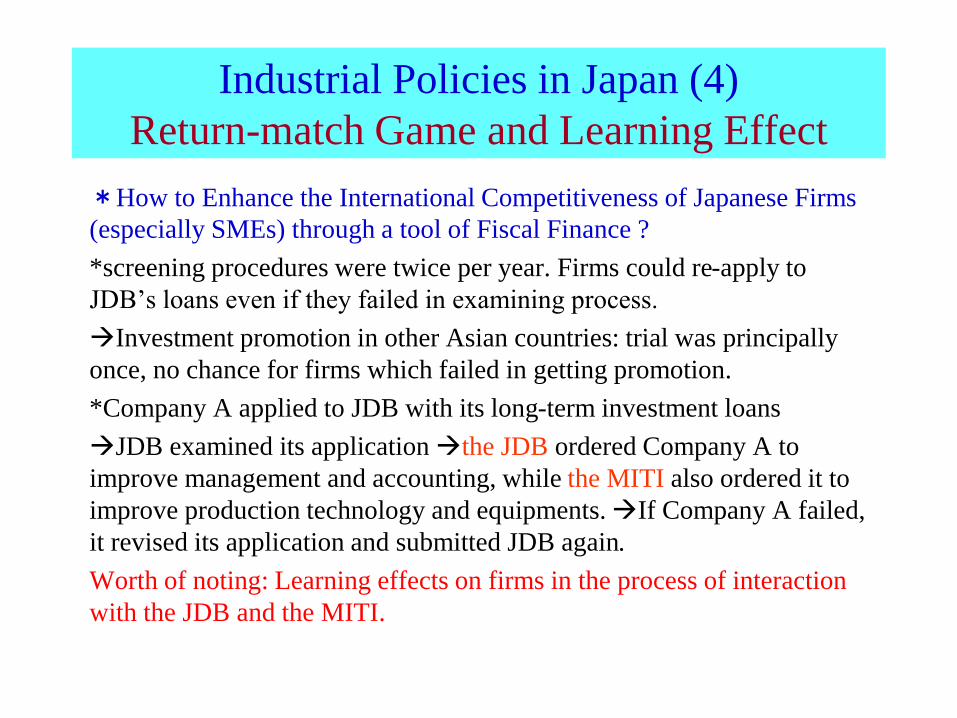
Industrial Policies in Japan (4)
Return-match Game and Learning Effect
*How to Enhance the International Competitiveness of Japanese Firms
(especially SMEs) through a tool of Fiscal Finance ?
*screening procedures were twice per year. Firms could re-apply to
JDB’s loans even if they failed in examining process.
Investment promotion in other Asian countries: trial was principally
once, no chance for firms which failed in getting promotion.
*Company A applied to JDB with its long-term investment loans
JDB examined its application the JDB ordered Company A to
improve management and accounting, while the MITI also ordered it to
improve production technology and equipments. If Company A failed,
it revised its application and submitted JDB again.
Worth of noting: Learning effects on firms in the process of interaction
with the JDB and the MITI.
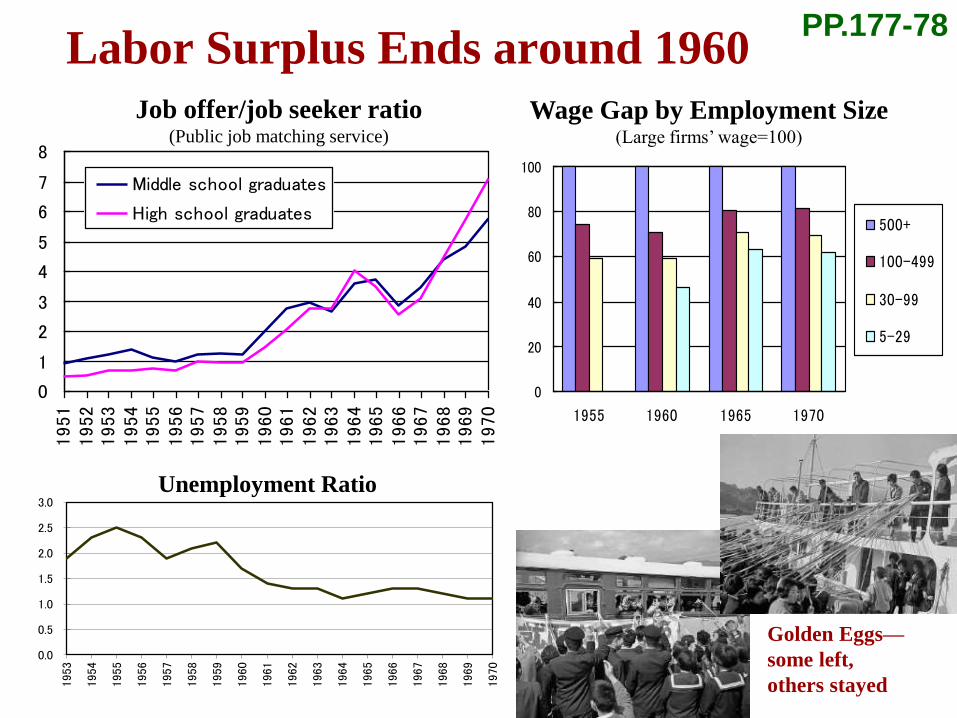
Labor Surplus Ends around 1960
0.0
0.5
1.0
1.5
2.0
2.5
3.0
1953
1954
1955
1956
1957
1958
1959
1960
1961
1962
1963
1964
1965
1966
1967
1968
1969
1970
0
1
2
3
4
5
6
7
8
1951
1952
1953
1954
1955
1956
1957
1958
1959
1960
1961
1962
1963
1964
1965
1966
1967
1968
1969
1970
Middle school graduates
High school graduates
0
20
40
60
80
100
1955 1960 1965 1970
500+
100-499
30-99
5-29
Job offer/job seeker ratio(Public job matching service)
Wage Gap by Employment Size(Large firms’ wage=100)
Unemployment Ratio
Golden Eggs—
some left,
others stayed
PP.177-78
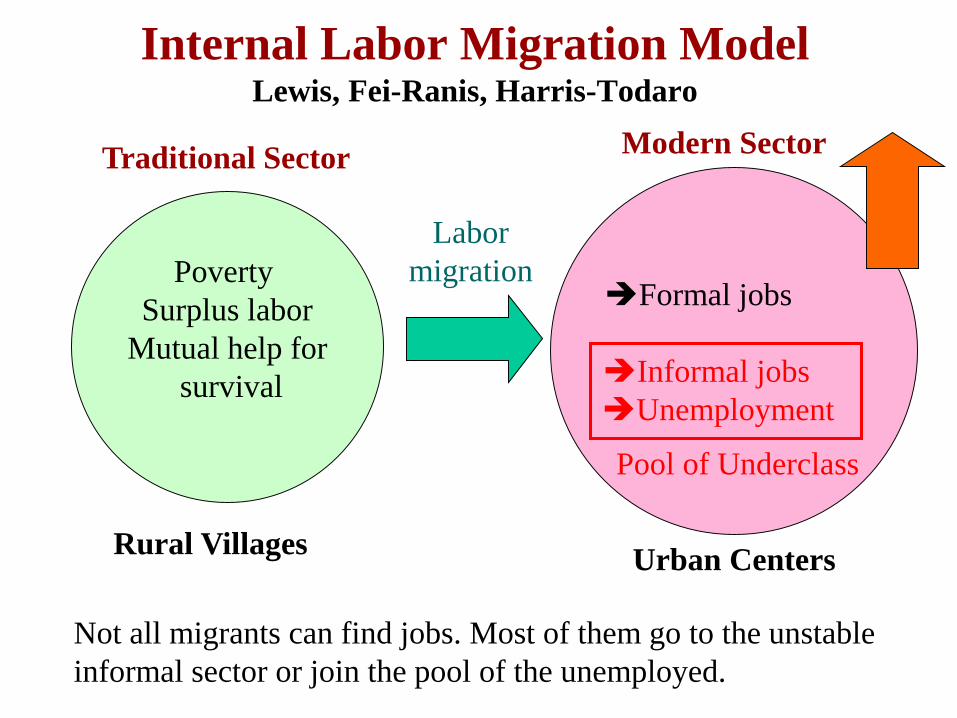
Poverty
Surplus labor
Mutual help for
survival
Formal jobs
Informal jobs
Unemployment
Rural VillagesUrban Centers
Labor
migration
Not all migrants can find jobs. Most of them go to the unstable
informal sector or join the pool of the unemployed.
Pool of Underclass
Internal Labor Migration ModelLewis, Fei-Ranis, Harris-Todaro
Traditional SectorModern Sector
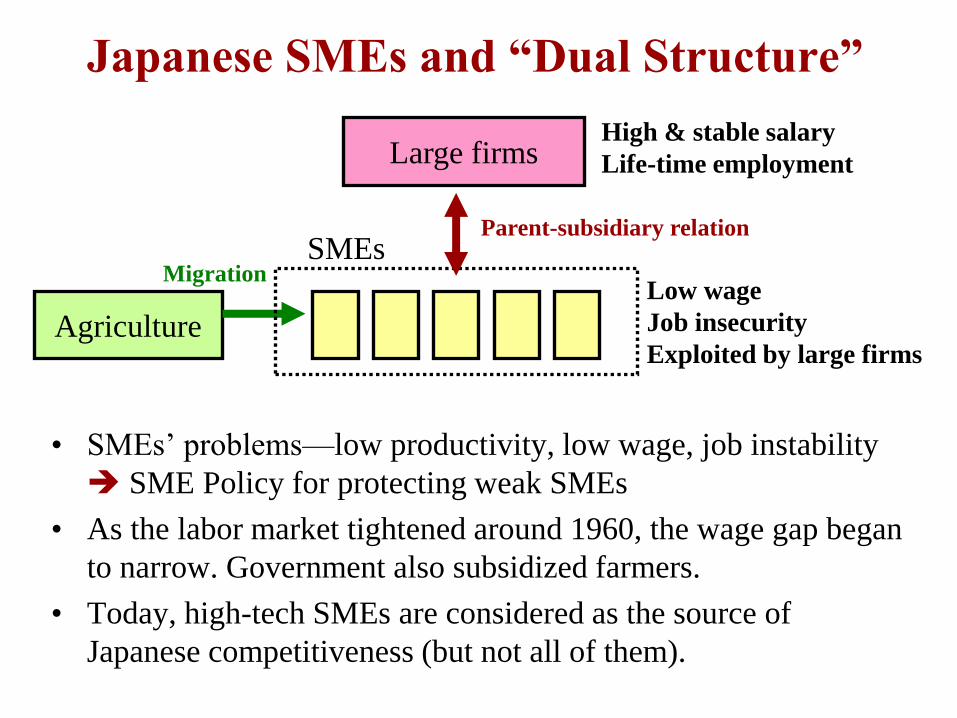
Japanese SMEs and “Dual Structure”
• SMEs’ problems—low productivity, low wage, job instability
SME Policy for protecting weak SMEs
• As the labor market tightened around 1960, the wage gap began
to narrow. Government also subsidized farmers.
• Today, high-tech SMEs are considered as the source of
Japanese competitiveness (but not all of them).
Agriculture
Large firmsHigh & stable salary
Life-time employment
Low wage
Job insecurity
Exploited by large firms
Migration
Parent-subsidiary relationSMEs
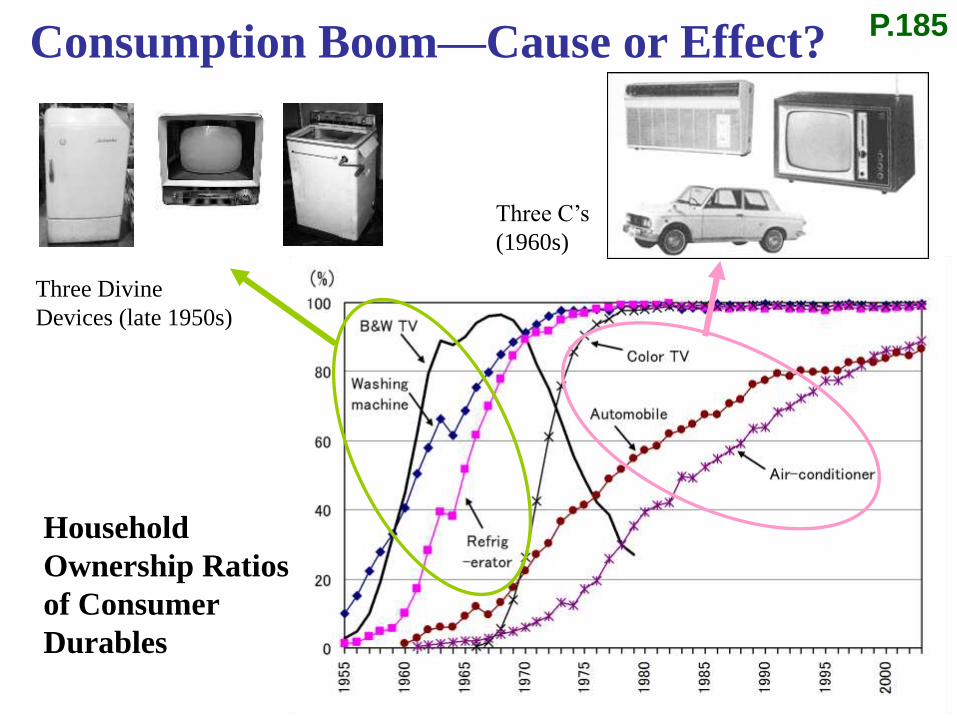
Consumption Boom—Cause or Effect?P.185
Three Divine
Devices (late 1950s)
Three C’s
(1960s)
Household
Ownership Ratios
of Consumer
Durables
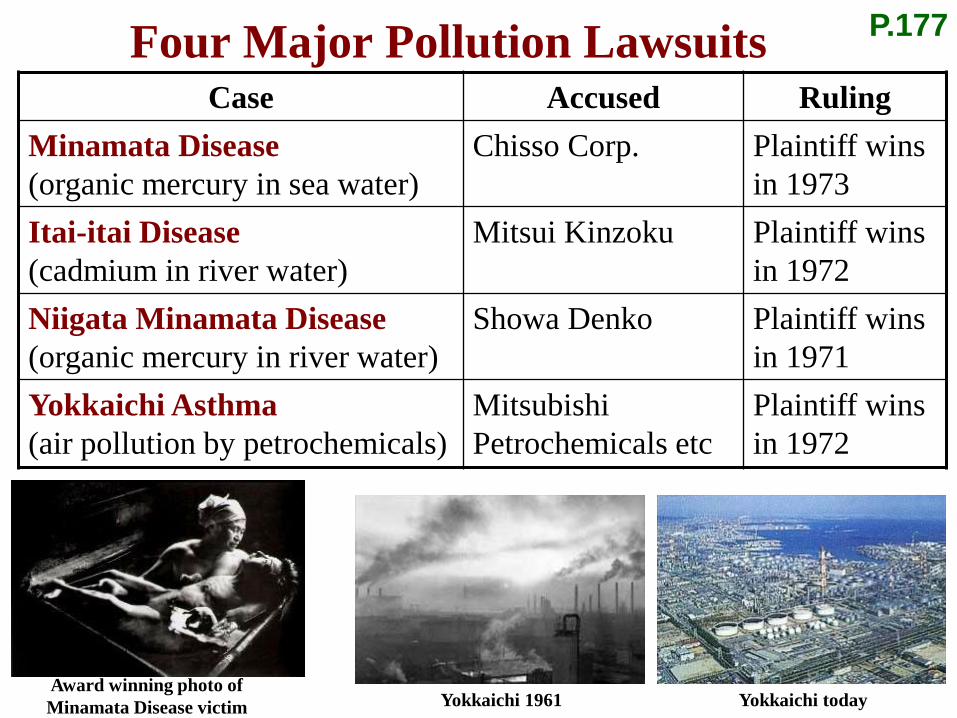
Four Major Pollution LawsuitsCase Accused Ruling
Minamata Disease
(organic mercury in sea water)
Chisso Corp. Plaintiff wins
in 1973
Itai-itai Disease
(cadmium in river water)
Mitsui Kinzoku Plaintiff wins
in 1972
Niigata Minamata Disease
(organic mercury in river water)
Showa Denko Plaintiff wins
in 1971
Yokkaichi Asthma
(air pollution by petrochemicals)
Mitsubishi
Petrochemicals etc
Plaintiff wins
in 1972
P.177
Yokkaichi 1961 Yokkaichi todayAward winning photo of
Minamata Disease victim
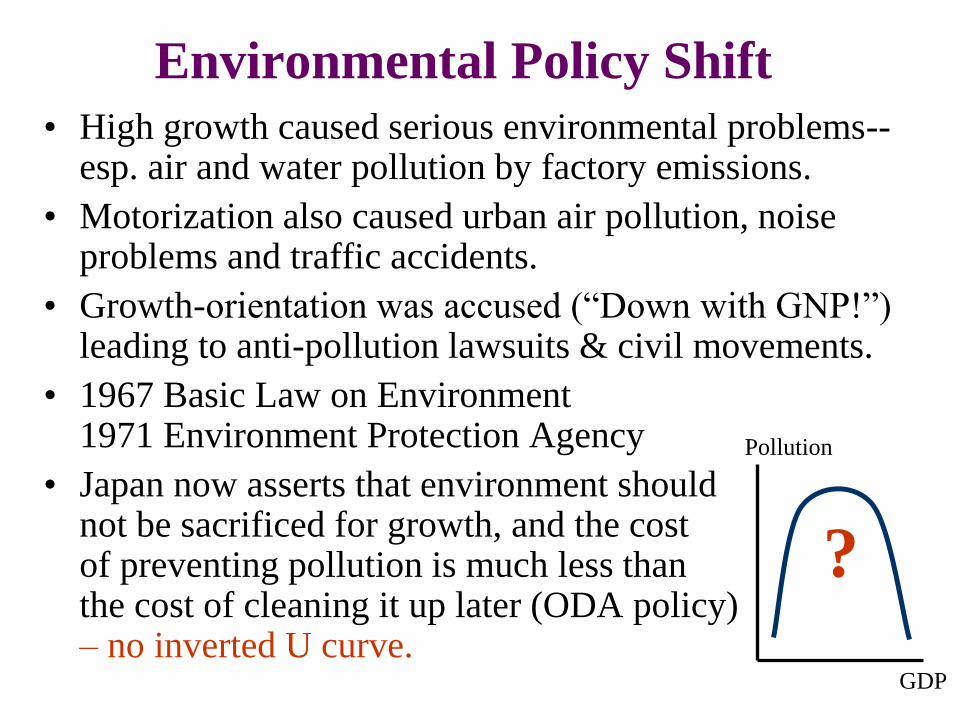
Environmental Policy Shift
• High growth caused serious environmental problems--esp. air and water pollution by factory emissions.
• Motorization also caused urban air pollution, noise problems and traffic accidents.
• Growth-orientation was accused (“Down with GNP!”) leading to anti-pollution lawsuits & civil movements.
• 1967 Basic Law on Environment1971 Environment Protection Agency
• Japan now asserts that environment shouldnot be sacrificed for growth, and the costof preventing pollution is much less thanthe cost of cleaning it up later (ODA policy)– no inverted U curve.
GDP
Pollution
?
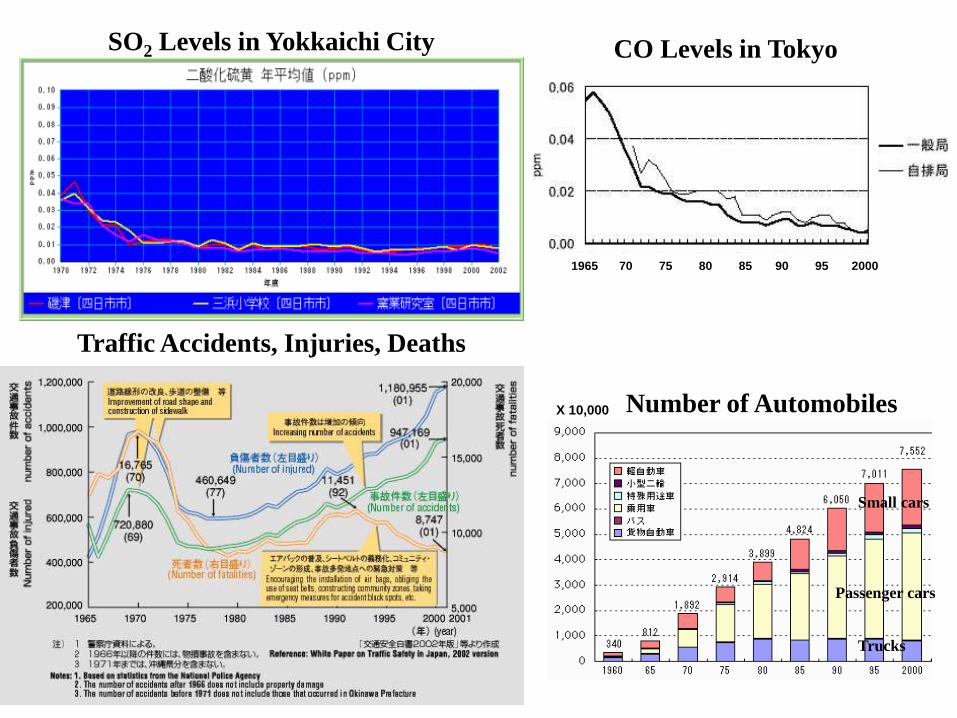
SO2 Levels in Yokkaichi City CO Levels in Tokyo
1965 70 75 80 85 90 95 2000
Traffic Accidents, Injuries, Deaths
Number of AutomobilesX 10,000
Small cars
Passenger cars
Trucks