les troubles psychologiques et la perte de poids après ... · drastiques qui favorisent les...
TRANSCRIPT

UNIVERSITE DE GENEVE FACULTE DE MEDECINE Section de Médecine Clinique Département - Médecine Interne
Division d’Enseignement Thérapeutique pour les Maladies Chroniques
Thèse préparée sous la direction du Dr Alain Golay PD
LES TROUBLES PSYCHOLOGIQUES ET LA PERTE DE POIDS APRES
BYPASS GASTRIQUE
Thèse présentée à la Faculté de Médecine
de l’Université de Genève pour obtenir le grade de Docteur en Médecine
par
Ileana ILIESCU née GRIGORESCU
de
Bucarest, Roumanie
Thèse n°10340
Genève
2003

2
REMERCIEMENTS Je tiens à remercier tout particulièrement le Dr Olivier Hubert PD pour l’aide et les conseils qu’il m’a donnés, ainsi que :
• Prof Philippe Morel, • Dr Gilles Chassot et • Dr François Hermann PD.
Mon travail de thèse n’aurait pas été possible sans l’aide et le soutien rapproché de toute l’équipe de la Division d’Enseignement Thérapeutique Pour les Maladies Chroniques :
• Elisabeta Bobbioni-Harsch • Magali Volery • Carole Mugler • Emmanuelle Chliamovitch • Nuria Flores

3
TABLE DE MATIERES
RESUME 5
INTRODUCTION
• Définition…………………………………………………………………………9 • Prévalence et Incidence……...…………………………………………………..9 • Morbidité…………………………………………………………………………9 • Facteurs qui influencent la prise de poids …...……………………...………..10 • Traitement de l’obésité ………………………...………………………………11 • Hypothèse et Question………………………………………...……………..…16
SUJET ET METHODES
• Subjects……………………………………………………………………….....17 • Méthodes..……………………………………………………………………….18
o Design de l’étude………………………………………………………..18 o Méthodes de mesure……………………………………………………18 o Analyse des données..………………………………………………...…21
RESULTATS 23 DISCUSSION 39
• Points forts et points faibles de notre étude..………………………………….41 • Recommendation………………………………………………………………..42
BIBLIOGRAPHIE 43

4
SUMMARY RESUME 5
INTRODUCTION
• Definition…………………………………………………………………………9 • Prevalence and Incidence………………………………………………………..9 • Morbidity…………………………………………………………………………9 • Factors influencing weight gain………………………………………………..10 • Treatment of obesity……………………………………………………………11 • Hypothesis and question……………………………………………………..…16
SUBJECTS AND METHODS
• Subjects……………………………………………………………………….....17 • Methods………………………………………………………………………….18
o Study design……………………………………………………………..18 o Methods of measurement………………………………………………18 o Analysis of data…………………………………………………………21
RESULTS 23 DISCUSSION 39
• Strengths and weakness of our study………………………………………….41 • Recommendations………………………………………………………..……..42
REFERENCES 43
5
RESUME INTRODUCTION L’obésité est devenue, dans les pays développés, un problème de santé publique. Son incidence augmente chaque année en corrélation étroite avec le changement de mode de vie, notamment avec la sédentarité et le changement des habitudes alimentaires : régime riche en graisses et glucides. L’obésité est accompagnée d’une multitude de pathologies associées : hypertension artérielle, maladies coronariennes, diabète, dyslipidémies, syndrome des apnées du sommeil, cancers (sein, endomètre, côlon), gonarthrose etc. ; d’où l’importance du traitement et de la prévention. Malheureusement, parmi les traitements de l’obésité, l’efficacité n’est pas la règle. Il est connu actuellement que le traitement le plus efficace de l’obésité morbide (Index corporel > 40kg/m2) est le bypass gastrique. Son efficacité a été démontrée sur une perte de poids supérieure à 50% de l’excès de poids pour une durée de 5 ans. Il est également connu que le profil psychologique de base des patients obèses morbides joue un rôle important dans l’évolution de la perte de poids. La dépression, l’anxiété ainsi que les troubles du comportement alimentaire font partie intégrante du tableau psychologique complexe du patient obèse. Les cliniciens avaient l’impression qu’une corrélation existe entre les paramètres psychologiques et le succès de l’intervention thérapeutique dans le cas de l’obésité, mais il n’y avait pas d’étude pour le confirmer ou l’infirmer. C’est la raison pour laquelle nous avons dessiné une étude prospective ayant comme objectif de répondre à la question suivante : Question : Y a-t-il une corrélation entre le profil psychologique de base des patients obèses morbides et leur évolution après bypass ? En d’autres termes : pouvons nous prédire qui est le meilleur candidat pour le bypass gastrique en déterminant son profil psychologique ? SUJETS ET METHODES 80 patients (68 femmes et 12 hommes) ayant une obésité morbide ( BMI > 40kg/m2 ou BMI > 35kg/m2 associé à des complications connues de l’obésité) ont bénéficié d’un bypass gastrique dans le cadre d’un programme multidisciplinaire de prise en charge de l’obésité morbide, au sein de l’Hôpital Universitaire de Genève.

6
Le protocole de notre étude a reçu l’approbation de la Commission d’Ethique du Département de Chirurgie de l’Hôpital Universitaire de Genève. Nos patients ont été sélectionnés par une équipe multidisciplinaire composée de : médecin spécialiste en médecine interne, chirurgien, psychiatre, psychologue et diététicienne. Tout patient ayant une pathologie psychiatrique grave a été exclu. Avant l’opération, nos patients ont rempli plusieurs tests psychologiques afin de déterminer leur profil psychologique : Beck Depression Inventory BDI pour la dépression (6,7), Hospital Anxiety and Depression Scale HAD pour l’anxiété et la dépression (96), Rathus test pour l’estime de soi (20), Nottingham Health Profile NHP pour la qualité de vie (50) et Eating Disorder Inventory II EDI pour les troubles du comportement alimentaire (37). A 3 mois, 6 mois et 1 année après l’opération, nous avons étudié les paramètres suivants : poids, BMI, leptine, acides gras plasmatiques (FFA), insuline, glycémie, métabolisme basal, oxydation des protéines, des glucides et des lipides ainsi que l’apport calorique et la composition corporelle. Pour l’analyse de nos données nous avons divisé nos patients en sous-groups utilisant les critères d’âge et de poids. Malgré le fait que ces deux variables soient des variables continues nous avons, tout de même choisi de séparer notre groupe en sous-groupes en utilisant comme point de séparation une valeur fixe correspondant à la médiane calculée pour le groupe entier: 35 ans pour l’âge et 44kg/m2 (75% excès de poids) pour le poids. Le choix de la limite de séparation à été fait en concordance avec les travaux antérieurs effectués par notre groupe de recherche (12). Les résultats ensuite ont été analysés par régression simple et/ou multiple pour évaluer tous les paramètres psychologiques. Les résultats ont été exprimés en moyenne +/- erreur standard en utilisant le programme de statistique StatView 4.5, Abacus Concepts Inc. Berkeley, CA. Nous avons considéré comme statistiquement significatif une valeur de P < 0.05. Une analyse par ANOVA a été utilisé pour comparer les quatre groups selon l’âge et le pourcentage d’excès de poids. RESULTATS Le profil psychologique de nos patients avec obésité sévère a présenté les caractéristiques suivantes : une anxiété modérée, une dépression moyenne, une mauvaise qualité de vie et, paradoxalement, peu de troubles du comportement alimentaire (sous-estimation due a une tendance de la part de nos patients de ne pas rapporter de tels troubles du comportement). La perte de poids après un an est de 76.5% de correction de l’excès de BMI. Parmi tous les autres paramètres étudiés, nous avons trouvé une corrélation étroite, dans le groupe entier, entre les scores de dépression avant l’opération et la perte de poids après
7
l’intervention : plus les patients étaient déprimés avant l’opération plus ils corrigeaient leur poids grâce au bypass. Dans le sous-groupe des patients avec moins de 75% excès de poids la corrélation trouvée entre la perte de poids et les paramètres psychologiques a été encore plus étroite. Plus ces patients étaient anxieux, dépressifs et avec une mauvaise qualité de vie, plus ils perdaient du poids. Cette perte de poids a été corrélée étroitement avec la diminution de l’apport calorique (ingestion alimentaire). La tendance à été contraire dans le groupe avec > 75% excès de poids : plus ces patients étaient anxieux, avec une mauvaise qualité de vie et une mauvaise estime de soi, moins ils perdaient du poids. Cette évolution a été également corrélée étroitement avec l’apport calorique. Chez les patients < 35 ans nous avons trouvé 37% plus de troubles du comportement alimentaire que dans le groupe plus âgé de > 35ans. Nous n’avons trouvé aucune corrélation entre les paramètres métaboliques, biophysiques, biochimiques et le profil psychologique préopératoire. Une corrélation, rassurante d’ailleurs, à été retrouvé entre la quantité de calories ingérées et la perte de poids : moins les patients mangent plus ils perdent du poids ! Nous avons aussi vérifié qu’il existe une bonne corrélation entre les différents tests psychologiques (P < 0.001). DISCUSSION Le profil psychologique retrouvé dans notre groupe de patients obèses morbides est concordant avec les données disponibles dans la littérature (9, 39, 43, 49, 80, 31,15 etc.). L’impact du profil psychologique sur la perte de poids à un an après bypass n’est pas influencé par l’âge, mais par l’excès de poids avec une inversion de tendance autour de 44 kg/m2 de BMI (75% excès de poids) ! Cette modification est due au fait que l’influence des troubles psychologiques (dépression, anxiété etc.) sur l’apport alimentaire post-opératoire change selon l’excès de poids préopératoire. Nous pouvons spéculer qu’en dessous de 44 kg/m2 de BMI les troubles psychologiques (dépression, etc.) ont un effet anorexigène après bypass et que pour les patients avec une obésité sévèrissime (BMI > 44) ceci n’est plus le cas. Cette influence est due à un mécanisme qui est très probablement lié aux changements neuro-métaboliques complexes qui surviennent avec l’âge dans l’obésité extrême, mécanisme qui nous échappe pour le moment. La perte de poids, une année après bypass est, dans notre étude, supérieure à celle rapportée dans la littérature. Nous expliquons cette différence par le fait que nos données

8
sur le poids sont relevées à un an seulement et qu’il est connu après un an, que les patients ont une tendance à reprendre du poids (7-8kg). Les troubles du comportement alimentaire prédominent chez les jeunes de moins de 35 ans. Notre impression, basée sur les autres paramètres des questionnaires est que dans le groupe plus âgé (de > 35 ans) il peut y avoir une sous-estimation des troubles du comportement alimentaire: les patients ont suivi de multiples diètes amaigrissantes drastiques qui favorisent les troubles du comportement alimentaire et la peur d’être jugé augmentent peut-être avec l’âge. Nos résultats sont à interpréter en tenant compte de quelques limitations. L’échantillon de patients que nous avons étudié est de seulement 80 patients et la répartition par sexe favorise essentiellement les femmes (85%). Pour pouvoir étudier les différentes corrélations entre le profil psychologique et l’évolution après bypass, nous avons dû séparer notre groupe en sous groupes en utilisant comme critère deux variables continues (âge et poids). CONCLUSION Le profil psychologique préopératoire influence la perte de poids après bypass. Cette influence est dépendante de l’excès de poids préopératoire, surtout chez les patients avec un BMI > 44 kg/m2. Pour ces patients, une amélioration du profil psychologique préopératoire par une prise en charge spécialisée pourrait améliorer la perte de poids après bypass.

9
INTRODUCTION
Definition Obesity is defined as an unhealthy amount of body fat (45) or, in other words, an excess of fat (triglycerides) storage in the adipose tissue (19). The most appropriate tool to quantify the degree of obesity is the Body Mass Index (BMI) or Quetelet Index. This index is calculated by dividing one’s weight (in kg) by the square of one’s height.
BMI = mass (kg) / height² (square m) The reference values of BMI are identical for both sexes (table 1):
Normal range 18.5 – 24.9 kg/m2
Overweight 25 - 29.9 kg/m2
Obesity class I 30 - 34.9 kg/m2
Obesity class II (severe) 35 - 39.9 kg/m2
Obesity class III, (morbid) > 40 kg/m2
Table 1: Obesity classification using BMI values in adults.
Prevalence and incidence Obesity increased dramatically its prevalence the last 20 yeas (91, 72, 36). Obesity became a big health problem for the modern, developed countries. Great Britain obesity’s prevalence doubled between 1980 and 1991 to reach nearly 20% of the population. Some other country averages are: USA – which detains the record – 25%; France, Sweden and Holland 7-10%. Morbidity Morbidity is an important feature when we talk about obesity. If there is some debate if there is a health benefit of being thinner among the individuals whose BMI is less than 25, there is no doubt that a BMI over 25 confers increased health risk. Overweight and obesity have been associated with an increasing risk of a large number of disorders including, but not limited to the following:

10
• Dyslipidemias (25,26) characterised by: § high total cholesterol (> 2.40g/l) - more than 25% prevalence for
BMI bigger than 30 § high LDL (low density lipoproteins cholesterol) >1.6 g/l which is
a risk factor for cardiovascular disease (CVD) § low HDL ( high density lipoproteins cholesterol) <0.450mg/l,
which is a protection factor against the CVD § high triglycerides (>2.5g/l)
• Non-Insulin Dependent Diabetes Mellitus (NIDDM). It has been shown that excessive adipose tissue is associated with increased insulin resistance.
• Hypertension • Coronary heart disease • Osteoarthritis in the weight bearing joints • Cancers:
§ breast cancers in postmenopausal women which might be due to the estrogenic secretion of the adipose tissue
§ colon cancer § endometrial cancer
• Sleep apnoea and respiratory disorders are present in up to 24% of overweighted man and 9% of overweighted women (Allison DB ’00)
Factors influencing the weight gain Both increasing prevalence and morbidity of obesity have multiple causes. Among the most important factors in the development and persistence of obesity we remind the following:
• age – maximal prevalence is found between age 60 and 70 years old. • sex – female > male (91) • heredity –genetic predisposition that determines a bigger susceptibility of a person
to gain weight into a given environmental context (86). The impact of heredity is estimated at 25-40% for obesity in general and 50% for abdominal obesity (13)
• geographic region –the Eastern and the Northern part of Europe are prone to an increase prevalence of obesity (72,91)
• social level – the maximal prevalence is in the poor communities of developed countries (82,83)
• life style – a) industrialisation and urbanisation have reduced considerably the energy expenditure of the individuals (34, 45) and physical exercise became optional (46). There is a direct, positive correlation between obesity and the lack of physical activity. The time spend per day watching TV is proportional with the degree of obesity (2, 27, 41, 92). b) the evolution in food intake is characterised by the decrease in complex sugars intake - as fibbers from fresh fruits and vegetables – and by the increase in lipid intake, mostly of animal origin. The vast majority of the industrially prepared food has a high caloric density, much higher than the traditional meals.

11
Physical exercise limits the decrease in energy expenditure (EE) at rest, that appear with ageing and explain the weight gain in elder persons (46, 90).
Psychological factors The role of psychological factors in inducing obesity is controversial. Historically, prevailing opinions on the relationship between obesity and the psychological profile have varied greatly. In the 1960s and prior, the belief was hat obesity was, in part, caused by certain psychological abnormalities. At that point, most of the studies were based on limited samples of obese people seeking treatment (32). A study published by Stunkart and Mendelson (1967), caused the pendulum to swing in the other direction. By examining a less specific, wider sample of obese persons, it was concluded that the previous opinion might have been incorrect. The authors found that in a large, non-clinical community-based sample, there was no meaningful association between obesity and gross pathology. From the influence of Stunkard and those who followed in the 1970s and 1980s, it was generally thought that either there was no real correlation between obesity and psychological adjustment, the attendant social stigma caused psychological maladjustment and not the reverse. In the 1990s, a greater complexity is being acknowledged (36). There is accepted that there may be a complex interrelationship between psychological profile and obesity, but causal direction is unclear. Binge eating disorder (BED) - eating very fast a huge amount of food in response to psychological stimuli instead of hunger, followed by a feeling of culpability and poor self esteem – is viewed as the major psychological disorder of obese persons. It occurs in about 40% of the obese persons (80). Among those subjects BED is associated with increased adiposity and frequent, significant weight fluctuations (81, 29, 15). This explains the difficulty of maintaining the low weight levels achieved after treatment especially in BED patients. Compared with non-BED obese subjects, BED obese patients have lower self-esteem, poorer sense of personal effectiveness, more disturbed self-attitudes and higher levels of depression, anxiety and personality disturbances (89, 94). Even if we don’t know the sense of the causal relationship between obesity and psychological disorders, we can notice that morbidly obese persons have a real psychological and somatic sufferance, which lowers considerably their quality of life. The psychological aspect is marked by different degrees of anxiety and depression. Both of them are significantly improved by the stable weight loss. Treatment It have been demonstrated that even a small decrease in body weight, (i.e. of 5-10%), is associated with clinically important improvements in cholesterol levels, blood pressure, glycaemia and other health indices (40). These benefits persist if the weight loss is maintained (95). Those findings as well as the huge increasing in prevalence of obesity and its complications have justified substantial efforts in finding effective methods for loosing weight and maintaining stable low weight.

12
a) Food restriction diets The food restriction was, historically, the first approach in treating obesity but, unfortunately, with poor long-term results. Diet, as unique treatment, induces or aggravates the eating disorders. The complications of dieting are: gaining more weight (by the means of reducing the metabolism at rest), increasing morbidity of obesity, inducing weight cycling and diminishing the psychological status of the patient. As an example, all the studies that followed patients for 5 years or more after a successful food restriction diet – which means loosing at least 10% of their initial body weight - showed that almost all the patients have reached or exceeded their initial body weight after 5 years (54, 96, 19 etc.). This is why, at present, the food restriction alone it is no longer recommended as treatment of obesity. b) Cognitive- behavioural approach Association of cognitive-behavioural approach to the food restriction or to a regular, healthy, diet was thought to be the solution in treating obesity. Unfortunately this was not the case. Excepting the improvement in the eating behaviour and anxio-depressive disorders, the weight loss was disappointing (69). c) Drug treatment Drugs alone or in association with previous types or therapies gave place to big expectations. There are a few classes of drugs used in the treatment of obesity:
• anorexic agents divided in two commonly used families: noradrenergics and serotoninergics. A third family, the fenfluramins, induce dependence, have a poor efficiency and severe adverse reactions. Their use is limited at max 3 months.
• drugs that diminish the energetic intake – as Orlistat that is a selective and powerful inhibitor of gastric and pancreatic lipase inducing steatorrhoea . At the moment orlistat is the most reliable drug in the treatment of obesity.
• drugs that increase the energy expenditure – thermogenetic agents are not effective in humans. Ephedrine and xantines have a significant effect on loosing weight, but the benefit and risk balance is not sufficiently evaluated.
Unfortunately none of those substances can give a solution to the big problem that is obesity either because of the induced risks, or of their inefficacy. d) Surgical treatment of obesity, so-called - bariatric surgery Because current treatments, as we have seen, are usually ineffective in patients with morbid obesity, surgical methods (especially Roux-en-Y gastric by-pass) have been assessed. The success rate in achieving and maintaining long term weight loss is 80% or greater, significantly higher than with any other treatment (16). Results of bariatric surgery What do we expect from surgical methods of loosing weight – called bariatric surgery – in terms of results? Patients lose after the gastric bypass, around 50-60% of their excess body weight in the first year and they can generally maintain the weight loss at 5 years with only a modest regain of 5-7 kg (18, 64, 8). These long term results makes the

13
bariatric surgery the only way of loosing weight and maintaining weight lost for the morbidly obese persons. Classification of the bariatric procedures:
1. Gastric Bypass (GBP), the most used is the Roux en Y GBP technique (see description below)
2. Horizontal Gastroplasty 3. Vertical Gastroplasty 4. Gastric Banding 5. Biliopancreatic Diversion 6. Jejunoileal Bypass
1.Gastric Bypass (GBP) The gastric bypass (GBP) is considered by many to be the gold standard of the bariatric surgery. Historical data on GBP The GBP has been practised on humans since 1967 and has undergone many modifications ever since. The prototype was Billroth II gastric operation but without removal of the distal stomach. GBP description The GBP consists in creating a small pouch of 30cc from the upper stomach by stapling and therefore, separating the stomach in two separate compartments. The 30cc stomach pouch is drained into an intestinal loop (Roux en Y loop, most frequently) made by the small bowel (figure 1). To bring the bile and the pancreatic secretion for the normal digestion, another surgical anastomosis is practiced between two loops of the small bowel at various distances from the ileo-caecal valvulae, for ex: 50-60cm for distal Roux en Y GBP.
Figure 1: Horizontal Roux en Y Gastric Bypass
14
The mechanism of GBP functioning GBP causes weight loss – by diminishing caloric intake - through multiple mechanisms :
• decreased capacity of the stomach that produces rapid sensation of satiety with even minimal food intake
• restricted rate of emptying the pouch • prohibiting, by the apparition of the dumping syndrome, the ingestion of certain
hyper osmolar foods (generally the sweet food containing sugar, glucose, etc., which are generally calories-dense foods)
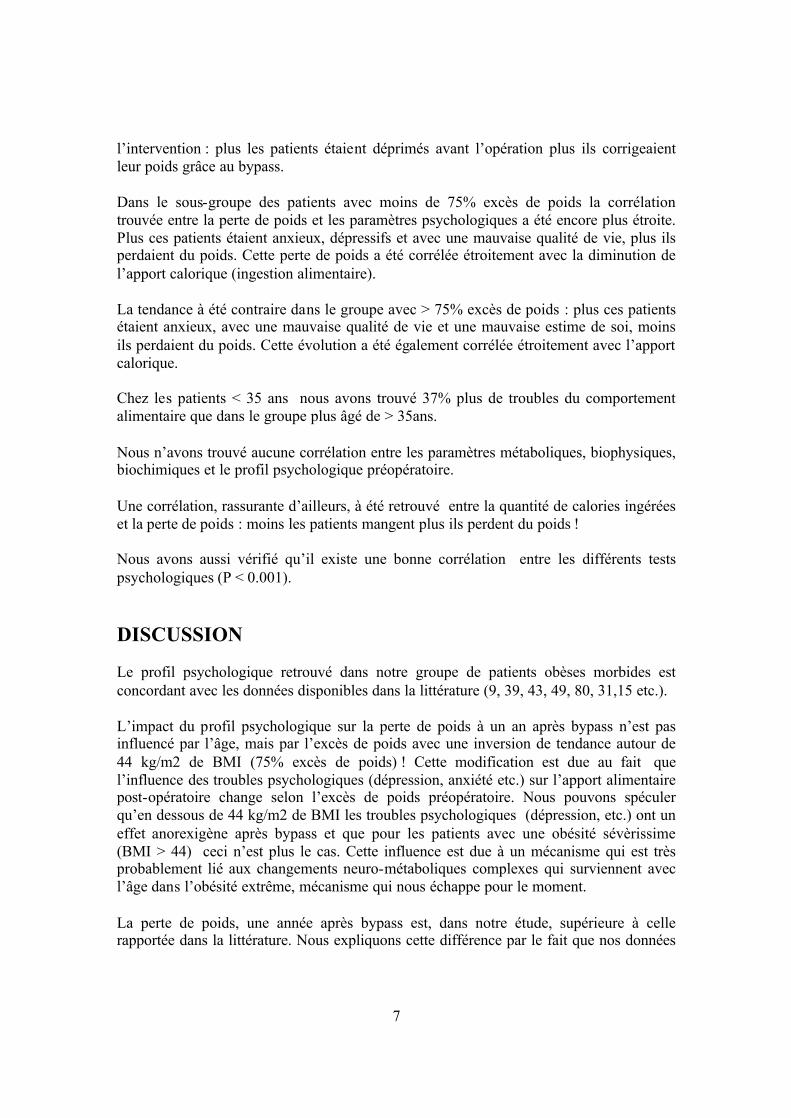
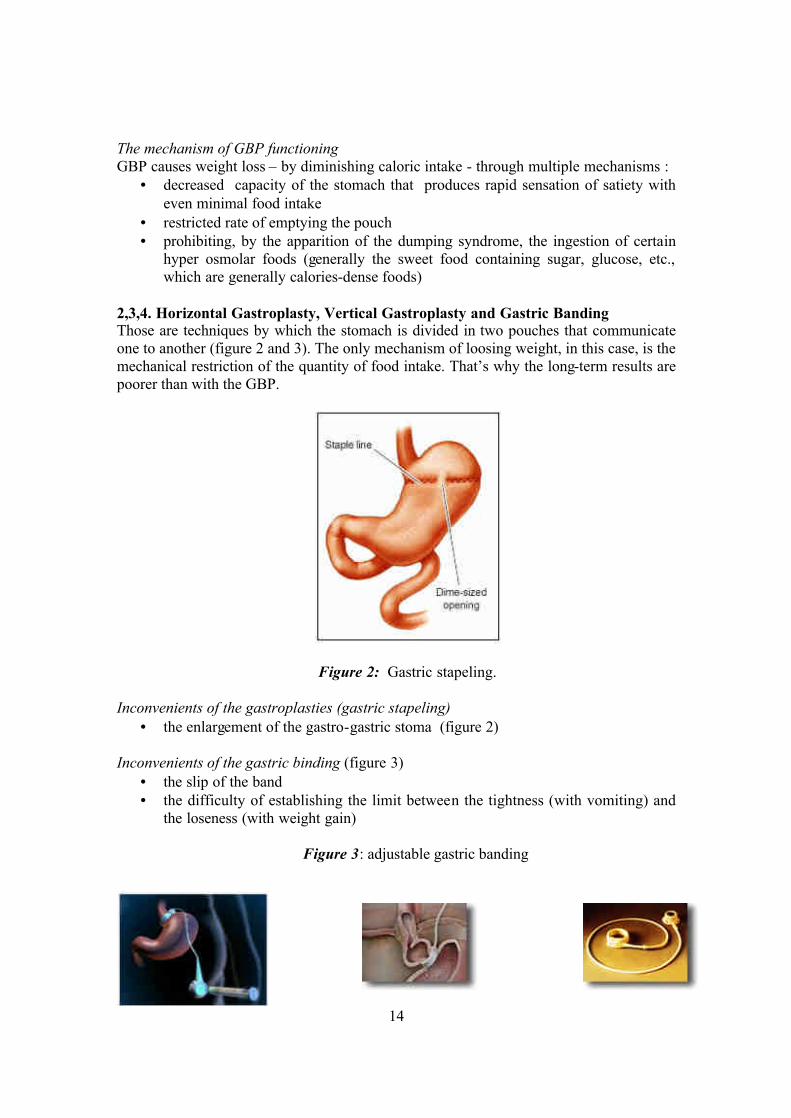
2,3,4. Horizontal Gastroplasty, Vertical Gastroplasty and Gastric Banding Those are techniques by which the stomach is divided in two pouches that communicate one to another (figure 2 and 3). The only mechanism of loosing weight, in this case, is the mechanical restriction of the quantity of food intake. That’s why the long-term results are poorer than with the GBP.
Figure 2: Gastric stapeling. Inconvenients of the gastroplasties (gastric stapeling)
• the enlargement of the gastro-gastric stoma (figure 2) Inconvenients of the gastric binding (figure 3)
• the slip of the band • the difficulty of establishing the limit between the tightness (with vomiting) and
the loseness (with weight gain) Figure 3: adjustable gastric banding

15
5. Biliopancreatic diversion (BPD) Developed by Scopinaro in Genoa, has some similarities to the distal Roux en Y distal GBP (figure 6), but a subtotal gastrectomy is performed and a gastric pouch of 200cc to 400cc is left. There is a wide stoma between the gastric poach and the gut to permit adequate meals and avoid the major sequelae, hypoalbuminemia, which occurred in about 10% of patients (Scopinaro N, Probl. Gen. Surg. 9:298) .
Figure 4: Scopinaro’s BPD, Inconvenients of BPD
• fatty, soft stools - 2 or 3 per day • calcium and fat-soluble vitamin malabsorbtion that require adequate
supplementation • it is a procedure of a certain magnitude
6. Jejunoileal Bypass (JI) Performed at large scale in the ’60s-‘70s JI (figure 5) has been abandoned because of the high incidence of the complications.
Figure 5: Jejunoileal Bypass
16
Complications of JI
• anaerobic proliferation on the blind loop with secondary abdominal distension • absorption of bacterial products led to circulating immune complexes with
polyarthralgies that usually responded to antibiotics (24) • calcium oxalate nephropathy caused by the absorption of calcium oxalate and
favourised by dehydration caused by diarrhoea • diarrhoea • hepatic insufficiency
Considering all previous data and the complex profile of the morbidly obese individual, those patients should be selected and clinically followed by a multidisciplinary team. This team consists in: physicians with special interest in obesity, dieteticians, psychologists or psychiatrists interested in behaviour modification and eating disorders and a surgeon with experience in bariatric procedures. Hypothesis We clinically observed that the most obese of our patients have more difficulties to correct their BMI after the GBP. Our hypothesis is that those patients might be psychologically different from the less obese individuals of our group (BMI < 44 kg/m2) and this difference might play a role in loosing weight after the GBP. The purpose of our study is to determine the relationships or even the correlations, between the pre-surgery psychological profile of morbidly obese subjects and the post-surgery outcome, in terms of loosing weight. Question What it would be interesting to know, but there is no available coherent data, is:
1) Who will be the best subject for the bariatric surgery? In other words: is it possible, using the pre-surgery data only, to predict who will lose a satisfactory amount of weight without any psychological complications (suicide, alcoholism, worsen BED etc.)?
2) Is there a method to improve the weight loss after the GBP? If yes, which subgroup of patients would benefit the most?
17
SUBJECTS AND METHODS
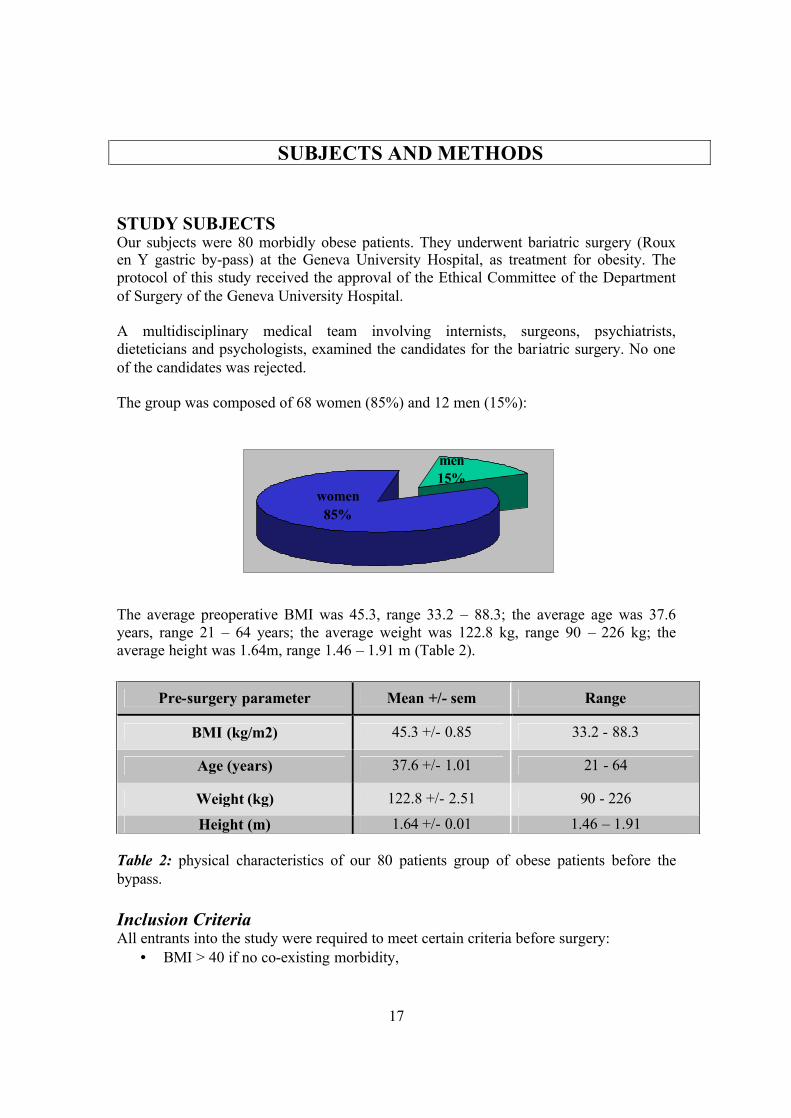
STUDY SUBJECTS Our subjects were 80 morbidly obese patients. They underwent bariatric surgery (Roux en Y gastric by-pass) at the Geneva University Hospital, as treatment for obesity. The protocol of this study received the approval of the Ethical Committee of the Department of Surgery of the Geneva University Hospital. A multidisciplinary medical team involving internists, surgeons, psychiatrists, dieteticians and psychologists, examined the candidates for the bariatric surgery. No one of the candidates was rejected. The group was composed of 68 women (85%) and 12 men (15%):
men 15%
women85%
The average preoperative BMI was 45.3, range 33.2 – 88.3; the average age was 37.6 years, range 21 – 64 years; the average weight was 122.8 kg, range 90 – 226 kg; the average height was 1.64m, range 1.46 – 1.91 m (Table 2).
Table 2: physical characteristics of our 80 patients group of obese patients before the bypass. Inclusion Criteria All entrants into the study were required to meet certain criteria before surgery:
• BMI > 40 if no co-existing morbidity,
Pre-surgery parameter Mean +/- sem Range
BMI (kg/m2) 45.3 +/- 0.85 33.2 - 88.3
Age (years) 37.6 +/- 1.01 21 - 64
Weight (kg) 122.8 +/- 2.51 90 - 226
Height (m) 1.64 +/- 0.01 1.46 – 1.91

18
• BMI >35 if either one of the following morbidities is present: HTA, diabetes mellitus, arthrosis, sleep apnoea etc.
• acceptable surgical risks, • capability of understanding the surgery, its consequences and to give an informed
consent. Exclusion Criteria As part of the pre-surgery protocol, a psychiatrist evaluated all patients. Psychiatric pathology, history of substance abuse or suicidal ideation was exclusion criteria in our study. At that moment there was no person excluded from the GBP therapy because one of those criteria in our study.
METHODS Study Design In order to establish weather the pre-surgery psychological profile influences the outcome of the gastric bypass in our 80 obese patients, they were asked to fill in a battery of psychological tests prior to surgery:
• Beck Depression Inventory • Hospital Anxiety and Depression Scale • Rathus test • Nottingham Health Profile • Eating Disorder Inventory.
The non-psychological parameters used in our study are:
• body weight (BW), height, body mass index (BMI) • the BW was determined before surgery and at one year after surgery.
The aim of the study was to establish the correlation, if any, between the pre-surgery psychological profile and the post-surgery evolution of the BW. Intervention All our patients underwent the Roux en Y gastric bypass - as described in the Introduction - as a treatment of morbid obesity. The surgical technique of the GBP is highly standardised in our hospital, so all our patients underwent exactly the same surgery. The day of the surgery was considered the time zero of our study. Methods of measurement a) The psychological profile was determined by means of the following 5 tests: 1. Eating Disorder Inventory II (37). This test was designed to quantify a certain number of psychological and behavioural traits common to eating disorders as anorexia nervosa and bulimia. It is composed of 64 questions grouped into 8 subgroups.
• Drive for thinness - indicates the excessive concern with dieting, preoccupation with weight and extreme pursuit of thinness

19
• Bulimia - indicates the tendency toward episodes of uncontrollable overeating (bingeing) and may be followed by self-induced vomiting.
• Body dissatisfaction - reflects the belief that specific parts of the body are too large.
• Ineffectiveness - assesses feeling of general inadequacy, insecurity, worthlessness and the feeling of not controlling their lives.
• Perfectionism - indicates excessive personal expectations. • Interpersonal distrust - reflects a sense of alienation and general
reluctance to form close relationships. • Interoceptive awareness - reflects one’s lack of confidence in recognising
and accurately identifying emotions or visceral sensations of hunger or satiety.
• Maturity fears - measures one’s wish to retreat to the security of the pre-adolescent years because of the overwhelming demands of adulthood.
• Ascetism - reflects the avoidance of sexual relationships. • Impulse regulation - shows the difficulty in regulating impulses,
especially the binge behaviour. • Social insecurity - estimates social fears and insecurity.
Table 3: Eating Disorder Inventory ranges.
Category Normal range Eating disorder range
Drive for thinness 3 - 7 12 - 16
Bulimia 1 - 2 9 - 13
Body dissatisfaction 9 - 15 13 - 19
Ineffectiveness 1 - 4 9 - 14
Perfectionism 4 - 9 7 - 11
Interpersonal distrust 1 - 3 4 - 8
Interoceptive awareness 1 - 5 8 - 14
Maturity fears 2 - 4 4 - 6
Asceticism 2 - 5 5 - 11
Impulse regulation 1 - 4 4 – 8
Social insecurity 2 - 5 6 - 9

20
2. Hospital Anxiety and Depression Scale (96), which gives a score of anxiety and depression (Table 4).
Table 4: meaning of Hospital Anxiety and Depression scores.
3. Beck Depression Inventory (6,7), measures the intensity of the depression.
Table 5: meaning of Beck Depression Inventory scores.
For both HAD and BDI we choose as cut off value in our study the superior limit of the normal range. Our choice is justified by the difficulty to compare degrees of anxiety or depression that have not been standardised. 4. Nottingham Health Profile (50), which is a standardised tool for the survey of general health problems. The more affected the patient is, the higher score he/she gets. 5. Rathus test (20), gives a score that that represents the quantification of patient’s self esteem.
Range Meaning
< 7 No anxiety or depression
8 to 10 Border line anxiety or depression
> 11 Marked anxiety or depression
Range Meaning
< 8 No depression
8 to 18 Mild depression
18 to 29 Moderate depression
> 30 Marked depression
21
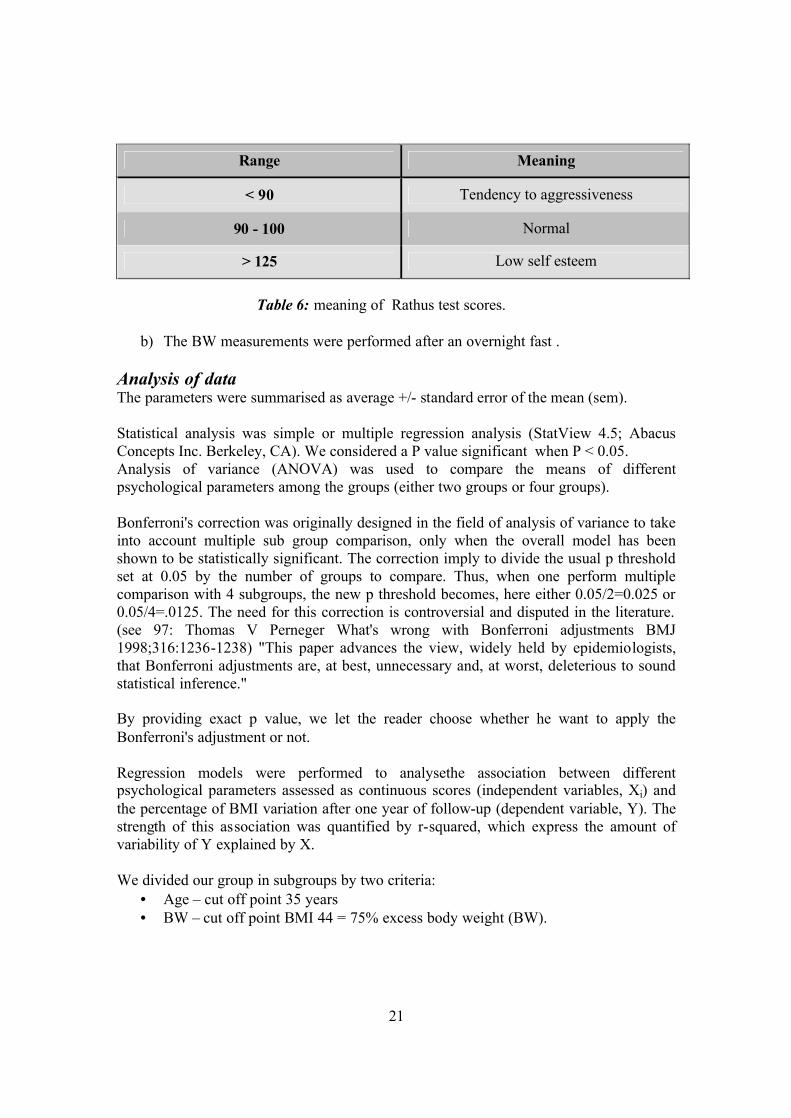
Table 6: meaning of Rathus test scores.
b) The BW measurements were performed after an overnight fast . Analysis of data The parameters were summarised as average +/- standard error of the mean (sem). Statistical analysis was simple or multiple regression analysis (StatView 4.5; Abacus Concepts Inc. Berkeley, CA). We considered a P value significant when P < 0.05. Analysis of variance (ANOVA) was used to compare the means of different psychological parameters among the groups (either two groups or four groups). Bonferroni's correction was originally designed in the field of analysis of variance to take into account multiple sub group comparison, only when the overall model has been shown to be statistically significant. The correction imply to divide the usual p threshold set at 0.05 by the number of groups to compare. Thus, when one perform multiple comparison with 4 subgroups, the new p threshold becomes, here either 0.05/2=0.025 or 0.05/4=.0125. The need for this correction is controversial and disputed in the literature. (see 97: Thomas V Perneger What's wrong with Bonferroni adjustments BMJ 1998;316:1236-1238) "This paper advances the view, widely held by epidemiologists, that Bonferroni adjustments are, at best, unnecessary and, at worst, deleterious to sound statistical inference." By providing exact p value, we let the reader choose whether he want to apply the Bonferroni's adjustment or not. Regression models were performed to analysethe association between different psychological parameters assessed as continuous scores (independent variables, Xi) and the percentage of BMI variation after one year of follow-up (dependent variable, Y). The strength of this association was quantified by r-squared, which express the amount of variability of Y explained by X. We divided our group in subgroups by two criteria:
• Age – cut off point 35 years • BW – cut off point BMI 44 = 75% excess body weight (BW).
Range Meaning
< 90 Tendency to aggressiveness
90 - 100 Normal
> 125 Low self esteem

22
Even if age and BW are continuous variables, we choose to split our group in subgroups because, according to our study hypothesis, different subgroups might react differently after the GBP. The choice of the cut off points was made according to previous publications of our group (20). The original explanation of the cut off points was that, for all the patients that underwent GBP in our hospital, the median for age was 35 years and the median for weight was BMI 44 which means 75% excess BW or 120kg in the above mentioned article.

23
RESULTS We found the following psychological profile in our patients comparing to normal
subjects (Table 1) :
• A small elevation of anxiety scores of Hospital Anxiety and Depression Scale
(HAD),
• A mild depression scores (Beck Depression Inventory = BDI),
• A very small elevation of the Eating Disorder Inventory total score (sEDI2),
• A poor quality of life at Nottingham Health Profile (NHP).
TABLE 1: Pre-surgery psychological profile in BW and age groups
Mean +/- sem (pre-surgery values)
Psychological test
Normal range
<75% exc. BW
>75% exc. BW
Age <35 years
Age >35 years
All patients
HAD anxiety score <7 7.8
±0.6 8.4
±0.6 8.3
±0.6 8
±0.6 8.1
±0.4 HAD
depression score <7 5.7 ±0.6
5.4 ±0.5
5.5 ±0.6
5.6 ±0.5
5.6 ±0.4
BDI <8 13.7 ±1.7
14.6 ±1.3
15.5 ±1.7
13 ±1.3
14.2 ±1
RATH 90 - 100 96.1 ±3
99 ±3
95.6 ±3.8
99.3 ±2.2
97.6 ±2.1
NHP 0 10.7 ±1.2
12.6 ±1
11.5 ±1.1
11.8 ±1.1
11.7 ±0.7
sEDI2 27 - 63 66.4 ±5.2
65.3 ±3.6
70.3 ±5.3
62 ±3.6
65.9 ±3.1
Number of patients 39 41 37 43 80 No significant difference between those groups
There were no significant differences in the pre-surgery psychological profile between the following groups:
• Age: more than 35 years less than 35 years.
• BW excess: more than 75% excess BW (> 44 BMI) less than 75% excess BW (< 44 BMI), (Table 1). The % BMI correction = (actual BMI – normal BMI)*100 / (pre-surgery BMI – normal
BMI)

24
The normal BMI in the above formula was considered the BMI = 25kg/square meter
which is the superior value of the normal range.
The % of BMI correction at 1 year after GBP had the following characteristics (Table 2):
• The <75% exc. BW (<44 BMI) group lost 28% more in terms of BMI correction
after 1 year than the >75% exc. BW (>44 BMI) group. This difference was
statistically significant (p<0.001) even if, in absolute terms, the most obese lost
more kilograms.
• The younger lost 28% more in terms of absolute weight and 11% more in terms
of BMI correction than the older, but this difference is not statistically
significant.
TABLE 2: Weight loss at 1 year after GBP
Mean +/- sem (values 1 year after surgery)
Weight loss at 1 year <75%
exc. BW >75%
exc. BW Age <35
years Age >35
years All
patients
In kg 36.3 ±1.53
40.4 ±2.1
43.4 ±4.9
34 ±1.2
38.1 ±1.3
BMI correction 84.7%• ±3.4
65.9% ±4.2
81.2% ±4.5
72.8% ±3.9
76.5% ±3
Number of patients 23 18 18 23 41
• p<0.001 between <75% and >75% excess BW groups
High scores of depression in the HAD-D test were significantly correlated with a higher
body weight correction after one year in our entire group (p<0.04) (Table 3).
The degree of anxiety influenced the BW correction after 1 year. The influence was
depending on the BW excess at pre-surgery time point. We found a positive correlation in
< 75% excess BW group (< 44 BMI) and a negative correlation in the >75% excess BW
group (> 44 BMI).

25
TABLE 3: Prediction of BMI correction at 1 year with pre-surgery psychological tests, in
BW and age groups
P values for regression analysis of:
% of BMI correction at 1y vs. psychological tests Psychological
test <75%
exc. BW >75%
exc. BW Age <35
years Age >35
years All
patients
HAD-A 0.0147 0.0152* 0.109 0.450 0.490
HAD-D 0.0026 0.550 0.322 0.023 0.032
BDI 0.0044 0.071 0.795 0.134 0.161
RATH 0.439 0.024* 0.200 0.658 0.293
NHP 0.0003 0.015* 0.410 0.159 0.521
sEDI2 0.0623 0.383 0.542 0.329 0.190
Number of patients 23 18 18 23 41 * negative correlation
Globally, the impact of pre-surgery psychological profile on BMI correction after 1 year
was as follows (Table 3):
• In the < 75% BW excess group (<44 BMI) we found significant positive
correlations with: anxiety (HAD-A), depression (HAD-D and BDI) and the
quality of life (NHP)
• In the >75% BW excess group (>44 BMI) the correlations were negative with
significant values for: anxiety (HAD-A), self esteem (RATH) and the quality of
life (NHP).
The age had no influence on the relationship between psychological tests and the BMI
correction at 1 year (Table 3).

26
TABLE 4A: Pre-surgery EDI2 categories in BW and age groups
Mean +/- sem (pre-surgery values)
EDI2 Normal range
<75% exc. BW
>75% exc. BW
Age < 35 years
Age > 35 years
All patients
Drive for thinness 3 - 7 7.9
±0.7 7.7
±0.7 7.32
±0.62 8.2
±0.7 7.8
±0.5
Bulimia 1 - 2 3.4 ±0.7
3.1 ±0.6
3.9 ±0.8
2.7 ±0.4
3.2 ±0.4
Body dissatisfaction 9 - 15 21.9
±0.9 22.9 ±0.8
22.5 ±1
22.4 ±0.8
22.4 ±0.6
Ineffectiveness 1 - 4 5.2 ±1
4 ±0.6
5.8 ±1.1
3.6 ±0.6
4.6 ±0.6
Perfectionism 4 - 9 3.8 ±0.6
4.7 ±0.6
3.9 ±0.7
4.6 ±0.5
4.3 ±0.4
Interpersonal distrust 1 - 3 3
±0.5 3.4
±0.6 3.9 ±0.6
2.7 ±0.5
3.2 ±0.4
Interoceptive awareness 1 - 5 5.2
±0.8 4.7
±0.7 5.4 ±0.9
4.5 ±0.7
4.9 ±0.5
Maturity fears 2 - 4 3.7 ±0.6
3.4 ±0.5
3.8 ±0.7
3.3 ±0.4
3.5 ±0.4
Asceticism 2 - 5 5.6 ±0.6
4.9 ±0.5
5.7 ±0.7
4.8 ±0.4
5.2 ±0.4
Impulse regulation 1 - 4 3
±0.6 2.8
±0.45 3.8• ±0.6
2.1 ±0.4
2.9 ±0.4
Social insecurity 2 - 5 3.7
±0.6 3.8
±0.5 4.2 ±0.7
3.4 ±0.5
3.8 ±0.4
Number of patients 39 41 37 43 80
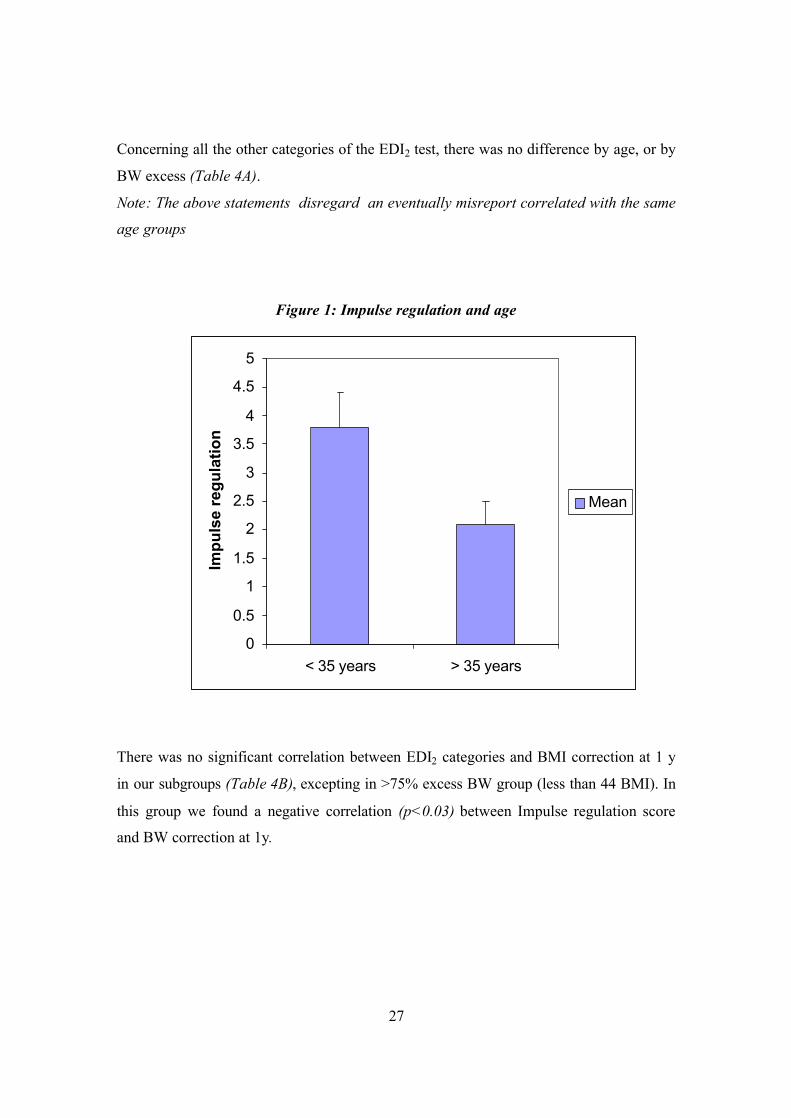
• p< 0.03 between <35years and >35years group The Impulse regulation scores were significantly influenced by age. For the younger
group the score is 80% higher than in the older group (Figure 1 and Table 4A). Even if
both values are in the normal range, there is a statistically significant (p<0.03) trend in
the younger group to have higher scores; meaning that the <35 years patients had more
difficulty to regulate their binge eating behaviour than the >35 years patients. .
27
Concerning all the other categories of the EDI2 test, there was no difference by age, or by
BW excess (Table 4A).
Note: The above statements disregard an eventually misreport correlated with the same
age groups
Figure 1: Impulse regulation and age
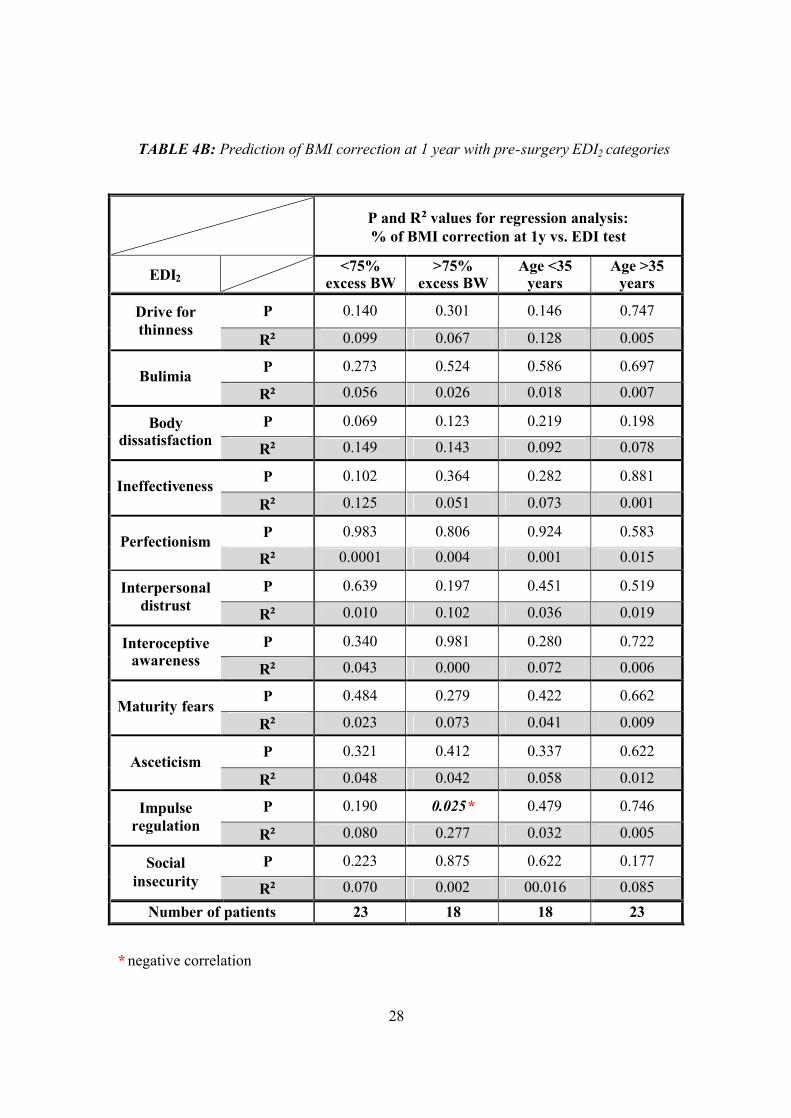
There was no significant correlation between EDI2 categories and BMI correction at 1 y
in our subgroups (Table 4B), excepting in >75% excess BW group (less than 44 BMI). In
this group we found a negative correlation (p<0.03) between Impulse regulation score
and BW correction at 1y.
0
0.5
1
1.5
2
2.5
3
3.5
4
4.5
5
< 35 years > 35 years
Impu
lse
regu
latio
n
Mean
28
TABLE 4B: Prediction of BMI correction at 1 year with pre-surgery EDI2 categories
P and R² values for regression analysis: % of BMI correction at 1y vs. EDI test
EDI2 <75% excess BW
>75% excess BW
Age <35 years
Age >35 years
P 0.140 0.301 0.146 0.747 Drive for thinness R² 0.099 0.067 0.128 0.005
P 0.273 0.524 0.586 0.697 Bulimia R² 0.056 0.026 0.018 0.007
P 0.069 0.123 0.219 0.198 Body dissatisfaction R² 0.149 0.143 0.092 0.078
P 0.102 0.364 0.282 0.881 Ineffectiveness R² 0.125 0.051 0.073 0.001
P 0.983 0.806 0.924 0.583 Perfectionism R² 0.0001 0.004 0.001 0.015
P 0.639 0.197 0.451 0.519 Interpersonal distrust R² 0.010 0.102 0.036 0.019
P 0.340 0.981 0.280 0.722 Interoceptive awareness R² 0.043 0.000 0.072 0.006
P 0.484 0.279 0.422 0.662 Maturity fears
R² 0.023 0.073 0.041 0.009
P 0.321 0.412 0.337 0.622 Asceticism
R² 0.048 0.042 0.058 0.012
P 0.190 0.025* 0.479 0.746 Impulse regulation R² 0.080 0.277 0.032 0.005
P 0.223 0.875 0.622 0.177 Social insecurity R² 0.070 0.002 00.016 0.085
Number of patients 23 18 18 23
* negative correlation

29
We also divided our group in combined subgroups, by age and % of excess BW as follows:
• <35 years and <75% excess BW (BMI < 44), • <35 years and >75% excess BW(BMI > 44), • >35 years and <75% excess BW (BMI < 44), • >35 years and >75% excess BW(BMI > 44),
in order to detect further implication of the age and BW on the weight loss at one year. The pre-surgery psychological profile of those groups we found the following significant differences (Table 5A):
TABLE 5A: Pre-surgery psychological profile in combined BW and age groups
Mean +/- sem (pre-surgery values) Age <35 years Age >35 years
Psychological test
Normal range
<75% excess BW
>75% excess BW
<75% excess BW
>75% excess BW
HAD-A <7 8.5 ± 0.837
8.1 ± 0.836
7.3 ± 0.775
8.7 ± 0.773
HAD-D <7 6.1 ± 0.903
4.8 ± 0.896
5.4 ± 0.850
5.8 ± 0.63
BDI <8 17.3• ± 2.683
13.7 ± 2.069
10.6 ± 1.992
15.4 ± 1.549
RATH 90 - 100 96.2 ± 5.514
94.9 ± 5.427
96 ± 3.163
102.5 ± 2.891
NHP 0 12.6 ± 1.617
10.5 ± 1.413
9.1▲ ± 1.746
14.3 ±1.239
sEDI2 27 - 63 77.7•• ± 9.256
63.2 ± 5.092
56.8 ± 4.912
67.1 ± 5.073
Number of patients 18 19 21 22
• p< 0.03 between <35 years and > 35 years, in the <75% excess BW
•• p< 0.02 between <35 years and > 35 years, in the <75% excess BW
▲ p< 0.02 between <75% and >75% excess BW, in the >35 years group

30
1. depression score (BDI) was 63% higher in <35 years than in >35 years in the <75% excess BW group (BMI < 44), (p<0.03). So younger subjects had a significantly higher score of depression than older subjects.
2. quality of life score (NHP) was 57% higher – showing a poorer quality of life –
in >75% excess BW (BMI > 44),than in <75% excess BW (BMI < 44), in the >35 years group (p<0.02). So the older the patient is, the poorer the quality of life he/she had (Figure 2).
Figure 2: Quality of life (NHP)
A = <35 years < 75% exc.BW group, B = <35 years > 75% exc.BW group, C =
>35 years < 75% exc.BW group, D = >35 years > 75% exc.BW group.
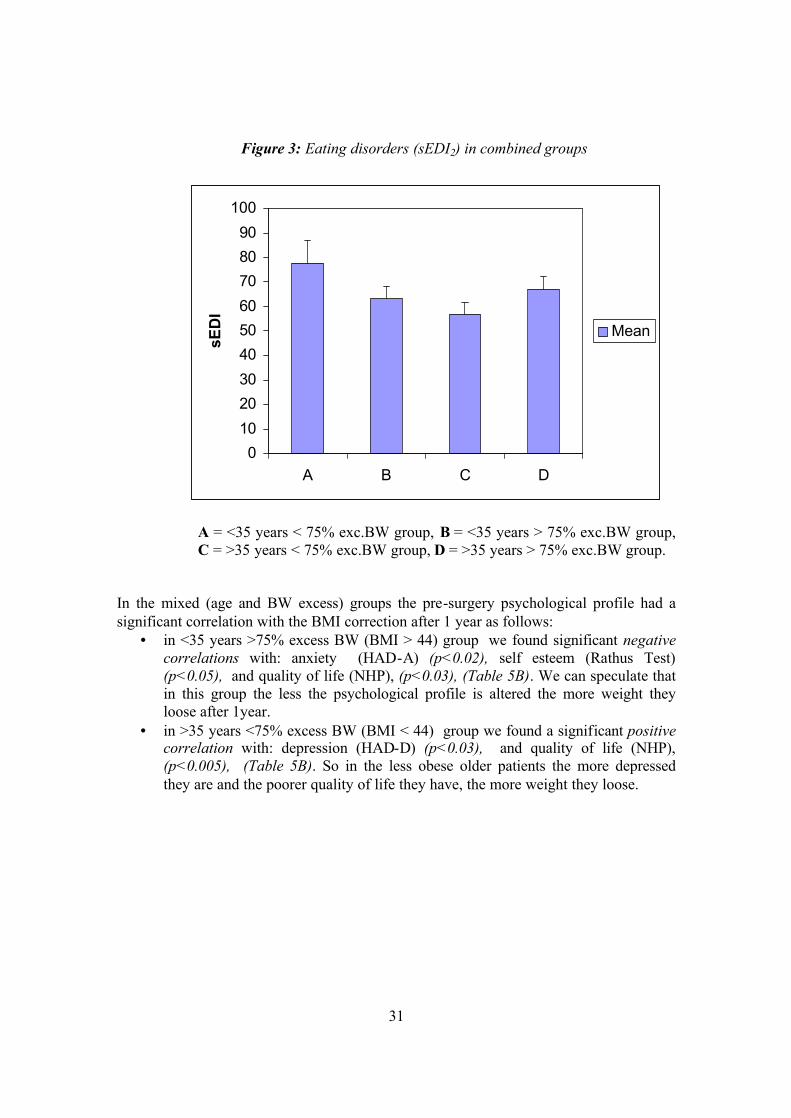
3. eating disorder summary score (sEDI2) was 37% higher in <35 years than in >35
years in the <75% excess BW group (BMI < 44), (p<0.02). So younger subjects had a significantly higher eating disorder summary score than older subjects, meaning that eating disorders are more important in young people (Figure 3)
0
2
4
6
8
10
12
14
16
18
A B C D
NH
P
Mean
31
Figure 3: Eating disorders (sEDI2) in combined groups
A = <35 years < 75% exc.BW group, B = <35 years > 75% exc.BW group, C = >35 years < 75% exc.BW group, D = >35 years > 75% exc.BW group.
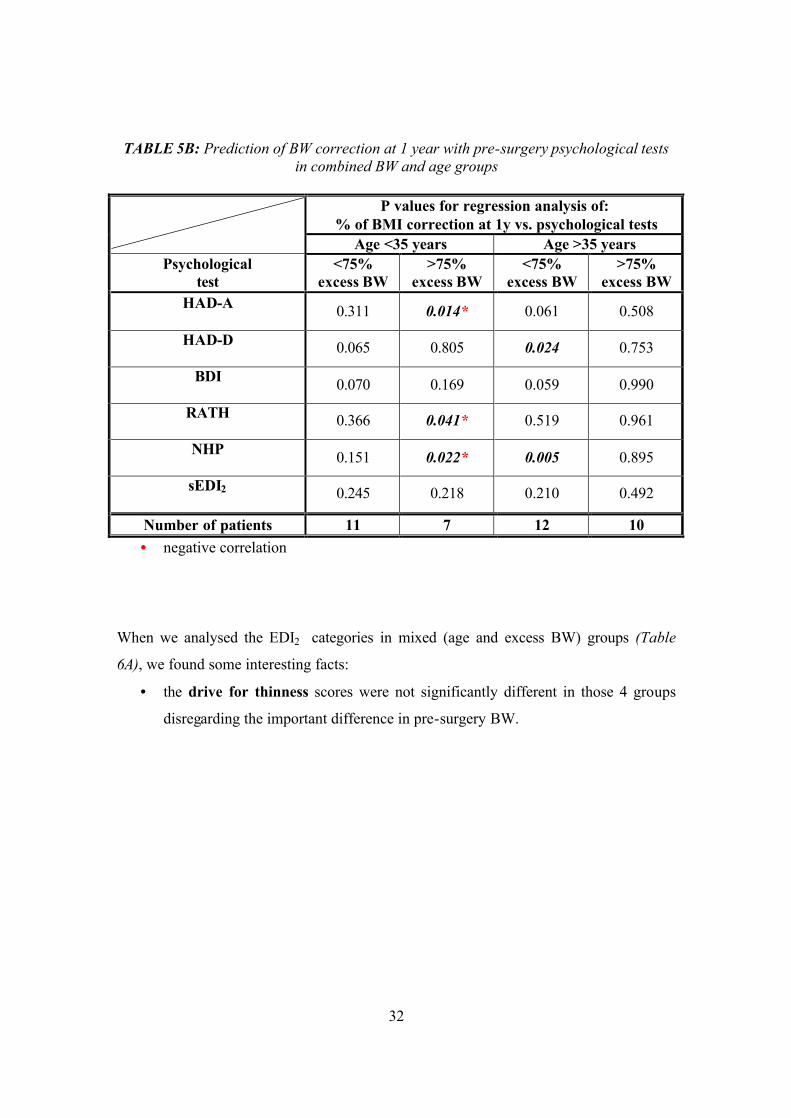
In the mixed (age and BW excess) groups the pre-surgery psychological profile had a significant correlation with the BMI correction after 1 year as follows:
• in <35 years >75% excess BW (BMI > 44) group we found significant negative correlations with: anxiety (HAD-A) (p<0.02), self esteem (Rathus Test) (p<0.05), and quality of life (NHP), (p<0.03), (Table 5B). We can speculate that in this group the less the psychological profile is altered the more weight they loose after 1year.
• in >35 years <75% excess BW (BMI < 44) group we found a significant positive correlation with: depression (HAD-D) (p<0.03), and quality of life (NHP), (p<0.005), (Table 5B). So in the less obese older patients the more depressed they are and the poorer quality of life they have, the more weight they loose.
0102030405060708090
100
A B C D
sED
I
Mean
32
TABLE 5B: Prediction of BW correction at 1 year with pre-surgery psychological tests in combined BW and age groups
P values for regression analysis of:
% of BMI correction at 1y vs. psychological tests
Age <35 years Age >35 years Psychological
test <75%
excess BW >75%
excess BW <75%
excess BW >75%
excess BW HAD-A
0.311 0.014* 0.061 0.508
HAD-D 0.065 0.805 0.024 0.753
BDI 0.070 0.169 0.059 0.990
RATH 0.366 0.041* 0.519 0.961
NHP 0.151 0.022* 0.005 0.895
sEDI2 0.245 0.218 0.210 0.492
Number of patients 11 7 12 10 • negative correlation
When we analysed the EDI2 categories in mixed (age and excess BW) groups (Table
6A), we found some interesting facts:
• the drive for thinness scores were not significantly different in those 4 groups
disregarding the important difference in pre-surgery BW.

33
TABLE 6A: Pre-surgery EDI2 categories in combined BW and age groups
Mean +/- sem (pre-surgery values)
Age <35 years Age >35 years
EDI2 Normal range
<75% excess BW
>75% excess BW
<75% excess BW
>75% excess BW
Drive for thinness 3 - 7 7.7 ±0.9
7 ±0.9
8 ±1.1
8.3 ±1
Bulimia 1 - 2 4.8• ±1.2
3 ±1
2.1 ±0.6
3.2 ±0.7
Body dissatisfaction 9 - 15 22.3
±1.4 22.7 ±1.5
21.7 ±1.3
23 ±0.9
Ineffectiveness 1 - 4 8.2•• ±2
3.5■ ±0.8
2.6 ±0.6
4.5▲▲ ±1
Perfectionism 4 - 9 3.2 ±1.1
4.6 ±1
4.4 ±0.7
4.7 ±0.7
Interpersonal distrust 1 - 3 3.7
±0.8 4
±0.9 2.4
±0.6 3
±0.7
Interoceptive awareness 1 - 5 6.8
±1.5 4.2 ±1
3.8 ±0.8
5.2 ±1.1
Maturity fears 2 - 4 4.9 ±1.1
2.8 ±0.7
2.7 ±0.5
3.8 ±0.8
Asceticism 2 - 5 6.8• ±1.1
4.7 ±0.8
4.5 ±0.6
5 ±0.7
Impulse regulation 1 - 4 4.8••
±1.1 2.8 ±0.6
1.4 ±0.4
2.7▲ ±0.7
Social insecurity 2 - 5 4.6 ±1.1
3.8 ±0.8
3 ±0.7
3.7 ±0.6
No of patients 18 19 21 22
• p< 0.05 between <35 years and > 35 years, in the <75% excess BW group •• p< 0.002 between <35 years and > 35 years, in the <75% excess BW group ■ p< 0.008 between <75% and >75% excess BW, in the <35 years group ▲▲ p< 0.03 between <35years <75% excess BW group and >35years >75% excess BW group ▲ p< 0.05 between <35years <75% excess BW group and >35years >75% excess BW group

34
• the bulimia scores were 121% more elevated in <35years than >35 years in <75% excess BW (BMI < 44) group which is statistically significant ( p< 0.05), (Figure 4)
Figure 4: Bulimia in combined groups
A = <35 years < 75% exc.BW group, B = <35 years > 75% exc.BW group, C = >35 years < 75% exc.BW group, D = >35 years > 75% exc.BW group
• ineffectiveness scores were significantly more elevated in <35years <75%
excess BW (BMI < 44) group then in all the other three groups (Table 6A and
Figure 5)
Figure 5: Ineffectiveness in combined groups
0
1
2
3
4
5
6
7
A B C D
Bul
imia
Mean
0
2
4
6
8
10
12
A B C D
Inef
fect
iven
ess
Mean

35
• the interoceptive awareness and the maturity fears scores were elevated - but
without statistically significance - in <35years <75% excess BW (BMI < 44)
group then in all the other three groups (Table 6A),
• the ascetism scores were 51% more elevated in <35years than >35years in the
<75% excess BW (BMI < 44) group, which is statistically significant ( p< 0.05),
(Table 6A),
• the impulse regulation scores are significantly more elevated in <35years <75%
excess BW (BMI < 44) group then in all patients of >35 years ( p< 0.002),
(Table 6A and Figure 6).
Figure 6: Impulse regulation in combined groups
A = <35 years < 75% exc.BW group, B = <35 years > 75% exc.BW group, C =
>35 years < 75% exc.BW group, D = >35 years > 75% exc.BW group
0
1
2
3
4
5
6
7
A B C D
Impu
lse
regu
latio
n
Mean

36
TABLE 6B: Prediction of BW correction at 1 year with pre-surgery EDI categories in combined BW and age groups
P and R² values for regression analysis of:
% of BMI correction at 1y vs. EDI test Age <35 years Age >35 years
EDI2 <75% excess BW
>75% excess BW
<75% excess BW
>75% excess BW
P 0.086 0.501 0.493 0.641 Drive for thinness R² 0.280 0.095 0.047 0.026
P 0.751 0.703 0.2965 0.716 Bulimia R² 0.011 0.032 0.106 0.015
P 0.854 0.044* 0.073 0.819 Body dissatisfaction R² 0.004 0.589 0.287 0.006
P 0.219 0.039* 0.240 0.989 Ineffectiveness R² 0.165 0.606 0.134 0.000
P 0.583 0.691 0.725 0.033 Perfectionism R² 0.036 0.035 0.012 0.412
P 0.293 0.781 0.807 0.093 Interpersonal distrust R² 0.121 0.017 0.006 0.282
P 0.490 0.823 0.678 0.507 Interoceptive awareness R² 0.053 0.011 0.017 0.051
P 0.232 0.330 0.137 0.938 Maturity fears
R² 0.156 0.188 0.206 0.001
P 0.510 0.746 0.625 0.394 Asceticism
R² 0.051 0.022 0.025 0.080
P 0.499 0.011* 0.307 0.892 Impulse regulation R² 0.052 0.759 0.101 0.002
P 0.283 0.531 0.458 0.270 Social insecurity R² 0.127 0.088 0.055 0.135
Number of patients 11 7 12 11 * negative correlation
37
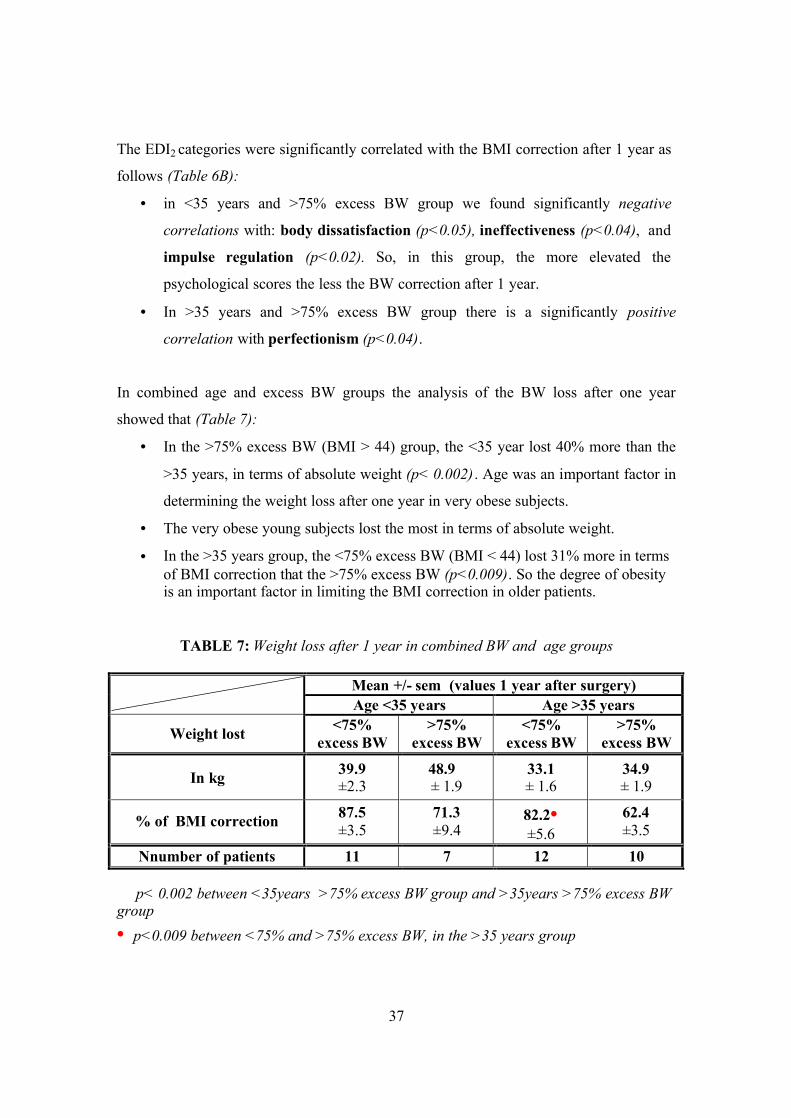
The EDI2 categories were significantly correlated with the BMI correction after 1 year as
follows (Table 6B):
• in <35 years and >75% excess BW group we found significantly negative
correlations with: body dissatisfaction (p<0.05), ineffectiveness (p<0.04), and
impulse regulation (p<0.02). So, in this group, the more elevated the
psychological scores the less the BW correction after 1 year.
• In >35 years and >75% excess BW group there is a significantly positive
correlation with perfectionism (p<0.04).
In combined age and excess BW groups the analysis of the BW loss after one year
showed that (Table 7):
• In the >75% excess BW (BMI > 44) group, the <35 year lost 40% more than the
>35 years, in terms of absolute weight (p< 0.002) . Age was an important factor in
determining the weight loss after one year in very obese subjects.
• The very obese young subjects lost the most in terms of absolute weight.
• In the >35 years group, the <75% excess BW (BMI < 44) lost 31% more in terms of BMI correction that the >75% excess BW (p<0.009). So the degree of obesity is an important factor in limiting the BMI correction in older patients.
TABLE 7: Weight loss after 1 year in combined BW and age groups
Mean +/- sem (values 1 year after surgery) Age <35 years Age >35 years
Weight lost <75% excess BW
>75% excess BW
<75% excess BW
>75% excess BW
In kg 39.9 ±2.3
48.9► ± 1.9
33.1 ± 1.6
34.9 ± 1.9
% of BMI correction 87.5 ±3.5
71.3 ±9.4
82.2• ±5.6
62.4 ±3.5
Nnumber of patients 11 7 12 10 ► p< 0.002 between <35years >75% excess BW group and >35years >75% excess BW group • p<0.009 between <75% and >75% excess BW, in the >35 years group

38
We verified the correlations between sEDI2 and all the other psychological tests we used.
We found a very strong correlation (p<0.0001) for all of them.
39
DISCUSSION
In our group the BW loss after one year was slightly higher than the one reported in the
literature: 76.5% BMI correction one year after the bypass (i.e.76.5% loss of the excess
BMI) compared to 50-60% correction in the literature (4, 8, 18, 64). We speculate that
the difference arises from the different follow-up periods considered: one year in our
study, between one and two years in the literature. More specifically, we know that after
the first year there can be a weight regain of 7-9kg (4) that corresponds to the difference
between our results and the literature.
The pre-surgery psychological profile of our patients was sensibly equivalent with the
same population sample in the literature in terms of:
• Eating disorders: 51% of our patients had an abnormal eating behaviour. In the
literature have been reported figures between 30% and a maximum of 81.5%
(49). The lower figure is based on a multicentric study on the obese seeking for
treatment (80, 81, 29, 15, 85) while the higher figure was determined into a
restricted group (i.e.22 patients) with an average of BMI 48.8kg/m2. The average
for the eating disorders incidence, especially the binge eating, has been placed
between 40-50% in the literature (50% precisely 47,49), when adapted for a
population over BMI 40 - which correspond to our results.
• Anxiety and depression: The separation of our group of patients in subgroups
was made using as cut point the superior limit of the normal. The main group was
divided into a group of normal patients and a pool of different degrees of anxiety
or depression (very mild, mild, moderate and severe). In the main group
abnormal scores for depression were found as follows: 29% of the subjects when
using HAD-d test and 69% of the subjects when using the BDI test. We speculate
that this difference comes from the different sensitivity of those two tests. In the
literature a prevalence of major depression was found in 29% to 51% of a similar
population (9, 39, 43). However, no control groups were used in these studies,
neither in ours, and therefore the findings cannot, be clearly interpreted.

40
Concerning the anxiety, our results showed that 58% of our group have
abnormal scores. There was no coherent data in the literature to compare our
results.
We speculate that it is possible that there may be an increase incidence of
depression among the severely obese subjects, but a comparison of clinical and
epidemiological data may not be valid and obviously further investigations are
needed.
• Quality of life and Self-esteem: 80% of our patients had abnormal scores for
those two parameters. Unfortunately, even there is a large consensus in the
literature that morbidly obese persons have a poor quality of life and a low self-
esteem, there is no available coherent data to compare our results. The reasons of
this situation consist in: the use of different tests to assess those two parameters,
the absence of control groups, the variability of selection criteria for the testing
groups.
Correlation between pre-surgery depression and BW correction at one year
Our finding that pre-surgery depression is positively correlated with the weight loss after
the GBP – is a new element. Anyhow previous studies (43, 87) showed that depression,
even in the severe stage, did not diminish the weight loss after GBP.
Our hypothesis that some subgroups of our main group might loose weight differently
after the GBP, in relation to their pre-surgery psychological profile – was confirmed.
Weight was determining in this relationship. Age did not play a role.
For the most obese of our patients, anxiety, depression and the poor quality of life
influenced negatively the weight loss after the GBP. This was not the case for the less
obese of our group (BMI < 44). The choice of our cut off in separating the groups – as
described in the Methods – can be criticize, but the results we found on the psychological
field correspond with the biological differences found when studying the same subgroups
41
(12), meaning that those groups are different and the pre-surgery BMI induce the
difference.
The patients included in our study with a BMI between 35 and 40kg/square meter, by
definition had additional pathology related/induced by obesity. The patients over BMI
40kg/square meter have almost all the time obesity related pathology which means that
our group was quite homogeny. So we had a selection bias in our study imposed by the
bypass selection criteria that made difficult to assign the pre-surgery differences in the
psychological profile we found - comparing to the normal range – to obesity itself or to
the polypathology related to it. Further studies are needed examining subgroups with and
without associated pathology in order to answer the above question.
We stress upon the fact that there is no difference in the pre-surgery psychological profile
between our two weight groups (35 to 44 kg/square m and more than 44), the only
difference is their way to react – in terms of loosing weight - to psychopathology.
We can speculate that pre-surgical BW changes the impact of the pre-surgical
psychological profile on the BW correction after the GBP. We do not now the
mechanism. Further studies would be needed.
Strengths of our study
• All our patients underwent exactly the same surgery. The GBP technique used in
our clinic is a standardised technique.
• Using our exclusion criteria no patient seeking for obesity treatment was
excluded. We might speculate that our group is representative for Geneva’s
morbid obese persons seeking for treatment.
• The battery of the five tests used, largely investigate the psychological profile of
our patients.
42
Weakness of our study
• Our group of patients was limited to 80 subjects meaning that we are at the inferior
limit of the statistic significance.
• The recruitment of our patients was limited to Geneva region given that our research
was done at the Geneva University Hospital.
• The group was not representative for Geneva population, in general, given that most
of our patients have Hispanic origins.
• The psychological estimations concerning the entire group do not take into account
different degrees of one pathology, given that we choose to express results in normal
versus not normal.
• The patients between 35 and 40kg/square m had one or more obesity related
pathology by definition - due to the selection criteria for the gastric bypass.
• We used cut off points to determine subgroups even if the variable (age or weight)
was linear, and this because of our clinical hypothesis that subgroups might react
differently in term o loosing weight after GBP.
• The choice of the above mentioned cut off points was made using the median of our
group for age and for weight so it depended on our sample. Similar investigations –
using the same cut off points – made by other groups, are needed to confirm or infirm
our findings.
Recommendations
Taking into account the above results we can speculate that very obese patients
(BMI>44) would beneficiate from a psychological therapy BEFORE surgery, in order to
diminish the degree of anxiety and depression, and to improve the self-esteem. This
intervention might improve their BW correction at one year after the GBP.
43
REFERENCES
1. Allison DB, Saunders SE: Obesity in North America. Obesity, volume 84, nr.2: 305-332, march 2000.
2. Andersen E, Crespo CJ, Barlett S, Cheskin LJ, Pratt M. Relationship of physical activity and television watching with body weight and level of fatness among children. Results from the third national health and nutrition examination survey. JAMA vol. 279: 938-942, 1988
3. Badesvant A et Al. Guide pratique pour le diagnostic, la prevention, le traitement des obesités en France. Cahiers de nutrition et de diététique: 3-42,1997.
4. Balsinger BM, Luque-de-Leon E, Sarr MG: Surgical treatment of obesity: Who is an appropriate candidate? Mayo Clin. Proc, 72: 551-558, 1997.
5. Balsinger BM, Murr MM, Poggio JL, Sarr MG: Surgery for weight control in patients with morbid obesity. Medical Clinics of North America, vol. 84, no 2:477-489, march 2000.
6. Beck AT, Ward C, Mendelson M, Mock J, Erbaugh J. An Inventory for measuring depression. Archives of General Psychiatry 4: 53-63, 1961.
7. Beck AT, Beamesderfer A. Assessment of depression, the Depression Inventory. In: Psychological Measurements in Psychopharmacology 7: 151-169, 1974.
8. Benotti PN, Forse RA. The role f gastric surgery in the multidisciplinary management of severe obesity. Am J of Surg, 169:361-367, 1995.
9. Berman WH, Berman ER, Heymsfield S et al: The effect of psychiatric disorders on weight loss in obesity clinic patients. Behav Med 18:167 – 172, 1993.
10. Bobbioni-Harsch E, Assimacopoulos-Jeannet F, Lehmann T, Munger R, Allaz A-F, Golay A. Leptin plasma levels as a marker of sparing-energy mechanisms in obese women. Int J Obes, 23: 470-5,1999.
11. Bobbioni-Harsch E, Morel P, Huber O, Assimacopoulos-Jeannet F, Chassot J, Lehmann T, Volery M, Golay A. Energy economy hampers body weight loss after gastric bypass. J Clin Endocrinol Metab, vol. 85, no12: 4695-700, 2000.
12. Bobbioni-Harsch E, Huber O, Morel P, Chassot G, Lehmann T, Volery M, Chliamovitch E, Muggler C, Golay A. Factors influencing energy intake and body weight loss after gastric bypass. Eur J Clin Nutr 2002 Jun;56(6):551-6
13. Bouchard C. Genetics of obesity in humans: current issues. In: The origin and consequence of obesity, Ciba foundation Symposium 201. Wiley 1996, Chicester: 108-117.
14. Brolin RE: Gastrointestinal Surgery for severe obesity. Nutrition vol.12, no 6:403-404, 1996.
15. Bruce B, Agras WS : Binge eating in females: A population-based investigation. Int J Eat Disord 12: 365-373,1992.
16. Capella JF, Capelle RF. The weight reduction operation of choice: vertical banded gastroplasty or gastric bypass? Am J of Surgery 171:74-79, 1996.
17. Caraway WT. Carbohydrates. In: Tietz NW,ed Fundamentals of clinical chemistry, ed 2 Philadelphia: WB Saunders Co.; 247,1987.

44
18. Clark MM, Ruggiero L, Pera V Jr, Goldstein MG, Abrams DB. Assessment, classification and treatment of obesity: behavioural medicine perspective. In: StoudemirA, Fogel BS editors. Psychiatric Care of the Medical patient. New York: Oxford University Press: 903-926, 1993.
19. Consensus sur le traitement de l’obésité en Suisse 1998. 20. Cottraux J. Protocoles et échelles d’évaluation en psychiatrie et an psychologie,
2ème edition, Paris: Masson 1998. 21. CRD (Centre of reviews and dissemination): Glenny AM, O’Meara S, Melville A,
Sheldon TA, Wilson C, The treatment and prevention of obesity: a systematic review of the literature. Int J Obes, 21:715-737, 1997 (http//www.york.ac.uk/inst/crd/obesity.htm)
22. Deitel M: Jejunocolic and jejunoileal bypass: an historical perspective. In: Surgery for Morbidly Obese Patient, M Deitel, editor. Philadelphia, Lea and Febiger, pp 81-90,1989.
23. Deitel M: Overview of Operations for Morbid Obesity. World J surg 22, 913-918,1998.
24. Deitel M, Shahi B, Anand PK, Deitel FH, Cardinell DL: Long term outcome in a series of jejuno-ileal bypass patients. Obes. Surg. 3:247, 1993.
25. Denke MA, Sempos CT, Grundy SM: Excess body weight: An under recognised controbutor to high blood cholesterol levels in white American men. Arch Intern Med 153:1093-1103,1993.
26. Denke MA, Sempos CT, Grundy SM: Excess body weight: An under recognised controbutor to high blood cholesterol levels in white American men. Arch Intern Med 154:401-410,1994.
27. Dietz WH Jr, Gortmaker SL. Do we fatten our children at the television set? Obesity and television viewing in children and adolescents. Pediatrics 75:807-12, 1985.
28. Dole VP, Meinertz H. Microdetermination of long chain fatty acids in plasma and tissues. J. Biol Chem. 235: 2595-99,1960.
29. Fairburn CG, Welch SC, Hay PJ. The classification of recurrent overeating: the binge eating disorder proposal. International Journal of Eating Disorders 13:155-9, 1993.
30. Fairburn CG, Cooper Z: New perspectives on dietary and behavioural treatments for obesity. International J of Obesity 20 suppl 1 S9-S13, 1996.
31. Fairburn CG, Hay PJ, Welch SL: Binge eating and bulimianervosa: Distribution ans determinants. In Faiburn CG , Wilson GT (eds), Binge Eating. New Yoek, Guildford press; 123-143, 1993.
32. Faith M, Allison D: Assessment of psychological status among obese persons. In Thompson J editor: Body Image, Eating Disorders and Obesity. Washington DC, American psychological association, 365 – 388,1996.
33. Ferrannini E. The theoretical bases of indirect calorimetry: a review. Metab.37:287-301,1988.
34. Ferro-Luzzi A, Martino L. Obesity and physical activity. In: The origins and consequences of obesity (Ciba Foundation Symposium 201). Chichester: Wiley 207-27,1993.

45
35. Fobi MAL, Lee H, Holness R, Cabinda DG. Gastric bypass operation for obesity. World J Surg 22, 925-935,1998.
36. Friedman M, Brownell K. Psychological correlates of obesity: Moving to the next research generation. Psych Bull 117:3-20, 1995.
37. Garner DM, Olmsted MP, Polivy J. Development and validation of a multidimensional Eating Disorder Inventory for anorexia nervosa and bulimia. Int J Eat Disord 2; 15-34, 1983.
38. Golay A, Morel Y, Lehmann T, Shutz Y. Fluctuations pondérales et regimes alimentaires. Cah Nutr Diét XXXIX, 2, 81-84,1994.
39. Goldsmith SJ, Anger-Friedfeld K, Beren S et al: Psychiatric illness in patients presenting for obesity treatment. Int J Eat Disord 12: 63-71, 1992.
40. Goldstein DJ. Beneficial health effects of modest weight loss. Int J Obesity; 16:397-415, 1992.
41. Gortmaker SL, Must A, Sobol AM, et al. Television viewing as a cause of increasing adiposity among children in the USA, 1986-1990. Arch Pediatr Adolescent Med 150: 356-62, 1996.
42. Hall JC & al, Gastric Surgery for Morbid Obesity – The Adelaide Study. Ann Surg April: 419-427,1990.
43. Halmi KA, Long M, Stunkard AJ, et al: Psychiatric diagnosis of morbidly obese gastric bypass patients. Am J Psychiatry 137:470-472,1980.
44. Herbert V, Lau KS, Gottlieb CW, Bleicher SY. Coated charchoal immunoassay of insulin. J Clin Endocrinol Metab. 25:1175-84, 1965.
45. Hill JO, Peters JC. Environmental contributions to the obesity epidemic. Science 280:1371-3, 1998.
46. Hill JO, Drougas HJ, Peters JC. Physical activity, fitness and moderate obesity. In: Physical activity, Fitness and Health: International Proceedings and Consensus Statement, Bouchard C, Shephard RJ, Stephens T, rds. Human Kinetics, Champaign, IL: 684-95, 1994.
47. Hsu LKG, Betancourt S, Sullivan Sp: Eating disturbances before and after vertical banded gastroplasty: A pilot study. Int j Eat Disord 19:23-24,1996.
48. Hsu LKG & al. Nonsurgical factors that influence the outcome of bariatric surgery: a review. Psychosomatic Medicine 60:338-346,1998.
49. Hsu LKG, Sullivan SP, Benotti PN. Eating disturbances and outcome of gastric bypass surgery: a pilot study. Int J Eat Disord 21: 385-390, 1997.
50. Hunt SM, McEwen J, McKenna SP. Measuring health status: a new tool for clinicians and epidemiologists. J of the Royal College of General Practitioners 35:185-88,1985.
51. Jagstaidt V, Golay A, Pasini W. Sexuality and female obesity. Méd et Hyg avril 1997, no.2157, 640-646.
52. James WPT, Schofield EC. Human energy requirements. A manual for planners and nutritionists. Oxford: FAO and Oxford University Press, 1990.
53. Jeffrey RW & al. Long-term maintenance of weight loss: current status. Health psychology 2000, vol.19 no.1 (suppl), 5-16.
54. Jeffrey RW. Does weight cycling present health risk? Am J Clin Nutr 1996, 63 (suppl): 452-455.

46
55. Jéquier E, Felber JP. Indirect calorimetry. Baillière’s Clin Endocrinol Metab. 1:911-935, 1987.
56. Kalarchian MA, Wilson GT, Brolin RE, Bradley L. Binge eating in bariatric surgery patients. Int J Eat disord 23:89-92, 1998.
57. Kanders BS, Blackburn GL: Reducing primary risk factors by therapeutic weight loss. In: Treatment of the seriously obese patient, TA Wadden, TB Van Itallie (eds). Guilford Press: New York 1992, pp213-230.
58. Kannel WB. Metabolic risk factors for coronary heart disease in women: perspective from the Framingham study. Am Heat J, 114:413-9,1987.
59. Knol JA. Management of the problem patient after bariatric surgery. Gastroenterology clinics of north America, vol. 23,no.2, June 1994.
60. Kuehnel RH, Wadden TA.Binge eating disorder, weight cycling and psychopathology. Internat J Eat Disord, vol.15, no. 4, 321-329, 1994.
61. Kushner R. Managing the obese patient after bariatric surgery: a case report of severe malnutrition and review of the literature. J of Parenteral end Enteral Nutrition, vol. 24, no.2, 126-132, 2000.
62. Levy E, Levy, Le Pen C, Basdevant A. The economic cost of obesity: the French situation. In J Relat Obes Metab Disord, 19:788-92,1995.
63. Lusk G. Animal calorimetry: analysis of the oxidation of mixtures of carbohydrate and fat. J Biol Chem. 1924; 59: 41-42.
64. Martin LF, Hunter SM, Lauve RM, O’Leary JP. Severe obesity: expensive to society, frustrating to treat, but important to confront. South Med J, 88:895-902, 1995.
65. Morel Y, Allaz AF, De Tonnac N, Kammer A, Golay A. Le traitement diététique de l’excès pondéral – phase de perte de poids et phase de maintien du poids. Praxis 85, no.49, 1574-1577, 1996.
66. Morel Y. L’approche diététique de l’excès pondéral. . Praxis 85, no.49, 1584-88, 1996.
67. Molinari E, Ragazzoni P, Morosin A. Psychopathology in obese subjects with and without binge eating disorder and bulimic subjects. Psychological Reports, 1997, 80,1327-35.
68. Nieman DC, Custer WF, Butterworth DE, Utter AC, Henson DA. Psychological response to exercise training and/or energy restriction in obese women. J of Psychosomatic Research 48, 23-29, 2000.
69. Painot D, Jotterand S, Kammer A, Fossati M, Golay A. Simultaneous nutritional cognitive--behavioural therapy in obese patients. Patient Educ Couns 2001 Jan;42(1):47-52
70. Peace K & al. Psychobiological effects of gastric restriction surgery for morbid obesity. NZ Med J, 102:76-68, 1989
71. Polivy J, Hermann CP. Dieting and binging. Am Phychol, 40: 193-201,1985 72. Popkin DM, Doak CM,. The obesity epidemics a worldwide phenomenon.
Nutrition reviews, 50:106-14,1998. 73. Powers PS, Perez A, Boyd F, Rosemurgy A. Eating pathology before and after
bariatric surgery: a prospective study. Int J Eat Disord 25:293-300, 1999.

47
74. Poston WSC, Ericsson M, Linder J, Nilsson T, Goodrick GK, Foreyt JP. Personality and prediction of weight loss and relapse in the treatment of obesity. Int J Eat Disord 25: 301-9, 1999.
75. Reinhold RB. Late results of gastric bypass surgery for morbid obesity. J of the American College of Nutrition, vol. 13, no.4, 326-31, 1994.
76. Ricca V, Mannucci S, Moretti M, Di Bernardo T, Zucchi T, Cabras PL, Rotella CM. Screening for eating disorder in obese outpatients. Comprehensive Psychiatry, vol. 41., no. 2, 111-115, 2000.
77. Saelens BE, Ernst MM, Epstein H. Maternal child feeding practices and obesity: a discordant sibling analysis. Int J Eat Disord 27:459 – 463,2000.
78. Scopinaro N, Giametta E, Friedman D, TraversoE, Adami GF, Vitale B, Marinara G, Canoe S, Ballard F, Columbine M, Botch V: Biliopancreatic diversion for Obesity. Probl.Gen.Surg.9 : 298,1991.
79. Segal KR, Van Loan M, Fitzgerald PI, Hogdon JA,Van Itallie TB. Lean body mass estimation by bioelectrical impedance analysis: a four site cross validation study. Am J Clin Nutr 47: 7-14;1988.
80. Spitzer RL, Delvin M, Walsh BT et al: Binge eating disorder: a multisite field trial of the diagnostic criteria. Int. J Eat Disord 11:191-203,1992
81. Spitzer RL, Yanovsky S, Wadden T et al: Binge eating disorder: Its further validation in a multisite study. Int J Eat Disord 13:137-153,1993
82. Sorbal J, Stunkard A, Socio-economic status and obesity: a review of the literature. Psychol Bull, 105:260-75,1996.
83. SOFRES: Enquêtes sur l’obésité 1996-98. 84. Stunkard AJ, Wadden JA. Psychological aspects of human obesity. In: Bjorntord
P, Roof BN eds. Obesity. JL Lipincott 352-60, 1993. 85. Telch CF, Agras WS, Rossiter EM: Binge eating increases with increasing
adiposity. Int J Eat Disord 7: 115-119, 1988. 86. Tremblay a, Despres JP, Thierault G, Fournier G, Bouchard C. Overfeeding and
energy expenditure in humans. Am J Clin Nutr, 53:857-62,1992. 87. Valley V, Grace DM: Psychological risk factors in gastric surgery for obesity:
Identifying guidelines for screening. Int J Obes 11:105-113,1987 88. Van Gemert WG, Adang EM, Greve JW, Soeters PB. Quality of life, assessment
of morbidly obese patients: effect of weight reducing surgery. Am J Nutr, 67:197-201, 1998.
89. Wadden TA, Foster GD. Behavioural treatment of obesity. Medical clinics of North America, vol.84, no.2: 441- 461, march 2000.
90. WHO (World Health Organisation). Energy and protein requirements. Report of a joint FAO/WHO/ONU expert consultation. Geneva: World Health Organisation,1-206, 1985.
91. WHO (World Health Organisation). Obesity: preventing and managing the global epidemic. Report of a WHO consultation on obesity. Geneva, 3-5 June 1997 (WHO/NUT/NCD/98.1) 1998.
92. Wilmore JH. Variation in physical activity habits and body composition. Int J Obes 19 (suppl. 4) S107-12, 1995.
48
93. Wilson GT. Behavioural Approaches of the treatment of Obesity. In: Brownell KD, Fairburn CG (eds). Eating Disorders and Obesity. A comprehensive Handbook. New York: The Guildford Press :479-83, 1995.
94. Wilson GT. Relation of dieting and voluntary weight loss to psychological Functioning and Binge Eating. Ann Intern Med: 119:727-30, 1993.
95. Wing RR, Jeffery RW. Effect of modest weight loss on changes in cardiovascular risk factors: are there differences between men and women or between weight loss and maintenance? Int J Obesity; 19:67-73, 1995.
96. Zigmond AS, Snaith RP. A hospital anxiety and depression scale. Acta psychiatr Scand: 67, 361-370; 1983.
97. Thomas V Perneger What's wrong with Bonferroni adjustments BMJ 1998;316:1236-1238