lng primerupd
TRANSCRIPT

8/3/2019 LNG Primerupd
http://slidepdf.com/reader/full/lng-primerupd 1/16

8/3/2019 LNG Primerupd
http://slidepdf.com/reader/full/lng-primerupd 2/16
About This Report
Growing Demandfor Natural Gas
Natural gas plays a vital role inthe U.S. energy supply and inachieving the nation’s economicand environmental goals.
Although natural gas productionin North America is projectedto gradually increase through2025, consumption has begunto outpace available domesticnatural gas supply. Over time,this gap will widen.
Emergence of theGlobal LNG Market
One of several proposedsupply options would involveincreasing imports of liquefiednatural gas (LNG) to ensurethat American consumers haveadequate supplies of naturalgas in the future.
Liquefaction enables naturalgas that would otherwise be“stranded” to reach majormarkets. Developing countrieswith plentiful natural gasresources are particularlyinterested in monetizingnatural gas by exporting it asLNG. Conversely, moredeveloped nations with littleor no domestic natural gas
rely on imports.
“I strongly support developingnew LNG capacity in theUnited States.”
—President George W. Bush
U n d e r s t a n d i n g t
Liquefied Natural Gas
This report was prepared by the U.S.Department of Energy (DOE) incollaboration with the National Association of Regulatory UtilityCommissioners (NARUC). DOE’s Office of Fossil Energy supports technologyresearch and policy options to ensureclean, reliable, and affordable suppliesof oil and natural gas for Americanconsumers, working closely with theNational Energy Technology Laboratory,which is the Department’s lead center for the research and development of advanced fossil energy technologies.NARUC, a nonprofit organizationcomposed of governmental agenciesengaged in the regulation of telecommunications, energy, and water utilities and carriers in the 50 states, theDistrict of Columbia, Puerto Rico, andthe Virgin Islands, serves the public
interest by improving the quality andeffectiveness of utility regulation.
2 4
Design and editorial support: Akoya
Select photos courtesy of: Anadarko PetroleumCompany; Atlantic LNG Company of Trinidad andTobago; British Petroleum; Chevron Texaco;ConocoPhillips; Dominion Cove Point LNG, LP;Excelerate Energy; HOEGH LNG; Pine Needle LNG, LLCNC; Texaco Production Operations; Tractebel LNGNorth America; Trunkline LNG
Page

8/3/2019 LNG Primerupd
http://slidepdf.com/reader/full/lng-primerupd 3/16
Current Status of U.S.LNG Imports
The United States currentlyhas six LNG terminals—fouron the mainland, one in theoffshore Gulf of Mexico, andone in Puerto Rico—thatreceive, store, and regasify LNG.Some economists call for the
development of more importcapacity to enable the UnitedStates to participate fully inworld LNG markets.
Expanded LNG imports wouldlikely help to dampen naturalgas price volatility in the UnitedStates, particularly during peak periods of demand. Suchexpanded imports would alsosupport U.S. economic growth.
Components of theLNG Value Chain
If the United States is toincrease LNG imports,significant capital investmentwill be necessary by energyfirms across the entire LNG“value chain,” which spansnatural gas production,
liquefaction capacity, transportshipping, storage, andregasification.
Over the past two decades,technology improvementshave been key to a substantialincrease in liquefactionefficiency and decrease inLNG costs.
Informed Decision Making
For more than 40 years, thesafety record of the global LNGindustry has been excellent,due to attention to detail inengineering, construction,and operations. More than30 companies have recentlyproposed new LNG terminals
in North America, along theU.S. coastline or offshore. Eachproposal is rigorously evaluatedbefore an LNG terminal can beconstructed or expanded.
Americans face the challengeof making sound and timelydecisions about LNGinfrastructure to assure anabundant supply of natural gasfor homes, businesses, industry,
and power generators, in thenear and long term.
B a s i c F a c t s
8/3/2019 LNG Primerupd
http://slidepdf.com/reader/full/lng-primerupd 4/16
Growing Dema nd f or
Natural Gas
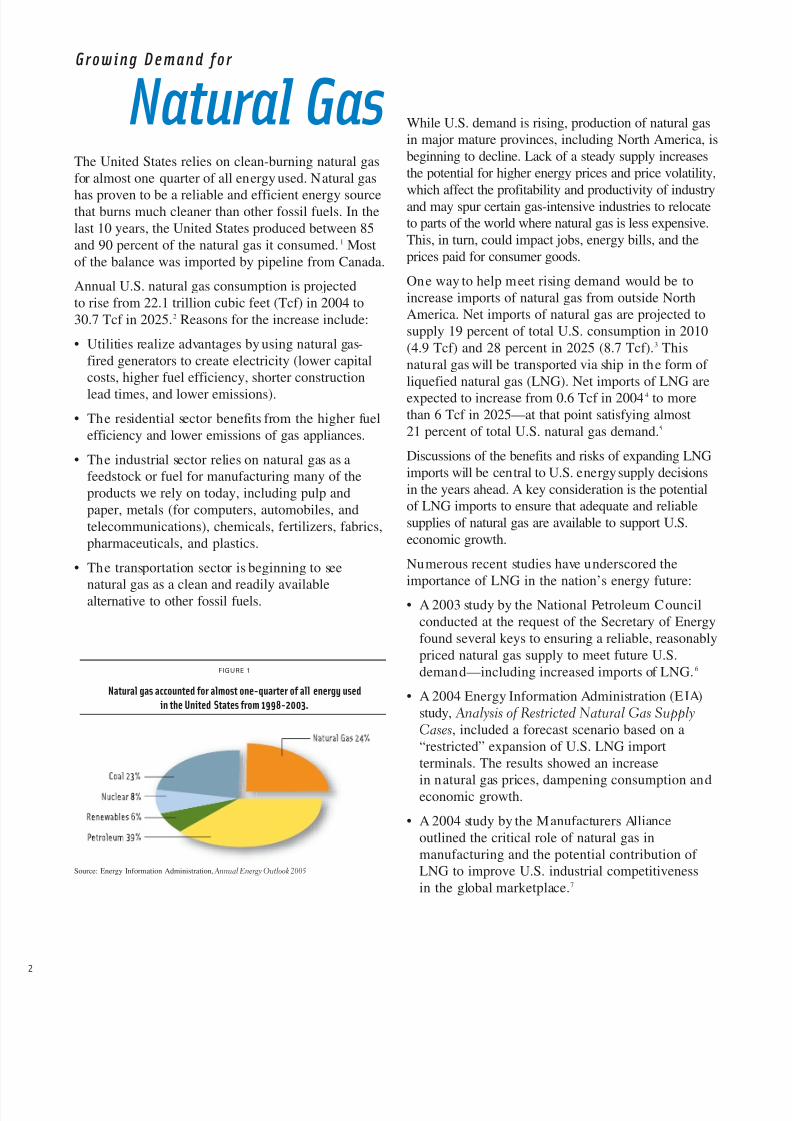
FIGURE 1
Natural gas accounted for almost one-quarter of all energy used
in the United States from 1998-2003.
The United States relies on clean-burning natural gasfor almost one quarter of all energy used. Natural gas
has proven to be a reliable and efficient energy sourcethat burns much cleaner than other fossil fuels. In thelast 10 years, the United States produced between 85and 90 percent of the natural gas it consumed.1 Mostof the balance was imported by pipeline from Canada.
Annual U.S. natural gas consumption is projectedto rise from 22.1 trillion cubic feet (Tcf) in 2004 to30.7 Tcf in 2025.2 Reasons for the increase include:
• Utilities realize advantages by using natural gas-fired generators to create electricity (lower capitalcosts, higher fuel efficiency, shorter construction
lead times, and lower emissions).
• The residential sector benefits from the higher fuelefficiency and lower emissions of gas appliances.
• The industrial sector relies on natural gas as afeedstock or fuel for manufacturing many of theproducts we rely on today, including pulp andpaper, metals (for computers, automobiles, andtelecommunications), chemicals, fertilizers, fabrics,pharmaceuticals, and plastics.
• The transportation sector is beginning to see
natural gas as a clean and readily availablealternative to other fossil fuels.
While U.S. demand is rising, production of natural gasin major mature provinces, including North America, isbeginning to decline. Lack of a steady supply increasesthe potential for higher energy prices and price volatility,
which affect the profitability and productivity of industryand may spur certain gas-intensive industries to relocateto parts of the world where natural gas is less expensive.This, in turn, could impact jobs, energy bills, and theprices paid for consumer goods.
One way to help meet rising demand would be toincrease imports of natural gas from outside NorthAmerica. Net imports of natural gas are projected tosupply 19 percent of total U.S. consumption in 2010(4.9 Tcf) and 28 percent in 2025 (8.7 Tcf).3 Thisnatural gas will be transported via ship in the form of liquefied natural gas (LNG). Net imports of LNG are
expected to increase from 0.6 Tcf in 20044 to morethan 6 Tcf in 2025—at that point satisfying almost21 percent of total U.S. natural gas demand.5
Discussions of the benefits and risks of expanding LNGimports will be central to U.S. energy supply decisionsin the years ahead. A key consideration is the potentialof LNG imports to ensure that adequate and reliablesupplies of natural gas are available to support U.S.economic growth.
Numerous recent studies have underscored theimportance of LNG in the nation’s energy future:
• A 2003 study by the National Petroleum Councilconducted at the request of the Secretary of Energyfound several keys to ensuring a reliable, reasonablypriced natural gas supply to meet future U.S.demand—including increased imports of LNG.6
• A 2004 Energy Information Administration (EIA)study, Analysis of Restricted Natural Gas SupplyCases, included a forecast scenario based on a“restricted” expansion of U.S. LNG importterminals. The results showed an increase
in natural gas prices, dampening consumption andeconomic growth.
• A 2004 study by the Manufacturers Allianceoutlined the critical role of natural gas inmanufacturing and the potential contribution of LNG to improve U.S. industrial competitivenessin the global marketplace.7
Source: Energy Information Administration, Annual Energy Outlook 2005

8/3/2019 LNG Primerupd
http://slidepdf.com/reader/full/lng-primerupd 5/16
LN G . . . A S AF E F UEL IN A S MALL PAC KAG E
Natural gas consists almost entirely of methane (CH4), the simplest hydrocarbon
compound. Typically, LNG is 85 to 95-plus percent methane, along with a few
percent ethane, even less propane and butane, and trace amounts of nitrogen
(Figure 2). The exact composition of natural gas (and the LNG formed from it)
varies according to its source and processing history. And, like methane, LNG is
odorless, colorless, noncorrosive, and nontoxic.
Natural gas is condensed to a liquid by cooling it to about -260°F (-162°C). This
process reduces its volume by a factor of more than 600—similar to reducing the
natural gas filling a beach ball into liquid filling a ping-pong ball (Figure 3). As
a result, just one shipload of LNG can provide nearly 5 percent (roughly 3 billioncubic feet) of the U.S. average daily demand for natural gas, or enough energy to
heat more than 43,000 homes for an entire year! 11
LNG is transported by ship to terminals in the United States, then stored at
atmospheric pressure in super-insulated tanks. From storage, LNG is converted
back into gas and fed into the natural gas pipeline system. LNG is also
transported by truck to satellite storage sites for use during peak periods of
natural gas demand—in the coldest weather for heating and in hot weather for
fueling electric power generators, which in turn run air conditioners.
FIGURE 3
When natural gas is liquefied, it shrinks more than 600 times
in volume.
FIGURE 2
LNG is mostly methane plus a few percent ethane, even less
propane and butane, and trace amounts of nitrogen.
When liquefied, natural gasthat would fill a beach ball...
...becomes LNG that can fit inside a ping-pong ball.
1 Energy Information Administration (EIA), Annual Energy Review 2003, September 2004.
2 EIA,
8/3/2019 LNG Primerupd
http://slidepdf.com/reader/full/lng-primerupd 6/16
E mergence of the
Global LNG Market Efforts to liquefy natural gas for storage began in theearly 1900s, but it wasn’t until 1959 that the world’s
first LNG ship carried cargoes from Louisiana to theUnited Kingdom, proving the feasibility of trans-oceanic LNG transport. Five years later, the UnitedKingdom began importing Algerian LNG, makingthe Algerian state-owned oil and gas company,Sonatrach, the world’s first major LNG exporter. TheUnited Kingdom continued to import LNG until1990, when British North Sea gas became a lessexpensive alternative.
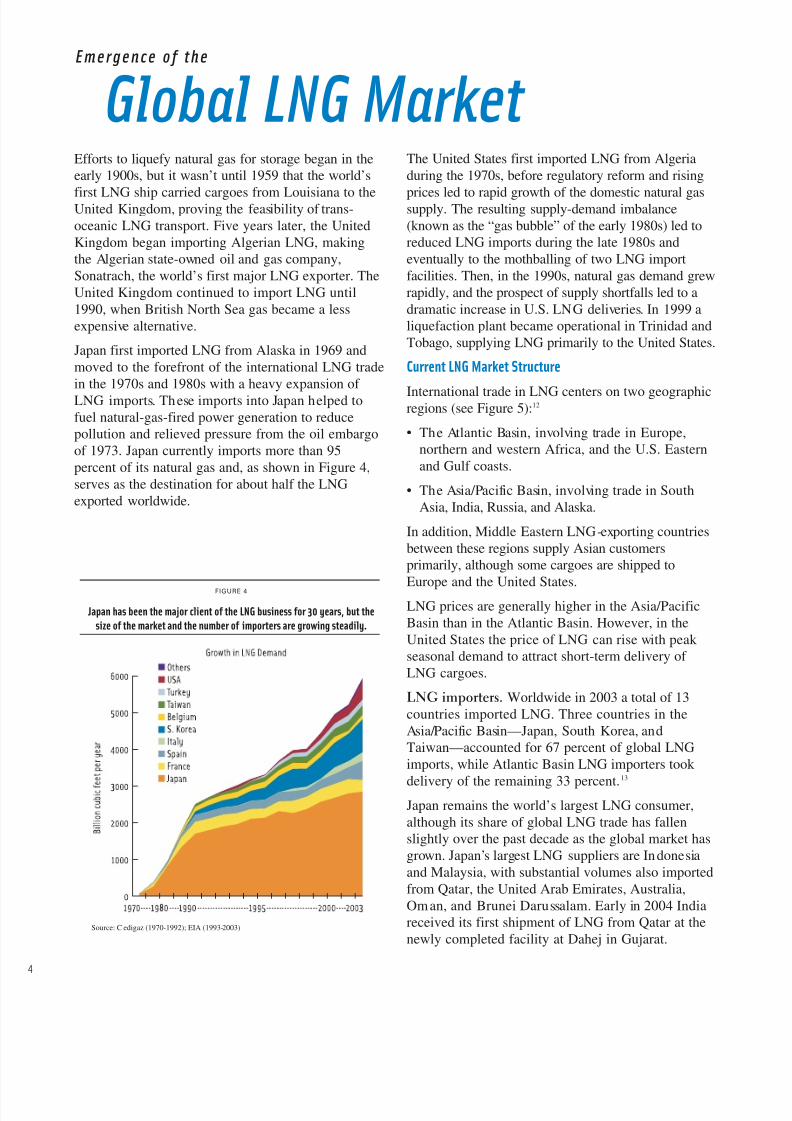
Japan first imported LNG from Alaska in 1969 andmoved to the forefront of the international LNG tradein the 1970s and 1980s with a heavy expansion of LNG imports. These imports into Japan helped tofuel natural-gas-fired power generation to reducepollution and relieved pressure from the oil embargoof 1973. Japan currently imports more than 95percent of its natural gas and, as shown in Figure 4,serves as the destination for about half the LNGexported worldwide.
The United States first imported LNG from Algeriaduring the 1970s, before regulatory reform and rising
prices led to rapid growth of the domestic natural gassupply. The resulting supply-demand imbalance(known as the “gas bubble” of the early 1980s) led toreduced LNG imports during the late 1980s andeventually to the mothballing of two LNG importfacilities. Then, in the 1990s, natural gas demand grewrapidly, and the prospect of supply shortfalls led to adramatic increase in U.S. LNG deliveries. In 1999 aliquefaction plant became operational in Trinidad andTobago, supplying LNG primarily to the United States.
Current LNG Market Structure
International trade in LNG centers on two geographicregions (see Figure 5):12
• The Atlantic Basin, involving trade in Europe,northern and western Africa, and the U.S. Easternand Gulf coasts.
• The Asia/Pacific Basin, involving trade in SouthAsia, India, Russia, and Alaska.
In addition, Middle Eastern LNG-exporting countriesbetween these regions supply Asian customersprimarily, although some cargoes are shipped toEurope and the United States.
LNG prices are generally higher in the Asia/PacificBasin than in the Atlantic Basin. However, in theUnited States the price of LNG can rise with peak seasonal demand to attract short-term delivery of LNG cargoes.
LNG importers. Worldwide in 2003 a total of 13countries imported LNG. Three countries in theAsia/Pacific Basin—Japan, South Korea, andTaiwan—accounted for 67 percent of global LNGimports, while Atlantic Basin LNG importers took
delivery of the remaining 33 percent.13
Japan remains the world’s largest LNG consumer,although its share of global LNG trade has fallenslightly over the past decade as the global market hasgrown. Japan’s largest LNG suppliers are Indonesiaand Malaysia, with substantial volumes also importedfrom Qatar, the United Arab Emirates, Australia,Oman, and Brunei Darussalam. Early in 2004 Indiareceived its first shipment of LNG from Qatar at thenewly completed facility at Dahej in Gujarat.
FIGURE 4
Japan has been the major client of the LNG business for 30 years, but the
size of the market and the number of importers are growing steadily.
Source: C edigaz (1970-1992); EIA (1993-2003)

8/3/2019 LNG Primerupd
http://slidepdf.com/reader/full/lng-primerupd 7/16

8/3/2019 LNG Primerupd
http://slidepdf.com/reader/full/lng-primerupd 8/16
Cu rrent Sta tu s of U.S.
LNG ImportsIn 2003 the United States imported 506.5 Bcf of LNGfrom a variety of exporting countries. Imports in 2004
increased by 29 percent, reaching 652 Bcf.LNG arriving in the continental United States entersthrough one of five LNG receiving and regasificationterminals located along the Atlantic and Gulf coasts.While these facilities have a combined peak capacity of more than 1.3 Tcf per year, imports in 2004 totaled onlya little more than 0.65 Tcf.* However, future demandfor LNG will outgrow current and future capacity at thefive terminals. By 2008 these terminals should reach apeak capacity of 2.1 Tcf and then level off. On the otherhand, EIA projects LNG demand of 6.4 Tcf to meetU.S. natural gas needs by 2025. Clearly, the nation willneed to rely on additional import terminals or face aserious natural gas shortfall in coming decades. LNGreceiving terminals are located in:
Everett, Massachusetts. Owned and operated byTractebel LNG North America, the facility beganoperations in 1971 and now meets 15 to 20 percent of New England’s annual gas demand. A recent expansionraised baseload capacity to 265 Bcf per year.**
Cove Point, Maryland. Operated by Dominion CovePoint LNG , the Cove Point terminal began operation
in 1978, was mothballed for two decades, andreopened in July 2003. A proposed expansion projectwill increase baseload capacity from the current365 Bcf per year to about 657 Bcf by 2008.
Elba Island, Georgia. Owned by El Paso Corpora-tion and the smallest of the continental U.S.terminals, the Elba Island facility began operationin 1978. Like Cove Point, Elba was mothballedduring the 1980s and reactivated in 2001. Its currentbaseload capacity of 161 Bcf per year will beexpanded to 292 Bcf per year by 2008.
Lake Charles, Louisiana. Operated by PanhandleEnergy/Trunkline LNG, the Lake Charles terminalwas completed in July 1981. A two-phase expansionwill raise capacity from the current baseload 230 Bcf per year to about 657 Bcf in 2007.15
Gulf Gateway, Gulf of Mexico Offshore. Owned byExcelerate Energy, the sub-sea Gulf Gateway EnergyBridge is 116 miles off the Louisiana coast and began
operations in March 2005 as the world’s first offshorereceiving port. The facility has a baseload capacity of 183 Bcf per year and uses converted LNG carriers toregasify LNG through deck-mounted vaporizers.
A sixth terminal, the EcoEléctrica regasificationfacility (capacity of 33.9 Bcf per year) in the U.S.Commonwealth of Puerto Rico, began importingLNG in 2000 to serve a 540-megawatt natural gas-firedpower plant that accounts for about 20 percent of theelectricity generated on the island.
FIGURE 6
Most U.S. LNG imports come from Trinidad and Tobago. The balance originates
from a mix of Middle Eastern, African, and Asian suppliers.
FIGURE 7
Even with planned expansions, the capacity of existing U.S. LNG terminals will
meet less than half of the forecasted 6,400 Bcf LNG demand in 2025.
15 Capacities from EIA (LNG Markets and Uses: June 2004 Update), FE RC, facility websites,
and other sources.
* Sustainable sendout (“baseload”) regasification capacity will increase from more than 1.0 Tcf in
2004 to 1.8 Tcf in 2008.
** Does not include about 36 Bcf per year trucked to various New England destinations.
Source: DOE FE-LNG Imports by Country of Origin, 2004
*Gulf Gateway began was commissioned for operation in April of 2005. 2005 data is pro-rated for 9 month
Source: Energy Information Administration, FERC, and other sources

8/3/2019 LNG Primerupd
http://slidepdf.com/reader/full/lng-primerupd 9/16
8/3/2019 LNG Primerupd
http://slidepdf.com/reader/full/lng-primerupd 10/16
Components of the LNG
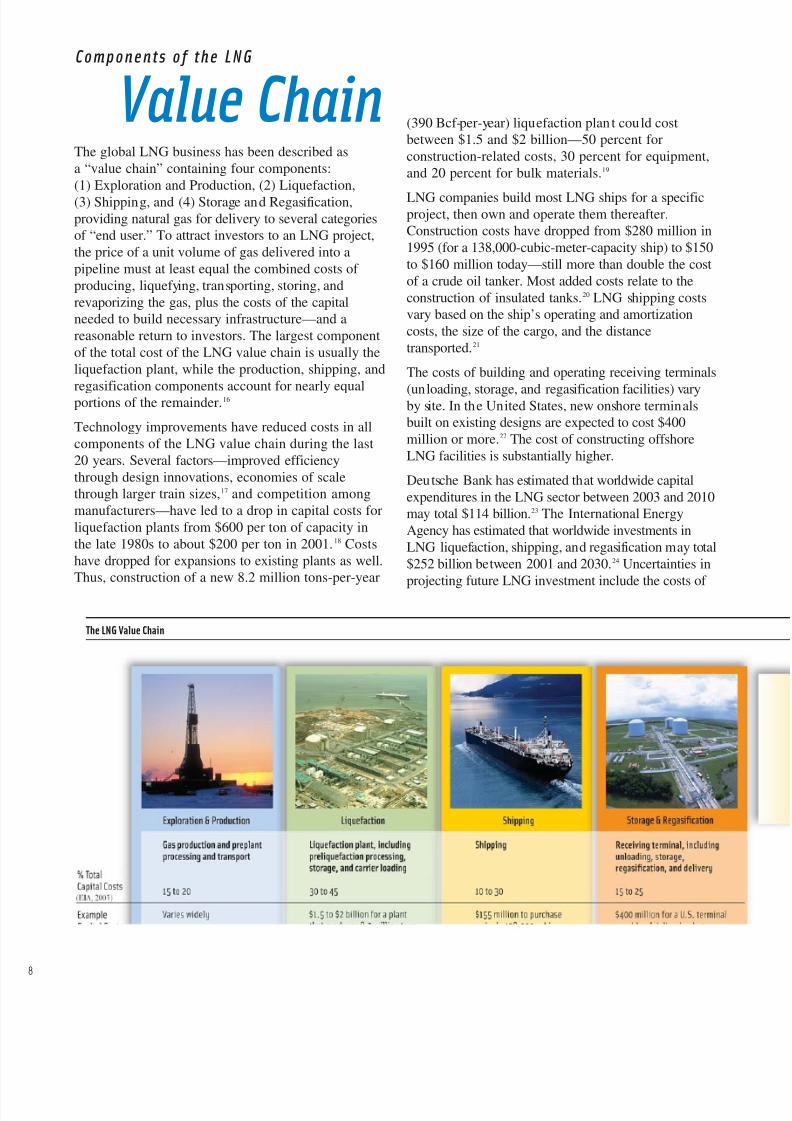
Value ChainThe global LNG business has been described asa “value chain” containing four components:(1) Exploration and Production, (2) Liquefaction,
(3) Shipping, and (4) Storage and Regasification,providing natural gas for delivery to several categoriesof “end user.” To attract investors to an LNG project,the price of a unit volume of gas delivered into apipeline must at least equal the combined costs of producing, liquefying, transporting, storing, andrevaporizing the gas, plus the costs of the capitalneeded to build necessary infrastructure—and areasonable return to investors. The largest componentof the total cost of the LNG value chain is usually theliquefaction plant, while the production, shipping, and
regasification components account for nearly equalportions of the remainder.16
Technology improvements have reduced costs in allcomponents of the LNG value chain during the last20 years. Several factors—improved efficiencythrough design innovations, economies of scalethrough larger train sizes,17 and competition amongmanufacturers—have led to a drop in capital costs forliquefaction plants from $600 per ton of capacity inthe late 1980s to about $200 per ton in 2001.18 Costshave dropped for expansions to existing plants as well.Thus, construction of a new 8.2 million tons-per-year
(390 Bcf-per-year) liquefaction plan t could costbetween $1.5 and $2 billion—50 percent forconstruction-related costs, 30 percent for equipment,and 20 percent for bulk materials.19
LNG companies build most LNG ships for a specificproject, then own and operate them thereafter.Construction costs have dropped from $280 million in1995 (for a 138,000-cubic-meter-capacity ship) to $150to $160 million today—still more than double the costof a crude oil tanker. Most added costs relate to theconstruction of insulated tanks.20 LNG shipping costsvary based on the ship’s operating and amortizationcosts, the size of the cargo, and the distancetransported.21
The costs of building and operating receiving terminals
(unloading, storage, and regasification facilities) varyby site. In the United States, new onshore terminalsbuilt on existing designs are expected to cost $400million or more.22 The cost of constructing offshoreLNG facilities is substantially higher.
Deutsche Bank has estimated that worldwide capitalexpenditures in the LNG sector between 2003 and 2010may total $114 billion.23 The International EnergyAgency has estimated that worldwide investments inLNG liquefaction, shipping, and regasification may total$252 billion between 2001 and 2030.24 Uncertainties inprojecting future LNG investment include the costs of
The LNG Value Chain

8/3/2019 LNG Primerupd
http://slidepdf.com/reader/full/lng-primerupd 11/16
LNG infrastructure, natural gas prices, competition fromother fuels, technology, environmental requirements,and geopolitical trends.
The magnitude of the total investment required to
build and operate a complete LNG value chain(approximately $7–10 billion) requires the sort of economic power historically held by only countries orvery large corporations. One way to minimize thesubstantial risks has been to obtain long-term supplycontracts (20–25 years in duration), with a “take orpay” clause that obligates buyers to pay for gas at acertain price, even if markets do not exist.
Complementing long-term contracts, a spot marketand short-term contracts25 have emerged in the last fiveyears. Factors influencing the emergence of the spot
market include some global overcapacity inliquefaction, an increase in the number of LNGtankers, and increased contractual flexibility across thevarious components of the LNG value chain. Thesefactors make it easier for exporters to sell their LNGand for importers to buy LNG, when and where itmakes the most economic sense.
In the United States, LNG imports delivered under spot-market contracts represented more than 80 percent of allLNG imports in 2003, and nearly 70 percent in 2004.
By contrast, in 1998 only about 25 percent of all LNGimports to the United States were delivered under spot-market contracts. The larger supply of spot-market LNGimports reflects the growing importance of the spot
market to supply marginal demands in the UnitedStates, with volumes rising and falling in response tonatural gas prices.26 The spot market now accounts foralmost 12 percent of the total worldwide LNG market, anumber that could rise to 15 to 20 percent during thenext 10 years,27 creating increased opportunity for growthin both the size and efficiency of the LNG business.
16 When th e full cost of exploration and production are attributed solely to an LNG opportunity,
the cost for this component can see substantial increases.
17 Within th e context of LNG, a “train” consists of the series of linked equipmen t elements used
in the liquefaction process.
18 Sen, C. Taylor, Trends and Developments in the LNG Industry, an Appendix of Potential
Supply of Natural Gas 2002, published by the Potential Gas Committee, pp. 89-98.
19 GTI, as referenced in the The Global Liquefied Natural Gas Market: Status and Outlook by the
Energy Information Administration DOE/EIA-0637 (2003), p. 43.
20 GTI, DO E/EIA-0637, (2003) p. 44.
21 LNG Shipping Solutions, as referenced in The Global Liquefied Natural Gas Market: Status
and Outlook by the Energy Information Administration DOE/EIA-0637 (2003), p. 44.
22 National Gas Intelligence, Intelligence Press, Inc., October 28, 2004.
23 Deutsche Bank, Global LNG: Exploding the Myths, 2004.
24 International Energy Agency, World Energy Investment Outlook 2003.
25 Definition s vary for the duration of short-term contracts, e.g. 2 years or less (DO E, FE )
and 4 years or less (International Group of Liquefied Natural Gas Importers).
26 DOE Office of Fossil Energy.
27 GTI, DOE/EIA-0637.
Frequently Used Conversions
To: Billion Cubic Meters Billion Cubic Feet Million Tons of LNG Trillion Btu
of Natural Gas of Natural Gas
From: MULTIPLY BY
1 Billion Cubic Meters of Natural Gas 1 35.315 0.760 38.847
1 Billion Cubic Feet of Natural Gas 0.028 1 0.022 1.100
1 Million Tons of LNG 1.136 46.467 1 51.114
1 Trillion Btu 0.026 0.909 0.020 1
1 million metric tons/year = 1.316 billion cubic meters/year (gas) = 127.3 million cubic feet/day (gas)
1 billion cubic meters/year (gas) = 0.760 million metric tons/year (LNG or gas) = 96.8 mcf/day (gas)
1 million cubic feet/day (gas) = 10.34 million cubic meters/year (gas) = 7,855 metric tons/year (LNG or gas)
Typical Liquid—Vapor Conversions *
To: Liquid Measures Vapor Measures Heat Measure
From: Metric Ton Cubic Meter Cubic Foot Cubic Meter Cubic Foot Btu*
LNG LNG LNG Natural Gas Natural Gas
MULTIPLY BY1 Metric Ton LNG 1 2.193 77.445 1,316 46,467 51,113,806
1 Cubic Meter LNG 0.456 1 35.315 600.00 21,189 23,307,900
1 Cubic Foot LNG 0.0129 0.0283 1 16.990 600.00 660,000
1 Cubic MeterNatural Gas 0.000760 0.001667 0.058858 1 35.315 38,847
1 Cubic FootNatural Gas 0.000022 0.000047 0.001667 0.02832 1 1,100
Conversion Factors
Source: DOE Office of Fossil Energy
* Based on a volume conversion of 600:1, LNG density of 456 kg per cubic meter of LNG, and 1,100 gross dry Btu per cubic feet of gas.
8/3/2019 LNG Primerupd
http://slidepdf.com/reader/full/lng-primerupd 12/16
0
The Basics of Natural Gas Production
Exploring for natural gas deposits is a high-risk, high-cost endeavor—millions or tens of millions of dollarsmay be spent by a firm with the result being a “dry
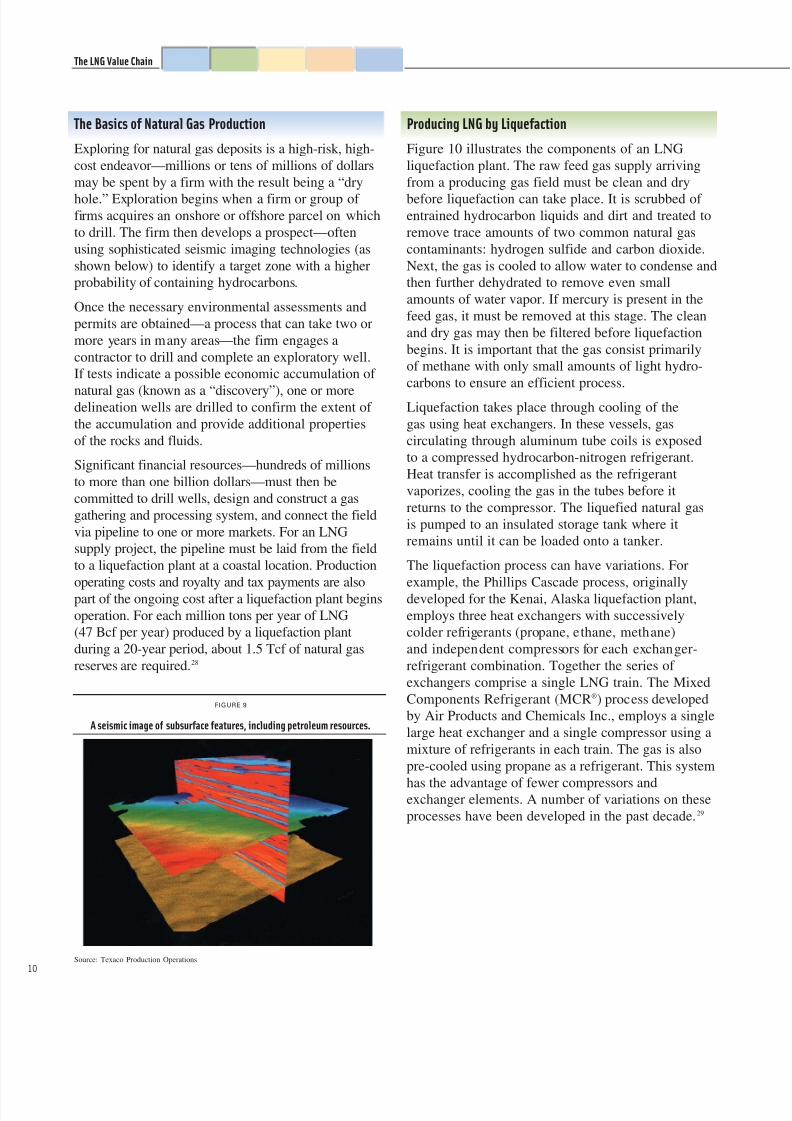
hole.” Exploration begins when a firm or group of firms acquires an onshore or offshore parcel on whichto drill. The firm then develops a prospect—oftenusing sophisticated seismic imaging technologies (asshown below) to identify a target zone with a higherprobability of containing hydrocarbons.
Once the necessary environmental assessments andpermits are obtained—a process that can take two ormore years in many areas—the firm engages acontractor to drill and complete an exploratory well.If tests indicate a possible economic accumulation of
natural gas (known as a “discovery”), one or moredelineation wells are drilled to confirm the extent of the accumulation and provide additional propertiesof the rocks and fluids.
Significant financial resources—hundreds of millionsto more than one billion dollars—must then becommitted to drill wells, design and construct a gasgathering and processing system, and connect the fieldvia pipeline to one or more markets. For an LNGsupply project, the pipeline must be laid from the fieldto a liquefaction plant at a coastal location. Production
operating costs and royalty and tax payments are alsopart of the ongoing cost after a liquefaction plant beginsoperation. For each million tons per year of LNG(47 Bcf per year) produced by a liquefaction plantduring a 20-year period, about 1.5 Tcf of natural gasreserves are required.28
Producing LNG by Liquefaction
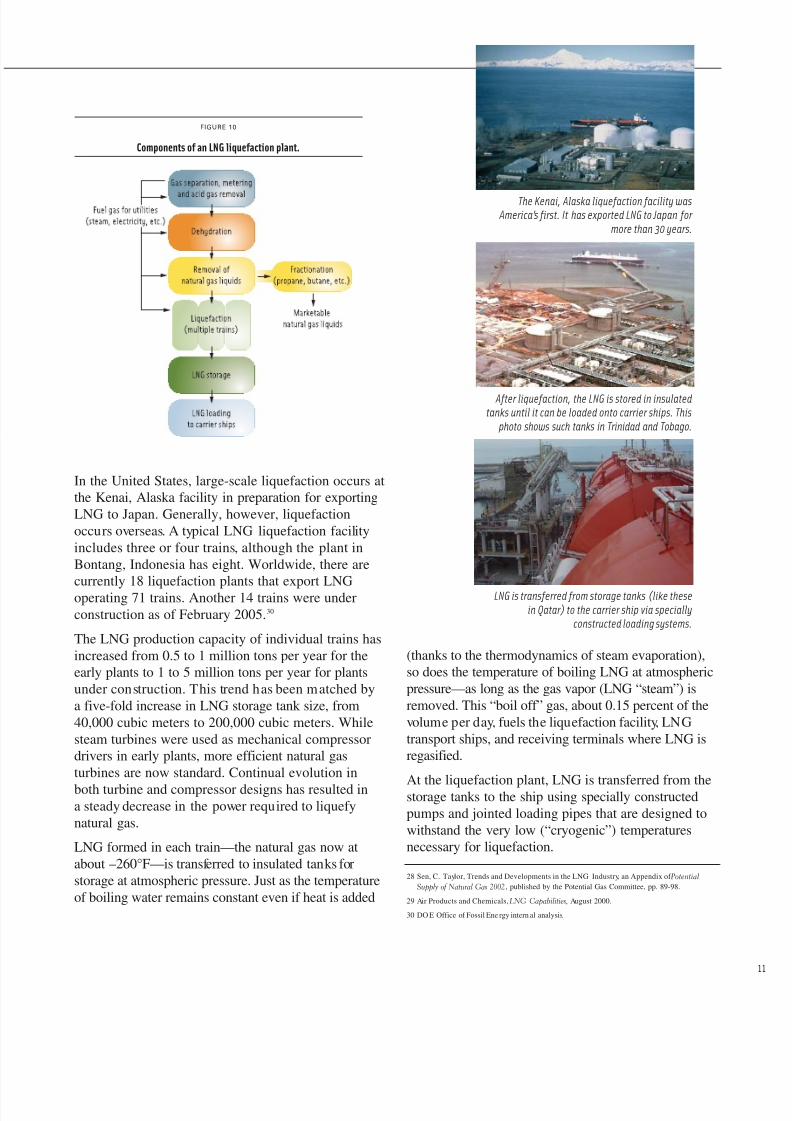
Figure 10 illustrates the components of an LNGliquefaction plant. The raw feed gas supply arrivingfrom a producing gas field must be clean and dry
before liquefaction can take place. It is scrubbed of entrained hydrocarbon liquids and dirt and treated toremove trace amounts of two common natural gascontaminants: hydrogen sulfide and carbon dioxide.Next, the gas is cooled to allow water to condense andthen further dehydrated to remove even smallamounts of water vapor. If mercury is present in thefeed gas, it must be removed at this stage. The cleanand dry gas may then be filtered before liquefactionbegins. It is important that the gas consist primarilyof methane with only small amounts of light hydro-carbons to ensure an efficient process.
Liquefaction takes place through cooling of thegas using heat exchangers. In these vessels, gascirculating through aluminum tube coils is exposedto a compressed hydrocarbon-nitrogen refrigerant.Heat transfer is accomplished as the refrigerantvaporizes, cooling the gas in the tubes before itreturns to the compressor. The liquefied natural gasis pumped to an insulated storage tank where itremains until it can be loaded onto a tanker.
The liquefaction process can have variations. For
example, the Phillips Cascade process, originallydeveloped for the Kenai, Alaska liquefaction plant,employs three heat exchangers with successivelycolder refrigerants (propane, ethane, methane)and independent compressors for each exchanger-refrigerant combination. Together the series of exchangers comprise a single LNG train. The MixedComponents Refrigerant (MCR®) process developedby Air Products and Chemicals Inc., employs a singlelarge heat exchanger and a single compressor using amixture of refrigerants in each train. The gas is alsopre-cooled using propane as a refrigerant. This system
has the advantage of fewer compressors andexchanger elements. A number of variations on theseprocesses have been developed in the past decade.29
FIGURE 9
A seismic image of subsurface features, including petroleum resources.
The LNG Value Chain
Source: Texaco Production Operations
8/3/2019 LNG Primerupd
http://slidepdf.com/reader/full/lng-primerupd 13/16
28 Sen, C. Taylor, Trends and Developments in the LNG Industry, an Appendix of Potential
Supply of Natural Gas 2002, published by the Potential Gas Committee, pp. 89-98.
29 Air Products and Chemicals, LNG Capabilities, August 2000.
30 DO E Office of Fossil Ene rgy intern al analysis.
In the United States, large-scale liquefaction occurs atthe Kenai, Alaska facility in preparation for exportingLNG to Japan. Generally, however, liquefactionoccurs overseas. A typical LNG liquefaction facilityincludes three or four trains, although the plant inBontang, Indonesia has eight. Worldwide, there arecurrently 18 liquefaction plants that export LNGoperating 71 trains. Another 14 trains were underconstruction as of February 2005.30
The LNG production capacity of individual trains hasincreased from 0.5 to 1 million tons per year for theearly plants to 1 to 5 million tons per year for plantsunder construction. This trend has been matched bya five-fold increase in LNG storage tank size, from40,000 cubic meters to 200,000 cubic meters. Whilesteam turbines were used as mechanical compressordrivers in early plants, more efficient natural gasturbines are now standard. Continual evolution in
both turbine and compressor designs has resulted ina steady decrease in the power required to liquefynatural gas.
LNG formed in each train—the natural gas now atabout –260°F—is transferred to insulated tanks forstorage at atmospheric pressure. Just as the temperatureof boiling water remains constant even if heat is added
FIGURE 10
Components of an LNG liquefaction plant.
After liquefaction, the LNG is stored in insulatedtanks until it can be loaded onto carrier ships. This
photo shows such tanks in Trinidad and Tobago.
LNG is transferred from storage tanks (like thesein Qatar) to the carrier ship via specially
constructed loading systems.
The Kenai, Alaska liquefaction facility was America’s first. It has exported LNG to Japan for
more than 30 years.
(thanks to the thermodynamics of steam evaporation),so does the temperature of boiling LNG at atmosphericpressure—as long as the gas vapor (LNG “steam”) isremoved. This “boil off” gas, about 0.15 percent of thevolume per day, fuels the liquefaction facility, LNGtransport ships, and receiving terminals where LNG isregasified.
At the liquefaction plant, LNG is transferred from thestorage tanks to the ship using specially constructedpumps and jointed loading pipes that are designed towithstand the very low (“cryogenic”) temperaturesnecessary for liquefaction.
8/3/2019 LNG Primerupd
http://slidepdf.com/reader/full/lng-primerupd 14/16
2
The Global Business of LNG Transport
Transportation accounts for 10 to 30 percent of thecost of the LNG value chain. Carrier ships often areowned by LNG producers, but also sometimes are
built as independent investments separate fromspecific LNG projects.
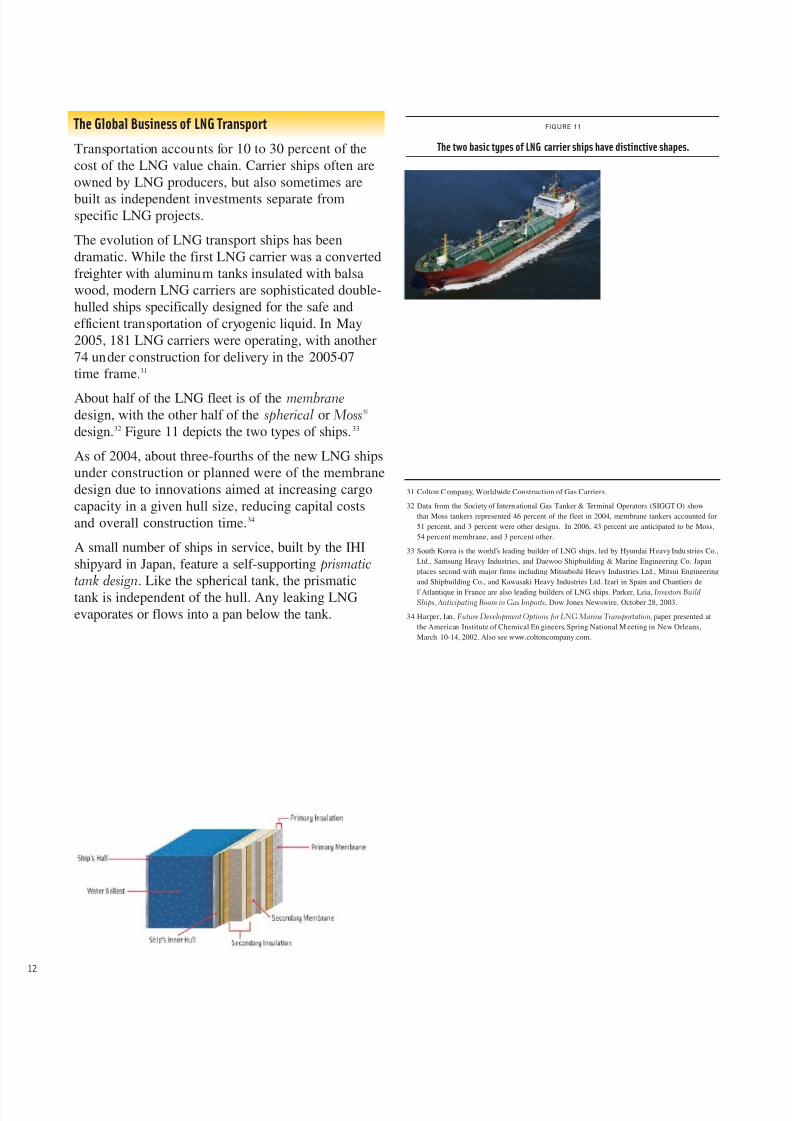
The evolution of LNG transport ships has beendramatic. While the first LNG carrier was a convertedfreighter with aluminum tanks insulated with balsawood, modern LNG carriers are sophisticated double-hulled ships specifically designed for the safe andefficient transportation of cryogenic liquid. In May2005, 181 LNG carriers were operating, with another74 under construction for delivery in the 2005-07time frame.31
About half of the LNG fleet is of the membranedesign, with the other half of the spherical or Moss®
design.32 Figure 11 depicts the two types of ships.33
As of 2004, about three-fourths of the new LNG shipsunder construction or planned were of the membranedesign due to innovations aimed at increasing cargocapacity in a given hull size, reducing capital costsand overall construction time.34
A small number of ships in service, built by the IHIshipyard in Japan, feature a self-supporting prismatictank design. Like the spherical tank, the prismatictank is independent of the hull. Any leaking LNGevaporates or flows into a pan below the tank.
31 Colton C ompany, Worldwide Construction of Gas Carriers.
32 Data from the Society of Intern ational Gas Tanker & Terminal Operators (SIGGT O) show
that Moss tankers represented 46 percent of the fleet in 2004, membrane tankers accounted for
51 percent, and 3 percent were other designs. In 2006, 43 percent are anticipated to be Moss,
54 percent membrane, and 3 percent other.
33 South Korea is the world’s leading builder of LNG ships, led by Hyundai H eavy Indu stries Co.,
Ltd., Samsung Heavy Industries, and Daewoo Shipbuilding & Marine Engineering Co. Japan
places second with major firms including Mitsubishi Heavy Industries Ltd., Mitsui Engineering
and Shipbuilding Co., and Kawasaki Heavy Industries Ltd. Izari in Spain and Chantiers de
l’Atlantique in France are also leading builders of LNG ships. Parker, Leia, Investors BuildShips, Anticipating Boom in Gas Imports, Dow Jones Newswire, October 28, 2003.
34 Harper, Ian, Future Development Options for LNG Marine Transportation, paper presented at
the American Institute of Chemical En gineers, Spring National M eeting in New Orleans,
March 10-14, 2002. Also see www.coltoncompany.com.
FIGURE 11
The two basic types of LNG carrier ships have distinctive shapes.

8/3/2019 LNG Primerupd
http://slidepdf.com/reader/full/lng-primerupd 15/16
The LNG Value Chain
Preparing LNG for Use by Regasification
At a marine terminal or satellite installation, pumpstransfer LNG from storage tanks to warming systems,where the liquid rapidly returns to a vaporized state.
Ambient temperature systems use heat from surroundingair or from seawater (even in cold weather, both arewarmer than LNG) to vaporize the cryogenic liquid,while above-ambient temperature systems add heat byburning fuel to indirectly warm the LNG via anintermediate fluid bath.38
Afterward, the natural gas is ready for delivery into thenation’s network of transmission and distributionpipelines for use by residential consumers, industries,or nearby power generation plants, where it fuelsnatural gas turbines.
The benefits of storing LNG. Stored LNG supplieshelp to meet consumption needs during the coldest daysof winter, particularly for gas utilities with a substantialresidential customer base and therefore a highly seasonaldemand for gas. On these peak-demand days, LNGstorage facilities prove invaluable because of their abilityon short notice to regasify and deliver large amounts of natural gas into regional distribution systems. About 82percent of LNG storage capacity is located in theeastern United States, as reflected in the map on page
35 Protecting America’s Ports, July 1, 2003, and Making Our Waters Safer , October 22, 2003,
U.S. Department of Homeland Security press releases related to the Maritime
Transportation Security Act of 2002.
36 Parfomak, Paul W., Liquefied Natural Gas (LNG) Infrastructure Security: Background
and Issues for Congress, Congressional Research Service, CRS Report to Congress,
September 9, 2003.
37 Commission, Coast Guard, DOT Sign Interagency Aagreement to Coordinate Review of
LNG Terminal Safety, Federal Energy Regulatory Commission Press Release, February
11, 2004.
S AF EG UARD IN G MARIT IME T RAN S PO RT
Due to comprehensive safety and security programs for LNG
tankers and receiving terminals, more than 33,000 shipments
have transported in excess of three billion cubic meters of LNGwithout a serious accident at sea or in port in the past 40 years.
LNG facilities and vessels feature state-of-the-art natural gas,
fire, and smoke detection systems that identify hazardous
situations and automatic shutdown systems that halt operations.
Security measures for the waterfront portions of marine
terminals and LNG ships are regulated by the U.S. Coast Guard,
which prevents other ships from getting near LNG tankers while
in transit or docked at a terminal. The Federal Energy
Regulatory Commission (FERC) also serves as a coordinator with
the Coast Guard and other agencies on issues of marine safety
and security at LNG import facilities.
In October 2003 the Coast Guard issued final rules to meet new
security requirements mandated by the Maritime Transportation
Security Act of 2002. These regulations cover vessels and
facilities operating on or adjacent to waters under U.S.
jurisdiction and require security assessments of ports, vessels,
and facilities. Owners or operators of certain marine assets
must develop preventive security plans as well as response
plans for potential industrial incidents and security breaches.35
Port-level security committees must focus on security shortfalls
and contingency plans that will protect port assets at each
threat level.
The Coast Guard has led the International Maritime Organization
(IMO) in developing maritime security standards outside U.S.
jurisdiction. These new standards, the International Ship and Port
Facility Security Code (ISPS Code), contain detailed mandatory
security requirements for governments, port authorities, and
shipping companies as well as recommended guidelines for
meeting those requirements. The ISPS Code is intended to provide
a standardized, consistent framework to aid governments in
evaluating risk.36
In 2004 FERC entered into an agreement with the Coast Guard
and the Department of Transportation to establish roles and
responsibilities for each agency regarding LNG security and toassure that each agency quickly identifies and addresses
problem areas.37
LNG vapor has a limited flammability range.

8/3/2019 LNG Primerupd
http://slidepdf.com/reader/full/lng-primerupd 16/16
U.S. Department of Energy
Office of Fossil Energy
www.fossil.energy.gov