lonmin interim results 2015 - final clean 10052015
TRANSCRIPT
1
REGULATORY RELEASE 11 May 2015
2015 Interim Results Lonmin Plc, (“Lonmin” or “the Company”), the world’s third largest primary platinum producer, today publishes its Interim Results for the period ended 31 March 2015 and an update on events to today’s date. KEY FEATURES Highlights:
o Safety is our number one priority and we are encouraged to have been fatality free for 18 months o Mining production up 72.0% on the strike impacted prior year period o Saffy shaft production up 57.9% on H1 2013 -‐ pleasing performance in line with ramp up programme o Highest H1 saleable metals-‐in-‐concentrate production since 2007 o PGM unit cost contained to R10,516 per PGM ounce against maintained full year guidance of R10,800 o Underlying EBITDA of $8 million compared to $103 million in the prior year period which excluded strike related
costs of $165 million o Persistently low PGM prices and lower volumes sold due to the smelter outages have resulted in much reduced
revenue, partially offset by a weaker Rand / US Dollar exchange rate. In order to protect the long term value of the business we have started the process of reorganising our business. We are aiming for a 10% saving in labour cost through voluntary separation packages and early retirements. This may result in a headcount reduction of around 3,500 people
Results:
o Lonmin achieved ten million fatality free shifts on 22 April 2015: a first for the South African Platinum mining industry
o Increase in the rolling 12 month LTIFR to 31 March 2015 to 4.51 incidents per million man hours compared to 3.23 at 31 March 2014 – A safety improvement plan has been developed to curb the increase in injuries and potential accidents
o Production momentum sustained with 5.7 million tonnes produced, up 72.0% on the prior year period which was impacted by the strike and broadly in-‐line on H1 2013 despite an increase in Section 54 safety stoppages
o Continued flexibility preserved with the immediately available ore reserve position maintained at 3.9 million centares, or 20.5 months average production
o Hossy turnaround review complete. Production results are encouraging; 8.7% higher than H1 2013 o Saleable metal in concentrate of 381,984 Platinum ounces. Q1 and Q2 have been the best two quarters in
succession since 2007. This was up 77.6% on prior year period and up 4.4% on H1 2013 o Smelter complex now fully operational -‐ build-‐up of concentrate stock ahead of the smelters to be processed in the
second half of the year o Refined production of 262,303 Platinum ounces, only 2.0% up on the prior year period due to the impact of the
furnace shutdowns during H1 2015. Build-‐up of in process stock of around 200,000 PGM ounces o Platinum sales of 265,940 ounces – up 0.9% on the prior year period
Lonmin Plc 4 Grosvenor Place London SW1X 7YL United Kingdom T: +44 (0)20 7201 6000 F: +44 (0)20 7201 6100 www.lonmin.com
2
o Persistently lower Dollar PGM pricing environment. Dollar basket price including base metal revenue was down 6.5% to $988 per PGM ounce whilst the equivalent Rand basket price of R11,263 was 1.9% higher on the back of Rand weakness
o By comparison, unit costs have risen 8.3% per annum since H1 2013. Labour increases of 12.9% and 8.8% in the last two years have been offset by cost saving initiatives (R376 million to date of the R600 million target over three years). Rand unit costs were R10,516 per PGM ounce
o Underlying LBIT $70 million, down from underlying EBIT of $34 million in the prior year period driven by lower volumes sold due to smelter outages and the lower Platinum price
o Capital expenditure was limited to $65 million due to proactive cashflow management and in reaction to persistently lower prices
o Net debt of $282 million, due to disruption caused by the smelter shutdowns, well within available committed debt facilities of $563 million. Had we had not experienced the 200,000 PGM ounces stock lock up, the net revenue from the sales would have resulted in net debt being around $170 million lower.
Market outlook:
o Long term fundamentals remain strong but we are planning on the basis that these low PGM prices will persist for at least two years
o Improving automotive demand of 3.7% growth in Platinum is expected in 2015 and jewellery demand is expected to remain at 38% of total platinum demand as its growth is sustained
Guidance: o As a result of the review of our operating model Lonmin has entered into a consultation process with stakeholders
to reorganise the business. As well as driving ownership, empowerment and accountability, the objective of the resultant reorganisation of the business is to optimise efficiencies, reduce costs and improve profitability and cashflows at current metal prices. We are consulting on a reduction in labour costs of 10% through voluntary separation packages and early retirements, with no short-‐term expected impact on production, which may result in a headcount reduction of 3,500 people. We expect to incur costs of around R400 million in the current year and subsequent ongoing annual value benefits of around R840 million. Since 30 September 2014 labour numbers have reduced by 432 as at 31 March 2015 and were 1,128 down compared to 31 March 2014. We are in close consultation with our unions, including our majority union AMCU, over this issue. We are concerned about job losses but we are encouraged by interactions so far that our improving relationships should help all parties navigate this difficult issue.
o We maintain guidance for saleable metal-‐in-‐concentrate at around 750,000 Platinum ounces and for sales of around 730,000 Platinum ounces
o We are pleased with the cost savings achieved during this period. We will maintain our unit cost guidance of R10,800 per PGM ounce for the full year
o We are planning on the basis that the ongoing low Dollar PGM prices persist for around two years and as a result we are again reducing our expected capital expenditure for 2015 from $185 million to $160 million
o We expect to continue to limit our capital expenditure over the next two financial years to around $150 million per annum whilst maintaining sales of around 750,000 Platinum ounces per annum
o Our level of borrowings was higher at 31 March 2015 as a direct result of the lower sales volumes in H1 which will unwind in H2. We are confident of managing our working capital requirements through cash conservation measures and capital discipline to keep borrowings and debt covenants well within our committed debt facilities.
Ben Magara, Chief Executive Officer, said: “We have continued to make good progress in a tough PGM pricing environment. I am encouraged by our ongoing efforts to manage the controllables including the constructive dialogue through engagement with the unions to reduce costs including labour costs. We are working well within our debt facilities and this position will improve further during H2 as stockpiles unwind. We are doing all this against a background of fatality-‐free operations although the LTIFR has increased. Lonmin’s operations and capital expenditure are scalable. Consequently we have been, and will continue to use the operational and capital expenditure levers within our control to reduce costs and preserve cash to navigate the effects of a low PGM price environment.”
3
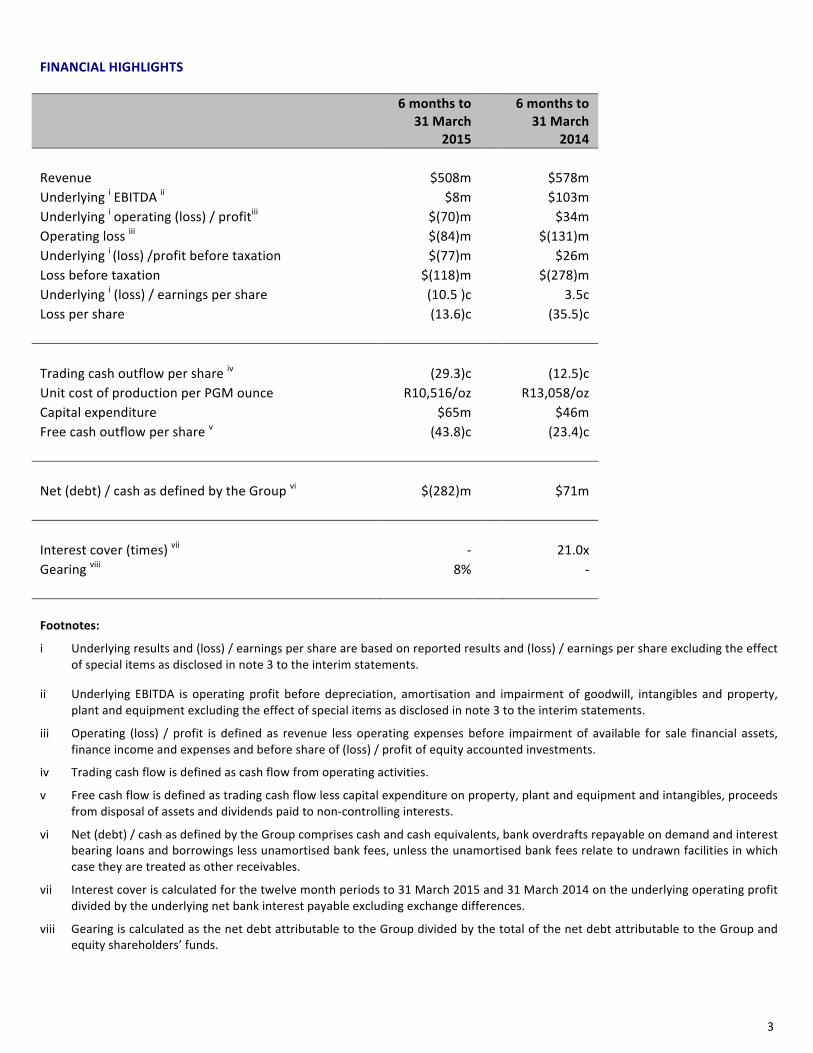
FINANCIAL HIGHLIGHTS
6 months to
31 March 2015
6 months to
31 March 2014
Revenue $508m $578m Underlying i EBITDA ii $8m $103m Underlying i operating (loss) / profitiii $(70)m $34m Operating loss iii $(84)m $(131)m Underlying i (loss) /profit before taxation $(77)m $26m Loss before taxation $(118)m $(278)m Underlying i (loss) / earnings per share (10.5 )c 3.5c Loss per share (13.6)c (35.5)c Trading cash outflow per share iv (29.3)c (12.5)c Unit cost of production per PGM ounce R10,516/oz R13,058/oz Capital expenditure $65m $46m Free cash outflow per share v (43.8)c (23.4)c Net (debt) / cash as defined by the Group vi $(282)m $71m Interest cover (times) vii -‐ 21.0x Gearing viii 8% -‐ Footnotes:
i Underlying results and (loss) / earnings per share are based on reported results and (loss) / earnings per share excluding the effect of special items as disclosed in note 3 to the interim statements.
ii Underlying EBITDA is operating profit before depreciation, amortisation and impairment of goodwill, intangibles and property, plant and equipment excluding the effect of special items as disclosed in note 3 to the interim statements.
iii Operating (loss) / profit is defined as revenue less operating expenses before impairment of available for sale financial assets, finance income and expenses and before share of (loss) / profit of equity accounted investments.
iv Trading cash flow is defined as cash flow from operating activities.
v Free cash flow is defined as trading cash flow less capital expenditure on property, plant and equipment and intangibles, proceeds from disposal of assets and dividends paid to non-‐controlling interests.
vi Net (debt) / cash as defined by the Group comprises cash and cash equivalents, bank overdrafts repayable on demand and interest bearing loans and borrowings less unamortised bank fees, unless the unamortised bank fees relate to undrawn facilities in which case they are treated as other receivables.
vii Interest cover is calculated for the twelve month periods to 31 March 2015 and 31 March 2014 on the underlying operating profit divided by the underlying net bank interest payable excluding exchange differences.
viii Gearing is calculated as the net debt attributable to the Group divided by the total of the net debt attributable to the Group and equity shareholders’ funds.

4
ENQUIRIES Investors / Analysts: Lonmin Tanya Chikanza (Head of Investor Relations) +44 207 201 6007/+27 83 391 2859 Media: Cardew Group Anthony Cardew / James Clark +44 207 930 0777 Sue Vey +27 72 644 9777 Notes to editors Lonmin, which is listed on both the London Stock Exchange and the Johannesburg Stock Exchange, is one of the world's largest primary producers of PGMs. These metals are essential for many industrial applications, especially catalytic converters for internal combustion engine emissions, as well as their widespread use in jewellery. Lonmin's operations are situated in the Bushveld Igneous Complex in South Africa, where nearly 80% of known global PGM resources are located. The Company creates value for shareholders through mining, refining and marketing PGMs and has a vertically integrated operational structure -‐ from mine to market. Lonmin's mining operations extract ore from which the Process Operations produces refined PGMs for delivery to customers. Underpinning the operations is the Shared Services function which provides high quality levels of support and infrastructure across the operations. For further information please visit our website: http://www.lonmin.com
5
CHIEF EXECUTIVE OFFICER’S REVIEW 1. Introduction The six month period to 31 March 2015 was fatality free and demonstrated a strong performance from all our operations. However, it was impacted by continued downward pressure on Dollar PGM prices and increased safety stoppages in Q2 (Section 54s). Saleable metals-‐in-‐concentrate production was the highest since H1 2007. However, profitability was reduced as the PGM prices remained low although this was mitigated by the weaker Rand and our strong cost reduction programme. Immediate management actions: We have a comprehensive cost management strategy in place designed to preserve cash and a flexible capital expenditure deferral programme, based on our capital allocation philosophy. This enables us to optimise spend on the most profitable ounces of production whilst preserving the long term value of the business through the cycle as our operations and capital expenditure are scalable. Consequently we have been, and will continue to use the operational and capital expenditure levers within our control to reduce costs and preserve cash to navigate the effects of a lower PGM price environment and we are planning on the basis that this lasts for at least two years. We have taken the necessary decision, in reviewing our operating model, to implement an efficient operating structure that will better drive ownership and accountability whilst empowering operational management. This has resulted in the amalgamation of layers of management and reduced costs and may impact up to 3,500 people through voluntary separation packages and early retirements. We are aware and concerned about the socio-‐economic effects of job losses and we are encouraged by the interaction we are having with the relevant stakeholders. We have to spend within our means in this low PGM price environment. In terms of capital expenditure, we reduced our capital expenditure forecast for this financial year in early January, in response to the suppressed pricing environment, to $185 million compared to original guidance of $250 million. We have further scaled back our forecast expenditure for the current financial year from $185 million to $160 million in light of the persisting low PGM prices whilst maintaining platinum sales guidance of 730,000 ounces. We have also reduced capital expenditure guidance for 2016 and 2017 financial years and we expect to limit this to around $150 million per annum whilst maintaining annual sales of around 750,000 Platinum ounces, optimising the use of our healthy ore reserve position. This will result in a delay in K4 shaft and its eventual production of replacement ounces. We will continue to assess the timing around bringing the bulk tailings project online. The Number One and Two furnaces were shut down during the period for three months and 21 days respectively for repairs and maintenance. The downtime of the furnaces has resulted in a build-‐up in concentrate ahead of the smelter complex and a delay in refined metal production which impacted our short term liquidity. Net debt at 31 March 2015 was $282 million and was well within our bank debt facilities. Had we had not experienced the 200,000 PGM ounces stock lock up, the net revenue from the sales would have resulted in net debt being around $170 million lower. Sales for 2015 are anticipated to be back-‐end loaded and the debt position is expected to unwind in the second half of the financial year as our stock levels reduce. This combined with our cash conservation measures and capital discipline, gives us confidence that we continue to manage the business within our debt covenants and within our committed debt facilities. Key achievements:
• Lonmin has been fatality free for eighteen months.
• Our mining operations achieved ten million fatality free shifts on 22 April 2015, making us the first South African mining company to achieve this.
• We mined 5.7 million tonnes during the period, up 72.0% from the prior year period which was impacted by the strike. This was 2.7% lower than H1 2013 due to the depletion of the old shafts and opencast mining.

6
• Pleasing progress with the Saffy ramp up where production was up 57.9% on H1 2013 and we are on track to reach full production by the end of the financial year.
• We have completed the review of Hossy. The production output and efficiencies identified at Hossy have been encouraging and we are pleased with its progress. We will continue to operate Hossy, and integrate the management team of this shaft with that of Newman in order to maximise on economies of scale and reduce the overall costs.
• We delivered 381,984 ounces of Platinum-‐in-‐concentrate, up 77.6% from the prior year period.
• We achieved a unit cost of production of R10,516 per PGM ounce, 2.6% below our annual guidance of R10,800 demonstrating the progress we are making with our review of the operating model and continued cost conservation drive despite production bottlenecks due to the smelter downtime. Our unit cost is 19.5% lower than R13,058 in the prior year period which was impacted by the strike and a compound annual increase rate of 8.34% since H1 2013 despite two years of labour increases of 12.9% and 8.8%.
Challenges:
• The depressed PGM pricing environment continued.
• We need to continue to keep costs in check.
• Both the Number One and Number Two Furnaces were shut down during the period creating a build-‐up of concentrate ahead of the smelters which is anticipated to be processed in the second half of the year. As a result Platinum sales were 265,940 ounces, only 0.9% higher than the strike impacted prior year period.
2. Safety Lonmin has been fatality free for eighteen months. Our rolling twelve month average Lost Time Injury Frequency Rate (LTIFR) to 31 March 2015, worsened to 4.51 incidents per million man hours, compared to 3.23 at 31 March 2014 which reflected the reduced hours of work as a result of the strike. Additionally the physical health of our employees seems to be deteriorating and managing fatigue since the ramp up has been challenging. To curb the increase in lost time injuries and high potential incidents an updated and focussed Safety Improvement Plan has been developed. 3. Production Performance Our mining and milling performance in the first half of the 2015 financial year increased significantly on the prior year period which was impacted by the strike. Refined production was negatively impacted by the shutdowns of the Number One and Number Two furnaces during Q2. Both furnaces were back online before the end of the period and producing steadily by mid-‐March. The build-‐up of concentrate stock is expected to unwind by the financial year end. Mining Operations Total tonnes mined during the half year of 5.7 million, showed an increase of 72.0% when compared to the prior year period of 3.3 million tonnes which was impacted by the strike. In comparison to H1 2013, tonnes mined were only 2.7% lower despite the lower production from our four shafts in end of lifecycle management including the depleting opencast operations. The Marikana underground mining operations produced 5.3 million tonnes during the half year, an increase of 2.3 million tonnes, or 76.4% on the prior year period as the strike impacted all underground shafts in the prior year period. This was in-‐line with H1 2013 Marikana underground production of 5.3 million tonnes in spite of increased Section 54 safety stoppages in 2015. Saffy shaft produced 830,000 tonnes in the period compared with 387,000 tonnes in H1 2014 (up 114.4%) and 526,000 tonnes in H1 2013 (up 57.9%). The ramp up has resulted in the cost per PGM ounce in H1 2015 of R7,077. Reassuringly this was 16.7% lower than H1 2013 despite increases in labour costs and CPI of 19.2% across the same period. We are pleased that Saffy is ramping up as expected. The ramp up is on schedule to reach full production by the end of the year with a
7
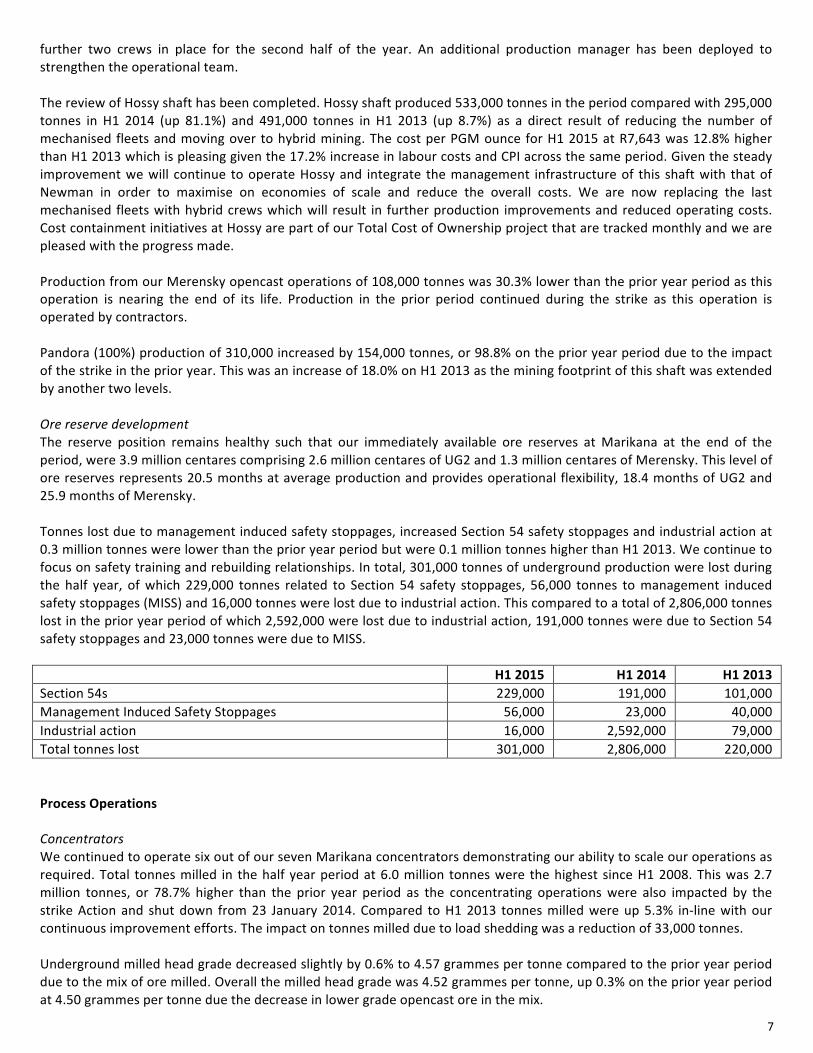
further two crews in place for the second half of the year. An additional production manager has been deployed to strengthen the operational team. The review of Hossy shaft has been completed. Hossy shaft produced 533,000 tonnes in the period compared with 295,000 tonnes in H1 2014 (up 81.1%) and 491,000 tonnes in H1 2013 (up 8.7%) as a direct result of reducing the number of mechanised fleets and moving over to hybrid mining. The cost per PGM ounce for H1 2015 at R7,643 was 12.8% higher than H1 2013 which is pleasing given the 17.2% increase in labour costs and CPI across the same period. Given the steady improvement we will continue to operate Hossy and integrate the management infrastructure of this shaft with that of Newman in order to maximise on economies of scale and reduce the overall costs. We are now replacing the last mechanised fleets with hybrid crews which will result in further production improvements and reduced operating costs. Cost containment initiatives at Hossy are part of our Total Cost of Ownership project that are tracked monthly and we are pleased with the progress made. Production from our Merensky opencast operations of 108,000 tonnes was 30.3% lower than the prior year period as this operation is nearing the end of its life. Production in the prior period continued during the strike as this operation is operated by contractors. Pandora (100%) production of 310,000 increased by 154,000 tonnes, or 98.8% on the prior year period due to the impact of the strike in the prior year. This was an increase of 18.0% on H1 2013 as the mining footprint of this shaft was extended by another two levels. Ore reserve development The reserve position remains healthy such that our immediately available ore reserves at Marikana at the end of the period, were 3.9 million centares comprising 2.6 million centares of UG2 and 1.3 million centares of Merensky. This level of ore reserves represents 20.5 months at average production and provides operational flexibility, 18.4 months of UG2 and 25.9 months of Merensky. Tonnes lost due to management induced safety stoppages, increased Section 54 safety stoppages and industrial action at 0.3 million tonnes were lower than the prior year period but were 0.1 million tonnes higher than H1 2013. We continue to focus on safety training and rebuilding relationships. In total, 301,000 tonnes of underground production were lost during the half year, of which 229,000 tonnes related to Section 54 safety stoppages, 56,000 tonnes to management induced safety stoppages (MISS) and 16,000 tonnes were lost due to industrial action. This compared to a total of 2,806,000 tonnes lost in the prior year period of which 2,592,000 were lost due to industrial action, 191,000 tonnes were due to Section 54 safety stoppages and 23,000 tonnes were due to MISS. H1 2015 H1 2014 H1 2013 Section 54s 229,000 191,000 101,000 Management Induced Safety Stoppages 56,000 23,000 40,000 Industrial action 16,000 2,592,000 79,000 Total tonnes lost 301,000 2,806,000 220,000 Process Operations Concentrators We continued to operate six out of our seven Marikana concentrators demonstrating our ability to scale our operations as required. Total tonnes milled in the half year period at 6.0 million tonnes were the highest since H1 2008. This was 2.7 million tonnes, or 78.7% higher than the prior year period as the concentrating operations were also impacted by the strike Action and shut down from 23 January 2014. Compared to H1 2013 tonnes milled were up 5.3% in-‐line with our continuous improvement efforts. The impact on tonnes milled due to load shedding was a reduction of 33,000 tonnes. Underground milled head grade decreased slightly by 0.6% to 4.57 grammes per tonne compared to the prior year period due to the mix of ore milled. Overall the milled head grade was 4.52 grammes per tonne, up 0.3% on the prior year period at 4.50 grammes per tonne due the decrease in lower grade opencast ore in the mix.
8
Underground and overall concentrator recoveries for the half year at 87.0% continue to be industry leading. Total Platinum-‐in-‐concentrate for the period under review at 381,984 saleable ounces was the highest since H1 2007. This was 77.6% higher than the prior year period as a result of the strike related shut down in the prior year. Smelters and Refineries The Number One furnace was safely stopped in early December following the detection of a leak. Repairs to this furnace and the additional maintenance work that was brought forward was completed within the scheduled three months and first matte was successfully tapped on 9 March 2015. The Number Two furnace was also safely stopped at the end of December following the detection of electrode breaks. The repairs to this furnace were made successfully and the first matte tap was in January. The three smaller Pyromet furnaces were restarted in early December to increase smelting capacity during this time and will continue to provide smelting capacity throughout the year as the Number Two furnace is planned to be taken down later this year to replace the refractory bricks and to implement design upgrades on the roof and off-‐gas system. We expect to process the current build-‐up of concentrate by the end of the year. As a result, total refined production for the period at 262,303 ounces of saleable Platinum was up only 2.0% when compared against the prior year period. PGMs produced in the half year were 501,456 ounces, representing a decrease of 7.7% on the prior year period as toll returns of other precious metals were not significantly impacted by the strike in the prior year period. Platinum sales for the half year at 265,940 ounces were slightly up on the prior year period (up 0.9%), and the 514,747 PGM ounces achieved during the period, were 6.0% lower than the prior year period. Production statistics for Quarter Two of the year can be found in a separate announcement published today or on the Company’s website: www.lonmin.com. 4. Value Benefits – Update on progress with >R2 billion over three years We are making good progress towards delivering greater than R2 billion sustainable value benefits over three years (2015-‐2017). Operating Model Cost Savings As part of our cost reduction strategy, we are reorganising our operating structure in addition to enhancing responsibility and direct line of sight by enabling quick decision making and driving accountability in both the operational and functional areas. This will result in the amalgamation of management layers across the operations. We are in close consultation with our unions, including our majority union AMCU, and other stakeholders. The review of our contractor model; redeployment of employees and contractors; freezing general recruitment; and natural attrition has resulted in identified cost savings of R292 million. Total cost of ownership initiatives has resulted in cost savings of R84 million to date. This is ahead of schedule and is driving lower unit costs in 2015 than anticipated. The target for this is R600 million over three years. Lonmin has achieved a headcount reduction of 1,128 since March 2014 of which 914 were contractors. Contractor headcount has reduced by 618 since September 2014 whilst employee numbers have only increased by 186, a net reduction in headcount of 432 in the half year period. A total of 1,430 employees have been redeployed from general to non-‐production crews and 398 to K4 without recruitment. Productivity and Efficiencies Productivity at our Generation Two shafts (K3, Rowland, 4B/1B, Saffy, Hossy and Newman) in H1 2015 is not comparable to the prior year period due to the strike in 2014 but was in line with H1 2013 at 5.6 square metres per man. Productivity at Saffy increased by 18% compared to H1 2013 as we progress in our ramp up at this shaft. Section 54s have adversely affected our productivity efforts especially at K3 shaft. Our Generation Two shafts contribute 90% of production.

9
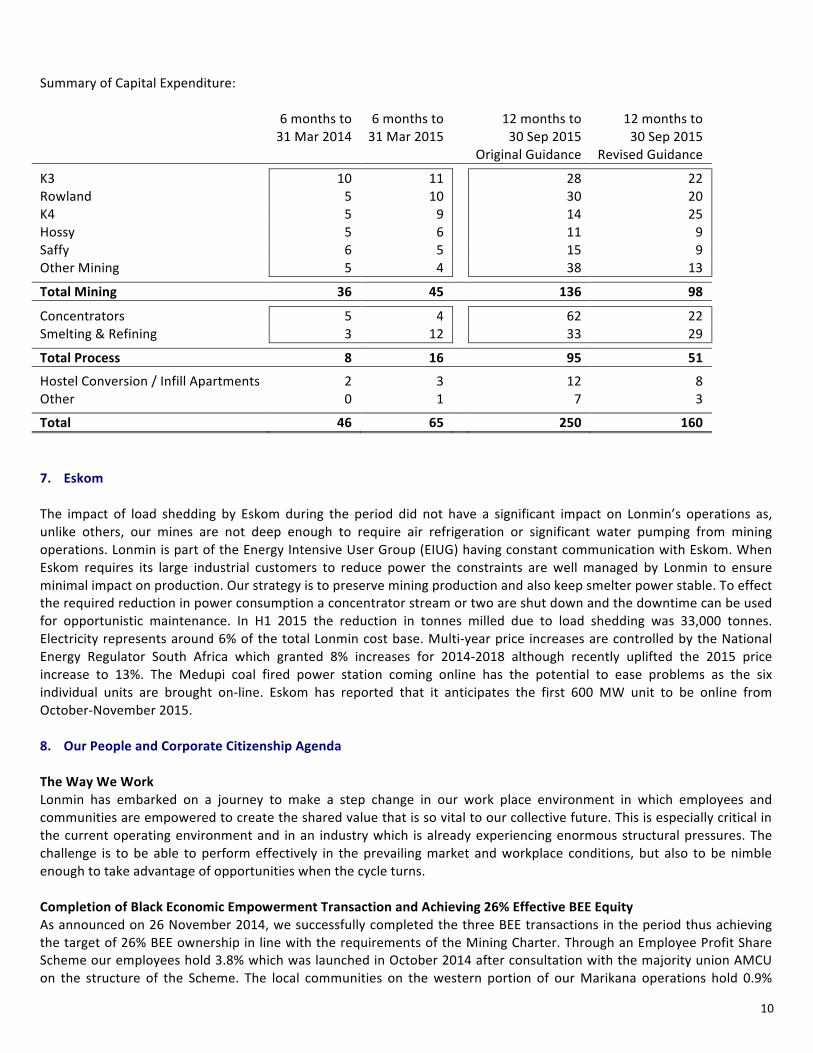
Productivity at our Generation One shafts (E1, E2, E3 and W1) at 4.4 metres squared per man was 14% lower than H1 2013 driven by a 52% decline at E1 as this shaft is at the end of its lifecycle. Our E1 and E2 shafts are being converted to ore purchase agreements with contract mining to extract further value. This has largely been completed at our W1 shaft. We will maintain management oversight to ensure compliance to safety and other relevant standards. We are pleased to have largely maintained the production momentum achieved after the five month strike. In spite of Lonmin’s health and wellness programme, the health of our employees has deteriorated and managing the physical and mental fatigue of our employees is an increasing challenge. Process Operations As part of our strategy, we identified benefits from reducing metals in pipeline. The reduction in metals in process pipeline was anticipated to be phased over 2016 and 2017 financials years. It has not been possible to bring this forward due to the impact of the smelter downtime in H1. 5. Profitability The Rand basket price including base metal revenue in the first half of the year averaged R11,263 per PGM ounce. This was 1.9% higher than the prior year period but 6.5% lower in Dollar terms. The cost of production for the period was a pleasing R10,516 per PGM ounce, 19.5% lower than the prior year period. The low metal prices and constraints around our smelting operations have negatively impacted profitability although the weaker Rand has partially off-‐set the lower Dollar prices as our cost base is predominately Rand based. As a result underlying EBITDA was $8 million compared to $103 million in the prior year period when idle costs of production during the strike amounting to $165 million were treated as special costs and excluded from underlying EBITDA. Unit costs in our smelting and refining operations are expected to reduce in the second half of the year as we process the build-‐up of stock. However, should the rise in Section 54 safety stoppages that we have seen in the last few months continue, the resultant lower mining volumes would negatively impact unit costs. 6. Balance Sheet Management Net Debt The impact of the smelter shut downs and low PGM prices has resulted in net debt of $282 at 31 March 2015 compared to $29 million at 30 September 2014. This is well within the $563 million debt facilities of the Group and would have been some $170 million lower had the stock build-‐up not occurred. We have sufficient furnace capacity with our Number One, Number Two and three Pyromet furnaces to process the build-‐up in concentrate in the second half of the year and we anticipate that our stock levels will unwind from $496 million at 31 March 2015. Capital Expenditure During Q1 as low prices persisted, we scaled back our 2015 capital expenditure guidance from $250 million to $185 million using our capital ranking process. This is in line with our strategy to fund capital expenditure from cash flows generated by the business. At the concentrators the bulk tailings treatment project was consequently deferred as were non-‐critical path items at some shafts. We continue to monitor our capital expenditure and are further reducing our capital expenditure guidance to $160 million. At K4 we are utilising excess labour from capital areas at other shafts to support the start-‐up plan. Capital spend in the half year was $65 million compared to $46 million in the prior year period. Capital expenditure in the first six months was mainly on stay in business capital across the various shafts and processing facilities, development of ore reserves at K3, Rowland and Saffy shafts as well as critical ore pass rehabilitation work on K4 and the furnace rebuilds which cost $8 million. The hostel conversion programme was completed in Q1 and the hostel infill project is planned to commence in the second half of the year as these are an important part of improving the living conditions of our employees.
10
Summary of Capital Expenditure: 6 months to
31 Mar 2014 6 months to 31 Mar 2015
12 months to 30 Sep 2015
12 months to 30 Sep 2015
Original Guidance Revised Guidance
K3 10 11 28 22 Rowland 5 10 30 20 K4 5 9 14 25 Hossy 5 6 11 9 Saffy 6 5 15 9 Other Mining 5 4 38 13
Total Mining 36 45 136 98
Concentrators 5 4 62 22 Smelting & Refining 3 12 33 29
Total Process 8 16 95 51
Hostel Conversion / Infill Apartments 2 3 12 8 Other 0 1 7 3
Total 46 65 250 160 7. Eskom The impact of load shedding by Eskom during the period did not have a significant impact on Lonmin’s operations as, unlike others, our mines are not deep enough to require air refrigeration or significant water pumping from mining operations. Lonmin is part of the Energy Intensive User Group (EIUG) having constant communication with Eskom. When Eskom requires its large industrial customers to reduce power the constraints are well managed by Lonmin to ensure minimal impact on production. Our strategy is to preserve mining production and also keep smelter power stable. To effect the required reduction in power consumption a concentrator stream or two are shut down and the downtime can be used for opportunistic maintenance. In H1 2015 the reduction in tonnes milled due to load shedding was 33,000 tonnes. Electricity represents around 6% of the total Lonmin cost base. Multi-‐year price increases are controlled by the National Energy Regulator South Africa which granted 8% increases for 2014-‐2018 although recently uplifted the 2015 price increase to 13%. The Medupi coal fired power station coming online has the potential to ease problems as the six individual units are brought on-‐line. Eskom has reported that it anticipates the first 600 MW unit to be online from October-‐November 2015. 8. Our People and Corporate Citizenship Agenda The Way We Work Lonmin has embarked on a journey to make a step change in our work place environment in which employees and communities are empowered to create the shared value that is so vital to our collective future. This is especially critical in the current operating environment and in an industry which is already experiencing enormous structural pressures. The challenge is to be able to perform effectively in the prevailing market and workplace conditions, but also to be nimble enough to take advantage of opportunities when the cycle turns. Completion of Black Economic Empowerment Transaction and Achieving 26% Effective BEE Equity As announced on 26 November 2014, we successfully completed the three BEE transactions in the period thus achieving the target of 26% BEE ownership in line with the requirements of the Mining Charter. Through an Employee Profit Share Scheme our employees hold 3.8% which was launched in October 2014 after consultation with the majority union AMCU on the structure of the Scheme. The local communities on the western portion of our Marikana operations hold 0.9%

11
through a Community Share Ownership Trust. The Bapo ba Mogale traditional Community holds 3.3%. Achieving this target is also aligned to the commitment and values to support the improvement and development of the communities where we operate and align the interests of employees and host communities with those of shareholders. Once Empowered Always Empowered (OEAE) Principle The historical “Once Empowered Always Empowered” principle is a subject of legal clarity involving the Chamber of Mines on behalf of the industry and the South African Government’s Department of Minerals and Resources. Lonmin replaced its original BEE partners for value with another BEE partner and our BEE equity ownership is at 26%. Relationship Building -‐ Unions and Employees Relationship building programme Much progress has been made with our relationship building programme which we actively work together with AMCU as the majority union and other minority unions. All shafts have successfully completed the first phase of the programme. We are also tracking the work done by all the union engagement structures. AMCU remains the majority union with an overall membership of 75% and with 86% in respect of category 4-‐9 employees. NUM membership has declined from 8% to 7%. The non-‐unionised employee population has increased by one percent to 11% after being steady for the past 3 months at 10% and the balance is held by UASA and Solidarity. Completion of 2014 wage agreement process and preparations 2016 wage negotiations The third year wage increase, as agreed in 2014, will take effect on 1 July 2015 and result in labour cost increase of 8.2%. During the 2014 wage negotiations we agreed to establish joint task teams comprising of Lonmin management and unions to address core focus areas outlined in the wage agreement signed, in preparation for the 2016 wage negotiations. We have signed the terms of reference for the task teams with the majority union (AMCU). The remit of the joint task teams include broader stakeholder engagement in-‐line with the generic processes of consultation and social dialogue and will cover amongst others, productivity improvements, housing and living conditions, employee indebtedness, skills development and shareholding and profit sharing. Bapo ba Mogale Community -‐ Procurement Benefits and Skills Upliftment The Bapo ba Mogale Traditional Community is a key shareholder in Lonmin. The BEE deal described above is designed to share the value created by this Company and to assist in building our host Community. The value that accrues to the Bapo community should make a real difference to their lives and help to improve living conditions and provide Lonmin with a stable and peaceful operating environment which is key to running the business. As an integral part of the transaction, Lonmin committed to provide preferential procurement opportunities to members of the Bapo community of at least R200 million over an initial 18-‐month period. The first such contract was finalised in March 2015 involving the supply of equipment to move ore between shafts. Some 200 Bapo community members received training to fulfil this contract. In anticipation of further contracts being awarded, Lonmin is working with the Bapo community to assist with their financial planning and business management skills, so that they are able to compete for the tenders. Building a Shared Future with Communities We engage in a range of activities and initiatives aimed at improving the quality of life of our employees, their families and our communities. These projects are being driven through a structured stakeholder management process. Monthly meetings are held with ward counsellors who represent the community and information is shared with them which in turn is shared with community members. There is ongoing engagement between Lonmin and community leaders to ensure alignment on the safety and sustainability issues that affect Lonmin and the community. Lonmin views education and skills development as a long-‐term investment which benefits, supports and carries the learner through the whole education value chain to create employable and skilled individuals. We are proud that four out of our seven schools in our greater Lonmin community achieved matric pass rates of greater than 92 per cent. Education is key and to that end we have 22,500 learners enrolled in our GLC schools compared to 18,500 in 2013. Additional classrooms have been built and educator training projects are underway.

12
Lonmin continues to invest in socio-‐economic development projects that are aligned to enterprise and skills development, education development, community health and social infrastructure, including housing. Expenditure on socio-‐economic development for 2015 is expected to be R88 million, compared to R57 million in 2014 excluding housing. Lonmin is encouraged by the growing collaboration with all stakeholders as part of the Presidential package in addressing the Marikana model development. Lonmin is committed to contribute and play its part. 9. Shanduka In 2010, Shanduka acquired 50.03% of the shares in Incwala Resources Proprietary Limited which was part funded by a loan provided by Lonmin and which was subsequently restructured into a preference share structure comprising A and B class preference shares with the key terms of the preference shares including repayment provisions, mirroring the loan. At 31 March 2015, the carrying value of the Shanduka receivable in our balance sheet was $310 million. The preference shares are redeemable at any time on or after 8 July 2015 at Lonmin's request. If the preference shares are not redeemed at this time the interest rate increases by 2.5%. It is not our current intention to request redemption of the preference shares on 8 July 2015. 10. Limpopo In 2011, Lonmin and Shanduka entered into a conditional share subscription agreement with a view to Shanduka carrying out a feasibility study to assess the viability of it operating and developing Lonmin’s Limpopo operations. Assuming a successful outcome of the feasibility study, the agreement contemplated Shanduka raising the necessary funds to subscribe for 50% plus one share in the issued share capital of Messina Platinum Mines Limited (MPML), thereby acquiring control of Lonmin’s Limpopo operations. Various conditions precedent were required to be fulfilled prior to Shanduka subscribing for a majority of shares in MPML, including completion of due diligence exercises, a feasibility study, Shanduka raising the necessary capital and the parties obtaining necessary regulatory approvals. Given market conditions the two parties have mutually agreed to extend the date for the completion of this proposed transaction to 30 April 2016. 11. PGM Market Overview Platinum Group Metals (PGMs) enjoy strength in the diversity of their markets, both by end-‐use and by region. Autocatalysts remained the leading market overall for the PGMs during the period under review, supported by the imperative for ever-‐cleaner air in both developed and emerging markets and the desire for personal transport. While alternative powertrains (which do not need autocatalysts) are developing, the internal combustion engine looks set to dominate the foreseeable future. Platinum jewellery demand has grown to almost equal that of autocatalysts, and our marketing initiatives continue to grow demand in new regions. This year has seen the use for platinum, palladium and rhodium in the manufacture of bulk chemicals continue to grow. Despite the prevailing economic uncertainty, we anticipate slow platinum demand growth over the next few years. As the level of above-‐ground stocks falls we expect metal prices to appreciate. Many mining projects in South Africa, the main source of global primary supply, have been delayed or mothballed since 2008/2009 and given the number of old high cost mines with “for sale” signs, it is unlikely that supply from SA will grow in the next five years. Automotive Production – global growth trajectory supports PGM demand Total global vehicle production rose by 2.0% (1.8 million units) in 2014 to 87 million compared to 2013. Output was up by 3.5% in Western Europe, 4.1% in the US and 6.5% in China. Global light vehicle manufacture in 2014 has recovered by some 27 million units from the low in 2009 and was some 16 million units up on the previous high of 2007. Going forward, annual light vehicle production is expected to grow from 90 million units a year in 2015 to 122 million units a year in 2025. Autocatalyst PGM Demand – driven by auto sales and emissions legislation Platinum demand is driven by Europe and India, whilst palladium is reliant on demand from China and the US. The use of rhodium is more globally diversified. Diesel cars in India, light commercial vehicles in the Rest of World (RoW), and heavy-‐
13
duty diesel (HDD) in the RoW and Western Europe stand out as the growth markets for platinum. Cars in Western Europe, with its high diesel share and stringent emissions standards, are the main contributor to demand, albeit with little growth. The anticipated rise in diesel share and expedition in adoption of emissions legislation in India, as well as growth in vehicle production should support meaningful demand growth from this region. For palladium, the largest market, China, though slowing is also predicted to remain one of the growth markets. Legislative tightening in Europe, higher vehicle numbers and expansion of legislation sustain Europe and China as the largest markets for rhodium. Mobilisation for Balanced Approach to Diesel Vehicle Use Diesel vehicles have recently received negative press in Europe and are labelled by some as the main contributors to bad air quality in European cities. It should be noted, however, that newer diesel vehicles that adhere to the Euro 6 emission standard drastically reduce Nitrogen Oxide (NOx) pollutants. Lonmin is collaborating with the catalyst fabricators, car companies and other interest groups through the International Platinum Group Association (IPA) to educate and lobby with national and local European governments to abandon misguided communications and strategies to reduce or eradicate diesel powered vehicles and rather incentivise the accelerated disposal of older diesels and acquisition of Euro 6 compliant diesel vehicles. Fuel Cell Vehicles – long-‐term growth market Platinum catalysts are key to the largest volume fuel cell technology such as Proton Exchange Membrane Fuel Cells (PEMFC) and more companies are actively seeking the optimal solution to mass market deployment. It is anticipated that both stationary and vehicle fuel cells will see increasing adoption over the next decade and will be an increasingly significant feature of the platinum demand profile. The transport sector is expected to be the largest user of platinum in fuel cells, followed by the stationary sector. Fuel cell vehicles are estimated to make up just 0.015% of global light vehicle production in 2025 but the impact on platinum consumption will be considerable. In addition, adoption of stationary fuel cell as base load and backup power is expected to grow significantly both in Asia and Africa. Jewellery – sales strongly influenced by marketing effort Platinum jewellery sales were essentially stable in 2014 and gross platinum jewellery demand is set to increase by over 500,000 ounces from 2014 to 2025, with faster growth expected in the near term. The single greatest contributor to demand is China, though growth was flat in 2014. India and the US are reporting healthy growth rates and India has the potential to overtake Japan as the second biggest jewellery market over the next five years. The importance of jewellery to overall platinum demand is clear, remaining at around 36% of total consumption during the period 2014 to 2025, and contributing 20% of the total growth over this period. Investment – ETFs remain sticky Global platinum ETF holdings added 217,000 ounces in 2014, an increase of 9%, as robust purchases in South Africa were partially offset by outflows from US, UK and Swiss funds. 2014 was a year of two halves, with accumulation of platinum held in ETFs through to July resulting in holdings reaching a record level of 2.9 million ounces. August saw across-‐the-‐board selling from ETFs and global holdings did not fully recover, as, although South African investors returned to being net purchasers in the fourth quarter, selling from European and US funds continued. Platinum ETFs ended 2014 with 2.75 million ounces of metal. Palladium investment demand received a boost in 2014 with the launch of two new ETFs in South Africa. Over the course of the year they gained 1.22 million ounces, making them slightly larger in ounce terms than the equivalent platinum ETFs. Total palladium holdings jumped 47%, or 940,000 ounces, during 2014. Investors outside South Africa were much less keen on palladium and there were significant sales from the US and Swiss funds and only a small increase in UK funds’ holdings. Platinum as an investment asset class is a net consumer of metal as it continues to grow. In addition, through our collaborative effort and the work of the World Platinum Investment Council we believe the benefits of investing in platinum will improve and attract more long term investors in future. Recycling – growing part of the mix SFA forecast platinum recycling to grow by 4% a year from 2.0 million ounces in 2014 to 3.0 million ounces by 2025. Much of this growth is expected to come from autocatalyst recycling, making up around two-‐thirds of the metal. In China, most of the scrap comes from the manufacturing process and unsold dated jewellery designs, so recycling expands as overall demand grows. SFA estimates that recycling is expected to meet 32% of total platinum demand in 2020 while other commentators are less optimistic about the growth. We believe that given the slower primary growth rate and healthy growth in demand, a share of between 25-‐30% of supply can be expected and will help maintain the balance.
14
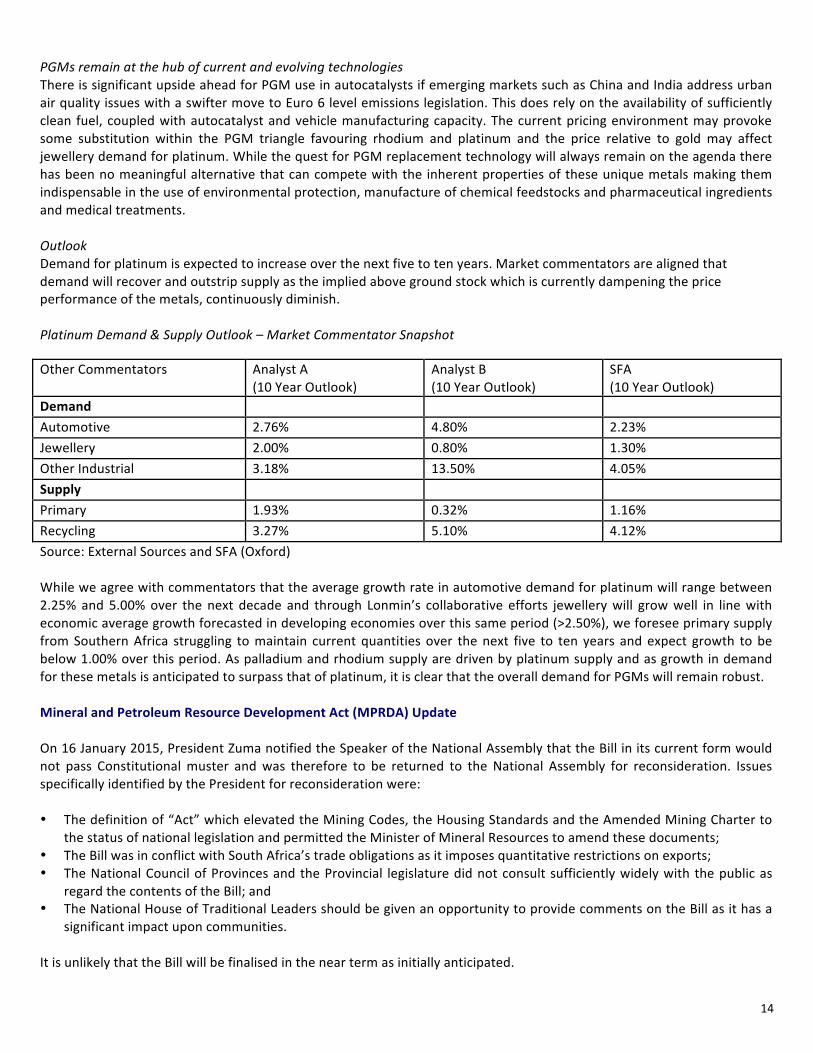
PGMs remain at the hub of current and evolving technologies There is significant upside ahead for PGM use in autocatalysts if emerging markets such as China and India address urban air quality issues with a swifter move to Euro 6 level emissions legislation. This does rely on the availability of sufficiently clean fuel, coupled with autocatalyst and vehicle manufacturing capacity. The current pricing environment may provoke some substitution within the PGM triangle favouring rhodium and platinum and the price relative to gold may affect jewellery demand for platinum. While the quest for PGM replacement technology will always remain on the agenda there has been no meaningful alternative that can compete with the inherent properties of these unique metals making them indispensable in the use of environmental protection, manufacture of chemical feedstocks and pharmaceutical ingredients and medical treatments. Outlook Demand for platinum is expected to increase over the next five to ten years. Market commentators are aligned that demand will recover and outstrip supply as the implied above ground stock which is currently dampening the price performance of the metals, continuously diminish. Platinum Demand & Supply Outlook – Market Commentator Snapshot Other Commentators Analyst A
(10 Year Outlook) Analyst B (10 Year Outlook)
SFA (10 Year Outlook)
Demand Automotive 2.76% 4.80% 2.23% Jewellery 2.00% 0.80% 1.30% Other Industrial 3.18% 13.50% 4.05% Supply Primary 1.93% 0.32% 1.16% Recycling 3.27% 5.10% 4.12% Source: External Sources and SFA (Oxford) While we agree with commentators that the average growth rate in automotive demand for platinum will range between 2.25% and 5.00% over the next decade and through Lonmin’s collaborative efforts jewellery will grow well in line with economic average growth forecasted in developing economies over this same period (>2.50%), we foresee primary supply from Southern Africa struggling to maintain current quantities over the next five to ten years and expect growth to be below 1.00% over this period. As palladium and rhodium supply are driven by platinum supply and as growth in demand for these metals is anticipated to surpass that of platinum, it is clear that the overall demand for PGMs will remain robust. Mineral and Petroleum Resource Development Act (MPRDA) Update On 16 January 2015, President Zuma notified the Speaker of the National Assembly that the Bill in its current form would not pass Constitutional muster and was therefore to be returned to the National Assembly for reconsideration. Issues specifically identified by the President for reconsideration were: • The definition of “Act” which elevated the Mining Codes, the Housing Standards and the Amended Mining Charter to
the status of national legislation and permitted the Minister of Mineral Resources to amend these documents; • The Bill was in conflict with South Africa’s trade obligations as it imposes quantitative restrictions on exports; • The National Council of Provinces and the Provincial legislature did not consult sufficiently widely with the public as
regard the contents of the Bill; and • The National House of Traditional Leaders should be given an opportunity to provide comments on the Bill as it has a
significant impact upon communities. It is unlikely that the Bill will be finalised in the near term as initially anticipated.
15
12. Update on the Farlam Commission of Inquiry Lonmin fully cooperated with the Farlam Commission and is committed to learn from the findings. All the deceased miners’ widows or relatives are already working at Lonmin and we have fulfilled our promise to employ them. All the widows have received all statutory payments that were due to them. Lonmin will continue to find ways of assisting the families of the victims including funding and supporting the Marikana Memorial Education Trust we founded in August 2012. The Farlam Commission of Inquiry submitted its findings and recommendations to the President of South Africa on 31 March 2015 as expected. 13. Management and Board Update As reported in the 2014 Annual Report, Karen de Segundo retired from the Board at the 2015 AGM on 29 January 2015 having served as a Non-‐executive director for almost ten years and having made a very significant contribution to the Company. On 16 February Varda Shine joined the Board as an independent Non-‐executive director having served eight years as the CEO of De Beers Trading Company. She brings with her considerable experience at a strategic and commercial level within the mining industry, particularly in the Southern African region. Glencore has confirmed its intention to divest its non-‐core 23.9% shareholding in Lonmin as a distribution in specie after Glencore shareholders approved the distribution at their Annual General Meeting on 7 May 2015. As a result its two representatives, Gary Nagle and Paul Smith, who have been on the Lonmin Board since September 2013, stepped down on 8 May 2015. As announced on 23 February, Phuti Mahanyele intends to resign from the Board as a Non-‐executive director from 30 June 2015 as a result of her resignation from Shanduka. We will notify the market in due course once details of Shanduka’s proposed nominee director have been confirmed. Barnard Mokwena resigned as EVP Strategic Business Transformation in December 2014 and Johan Viljoen resigned as COO on 24 February for personal reasons. Ben Moolman has been appointed COO having returned to Lonmin in August 2014 to head the Business Support Office. He has 30 years of experience in Platinum mining. In his previous role at the Company he served in a variety of operational management positions, including Vice President Mining and is ideally positioned to take on the COO role. Before re-‐joining Lonmin, Ben worked at Glencore Xstrata where he headed up the Platinum Division. 14. Outlook and Guidance The strong performance of our operations enables us to maintain our guidance for the full year of saleable metal-‐in-‐concentrate of around 750,000 Platinum ounces. The smelter complex is operating at normal production levels following the furnace incidents experienced in Q1 and we are utilising our surplus furnace capacity to maintain our sales guidance of around 730,000 Platinum ounces. We are pleased with our progress with the cost savings programme. We maintain our unit cost guidance of R10,800 per PGM ounce for the full year. As a consequence of the persisting low Dollar PGM prices and short to medium-‐term uncertainty around Platinum prices we are reducing our expected 2015 capital expenditure from $185 million to $160 million. Our level of borrowings was higher at the 31 March 2015 as a direct result of the lower sales volumes in H1 which will unwind in H2. The second half outcome in terms of debt reduction and earnings will, as always, be highly dependent on the prevailing PGM prices and exchange rates. At current prices, the sales falling into the second half as a result of the stock build-‐up at the end of March are expected to reduce debt by some $170 million but are only expected to contribute
16
to earnings in a small way as those stocks are held at close to current net realisable value. We are confident of managing our working capital requirements through cost conservation measures and capital discipline to keep borrowings and debt covenants well within our committed debt facilities. We are planning on the basis that the current depressed pricing environment will persist for at least two years and as a result we expect our capital expenditure over the next two financial years to reduce to $150 million per annum, from our previous guidance of $250-‐$350 million per annum whilst maintaining sales of 750,000 Platinum ounces for each year. 15. Employee Contribution Finally, I would like to express my sincere gratitude to all our employees, contractors, community members, the Lonmin Board and all stakeholders for their support and commitments to delivering a solid performance in the first half of 2015. Ben Magara Chief Executive Officer 8 May 2015

17
FINANCIAL REVIEW Overview The financial impact of the solid operational performance achieved from a mining perspective was somewhat diluted by the downtime in our smelter complex as well as the continued downward pressure on the Platinum price experienced during the period under review. We continued to demonstrate balance sheet flexibility through our ability to fund the working capital build up resulting from the furnace shutdowns while maintaining headroom in available debt facilities. Revenue generated was impacted by the lower Platinum price and the reduction in volumes sold. As a result, we continued to focus on cost savings. Labour rate increases since H1 2013 which were offset by cost saving initiatives have seen an increase in the cost of production per PGM ounce from R8,960 for the 2013 period to R10,516 for the six months ended 31 March 2015. The second half of the year will see a continued focus on cost containment to counter PGM price weakness, maintaining momentum in operational performance and the release of built up inventory as the key drivers of financial performance. The low metal prices and constraints around our smelting operations have negatively impacted profitability although the weaker Rand has partially off-‐set the lower Dollar prices as our cost base is predominately Rand based. As a result underlying EBITDA was $8 million compared to $103 million in the prior year period when idle costs of production during the strike amounting to $165 million were treated as special costs and excluded from underlying EBITDA. From a balance sheet perspective, the build-‐up of inventory has seen debt levels rise to end the period at $282 million. This remains well within our debt facility limits, reflecting the balance sheet flexibility we have built up since 2012. Had we had not experienced the stock lock up, the net revenue from the sales would have resulted in net debt being in the region of $170 million lower. With the smelter complex back at full capacity and the resultant unwinding of the accumulated pipeline stock in the second half of the financial year, debt levels are also expected to decrease by year-‐end. Income Statement The $104 million movement between the underlying operating loss of $70 million for the six months ended 31 March 2015 and the underlying operating profit of $34 million for the six months ended 31 March 2014 is analysed below. $m Period to 31 March 2014 reported operating loss (131) Period to 31 March 2014 special items 165 Period to 31 March 2014 underlying operating profit
34
PGM price PGM volume PGM mix Base metals
(45) (33) 2 6
Revenue changes (70) Cost changes (net of positive foreign exchange impact of $82m) (34) Period to 31 March 2015 underlying operating loss
(70)
Period to 31 March 2015 special items (14) Period to 31 March 2015 reported operating loss (84)
18
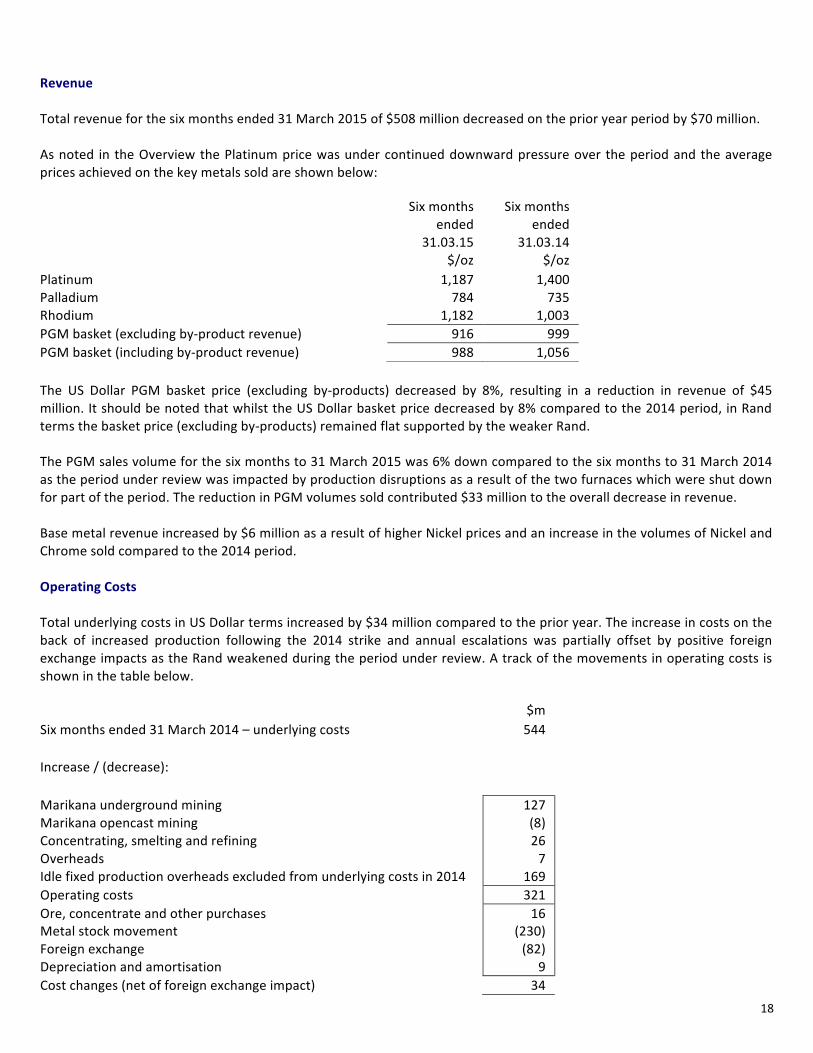
Revenue Total revenue for the six months ended 31 March 2015 of $508 million decreased on the prior year period by $70 million. As noted in the Overview the Platinum price was under continued downward pressure over the period and the average prices achieved on the key metals sold are shown below: Six months
ended 31.03.15
Six months ended
31.03.14 $/oz $/oz Platinum 1,187 1,400 Palladium 784 735 Rhodium 1,182 1,003 PGM basket (excluding by-‐product revenue) 916 999 PGM basket (including by-‐product revenue) 988 1,056 The US Dollar PGM basket price (excluding by-‐products) decreased by 8%, resulting in a reduction in revenue of $45 million. It should be noted that whilst the US Dollar basket price decreased by 8% compared to the 2014 period, in Rand terms the basket price (excluding by-‐products) remained flat supported by the weaker Rand. The PGM sales volume for the six months to 31 March 2015 was 6% down compared to the six months to 31 March 2014 as the period under review was impacted by production disruptions as a result of the two furnaces which were shut down for part of the period. The reduction in PGM volumes sold contributed $33 million to the overall decrease in revenue. Base metal revenue increased by $6 million as a result of higher Nickel prices and an increase in the volumes of Nickel and Chrome sold compared to the 2014 period. Operating Costs Total underlying costs in US Dollar terms increased by $34 million compared to the prior year. The increase in costs on the back of increased production following the 2014 strike and annual escalations was partially offset by positive foreign exchange impacts as the Rand weakened during the period under review. A track of the movements in operating costs is shown in the table below. $m Six months ended 31 March 2014 – underlying costs 544 Increase / (decrease):
Marikana underground mining Marikana opencast mining Concentrating, smelting and refining Overheads
127 (8) 26 7
Idle fixed production overheads excluded from underlying costs in 2014 169 Operating costs 321 Ore, concentrate and other purchases Metal stock movement Foreign exchange Depreciation and amortisation
16 (230) (82)
9 Cost changes (net of foreign exchange impact) 34

19
Six months ended 31 March 2015 – underlying costs 578
Marikana underground mining costs increased by $127 million or 39%, largely driven by an increase in production volumes when compared to the strike affected prior year period. Wage and utility escalations also contributed to the increase. Marikana opencast mining costs decreased by $8 million due to lower production as the operation is reaching the end of its life cycle. Concentrating, smelting and refining costs increased by $26 million or 21% compared to the prior year period as a result of increased volumes of ore milled compared to the prior period as well as cost escalations. This was partially offset by the reduction in volumes of refined production which was impacted by the smelter incidents. Overheads increased by $7 million largely due to cost escalations. Ore and concentrate purchases increased by $16 million due to higher volumes produced by the suppliers compared to the strike impacted prior year period. Due to the stoppages experienced at our Number One and Number Two furnaces for part of the six months under review, there was a build-‐up of concentrate stock ahead of the furnaces which resulted in an overall increase in closing stock compared to the prior year period. The movement in metal stock of $230 million comprises an increase of $125 million in the six months ended 31 March 2015 and a decrease in the prior year period of $105 million. The Rand weakened considerably against the US Dollar during the period under review averaging ZAR11.48 to USD1 compared to an average of ZAR10.46 to USD1 in the 2014 period resulting in a $82 million positive impact on operating costs. Depreciation and amortisation increased by $9 million over the 2014 period as a result of the increase in production during the period. Depreciation is calculated on a units-‐of-‐production basis, spreading costs in relation to proven and probable reserves. Cost of production per PGM Ounce The cost of production per PGM ounce for the six months to 31 March 2015 was contained to R10,516 despite production delays as a result of Furnaces One and Two being offline for part of the period under review as well salary and wage increases of 12.9% and 8.8% for the two years since H1 2013. Compared to the prior year period, the cost of production per PGM ounce was 19.5% lower as the prior year period was largely influenced by production disruptions as a result of the strike and included idle fixed production costs. Further details of unit costs can be found in the Operating Statistics.

20
Special Operating Costs Special operating costs for the six months ended 31 March 2015 are made up as follows:
6 months ended 31 March 2015
$m 2014 $m
BEE transaction costs 15 -‐ - Lock-‐in premium - Legal and consulting costs
13 2
-‐ -‐
Strike related costs (1) 164 - Idle fixed production costs -‐ 157 - Contractors’ claims -‐ 3 - Security costs -‐ 4 - Other costs (1) -‐
• Other -‐ 1 • 14 165
Special costs decreased significantly from $165 million for the six months ended 31 March 2014 as there were no strike related costs incurred during the six months ended 31 March 2015 (31 March 2014: $164 million). BEE transaction costs amounted to $15 million with $13 being the lock-‐in premium paid to the Bapo. Legal and consulting costs incurred on this transaction amounted to $2 million. Refer to note 11 in the Financial Statements for further details on the BEE transaction. Net Finance Costs 6 months to 31 March 2015
$m 2014
$m Net bank interest and fees (11) (8) Capitalised interest payable and fees 6 4 Exchange 4 2 Other (4) (4) Underlying net finance costs (5) (6) HDSA receivable (27) (139) Net finance costs (32) (145) The total net finance costs of $32 million for the six months ended 31 March 2015 represent a $113 million movement compared to total net finance costs of $145 million for the six months ended 31 March 2014. Net bank interest and fees increased from $8 million to $11 million for the six months ended 31 March 2015 largely as a result of an increase in average drawn facilities during the period under review. Interest totalling $6 million was capitalised to assets (2014 -‐ $4 million). The Historically Disadvantaged South Africans (HDSA) receivable, being the Sterling loan to Shanduka Resources (Proprietary) Limited (Shanduka) was impacted by interest accruals, exchange movements and movements in the value of the underlying security. Net finance costs of $27 million during the period to 31 March 2015 consist of adverse exchange movements of $36 million which were partially offset by accrued interest of $9 million. The Shanduka loan balance was assessed for impairment at 31 March 2015 by comparing the carrying amount of this loan to the value of the security, being the value of Shanduka’s shareholding in Incwala calculated based on discounted cash flows of Incwala’s underlying investments in WPL, EPL and Akanani. There was no adjustment to the impairment of the receivable at 31 March 2015. Refer to note 10 in the Financial Statements for further details.
21
Taxation Reported tax for the six months ended 31 March 2015 was a credit of $33 million compared to $67 million for the period ended 31 March 2014. The underlying tax credit of $9 million in the 2015 period increases to $33 million after taking into account exchange gains on the retranslation of Rand denominated deferred tax liabilities ($21 million) and the tax impact of special items ($3 million). These gains are treated as special. In the prior year period exchange gains had an effect of $23 million on the tax charge while special items had an effect of $46 million. Our philosophy on taxation is to comply with the tax legislation of all the countries in which we operate by paying all taxes due and payable in those countries in terms of the applicable tax laws. Transactions entered into by the Group are structured to follow bona fide business rationale and tax principles. We recognise that in order to be a sustainable and responsible business, the Group must have appropriate tax policies that are adhered to and managed properly. We seek to maintain a proactive and cooperative relationship with local tax authorities in all our business and tax transactions and conduct all such transactions in a transparent manner. With the Group’s primary operations being in South Africa, the tax liability follows such activity which has the effect that the majority of the Group’s taxes are paid in that country. Following the financial crisis of 2008 and other more recent events including the events at Marikana of 2012, sluggish global growth which has impacted PGM markets and the five month industry-‐wide strike which impacted profitability in 2014, the level of corporate tax has reduced. However, the Group continues to pay significant amounts in respect of other forms of tax including:
• Employee taxes • Customs and excise duties • Value Added Tax • State royalties
Our philosophy on transfer pricing is that related party transactions should be charged at arm’s length prices. Transfer pricing studies were performed by transfer pricing specialists on all our related party transactions and such transactions were found to be within acceptable norms compared to comparable transactions in similar companies. Lonmin inherited a number of companies in tax haven jurisdictions from previous unbundling and acquisition transactions. These companies are dormant entities and therefore do not receive any income. Furthermore, Lonmin does not pay any of its income to any of the dormant tax haven companies in these inherited structures.
22
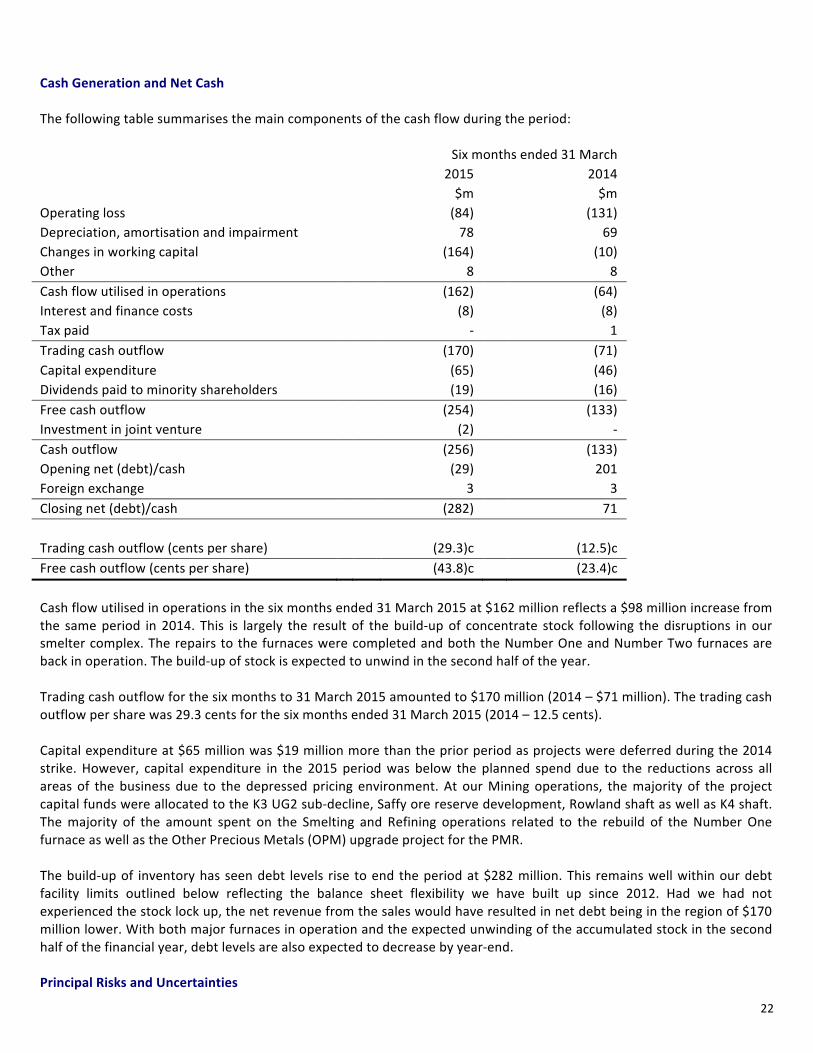
Cash Generation and Net Cash The following table summarises the main components of the cash flow during the period: Six months ended 31 March 2015 2014 $m $m Operating loss (84) (131) Depreciation, amortisation and impairment 78 69 Changes in working capital (164) (10) Other 8 8 Cash flow utilised in operations (162) (64) Interest and finance costs (8) (8) Tax paid -‐ 1 Trading cash outflow (170) (71) Capital expenditure (65) (46) Dividends paid to minority shareholders (19) (16) Free cash outflow (254) (133) Investment in joint venture (2) -‐ Cash outflow (256) (133) Opening net (debt)/cash (29) 201 Foreign exchange 3 3 Closing net (debt)/cash (282) 71 Trading cash outflow (cents per share) (29.3)c (12.5)c Free cash outflow (cents per share) (43.8)c (23.4)c Cash flow utilised in operations in the six months ended 31 March 2015 at $162 million reflects a $98 million increase from the same period in 2014. This is largely the result of the build-‐up of concentrate stock following the disruptions in our smelter complex. The repairs to the furnaces were completed and both the Number One and Number Two furnaces are back in operation. The build-‐up of stock is expected to unwind in the second half of the year. Trading cash outflow for the six months to 31 March 2015 amounted to $170 million (2014 – $71 million). The trading cash outflow per share was 29.3 cents for the six months ended 31 March 2015 (2014 – 12.5 cents). Capital expenditure at $65 million was $19 million more than the prior period as projects were deferred during the 2014 strike. However, capital expenditure in the 2015 period was below the planned spend due to the reductions across all areas of the business due to the depressed pricing environment. At our Mining operations, the majority of the project capital funds were allocated to the K3 UG2 sub-‐decline, Saffy ore reserve development, Rowland shaft as well as K4 shaft. The majority of the amount spent on the Smelting and Refining operations related to the rebuild of the Number One furnace as well as the Other Precious Metals (OPM) upgrade project for the PMR. The build-‐up of inventory has seen debt levels rise to end the period at $282 million. This remains well within our debt facility limits outlined below reflecting the balance sheet flexibility we have built up since 2012. Had we had not experienced the stock lock up, the net revenue from the sales would have resulted in net debt being in the region of $170 million lower. With both major furnaces in operation and the expected unwinding of the accumulated stock in the second half of the financial year, debt levels are also expected to decrease by year-‐end. Principal Risks and Uncertainties

23
The Group faces many risks in the operation of its business. The Group’s strategy takes into account known risks, but risks will exist of which we are currently unaware. The principal risks and uncertainties highlighted in our 2014 annual report have largely remained unchanged.

24
Financial Risk Management The main financial risks faced by the Group relate to the availability of funds to meet business needs (liquidity risk), the risk of default by counterparties to financial transactions (credit risk) and fluctuations in interest, foreign exchange rates and commodity prices (market risk). Factors which are outside the control of management which can have a significant impact on the business remain, specifically, volatility in the Rand / US Dollar exchange rate and PGM commodity prices. These are the critical factors to consider when addressing the issue of whether the Group is a Going Concern. Liquidity Risk The Group funds its operations through a mixture of equity funding and borrowings. The Group’s philosophy is to maintain an appropriately low level of financial gearing given the exposure of the business to fluctuations in PGM commodity prices and the Rand / US Dollar exchange rate. We ordinarily seek to fund capital requirements from equity. As part of the annual budgeting and long-‐term planning process, the Group's cash flow forecast is reviewed and approved by the Board. The cash flow forecast is amended for any material changes identified during the year, for example material acquisitions and disposals or changes in production forecasts. Where funding requirements are identified from the cash flow forecast, appropriate measures are taken to ensure these requirements can be satisfied. Factors taken into consideration are:
• the size and nature of the requirement; • preferred sources of finance applying key criteria of cost, commitment, availability, security / covenant conditions; • recommended counterparties, fees and market conditions; and • covenants, guarantees and other financial commitments.
The Group’s current debt facilities are summarised as follows:
• Revolving Credit Facility of $400 million at a Lonmin Plc level which matures in May 2016; and • Three bilateral facilities of R660 million each at Western Platinum Limited (WPL) level, each consisting of a R330
million five year committed component which matures in June 2016 and a R330 million one year committed component that can be rolled annually.
The following financial covenants apply to these facilities:
• consolidated tangible net worth will not be less than $2,250 million; • consolidated net debt will not exceed 25 per cent of consolidated tangible net worth; and • if:
o in respect of the amended US Dollar Facilities Agreement, the aggregate amount of outstanding loans exceeds $75 million at any time during the last six months of any test period; or
o in respect of both the amended US Dollar Facilities Agreement and the amended Rand Facilities Agreements, consolidated net debt exceeds $300 million as of the last day of any test period,
the capital expenditure of the Group must not exceed the limits set out in the table below, provided that, if 110 per cent of budgeted capital expenditure for any test period ending on or after 30 September 2013 is lower than the capital expenditure limit set out in the table below for that test period, then the capital expenditure limit for that test period shall be equal to 110 per cent of such budgeted capital expenditure.

25
Test Period Capital expenditure limit (ZAR) 1 October 2012 to 31 March 2013 (inclusive) . . . . . . . . . . . . . . . . . . . . . 800,000,000 1 October 2012 to 30 September 2013 (inclusive) . . . . . . . . . . . . . . . . . . 1,600,000,000 1 April 2013 to 31 March 2014 (inclusive) . . . . . . . . . . . . . . . . . . . . . . . . 1,800,000,000 1 October 2013 to 30 September 2014 (inclusive) . . . . . . . . . . . . . . . . . . 2,000,000,000 1 April 2014 to 31 March 2015 (inclusive) . . . . . . . . . . . . . . . . . . . . . . . . 3,000,000,000 1 October 2014 to 30 September 2015 (inclusive) . . . . . . . . . . . . . . . . . . 4,000,000,000 1 April 2015 to 31 March 2016 (inclusive) . . . . . . . . . . . . . . . . . . . . . . . . 4,000,000,000 1 October 2015 to 30 September 2016 (inclusive) . . . . . . . . . . . . . . . . . . 4,000,000,000 Credit Risk Banking Counterparties Banking counterparty credit risk is managed by spreading financial transactions across an approved list of counterparties of high credit quality. Banking counterparties are approved by the Board and consist of the ten banks that participate in Lonmin’s bank debt facilities. These counter-‐parties comprise: BNP Paribas S.A., Citigroup Global Markets Limited, FirstRand Bank Limited, HSBC Bank Plc, Investec Bank Limited, J.P. Morgan Limited, Lloyds TSB Bank Plc, The Royal Bank of Scotland N.V., The Standard Bank of South Africa Limited and Standard Chartered Bank. Trade Receivables The Group is exposed to significant trade receivable credit risk through the sale of PGMs to a limited group of customers. This risk is managed as follows: • aged analysis is performed on trade receivable balances and reviewed on a monthly basis; • credit ratings are obtained on any new customers and the credit ratings of existing customers are monitored on an on-‐
going basis; • credit limits are set for customers; and • trigger points and escalation procedures are clearly defined. It should be noted that a significant portion of Lonmin’s revenue is from two key customers. However, both of these customers have strong investment grade ratings and their payment terms are very short, thereby reducing trade receivable credit risk significantly. HDSA Receivables HDSA receivables are secured on the HDSA’s shareholding in Incwala Resources (Pty) Limited. Refer to note 8 in the financial statements for details on the valuation of this security and the impairment assessment. Interest Rate Risk Although the Group is in a net debt position, this risk is not considered to be high at this point in time. The interest position is kept under constant review in conjunction with the liquidity policy outlined above and the future funding requirements of the business. Foreign Currency Risk
26
The Group’s operations are predominantly based in South Africa and the majority of the revenue stream is in US Dollars. However, the bulk of the Group’s operating costs and taxes are paid in Rand. Most of the cash received in South Africa is in US Dollars. Most of the Group’s funding sources are in US Dollars. The Group’s reporting currency is the US Dollar and the share capital of the Company is based in US Dollars. During the period under review Lonmin did not undertake any foreign currency hedging. Commodity Price Risk Our policy is not to hedge commodity price exposure on PGMs, excluding gold, and therefore any change in prices will have a direct effect on the Group’s trading results. For base metals and gold, hedging is undertaken where the Board determines that it is in the Group’s interest to hedge a proportion of future cash flows. The policy allows Lonmin to hedge up to a maximum of 75% of the future cash flows from the sale of these products looking forward over the next 12 to 24 months. The Group did not undertake any hedging of base metals under this authority in the period under review and no forward contracts were in place in respect of base metals at the end of the period. In respect of gold, Lonmin entered into a prepaid sale of 75% of its current gold production for the next 54 months in March 2012. In terms of this contract Lonmin will deliver 70,700 ounces of gold over the period with delivery on a quarterly basis and in return received an upfront payment of $107 million. The upfront receipt was accounted for as deferred revenue on our balance sheet and is being released to profit and loss as deliveries take place at an average price of $1,510/oz delivered. Contingent Liabilities The Group provided third party guarantees to Eskom as security to cover estimated electricity consumption for three months. At 31 March 2015 these guarantees amounted to $9 million (2014 -‐ $10 million). Simon Scott Chief Financial Officer 8 May 2015

27
Operating Statistics for the 6 months to 31 March 2015
Units
6 months to
31 March 2015
6 months to
31 March 2014
6 months to
31 March 2013
Marikana K3 shaft kt 1,336 771 1,521 K4 shaft kt 23 - 4 1B/4B shaft kt 821 480 898 Karee kt 2,180 1,251 2,423 Rowland shaft kt 926 553 867 Newman shaft kt 399 239 476 Hossy shaft kt 533 295 491 W1 shaft kt 90 54 73 East 1 shaft 1 kt 74 57 199 Westerns kt 2,023 1,197 2,106 Saffy shaft kt 830 387 526 East 2 shaft kt 193 135 182 East 3 shaft kt 32 12 46 Easterns kt 1,056 534 754 Underground kt 5,259 2,982 5,284 Opencast kt 108 155 288 Total kt 5,367 3,136 5,571 Pandora (100%) 2 Underground kt 310 156 263 Limpopo 3 Underground kt - 9 - Lonmin (100%) Total tonnes mined (100%) kt 5,677 3,301 5,834
Tonnes mined
% tonnes mined from UG2 reef (100%)
%
76.1%
74.4%
73.3%
Lonmin (attributable) Underground & Opencast kt 5,512 3,211 5,683 Ounces Mined 4 Lonmin excluding Pandora Pt ounces oz 338,545 198,884 350,493 Pandora (100%) Pt ounces oz 21,115 11,372 18,865 Limpopo Pt ounces oz - 359 - Lonmin Pt ounces oz 359,660 210,616 369,358 Lonmin excluding Pandora PGM ounces oz 648,818 380,556 650,883 Pandora (100%) PGM ounces oz 41,612 22,366 35,936 Limpopo PGM ounces oz - 804 - Lonmin PGM ounces oz 690,430 403,726 686,819 Tonnes milled 5 Marikana Underground kt 5,485 2,982 5,238 Opencast kt 206 208 213 Total kt 5,691 3,190 5,450 Pandora 6 Underground kt 328 151 266 Limpopo 7 Underground kt - 27 - Lonmin Platinum Underground kt 5,813 3,161 5,503 Opencast kt 206 208 213 Total kt 6,020 3,368 5,716 Milled head Lonmin Platinum Underground g/t 4.57 4.60 4.63 grade 8 Opencast g/t 3.07 3.09 2.93 Total g/t 4.52 4.50 4.56 Concentrator Lonmin Platinum Underground % 87.0 87.9 86.8 recovery rate 9 Opencast % 85.2 84.3 85.4 Total % 87.0 87.7 86.8
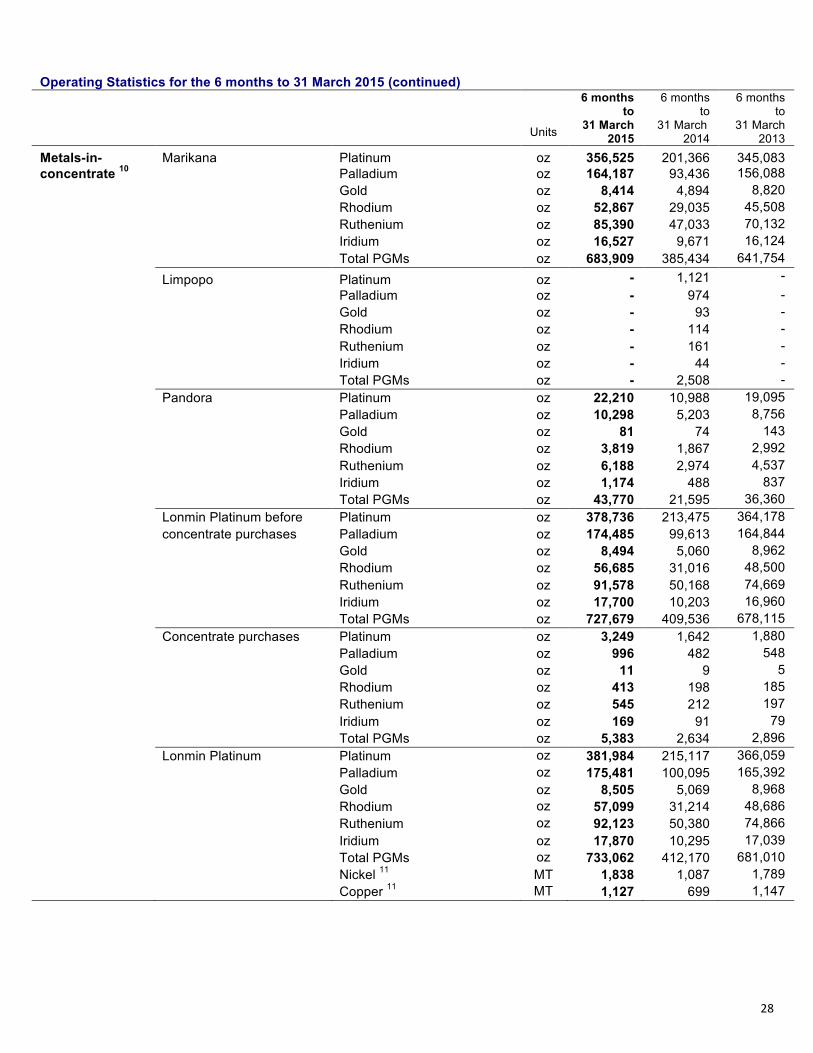
28
Operating Statistics for the 6 months to 31 March 2015 (continued)
Units
6 months to
31 March 2015
6 months to
31 March 2014
6 months to
31 March 2013
Metals-in- Marikana Platinum oz 356,525 201,366 345,083 concentrate 10 Palladium oz 164,187 93,436 156,088 Gold oz 8,414 4,894 8,820 Rhodium oz 52,867 29,035 45,508 Ruthenium oz 85,390 47,033 70,132 Iridium oz 16,527 9,671 16,124 Total PGMs oz 683,909 385,434 641,754 Limpopo Platinum oz - 1,121 - Palladium oz - 974 - Gold oz - 93 - Rhodium oz - 114 - Ruthenium oz - 161 - Iridium oz - 44 - Total PGMs oz - 2,508 - Pandora Platinum oz 22,210 10,988 19,095 Palladium oz 10,298 5,203 8,756 Gold oz 81 74 143 Rhodium oz 3,819 1,867 2,992 Ruthenium oz 6,188 2,974 4,537 Iridium oz 1,174 488 837 Total PGMs oz 43,770 21,595 36,360 Lonmin Platinum before Platinum oz 378,736 213,475 364,178 concentrate purchases Palladium oz 174,485 99,613 164,844 Gold oz 8,494 5,060 8,962 Rhodium oz 56,685 31,016 48,500 Ruthenium oz 91,578 50,168 74,669 Iridium oz 17,700 10,203 16,960 Total PGMs oz 727,679 409,536 678,115 Concentrate purchases Platinum oz 3,249 1,642 1,880 Palladium oz 996 482 548 Gold oz 11 9 5 Rhodium oz 413 198 185 Ruthenium oz 545 212 197 Iridium oz 169 91 79 Total PGMs oz 5,383 2,634 2,896 Lonmin Platinum Platinum oz 381,984 215,117 366,059 Palladium oz 175,481 100,095 165,392 Gold oz 8,505 5,069 8,968 Rhodium oz 57,099 31,214 48,686 Ruthenium oz 92,123 50,380 74,866 Iridium oz 17,870 10,295 17,039 Total PGMs oz 733,062 412,170 681,010 Nickel 11 MT 1,838 1,087 1,789 Copper 11 MT 1,127 699 1,147

29
Operating Statistics for the 6 months to 31 March 2015 (continued)
Units
6 months to
31 March 2015
6 months to
31 March 2014
6 months to
31 March 2013
Refined Lonmin refined metal Platinum oz 261,807 256,665 324,720 production production Palladium oz 120,080 128,283 145,964 Gold oz 6,670 6,360 9,049 Rhodium oz 36,898 62,953 35,746 Ruthenium oz 60,922 61,986 82,187 Iridium oz 11,903 18,817 12,853 Total PGMs oz 498,280 535,065 610,519 Toll refined metal Platinum oz 496 551 1,364 production Palladium oz 186 1,010 312 Gold oz 9 73 271 Rhodium oz 26 896 1,717 Ruthenium oz 1,946 4,482 5,185 Iridium oz 513 1,102 913 Total PGMs oz 3,176 8,114 9,762 Total refined PGMs Platinum oz 262,303 257,217 326,084 Palladium oz 120,267 129,293 146,276 Gold oz 6,679 6,433 9,321 Rhodium oz 36,924 63,848 37,463 Ruthenium oz 62,868 66,469 87,372 Iridium oz 12,416 19,919 13,766 Total PGMs oz 501,456 543,179 620,282 Base metals Nickel 12 MT 1,357 1,312 1,650 Copper 12 MT 786 764 1,030 Sales Lonmin Platinum Platinum oz 265,940 263,675 326,142 Palladium oz 124,248 136,573 140,775 Gold oz 7,050 6,500 8,337 Rhodium oz 31,189 53,993 33,469 Ruthenium oz 73,600 66,830 66,417 Iridium oz 12,720 19,843 11,614 Total PGMs oz 514,747 547,413 586,753 Nickel 12 MT 1,501 1,338 1,687 Copper 12 MT 784 804 1,024 Chrome 12 MT 767,413 505,101 651,010
Average prices Platinum $/oz 1,187 1,400 1,598 Palladium $/oz 784 735 713 Gold $/oz 1,510 1,510 1,529 Rhodium $/oz 1,182 1,003 1,196 Ruthenium $/oz 52 54 76 Iridium $/oz 544 490 1,005 Basket price of PGMs 13 $/oz 916 999 1,178 Basket price of PGMs 14 $/oz 988 1,056 1,252 Basket price of PGMs 13 R/oz 10,449 10,457 10,410 Basket price of PGMs 14 R/oz 11,263 11,049 11,056 Nickel 12 $/MT 12,263 11,572 14,184 Copper 12 $/MT 6,084 6,890 7,472 Chrome 12 $/MT 18 19 18
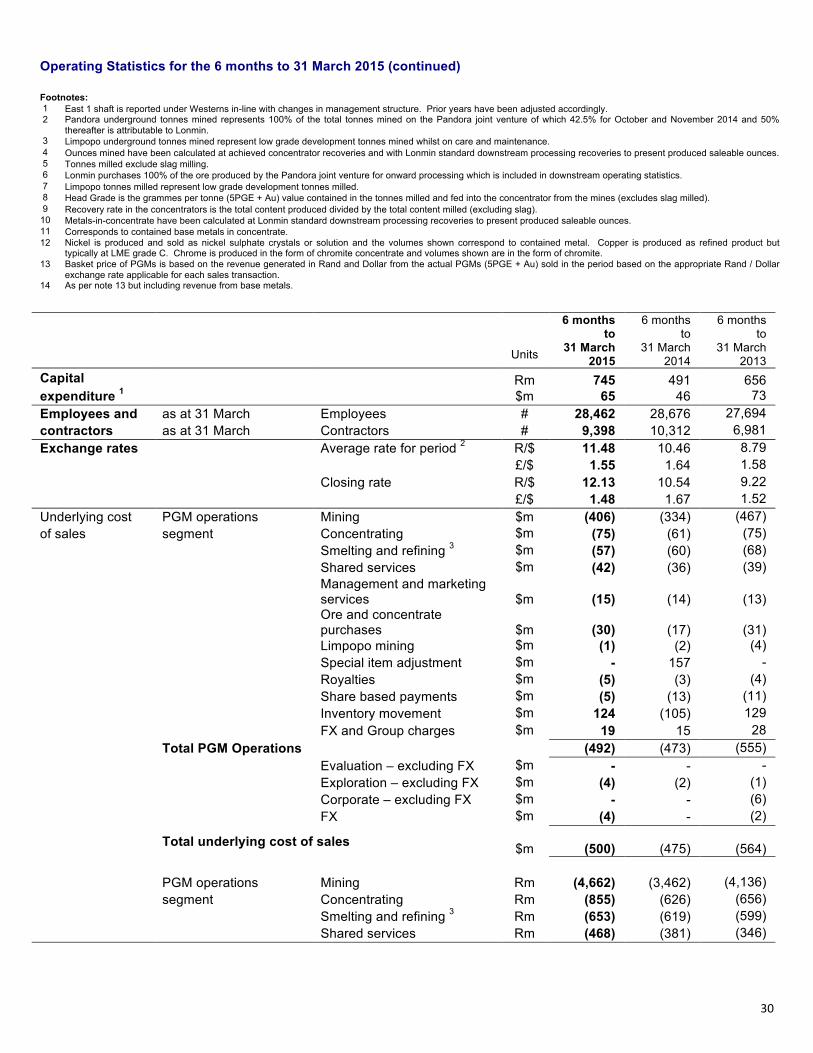
30
Operating Statistics for the 6 months to 31 March 2015 (continued) Footnotes: 1 East 1 shaft is reported under Westerns in-line with changes in management structure. Prior years have been adjusted accordingly. 2 Pandora underground tonnes mined represents 100% of the total tonnes mined on the Pandora joint venture of which 42.5% for October and November 2014 and 50%
thereafter is attributable to Lonmin. 3 Limpopo underground tonnes mined represent low grade development tonnes mined whilst on care and maintenance. 4 Ounces mined have been calculated at achieved concentrator recoveries and with Lonmin standard downstream processing recoveries to present produced saleable ounces. 5 Tonnes milled exclude slag milling. 6 Lonmin purchases 100% of the ore produced by the Pandora joint venture for onward processing which is included in downstream operating statistics. 7 Limpopo tonnes milled represent low grade development tonnes milled. 8 Head Grade is the grammes per tonne (5PGE + Au) value contained in the tonnes milled and fed into the concentrator from the mines (excludes slag milled). 9 Recovery rate in the concentrators is the total content produced divided by the total content milled (excluding slag).
10 Metals-in-concentrate have been calculated at Lonmin standard downstream processing recoveries to present produced saleable ounces. 11 Corresponds to contained base metals in concentrate. 12 Nickel is produced and sold as nickel sulphate crystals or solution and the volumes shown correspond to contained metal. Copper is produced as refined product but
typically at LME grade C. Chrome is produced in the form of chromite concentrate and volumes shown are in the form of chromite. 13 Basket price of PGMs is based on the revenue generated in Rand and Dollar from the actual PGMs (5PGE + Au) sold in the period based on the appropriate Rand / Dollar
exchange rate applicable for each sales transaction. 14 As per note 13 but including revenue from base metals.
Units
6 months to
31 March 2015
6 months to
31 March 2014
6 months to
31 March 2013
Capital Rm 745 491 656 expenditure 1 $m 65 46 73 Employees and as at 31 March Employees # 28,462 28,676 27,694 contractors as at 31 March Contractors # 9,398 10,312 6,981 Exchange rates Average rate for period 2 R/$ 11.48 10.46 8.79 £/$ 1.55 1.64 1.58 Closing rate R/$ 12.13 10.54 9.22 £/$ 1.48 1.67 1.52 Underlying cost PGM operations Mining $m (406) (334) (467) of sales segment Concentrating $m (75) (61) (75) Smelting and refining 3 $m (57) (60) (68) Shared services $m (42) (36) (39)
Management and marketing services
$m
(15)
(14)
(13)
Ore and concentrate purchases
$m
(30)
(17)
(31)
Limpopo mining $m (1) (2) (4) Special item adjustment $m - 157 - Royalties $m (5) (3) (4) Share based payments $m (5) (13) (11) Inventory movement $m 124 (105) 129 FX and Group charges $m 19 15 28 Total PGM Operations (492) (473) (555) Evaluation – excluding FX $m - - - Exploration – excluding FX $m (4) (2) (1) Corporate – excluding FX $m - - (6) FX $m (4) - (2)
Total underlying cost of sales $m
(500)
(475)
(564)
PGM operations Mining Rm (4,662) (3,462) (4,136) segment Concentrating Rm (855) (626) (656) Smelting and refining 3 Rm (653) (619) (599) Shared services Rm (468) (381) (346)

31

32
Operating Statistics for the 6 months to 31 March 2015 (continued)
Units
6 months to
31 March 2015
6 months to
31 March 2014
6 months to
31 March 2013
Underlying cost PGM operations Management and marketing of sales Segment services Rm (159) (144) (122) (continued) Ore and concentrate
purchases
Rm
(343)
(181)
(278) Limpopo mining Rm (12) (17) (32) Special item adjustment Rm - 1,726 - Royalties Rm (47) (31) (33) Share based payments Rm (56) (134) (100) Inventory movement Rm 2,152 (923) 1,286 FX and group charges Rm (871) (481) (693) Rm (5,974) (5,272) (5,699) Cost of Cost Mining Rm (4,662) (3,462) (4,136) production Concentrating Rm (855) (626) (656) (PGM operations Smelting and refining 3 Rm (653) (619) (599) segment) 4 Shared services Rm (468) (381) (346)
Management and marketing services
Rm
(159)
(144)
(112)
Rm (6,796) (5,233) (5,849)
PGM saleable ounces Mined ounces excluding ore purchases
oz
648,818
380,556
650,883
Metals in concentrate before concentrate purchases
oz
727,679
407,029
678,115
Refined ounces oz 501,456 543,179 620,282
Metals in concentrate including concentrate purchases
oz
733,062
409,663
681,010
Cost of production Mining R/oz (7,186) (9,097) (6,355) Concentrating R/oz (1,175) (1,538) (968) Smelting and refining 3 R/oz (1,302) (1,140) (965) Shared services R/oz (638) (929) (508)
Management and marketing services R/oz
(216)
(352)
(165)
R/oz (10,516) (13,058) (8,960) % change in cost of Mining % (21.0)% 43.2% n/a production Concentrating % (23.6)% 58.9% n/a Smelting and refining 3 % 14.2% 18.1% n/a Shared services % (31.3)% 83.1% n/a Management and marketing
services
%
(38.6)%
114.0%
n/a % (19.5)% 45.7% n/a Footnotes: 1 Capital expenditure is the aggregate of the purchase of property, plant and equipment and intangible assets (includes capital accruals and excludes capitalised interest).
2 Exchange rates are calculated using the market average daily closing rate over the course of the period.
3 Comprises of smelting and refining costs as well as direct process operations shared costs.
4 It should be noted that with the implementation of the revised operating model in 2014 and 2015 the cost allocation between business units has been changed and, therefore, whilst the total is on a like-for-like basis, individual line items are not totally comparable.
33
Responsibility statement of the directors in respect of the interim financial report We confirm that to the best of our knowledge:
• the condensed set of financial statements has been prepared in accordance with IAS 34 Interim Financial Reporting as adopted by the EU, and
• the interim management report includes a fair review of the information required by: (a) DTR4.2.7R of the Disclosure and Transparency Rules, being an indication of important events that have
occurred during the first six months of the financial year and their impact on the condensed set of financial statements; and a description of the principal risks and uncertainties for the remaining six months of the year; and
(b) DTR4.2.8R of the Disclosure and Transparency Rules, being related party transactions that have taken place in the first six months of the current financial year and that have materially affected the financial position or performance of the enterprise during that period; and any changes in the related party transactions described in the last annual report that could do so.
Brian Beamish Simon Scott Chairman Chief Financial Officer 8 May 2015

34
INDEPENDENT REVIEW REPORT TO LONMIN PLC
Introduction
We have been engaged by the company to review the condensed set of financial statements in the half-‐yearly financial report for the six months ended 31 March 2015 which comprises the consolidated income statement, consolidated statement of comprehensive income, consolidated statement of financial position, consolidated statement of changes in equity, consolidated statement of cash flows and the related explanatory notes. We have read the other information contained in the half-‐yearly financial report and considered whether it contains any apparent misstatements or material inconsistencies with the information in the condensed set of financial statements.
This report is made solely to the company in accordance with the terms of our engagement to assist the company in meeting the requirements of the Disclosure and Transparency Rules (“the DTR”) of the UK’s Financial Conduct Authority (“the UK FCA”). Our review has been undertaken so that we might state to the company those matters we are required to state to it in this report and for no other purpose. To the fullest extent permitted by law, we do not accept or assume responsibility to anyone other than the company for our review work, for this report, or for the conclusions we have reached.
Directors’ Responsibilities
The half-‐yearly financial report is the responsibility of, and has been approved by, the directors. The directors are responsible for preparing the half-‐yearly financial report in accordance with the DTR of the UK FCA.
As disclosed in note 1, the annual financial statements of the group are prepared in accordance with IFRSs as adopted by the EU. The condensed set of financial statements included in this half-‐yearly financial report has been prepared in accordance with IAS 34 Interim Financial Reporting as adopted by the EU.
Our Responsibility
Our responsibility is to express to the company a conclusion on the condensed set of financial statements in the half-‐yearly financial report based on our review.
Scope of review
We conducted our review in accordance with International Standard on Review Engagements (UK and Ireland) 2410 Review of Interim Financial Information Performed by the Independent Auditor of the Entity issued by the Auditing Practices Board for use in the UK. A review of interim financial information consists of making enquiries, primarily of persons responsible for financial and accounting matters, and applying analytical and other review procedures. A review is substantially less in scope than an audit conducted in accordance with International Standards on Auditing (UK and Ireland) and consequently does not enable us to obtain assurance that we would become aware of all significant matters that might be identified in an audit. Accordingly, we do not express an audit opinion.
Conclusion
Based on our review, nothing has come to our attention that causes us to believe that the condensed set of financial statements in the half-‐yearly financial report for the six months ended 31 March 2015 is not prepared, in all material respects, in accordance with IAS 34 as adopted by the EU and the DTR of the UK FCA.
Robert Seale for and on behalf of KPMG LLP Chartered Accountants 15 Canada Square London E14 5GL 8 May 2015
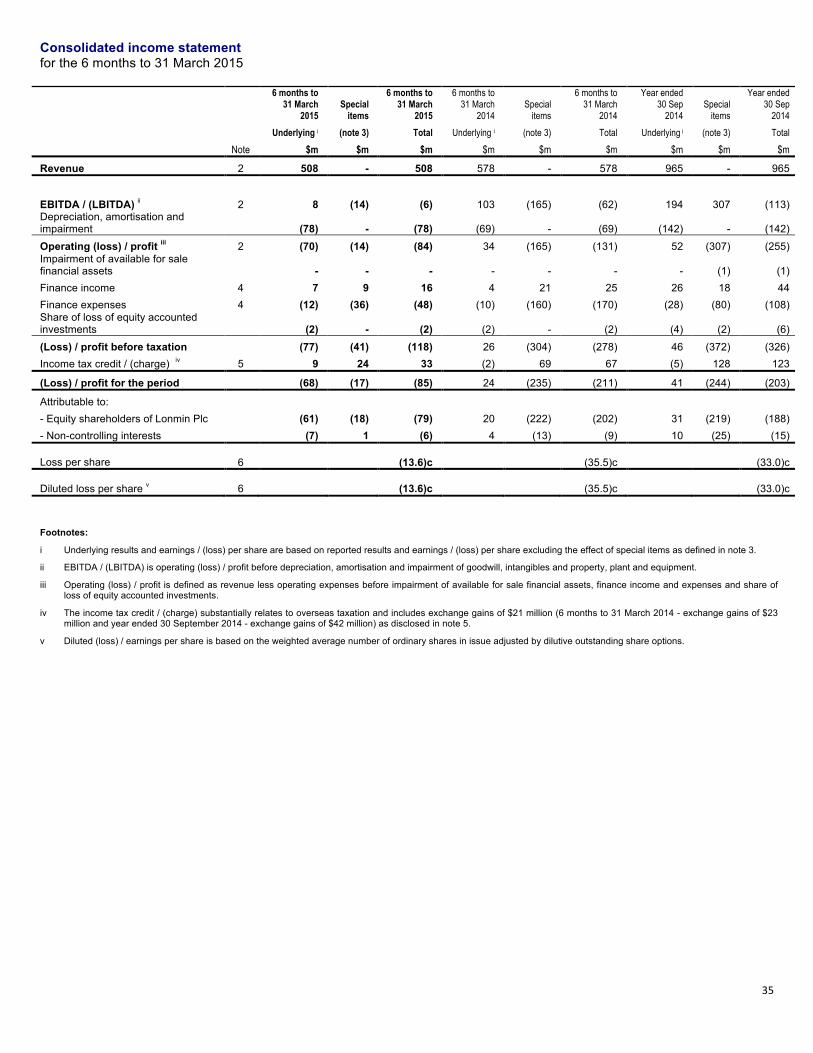
35
Consolidated income statement for the 6 months to 31 March 2015
6 months to 31 March
2015 Special
items
6 months to 31 March
2015
6 months to 31 March
2014 Special
items
6 months to 31 March
2014
Year ended 30 Sep
2014 Special
items
Year ended 30 Sep
2014
Underlying i (note 3) Total Underlying i (note 3) Total Underlying i (note 3) Total
Note $m $m $m $m $m $m $m $m $m
Revenue 2 508 - 508 578 - 578 965 - 965
EBITDA / (LBITDA) ii 2 8 (14) (6) 103 (165) (62) 194 307 (113) Depreciation, amortisation and impairment (78) - (78) (69) - (69) (142) - (142)
Operating (loss) / profit iii 2 (70) (14) (84) 34 (165) (131) 52 (307) (255) Impairment of available for sale financial assets - - - - - - - (1) (1) Finance income 4 7 9 16 4 21 25 26 18 44 Finance expenses 4 (12) (36) (48) (10) (160) (170) (28) (80) (108) Share of loss of equity accounted investments (2) - (2) (2) - (2) (4) (2) (6)
(Loss) / profit before taxation (77) (41) (118) 26 (304) (278) 46 (372) (326) Income tax credit / (charge) iv 5 9 24 33 (2) 69 67 (5) 128 123
(Loss) / profit for the period (68) (17) (85) 24 (235) (211) 41 (244) (203)
Attributable to: - Equity shareholders of Lonmin Plc (61) (18) (79) 20 (222) (202) 31 (219) (188) - Non-controlling interests (7) 1 (6) 4 (13) (9) 10 (25) (15) Loss per share 6 (13.6)c (35.5)c (33.0)c Diluted loss per share v 6 (13.6)c (35.5)c (33.0)c Footnotes:
i Underlying results and earnings / (loss) per share are based on reported results and earnings / (loss) per share excluding the effect of special items as defined in note 3.
ii EBITDA / (LBITDA) is operating (loss) / profit before depreciation, amortisation and impairment of goodwill, intangibles and property, plant and equipment.
iii Operating (loss) / profit is defined as revenue less operating expenses before impairment of available for sale financial assets, finance income and expenses and share of loss of equity accounted investments.
iv The income tax credit / (charge) substantially relates to overseas taxation and includes exchange gains of $21 million (6 months to 31 March 2014 - exchange gains of $23 million and year ended 30 September 2014 - exchange gains of $42 million) as disclosed in note 5.
v Diluted (loss) / earnings per share is based on the weighted average number of ordinary shares in issue adjusted by dilutive outstanding share options.

36
Consolidated statement of comprehensive income for the 6 months to 31 March 2015
6 months to
31 March 2015
6 months to 31 March
2014
Year ended 30 September
2014 Note $m $m $m Loss for the period (85) (211) (203) Items that may be reclassified subsequently to the income statement
- Changes in fair value of available for sale financial assets 8 (1) (1) (1) - Foreign exchange loss on retranslation of equity accounted investments (4) (2) (3) - Deferred tax on items taken directly to the statement of comprehensive income - 1 - Total other comprehensive expenses for the period (5) (2) (4) Total comprehensive loss for the period (90) (213) (207) Attributable to: - Equity shareholders of Lonmin Plc (84) (204) (192) - Non-controlling interests (6) (9) (15) (90) (213) (207)

37
Consolidated statement of financial position as at 31 March 2015
As at
31 March 2015
As at 31 March
2014
As at 30 September
2014 Note $m $m $m Non-current assets Goodwill 40 40 40 Intangible assets 455 460 457 Property, plant and equipment 2,874 2,891 2,882 Equity accounted investments 28 32 28 Royalty prepayment 11 39 - - Other financial assets 8 25 289 27 3,461 3,712 3,434 Current assets Inventories 496 351 373 Trade and other receivables 11 75 55 76 Tax recoverable 2 1 2 Other financial assets 8 310 - 337 Cash and cash equivalents 9 60 660 143 943 1,067 931 Current liabilities Trade and other payables 11 (215) (166) (244) Interest bearing loans and borrowings 9 (80) (277) (86) Deferred revenue (26) (23) (27) (321) (466) (357) Net current assets 622 601 574 Non-current liabilities Interest bearing loans and borrowings 9 (262) (312) (86) Deferred tax liabilities (342) (431) (376) Deferred royalty payment 11 (4) - - Deferred revenue (14) (37) (23) Provisions (131) (138) (141) (753) (918) (626) Net assets 3,330 3,395 3,382 Capital and reserves Share capital 583 569 570 Share premium 1,448 1,411 1,411 Other reserves 88 88 88 Retained earnings 1,087 1,151 1,164 Attributable to equity shareholders of Lonmin Plc 3,206 3,219 3,233 Attributable to non-controlling interests 124 176 149 Total equity 3,330 3,395 3,382

38
Consolidated statement of changes in equity for the 6 months to 31 March 2015
Equity shareholders' funds
Called up
share capital
$m
Share premium account
$m
Other reserves i
$m
Retained earnings
ii $m
Total $m
Non- controlling interests iii
$m
Total equity
$m At 1 October 2013 569 1,411 88 1,341 3,409 201 3,610 Loss for the period - - - (202) (202) (9) (211) Total other comprehensive expense: - - - (2) (2) - (2) - Change in fair value of available for sale financial assets - - - (1) (1) - (1)
- Foreign exchange loss on retranslation of equity accounted investments - - - (2) (2) - (2)
- Deferred tax on items taken directly to the statement of comprehensive income - - - 1 1 - 1
Transactions with owners, recognised directly in equity: - - - 14 14 (16) (2)
- Share-based payments - - - 14 14 - 14 - Dividends - - - - - (16) (16) At 31 March 2014 569 1,411 88 1,151 3,219 176 3,395 At 1 April 2014 569 1,411 88 1,151 3,219 176 3,395 Profit for the period - - - 14 14 (6) 8 Total other comprehensive expense: - - - (2) (2) - (2) - Foreign exchange loss on retranslation of equity accounted investments - - - (1) (1) - (1)
- Deferred tax on items taken directly to the statement of comprehensive income - - - (1) (1) - (1)
Transactions with owners, recognised directly in equity: 1 - - 1 2 (21) (19)
- Share-based payments - - - 1 1 - 1 - Shares issued on exercise of share options 1 - - - 1 - 1 - Dividends - - - - - (21) (21) At 30 September 2014 570 1,411 88 1,164 3,233 149 3,382

39
Consolidated statement of changes in equity (continued) for the 6 months to 31 March 2015
Equity shareholders' funds
Called up share
capital $m
Share premium account
$m
Other reserves i
$m
Retained earnings
ii $m
Total $m
Non- controlling interests iii
$m
Total equity
$m
At 1 October 2014 570 1,411 88 1,164 3,233 149 3,382 Loss for the period - - - (79) (79) (6) (85) Total other comprehensive expense: - - - (5) (5) - (5) - Change in fair value of available for sale financial assets - - - (1) (1) - (1)
- Foreign exchange loss on retranslation of equity accounted investments - - - (4) (4) - (4)
Transactions with owners, recognised directly in equity: 13 37 - 7 57 (19) 38
- Share-based payments - - - 7 7 - 7 - Share capital and share premium recognised on the BEE transactions iv 13 37 - - 50 - 50
- Dividends - - - - - (19) (19) At 31 March 2015 583 1,448 88 1,087 3,206 124 3,330 Footnotes:
i Other reserves at 31 March 2015 represent the capital redemption reserve of $88 million (31 March 2014 and 30 September 2014 - $88 million).
ii Retained earnings include $3 million of accumulated credits in respect of fair value movements on available for sale financial assets (31 March 2014 - $4 million and 30 September 2014 - $4 million) and a $13 million debit of accumulated exchange on retranslation of equity accounted investments (31 March 2014 - $8 million debit and 30 September 2014 - $9 million debit).
iii Non-controlling interests represent a 13.76% effective shareholding in Eastern Platinum Limited, Western Platinum Limited and Messina Limited and a 19.87% effective shareholding in Akanani Mining (Proprietary) Limited.
iv In December 2014, Lonmin concluded a series of shareholding agreements with the Bapo baMogale Traditional Community (the Bapo) which enabled Lonmin to meet its BEE equity ownership target as required under the Mining Charter. Refer to note 11 for more detail.

40
Consolidated statement of cash flows for the 6 months to 31 March 2015
6 months to
31 March 2015
6 months to 31 March
2014
Year ended 30 September
2014 Note $m $m $m Loss for the period (85) (211) (203) Taxation 5 (33) (67) (123) Share of loss after tax of equity accounted investments 2 2 6 Finance income 4 (16) (25) (44) Finance expenses 4 48 170 108 Impairment of available for sale financial assets 3 - - 1 Non-cash movement on deferred revenue (10) (10) (20) Depreciation, amortisation and impairment 78 69 142 Change in inventories (124) 98 76 Change in trade and other receivables 1 31 7 Change in trade and other payables (31) (129) (51) Change in provisions (15) (6) (14) Share-based payments 7 14 15 Loss on scrapping of property, plant and equipment 3 - - BEE charge 3 13 - - Cash outflow from operations (162) (64) (100) Interest received 3 2 15 Interest and bank fees paid (11) (10) (31) Tax recovered - 1 - Cash outflow from operating activities (170) (71) (116) Cash flow from investing activities Contribution to joint venture (2) - (1) Purchase of property, plant and equipment (64) (45) (91) Purchase of intangible assets (1) (1) (2) Cash outflow from investing activities (67) (46) (94) Cash flow from financing activities Dividends paid to non-controlling interests (19) (16) (37) Proceeds from current borrowings 9 - 395 605 Repayment of current borrowings 9 - (118) (518) Proceeds from non-current borrowings 9 180 312 88 Issue of ordinary share capital - - 1 Cash inflow from financing activities 161 573 139 (Decrease) / increase in cash and cash equivalents 9 (76) 456 (71) Opening cash and cash equivalents 9 143 201 201 Effect of exchange rate changes 9 (7) 3 13 Closing cash and cash equivalents 9 60 660 143

41
Notes to the accounts 1 Statement on accounting policies Basis of preparation Lonmin Plc (the Company) is a Company domiciled in the United Kingdom. The condensed consolidated interim financial statements of the Company as at and for the six months to 31 March 2015 comprise the Company and its subsidiaries (together referred to as the Group) and the Group's interests in equity accounted investments. These condensed consolidated interim financial statements have been prepared in accordance with IAS 34 -‐ Interim Financial Reporting, as adopted by the EU. The annual financial statements of the Group are prepared in accordance with International Financial Reporting Standards (IFRSs), as adopted by the EU. As required by the Disclosure and Transparency Rules of the Financial Conduct Authority, the condensed set of financial statements have been prepared applying the accounting policies and presentation that were applied in the preparation of the Company’s published consolidated financial statements for the year ended 30 September 2014, except as noted below. They do not include all of the information required for full annual financial statements and should be read in conjunction with the consolidated financial statements of the Group for the year ended 30 September 2014. The comparative figures for the financial year ended 30 September 2014 are not the Group's full statutory accounts for that financial year. Those accounts have been reported on by the Group's auditors and delivered to the registrar of companies. The report of the auditors was (i) unqualified, (ii) did not include a reference to any matters to which the auditors drew attention by way of emphasis without qualifying their report, and (iii) did not contain a statement under section 498 (2) or (3) of the Companies Act 2006. The consolidated financial statements of the Group as at and for the year ended 30 September 2014 are available upon request from the Company's registered office at 4 Grosvenor Place, London, SW1X 7YL. These condensed consolidated interim financial statements were approved by the Board of Directors on 8 May 2015. These condensed consolidated interim financial statements apply the accounting policies and presentation that will be applied in the preparation of the Group's published consolidated financial statements for the year ending 30 September 2015. Going concern In determining the appropriate basis of preparation of the financial statements, the Directors are required to consider whether the Group can continue in operational existence for the foreseeable future. The debt facilities currently available to the Group are summarised as follows: - Revolving Credit Facility of $400 million at a Lonmin Plc level maturing in May 2016; and - Three bilateral facilities of R660 million each at Western Platinum Limited (WPL) level each comprising R330 million maturing in June 2016 and R330 million one year committed component that can be rolled annually at the discretion of the bank. The capital structure places the Group in a strong position to ride the normal working capital cycles while providing a buffer to withstand the effects of operational shocks that the business may face. The financial performance of the Group is also dependent upon the wider economic environment in which the Group operates. Factors exist which are outside the control of management which can have a significant impact on the business, specifically, volatility in the Rand / US Dollar exchange rate and PGM commodity prices.
42
Notes to the accounts (continued) 1 Statement on accounting policies (continued) Going concern (continued)
In assessing the Group’s ability to continue as a going concern, the Directors have prepared cash flow forecasts for a period in excess of 12 months. Various scenarios have been considered to test the Group’s resilience against operational risks including:
- Adverse movements in the Rand / US Dollar exchange rate and PGM commodity prices or a combination thereof. - Failure to meet forecast production targets. The Directors have concluded that the Group’s capital structure provides sufficient head room to cushion against downside operational risks and minimises the risk of breaching debt covenants. As a result, the Directors believe that the Group will continue to meet its obligations as they fall due and comply with its financial covenants and accordingly have formed a judgement that it is appropriate to prepare the financial statements on a going concern basis. Therefore, these financial statements do not include any adjustments that would result if the going concern basis on preparation is inappropriate. New standards and amendments in the period The following IFRS’s have been adopted in these condensed consolidated financial statements. The application of these IFRS’s have not had any material impact on the amounts reported for the current and prior periods. - IFRS 10, IFRS 11, IFRS 12 and amendments to IAS 28 regarding Consolidated Financial Statements, Joint Arrangements,
Disclosure of Interests in Other Entities and Investments in Associates and Joint Ventures did not have a material impact on the amounts reported for the current and prior years.
- IAS 32 – Offsetting financial assets and financial liabilities. The amendments clarify when an entity can offset financial assets and financial liabilities.
- IAS 36 – Recoverable amount disclosures on non -‐ financial assets. The amendments reverse the unintended requirement in IFRS 13 Fair Value Measurement to disclose the recoverable amount of every cash-‐generating unit to which significant goodwill or indefinite-‐lived intangible assets have been allocated. Under the amendments, the recoverable amount is required to be disclosed only when an impairment loss has been recognised or reversed.
- IAS 39 Financial Instruments: Recognition and Measurement requires an entity to discontinue hedge accounting if the derivative hedging instrument is novated to a clearing counterparty, unless the hedging instrument is being replaced as part of the entity’s original documented hedging strategy.
- IFRC 21 – Levies. Levies have become more common in recent years, with governments in a number of jurisdictions introducing levies to raise additional income. IFRIC 21 provides guidance on accounting for levies in accordance with IAS 37 Provisions, Contingent Liabilities and Assets.
There were no other new standards, interpretations or amendments to standards issued and effective for the period which materially impacted the Group.
43
Notes to the accounts (continued) 1 Statement on accounting policies (continued) New standards that are relevant to the Group but not yet effective The following new standards, interpretations or amendments to standards were issued, but not yet effective for the period which are not expected to materially impact the Group’s financial statements.
- Investment Entities: Applying the Consolidation Exception (Amendments to IFRS 10, IFRS 12 and IAS 28). The amendment to IFRS 10 Consolidated Financial Statements clarifies which subsidiaries of an investment entity are consolidated instead of being measured at fair value through profit and loss. - Disclosure Initiative (Amendments to IAS 1). The amendments provide additional guidance on the application of materiality and aggregation when preparing financial statements.
2 Segmental analysis The Group distinguishes between three reportable operating segments being the Platinum Group Metals (PGM) Operations segment, the Evaluation segment and the Exploration segment. The PGM Operations segment comprises the activities involved in the mining and processing of PGMs, together with associated base metals, which are carried out entirely in South Africa. These operations are integrated and designed to support the process for extracting and refining PGMs from underground. PGMs move through each stage of the process and undergo successive levels of refinement which result in fully refined metals. The Chief Executive Officer, who performs the role of Chief Operating Decision Maker (CODM), views the PGM Operations segment as a single whole for the purposes of financial performance monitoring and assessment and does not make resource allocations based on margin, costs or cash flows incurred at each separate stage of the process. In addition, the CODM makes his decisions for running the business on a day to day basis using the physical operating statistics generated by the business as these summarise the operating performance of the entire segment. The Evaluation segment covers the evaluation through pre-‐feasibility of the economic viability of newly discovered PGM deposits. Currently all of the evaluation projects are based in South Africa. The Exploration segment covers the activities involved in the discovery or identification of new PGM deposits. This activity occurs on a worldwide basis. No operating segments have been aggregated. Operating segments have consistently adopted the consolidated basis of accounting and there are no differences in measurement applied. Other covers mainly the results and investment activities of the corporate Head Office. The only intersegment transactions involve the provision of funding between segments and any associated interest.

44
Notes to the accounts (continued) 2 Segmental analysis (continued) 6 months to 31 March 2015
PGM Operations
Segment $m
Evaluation Segment
$m
Exploration Segment
$m Other
$m
Intersegment Adjustments
$m Total
$m Revenue (external sales by product):
Platinum 316 - - - - 316 Palladium 97 - - - - 97 Gold 11 - - - - 11 Rhodium 37 - - - - 37 Ruthenium 4 - - - - 4 Iridium 7 - - - - 7 PGMs 472 - - - - 472 Nickel 18 - - - - 18 Copper 5 - - - - 5 Chrome 13 - - - - 13
508 - - - - 508 Underlying i : EBITDA / (LBITDA) ii 16 3 (3) (8) - 8 Depreciation, amortisation and impairment (78) - - - - (78)
Operating (loss) / profit ii (62) 3 (3) (8) - (70) Finance income 6 - - 10 (9) 7 Finance expenses (15) - - (6) 9 (12) Share of loss of equity accounted investments (2) - - - - (2)
(Loss) / profit before taxation (73) 3 (3) (4) - (77) Income tax credit 9 - - - - 9 Underlying (loss) / profit after taxation (64) 3 (3) (4) - (68) Special items (note 3) 11 - - (28) - (17) (Loss) / profit after taxation (53) 3 (3) (32) - (85) Total assets iii 3,864 275 2 1,656 (1,393) 4,404 Total liabilities (2,029) (183) (52) (203) 1,393 (1,074) Net assets / (liabilities) 1,835 92 (50) 1,453 - 3,330 Share of net assets of equity accounted investments 28 - - - -
28
Additions to property, plant, equipment and intangibles 71 - - - -
71
Material non-cash items – share-based payments 7 - - - -
7
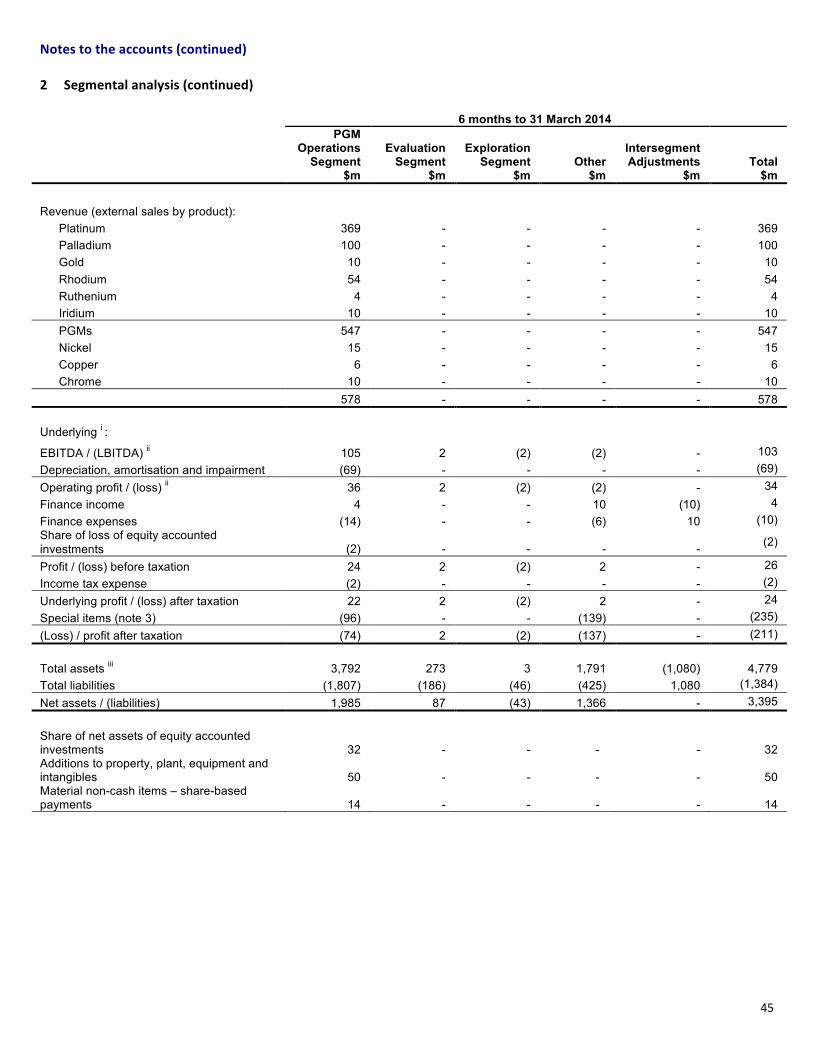
45
Notes to the accounts (continued) 2 Segmental analysis (continued) 6 months to 31 March 2014 PGM
Operations Segment
$m
Evaluation Segment
$m
Exploration Segment
$m Other
$m
Intersegment Adjustments
$m Total
$m Revenue (external sales by product):
Platinum 369 - - - - 369 Palladium 100 - - - - 100 Gold 10 - - - - 10 Rhodium 54 - - - - 54 Ruthenium 4 - - - - 4 Iridium 10 - - - - 10 PGMs 547 - - - - 547 Nickel 15 - - - - 15 Copper 6 - - - - 6 Chrome 10 - - - - 10
578 - - - - 578 Underlying i : EBITDA / (LBITDA) ii 105 2 (2) (2) - 103 Depreciation, amortisation and impairment (69) - - - - (69) Operating profit / (loss) ii 36 2 (2) (2) - 34 Finance income 4 - - 10 (10) 4 Finance expenses (14) - - (6) 10 (10) Share of loss of equity accounted investments (2) - - - - (2)
Profit / (loss) before taxation 24 2 (2) 2 - 26 Income tax expense (2) - - - - (2) Underlying profit / (loss) after taxation 22 2 (2) 2 - 24 Special items (note 3) (96) - - (139) - (235) (Loss) / profit after taxation (74) 2 (2) (137) - (211)
Total assets iii 3,792 273 3 1,791 (1,080) 4,779 Total liabilities (1,807) (186) (46) (425) 1,080 (1,384) Net assets / (liabilities) 1,985 87 (43) 1,366 - 3,395
Share of net assets of equity accounted investments 32 - - - -
32
Additions to property, plant, equipment and intangibles 50 - - - -
50
Material non-cash items – share-based payments 14 - - - -
14

46
Notes to the accounts (continued) 2 Segmental analysis (continued) Year ended 30 September 2014 PGM
Operations Segment
$m
Evaluation Segment
$m
Exploration Segment
$m Other
$m
Intersegment Adjustments
$m Total
$m Revenue (external sales by product):
Platinum 620 - - - - 620 Palladium 165 - - - - 165 Gold 21 - - - - 21 Rhodium 85 - - - - 85 Ruthenium 7 - - - - 7 Iridium 15 - - - - 15 PGMs 913 - - - - 913 Nickel 29 - - - - 29 Copper 10 - - - - 10 Chrome 13 - - - - 13
965 - - - - 965 Underlying i : EBITDA / (LBITDA) ii 204 5 (6) (9) - 194 Depreciation, amortisation and impairment (142) - - - - (142) Operating profit / (loss) ii 62 5 (6) (9) - 52 Finance income 15 - - 21 (10) 26 Finance expenses (19) - - (19) 10 (28) Share of loss of equity accounted investments (4) - - - - (4) Profit / (loss) before taxation 54 5 (6) (7) - 46 Income tax expense (5) - - - - (5) Underlying profit / (loss) after taxation 49 5 (6) (7) - 41 Special items (note 3) (181) - - (63) - (244) (Loss) / profit after taxation (132) 5 (6) (70) - (203) Total assets iii 3,767 277 1 1,546 (1,226) 4,365 Total liabilities (1,940) (185) (48) (36) 1,226 (983) Net assets 1,827 92 (47) 1,510 - 3,382 Share of net assets of equity accounted investments 28 - - - - 28 Additions to property, plant, equipment and intangibles 109 2 - - - 111 Material non-cash items – share-based payments 14 - - 1 - 15

47
Notes to the accounts (continued) 2 Segmental analysis (continued) Revenue by destination is analysed by geographical area below: 6 months to
31 March 2015 $m
6 months to 31 March 2014
$m
Year ended 30 September 2014
$m The Americas 128 91 118 Asia 109 167 247 Europe 166 252 426 South Africa 105 68 174 508 578 965 The Group's revenues are all derived from the PGM Operations segment. This segment has two major customers who contributed 55% ($279 million) and 21% ($107 million) of revenue in the six months to 31 March 2015, 59% ($341 million) and 26% ($150 million) in the six months to 31 March 2014 and 60% ($580 million) and 25% ($241 million) in the year ended 30 September 2014. Metal sales prices are based on market prices which are denominated in US Dollars. The majority of sales are also invoiced in US Dollars with the exception of certain sales in South Africa which are invoiced in South African Rand based on exchange rates determined in accordance with the contractual arrangement. Non-‐current assets (excluding financial instruments) of $3,436 million (31 March 2014 -‐ $3,423 million and 30 September 2014 -‐ $3,407 million) are all situated in South Africa. Footnotes:
i Underlying results are based on reported results excluding the effect of special items as defined in note 3.
ii (LBITDA) / EBITDA and operating (loss) / profit are the key profit measures used by management.
iii The assets under the “Other” segment include the HDSA receivable of $310 million (31 March 2014 - $260 million, 30 September 2014 - $337 million) and intercompany receivables of $1,323 million (31 March 2014 - $1,008 million, 30 September 2014 - $1,226 million).

48
Notes to the accounts (continued) 3 Special items “Special items” are those items of financial performance that the Group believes should be separately disclosed on the face of the consolidated income statement to assist in the understanding of the financial performance achieved by the Group and for consistency with prior periods.
6 months to 31 March
2015
6 months to 31 March
2014
Year ended 30 September
2014
$m $m $m Operating loss: (14) (165) (307) - Strike related costs Idle fixed production costs - (157) (287) Contractors’ costs - (3) (3) Security costs - (4) (10) Other costs 1 - (7) - BEE transaction i BEE charge (13) - - Consulting fees (2) - - - Restructuring and reorganisation costs - (1) - Impairment of available for sale financial assets - - (1) Share of loss of equity accounted investments - - (2) Net finance expenses: (27) (139) (62) - Interest accrued from HDSA receivable ii 9 9 18 - Foreign exchange (loss) / gain on HDSA receivable ii (36) 12 - - Impairment of HDSA receivable ii - (160) (80) Loss on special items before taxation (41) (304) (372) Taxation related to special items (note 5) 24 69 128 Loss before non-controlling interests (17) (235) (244) Non-controlling interests (1) 13 25 Special loss for the period attributable to equity shareholders of Lonmin Plc (18) (222) (219) Footnotes:
i In December 2014, Lonmin concluded a series of shareholding agreements with the Bapo beMogale Traditional Community (the Bapo) which enabled Lonmin to meet its BEE equity ownership target as required under the Mining Charter. This gave rise to a BEE charge of $13 million relating to the premium paid for the Bapo to maintain their shareholding for a period of 10 years. Consulting fees to the amount of $2 million were also incurred in relation to the transaction. Refer to note 11.
ii During the year ended 30 September 2010 the Group provided financing to assist Lexshell 806 Investments (Proprietary) Limited, a subsidiary of Shanduka Resources (Proprietary) Limited (Shanduka) to acquire a majority shareholding in Incwala, Lonmin's Black Economic Empowerment partner. This financing gave rise to foreign exchange movements and the accrual of interest. Refer to note 8 for details regarding the impairment review for the HDSA receivable.
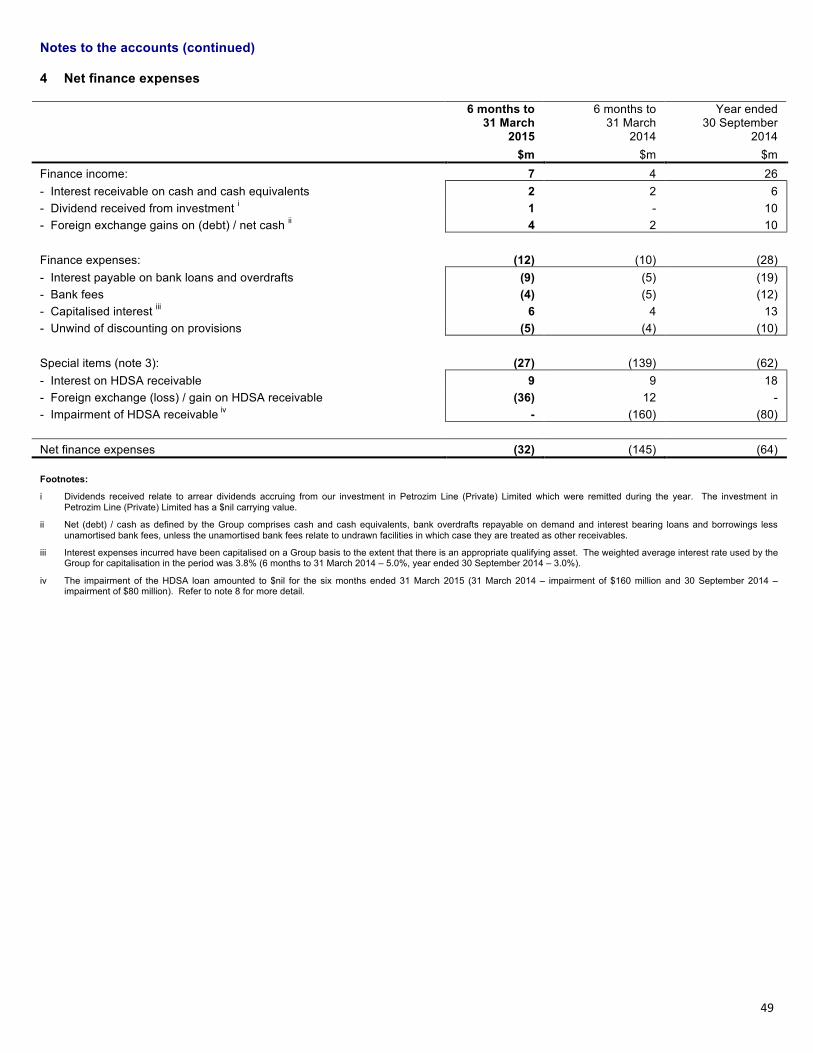
49
Notes to the accounts (continued) 4 Net finance expenses
6 months to 31 March
2015
6 months to 31 March
2014
Year ended 30 September
2014
$m $m $m Finance income: 7 4 26 - Interest receivable on cash and cash equivalents 2 2 6 - Dividend received from investment i 1 - 10 - Foreign exchange gains on (debt) / net cash ii 4 2 10 Finance expenses: (12) (10) (28) - Interest payable on bank loans and overdrafts (9) (5) (19) - Bank fees (4) (5) (12) - Capitalised interest iii 6 4 13 - Unwind of discounting on provisions (5) (4) (10) Special items (note 3): (27) (139) (62) - Interest on HDSA receivable 9 9 18 - Foreign exchange (loss) / gain on HDSA receivable (36) 12 - - Impairment of HDSA receivable iv - (160) (80) Net finance expenses (32) (145) (64) Footnotes:
i Dividends received relate to arrear dividends accruing from our investment in Petrozim Line (Private) Limited which were remitted during the year. The investment in Petrozim Line (Private) Limited has a $nil carrying value.
ii Net (debt) / cash as defined by the Group comprises cash and cash equivalents, bank overdrafts repayable on demand and interest bearing loans and borrowings less unamortised bank fees, unless the unamortised bank fees relate to undrawn facilities in which case they are treated as other receivables.
iii Interest expenses incurred have been capitalised on a Group basis to the extent that there is an appropriate qualifying asset. The weighted average interest rate used by the Group for capitalisation in the period was 3.8% (6 months to 31 March 2014 – 5.0%, year ended 30 September 2014 – 3.0%).
iv The impairment of the HDSA loan amounted to $nil for the six months ended 31 March 2015 (31 March 2014 – impairment of $160 million and 30 September 2014 –impairment of $80 million). Refer to note 8 for more detail.
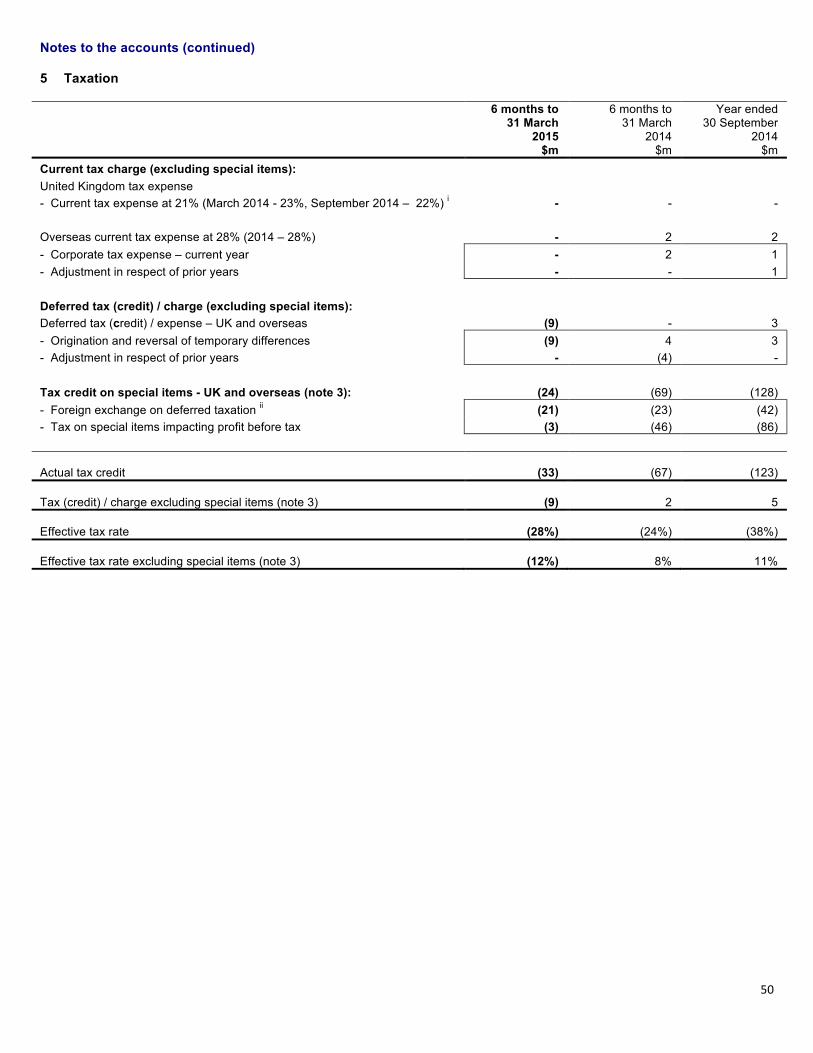
50
Notes to the accounts (continued) 5 Taxation
6 months to 31 March
2015 $m
6 months to 31 March
2014 $m
Year ended 30 September
2014 $m
Current tax charge (excluding special items): United Kingdom tax expense - Current tax expense at 21% (March 2014 - 23%, September 2014 – 22%) i - - - Overseas current tax expense at 28% (2014 – 28%) - 2 2 - Corporate tax expense – current year - 2 1 - Adjustment in respect of prior years - - 1 Deferred tax (credit) / charge (excluding special items): Deferred tax (credit) / expense – UK and overseas (9) - 3 - Origination and reversal of temporary differences (9) 4 3 - Adjustment in respect of prior years - (4) - Tax credit on special items - UK and overseas (note 3): (24) (69) (128) - Foreign exchange on deferred taxation ii (21) (23) (42) - Tax on special items impacting profit before tax (3) (46) (86) Actual tax credit (33) (67) (123) Tax (credit) / charge excluding special items (note 3) (9) 2 5 Effective tax rate (28%) (24%) (38%) Effective tax rate excluding special items (note 3) (12%) 8% 11%
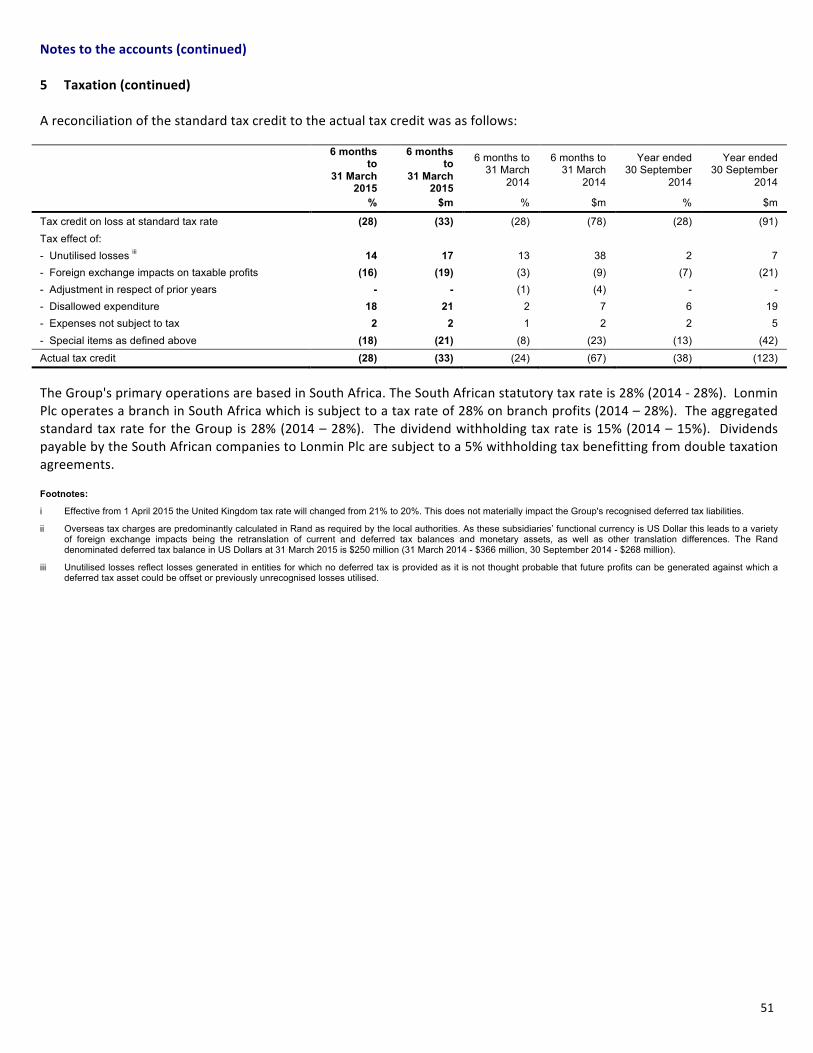
51
Notes to the accounts (continued) 5 Taxation (continued) A reconciliation of the standard tax credit to the actual tax credit was as follows:
6 months
to 31 March
2015
6 months to
31 March 2015
6 months to 31 March
2014
6 months to 31 March
2014
Year ended 30 September
2014
Year ended 30 September
2014
% $m % $m % $m
Tax credit on loss at standard tax rate (28) (33) (28) (78) (28) (91) Tax effect of: - Unutilised losses iii 14 17 13 38 2 7 - Foreign exchange impacts on taxable profits (16) (19) (3) (9) (7) (21) - Adjustment in respect of prior years - - (1) (4) - - - Disallowed expenditure 18 21 2 7 6 19 - Expenses not subject to tax 2 2 1 2 2 5 - Special items as defined above (18) (21) (8) (23) (13) (42)
Actual tax credit (28) (33) (24) (67) (38) (123)
The Group's primary operations are based in South Africa. The South African statutory tax rate is 28% (2014 -‐ 28%). Lonmin Plc operates a branch in South Africa which is subject to a tax rate of 28% on branch profits (2014 – 28%). The aggregated standard tax rate for the Group is 28% (2014 – 28%). The dividend withholding tax rate is 15% (2014 – 15%). Dividends payable by the South African companies to Lonmin Plc are subject to a 5% withholding tax benefitting from double taxation agreements. Footnotes:
i Effective from 1 April 2015 the United Kingdom tax rate will changed from 21% to 20%. This does not materially impact the Group's recognised deferred tax liabilities.
ii Overseas tax charges are predominantly calculated in Rand as required by the local authorities. As these subsidiaries’ functional currency is US Dollar this leads to a variety of foreign exchange impacts being the retranslation of current and deferred tax balances and monetary assets, as well as other translation differences. The Rand denominated deferred tax balance in US Dollars at 31 March 2015 is $250 million (31 March 2014 - $366 million, 30 September 2014 - $268 million).
iii Unutilised losses reflect losses generated in entities for which no deferred tax is provided as it is not thought probable that future profits can be generated against which a deferred tax asset could be offset or previously unrecognised losses utilised.
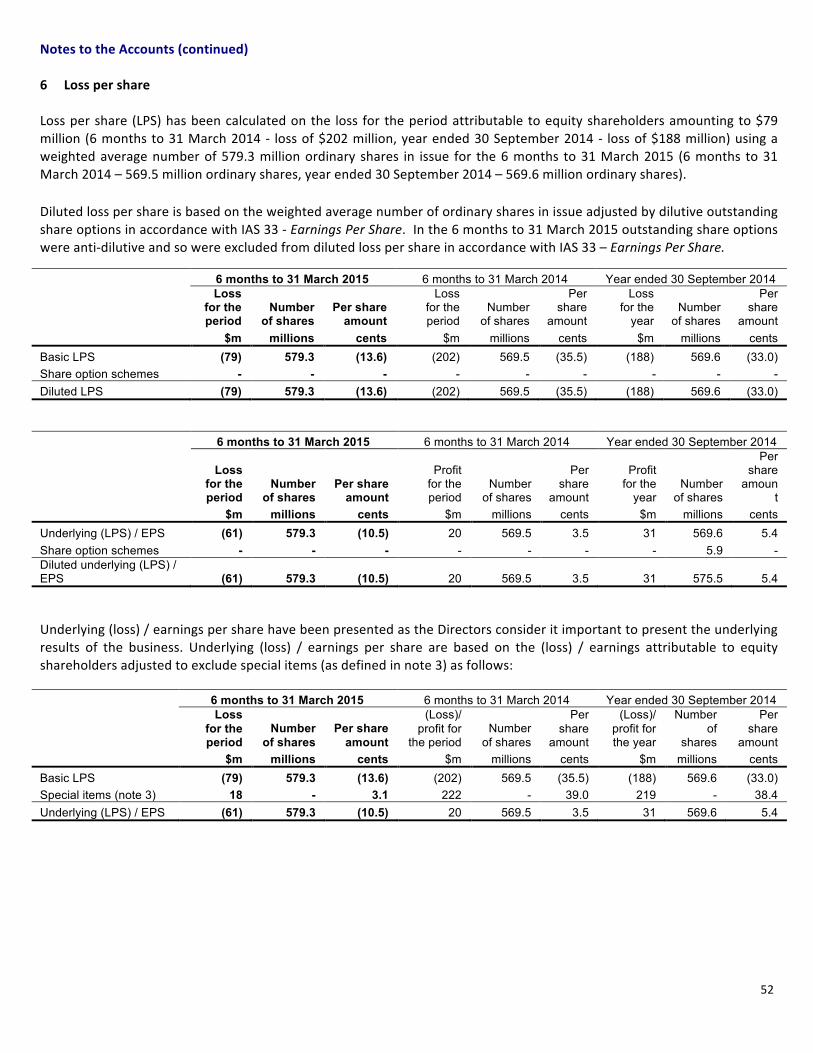
52
Notes to the Accounts (continued) 6 Loss per share Loss per share (LPS) has been calculated on the loss for the period attributable to equity shareholders amounting to $79 million (6 months to 31 March 2014 -‐ loss of $202 million, year ended 30 September 2014 -‐ loss of $188 million) using a weighted average number of 579.3 million ordinary shares in issue for the 6 months to 31 March 2015 (6 months to 31 March 2014 – 569.5 million ordinary shares, year ended 30 September 2014 – 569.6 million ordinary shares). Diluted loss per share is based on the weighted average number of ordinary shares in issue adjusted by dilutive outstanding share options in accordance with IAS 33 -‐ Earnings Per Share. In the 6 months to 31 March 2015 outstanding share options were anti-‐dilutive and so were excluded from diluted loss per share in accordance with IAS 33 – Earnings Per Share. 6 months to 31 March 2015 6 months to 31 March 2014 Year ended 30 September 2014
Loss for the period
Number of shares
Per share amount
Loss for the period
Number of shares
Per share
amount
Loss for the
year Number
of shares
Per share
amount $m millions cents $m millions cents $m millions cents Basic LPS (79) 579.3 (13.6) (202) 569.5 (35.5) (188) 569.6 (33.0) Share option schemes - - - - - - - - - Diluted LPS (79) 579.3 (13.6) (202) 569.5 (35.5) (188) 569.6 (33.0) 6 months to 31 March 2015 6 months to 31 March 2014 Year ended 30 September 2014
Loss for the period
Number of shares
Per share amount
Profit for the period
Number of shares
Per share
amount
Profit for the
year Number
of shares
Per share
amount
$m millions cents $m millions cents $m millions cents Underlying (LPS) / EPS (61) 579.3 (10.5) 20 569.5 3.5 31 569.6 5.4 Share option schemes - - - - - - - 5.9 - Diluted underlying (LPS) / EPS (61) 579.3 (10.5) 20 569.5 3.5 31 575.5 5.4 Underlying (loss) / earnings per share have been presented as the Directors consider it important to present the underlying results of the business. Underlying (loss) / earnings per share are based on the (loss) / earnings attributable to equity shareholders adjusted to exclude special items (as defined in note 3) as follows: 6 months to 31 March 2015 6 months to 31 March 2014 Year ended 30 September 2014
Loss for the period
Number of shares
Per share amount
(Loss)/ profit for
the period Number
of shares
Per share
amount
(Loss)/ profit for the year
Number of
shares
Per share
amount $m millions cents $m millions cents $m millions cents Basic LPS (79) 579.3 (13.6) (202) 569.5 (35.5) (188) 569.6 (33.0) Special items (note 3) 18 - 3.1 222 - 39.0 219 - 38.4 Underlying (LPS) / EPS (61) 579.3 (10.5) 20 569.5 3.5 31 569.6 5.4
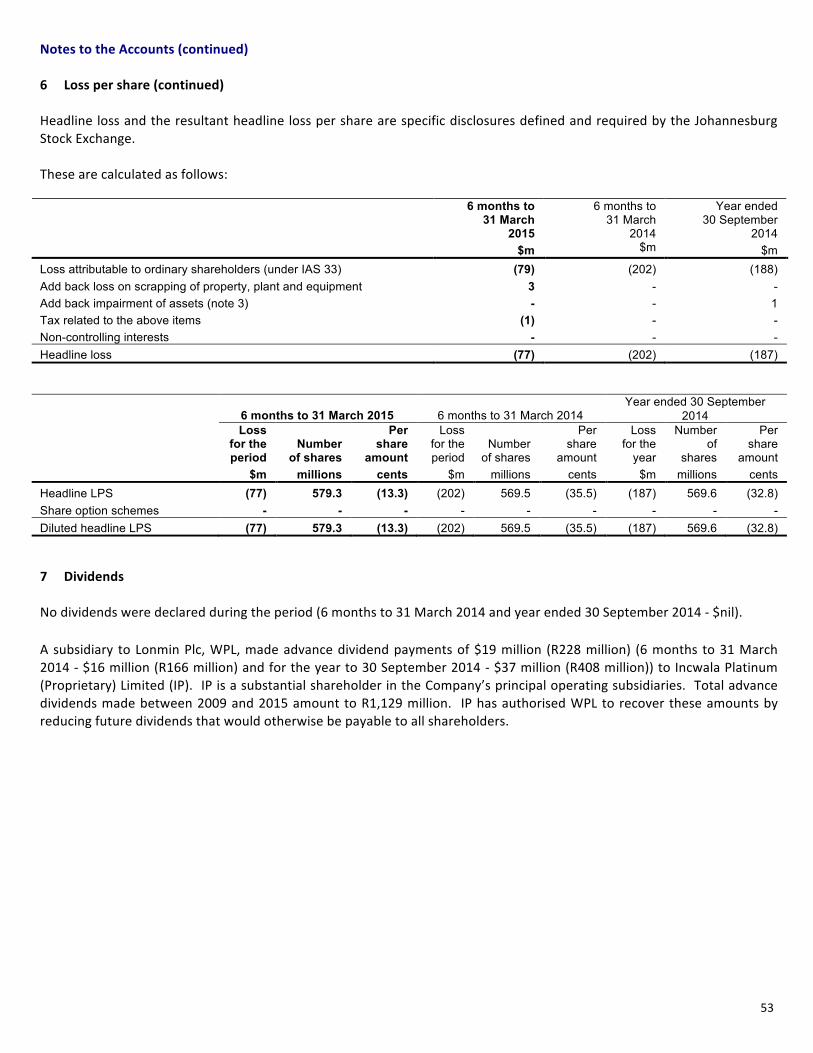
53
Notes to the Accounts (continued) 6 Loss per share (continued) Headline loss and the resultant headline loss per share are specific disclosures defined and required by the Johannesburg Stock Exchange. These are calculated as follows:
6 months to 31 March
2015
6 months to 31 March
2014
Year ended 30 September
2014
$m $m $m Loss attributable to ordinary shareholders (under IAS 33) (79) (202) (188) Add back loss on scrapping of property, plant and equipment 3 - - Add back impairment of assets (note 3) - - 1 Tax related to the above items (1) - - Non-controlling interests - - - Headline loss (77) (202) (187)
6 months to 31 March 2015 6 months to 31 March 2014 Year ended 30 September
2014
Loss for the period
Number of shares
Per share
amount
Loss for the period
Number of shares
Per share
amount
Loss for the
year
Number of
shares
Per share
amount $m millions cents $m millions cents $m millions cents Headline LPS (77) 579.3 (13.3) (202) 569.5 (35.5) (187) 569.6 (32.8) Share option schemes - - - - - - - - - Diluted headline LPS (77) 579.3 (13.3) (202) 569.5 (35.5) (187) 569.6 (32.8) 7 Dividends No dividends were declared during the period (6 months to 31 March 2014 and year ended 30 September 2014 -‐ $nil). A subsidiary to Lonmin Plc, WPL, made advance dividend payments of $19 million (R228 million) (6 months to 31 March 2014 -‐ $16 million (R166 million) and for the year to 30 September 2014 -‐ $37 million (R408 million)) to Incwala Platinum (Proprietary) Limited (IP). IP is a substantial shareholder in the Company’s principal operating subsidiaries. Total advance dividends made between 2009 and 2015 amount to R1,129 million. IP has authorised WPL to recover these amounts by reducing future dividends that would otherwise be payable to all shareholders.

54
Notes to the Accounts (continued) 8 Other financial assets
Restricted
cash Available for
sale HDSA
receivable Total $m $m $m $m
At 1 October 2014 12 15 337 364 Interest accrued - - 9 9 Movement in fair value - (1) - (1) Foreign exchange differences (1) - (36) (37) At 31 March 2015 11 14 310 335
Restricted
cash Available
for sale HDSA
receivable Total $m $m $m $m
At 1 April 2014 13 16 260 289 Interest accrued 1 - 9 10 Foreign exchange differences (2) - (12) (14) Impairment (loss) / reversal - (1) 80 79 At 30 September 2014 12 15 337 364
Restricted
cash Available
for sale HDSA
receivable Total $m $m $m $m
At 1 October 2013 14 17 399 430 Interest accrued - - 9 9 Movement in fair value - (1) - (1) Foreign exchange differences (1) - 12 11 Impairment loss - - (160) (160) At 31 March 2014 13 16 260 289
6 months to 31 March
2015
6 months to 31 March
2014
Year ended 30 September
2014 Current assets Other financial assets 310 - 337 Non-current assets Other financial assets 25 289 27

55
Notes to the Accounts (continued)
8 Other financial assets (continued) Restricted cash deposits are in respect of rehabilitation obligations. Available for sale financial assets include listed investments of $10 million (31 March 2014 -‐ $12 million and 30 September 2014 -‐ $11 million) held at fair value using the market price on 31 March 2015. On 8 July 2010, Lonmin Plc entered into an agreement to provide financing of £200 million to Lexshell 806 Investments (Proprietary) Limited, a subsidiary of Shanduka Resources (Proprietary) Limited, to facilitate the acquisition, at fair value, of 50.03% of shares in Incwala Resources (Proprietary) Limited from the original HDSA shareholders. The terms of the financing provided by Lonmin Plc to the Shanduka subsidiary include the accrual of interest on the HDSA receivable at fixed rates based on a principal value of £200 million which is repayable after 5 years including accrued interest, or earlier at the Shanduka subsidiary’s discretion. The HDSA receivable is repayable on 8 July 2015. The HDSA receivable is secured on shares in the HDSA borrower, Lexshell 806 Investments (Proprietary) Limited, a subsidiary of Shanduka Resources (Proprietary) Limited. The HDSA borrower’s only asset of value is its ultimate shareholding in Incwala. As Incwala’s principal assets are investments in WPL, EPL and Akanani, all subsidiaries of Lonmin Plc, the value in use models for the Marikana and Akanani CGU’s are applied to determine the value of Incwala and in turn, the value of the HDSA borrower (the security). The value of the security is $310 million at 31 March 2015 which is in line with the carrying amount of the HDSA receivable. Key assumptions to the value in use models are described in note 10.

56
Notes to the Accounts (continued) 9 Analysis of net debt i
As at 1 October
2014 Cash flow
Foreign exchange and
non-cash movements
Transfer of unmortised
bank fees to other
receivables
As at 31 March
2015 $m $m $m $m $m
Cash and cash equivalents 143 (76) (7) - 60 Current borrowings (87) - 6 - (81) Non-current borrowings (88) (180) 5 - (263) Unamortised bank fees ii 3 - (1) - 2 Net debt as defined by the Group i (29) (256) 3 - (282)
As at 1 April
2014 Cash flow
Foreign exchange and non-cash
movements
Transfer of unmortised bank
fees to other receivables
As at 30 September
2014 $m $m $m $m $m
Cash and cash equivalents 660 (527) 10 - 143 Current borrowings (277) 190 - - (87) Non-current borrowings (312) 224 - - (88) Unamortised bank fees ii - - - 3 3 Net cash / (debt) as defined by the Group i 71 (113) 10 3 (29)
As at 1 October
2013 Cash flow
Foreign exchange and non-cash
movements
Transfer of unmortised bank
fees to other receivables
As at 31 March
2014 $m $m $m $m $m
Cash and cash equivalents 201 456 3 - 660 Current borrowings - (277) - - (277) Non-current borrowings - (312) - - (312) Net cash as defined by the Groupi 201 (133) 3 - 71 Footnotes:
i Net (debt) / cash as defined by the Group comprises cash and cash equivalents, bank overdrafts repayable on demand and interest bearing loans and borrowings less unamortised bank fees, unless the unamortised bank fees relate to undrawn facilities in which case they are treated as other receivables.
ii As at 31 March 2015 unamortised bank fees of $2 million relating to drawn facilities were offset against net debt (31 March 2014 - $4 million of unamortised bank fees relating to undrawn facilities were included in other receivables, 30 September 2014 - $3 million of unamortised bank fees relating to drawn facilities were offset against net debt).
Bank debt facilities consists of a $400 million syndicated revolving credit US Dollar facility and three South African Rand bilateral facilities of R660 million each. The main features of the $400 million syndicated facility which is supported by BNP Paribas S.A., Citigroup Global Markets Limited, HSBC Bank Plc, J.P. Morgan Limited, Lloyds TSB Bank Plc, The Royal Bank of Scotland N.V. and Standard Chartered Bank are as follows: • a $400 million five-‐year committed revolving credit facility that matures in May 2016; and • the margin on the facility is in the range 300bps to 375bps.
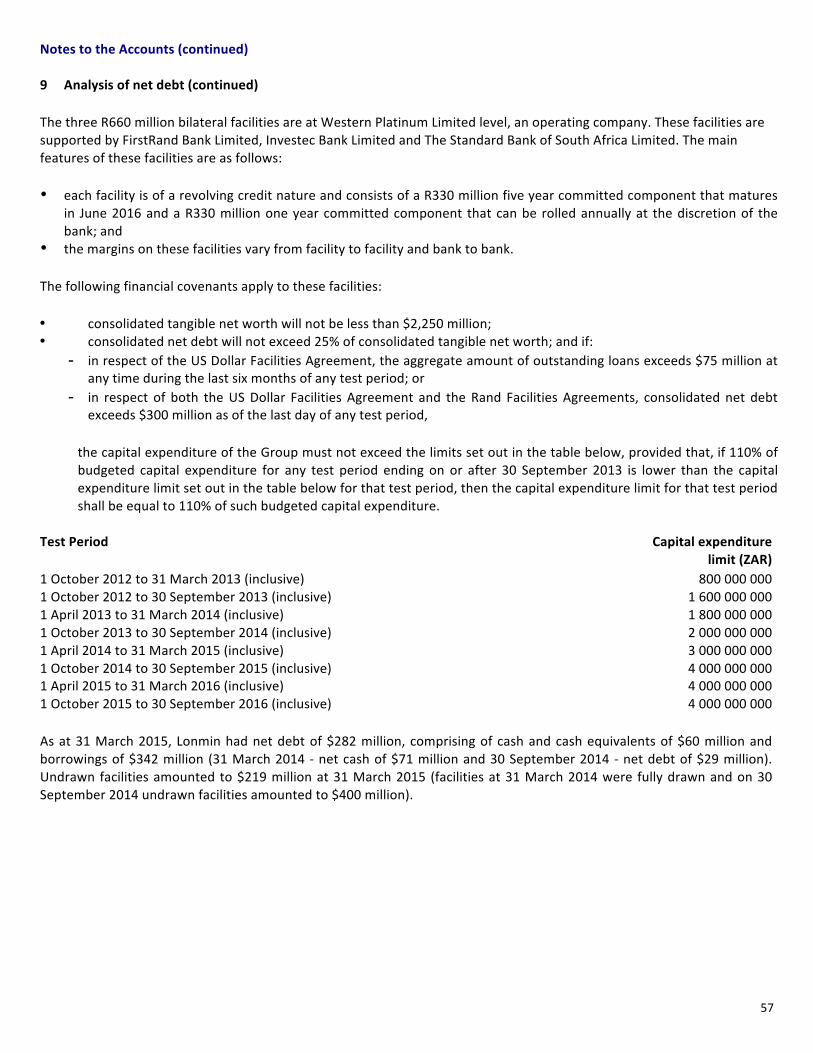
57
Notes to the Accounts (continued) 9 Analysis of net debt (continued) The three R660 million bilateral facilities are at Western Platinum Limited level, an operating company. These facilities are supported by FirstRand Bank Limited, Investec Bank Limited and The Standard Bank of South Africa Limited. The main features of these facilities are as follows: • each facility is of a revolving credit nature and consists of a R330 million five year committed component that matures
in June 2016 and a R330 million one year committed component that can be rolled annually at the discretion of the bank; and
• the margins on these facilities vary from facility to facility and bank to bank. The following financial covenants apply to these facilities: • consolidated tangible net worth will not be less than $2,250 million; • consolidated net debt will not exceed 25% of consolidated tangible net worth; and if:
- in respect of the US Dollar Facilities Agreement, the aggregate amount of outstanding loans exceeds $75 million at any time during the last six months of any test period; or
- in respect of both the US Dollar Facilities Agreement and the Rand Facilities Agreements, consolidated net debt exceeds $300 million as of the last day of any test period,
the capital expenditure of the Group must not exceed the limits set out in the table below, provided that, if 110% of budgeted capital expenditure for any test period ending on or after 30 September 2013 is lower than the capital expenditure limit set out in the table below for that test period, then the capital expenditure limit for that test period shall be equal to 110% of such budgeted capital expenditure.
Test Period Capital expenditure limit (ZAR) 1 October 2012 to 31 March 2013 (inclusive) 800 000 000 1 October 2012 to 30 September 2013 (inclusive) 1 600 000 000 1 April 2013 to 31 March 2014 (inclusive) 1 800 000 000 1 October 2013 to 30 September 2014 (inclusive) 2 000 000 000 1 April 2014 to 31 March 2015 (inclusive) 3 000 000 000 1 October 2014 to 30 September 2015 (inclusive) 4 000 000 000 1 April 2015 to 31 March 2016 (inclusive) 4 000 000 000 1 October 2015 to 30 September 2016 (inclusive) 4 000 000 000 As at 31 March 2015, Lonmin had net debt of $282 million, comprising of cash and cash equivalents of $60 million and borrowings of $342 million (31 March 2014 -‐ net cash of $71 million and 30 September 2014 -‐ net debt of $29 million). Undrawn facilities amounted to $219 million at 31 March 2015 (facilities at 31 March 2014 were fully drawn and on 30 September 2014 undrawn facilities amounted to $400 million).
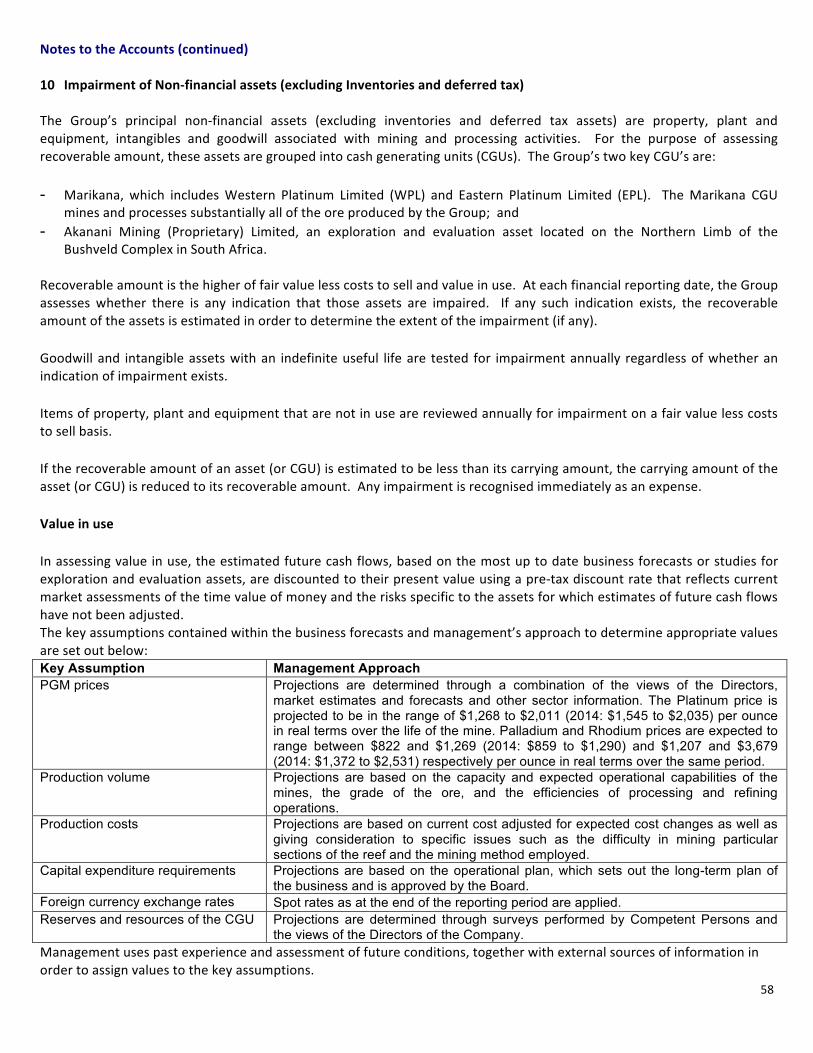
58
Notes to the Accounts (continued) 10 Impairment of Non-‐financial assets (excluding Inventories and deferred tax) The Group’s principal non-‐financial assets (excluding inventories and deferred tax assets) are property, plant and equipment, intangibles and goodwill associated with mining and processing activities. For the purpose of assessing recoverable amount, these assets are grouped into cash generating units (CGUs). The Group’s two key CGU’s are: - Marikana, which includes Western Platinum Limited (WPL) and Eastern Platinum Limited (EPL). The Marikana CGU
mines and processes substantially all of the ore produced by the Group; and - Akanani Mining (Proprietary) Limited, an exploration and evaluation asset located on the Northern Limb of the
Bushveld Complex in South Africa. Recoverable amount is the higher of fair value less costs to sell and value in use. At each financial reporting date, the Group assesses whether there is any indication that those assets are impaired. If any such indication exists, the recoverable amount of the assets is estimated in order to determine the extent of the impairment (if any). Goodwill and intangible assets with an indefinite useful life are tested for impairment annually regardless of whether an indication of impairment exists. Items of property, plant and equipment that are not in use are reviewed annually for impairment on a fair value less costs to sell basis. If the recoverable amount of an asset (or CGU) is estimated to be less than its carrying amount, the carrying amount of the asset (or CGU) is reduced to its recoverable amount. Any impairment is recognised immediately as an expense. Value in use In assessing value in use, the estimated future cash flows, based on the most up to date business forecasts or studies for exploration and evaluation assets, are discounted to their present value using a pre-‐tax discount rate that reflects current market assessments of the time value of money and the risks specific to the assets for which estimates of future cash flows have not been adjusted. The key assumptions contained within the business forecasts and management’s approach to determine appropriate values are set out below: Key Assumption Management Approach PGM prices Projections are determined through a combination of the views of the Directors,
market estimates and forecasts and other sector information. The Platinum price is projected to be in the range of $1,268 to $2,011 (2014: $1,545 to $2,035) per ounce in real terms over the life of the mine. Palladium and Rhodium prices are expected to range between $822 and $1,269 (2014: $859 to $1,290) and $1,207 and $3,679 (2014: $1,372 to $2,531) respectively per ounce in real terms over the same period.
Production volume Projections are based on the capacity and expected operational capabilities of the mines, the grade of the ore, and the efficiencies of processing and refining operations.
Production costs Projections are based on current cost adjusted for expected cost changes as well as giving consideration to specific issues such as the difficulty in mining particular sections of the reef and the mining method employed.
Capital expenditure requirements Projections are based on the operational plan, which sets out the long-term plan of the business and is approved by the Board.
Foreign currency exchange rates Spot rates as at the end of the reporting period are applied. Reserves and resources of the CGU Projections are determined through surveys performed by Competent Persons and
the views of the Directors of the Company. Management uses past experience and assessment of future conditions, together with external sources of information in order to assign values to the key assumptions.

59
Notes to the Accounts (continued) 10 Impairment of Non-‐financial assets (excluding Inventories and deferred tax) (continued) Management has projected cash flows over the life of the relevant mining operation which is significantly greater than 5 years. For the Marikana CGU a life of mine spanning until 2058 was applied. For the Akanani CGU the life of mine spans until 2049. Projecting cash flows over a period longer than 5 years is in line with industry practice and is supported by the Group’s history of the resources expected to be found being proven to exist. Management does not apply a growth rate because a detailed life of mine plan is used to forecast future production volumes. For each CGU a risk-‐adjusted pre-‐tax discount rate is used for impairment testing. The key factors affecting the risk premium applied are the relevant stage of the development of the asset in the CGU (extensions to existing operations having significantly lower risk than evaluation projects for example), the level of knowledge and consistency of the ore body and sovereign risk. The rate applied in the Marikana CGU for 2015 was 11.8% real (31 March 2014 and September 2014 – 11.8% real). The rate applied for the exploration and evaluation asset in the Akanani CGU for 2015 was 16.5% nominal (31 March 2014 – 15.4% and 30 September 2014 – 16.5% nominal). In preparing the financial statements, management has considered whether a reasonably possible change in the key assumptions on which management has based its determination of the recoverable amounts of the CGUs would cause the units’ carrying amounts to exceed their recoverable amounts. For the Marikana CGU management do not believe that a reasonably possible change in any of the key assumptions would lead to impairment. The Akanani CGU was impaired in 2012, and as such a change to any of the key assumptions would lead to further impairment or reversal of the previous impairment. The approximate effects on impairment of the Akanani CGU of movements in the three key assumptions would be as follows:
Assumption Movement in assumption Approximate impact on
carrying amount
Metal prices +/-‐5% $26m / ($39m) ZAR:USD exchange rate -‐/+5% $18m / ($34m) Discount rates +100 basis points $57m / ($58m) Fair value less costs to sell Fair value less costs to sell has been determined by reference to the best information available to reflect the amount that the Group could receive for the CGU in an arm’s length transaction. When comparable market transactions or public valuations of similar assets exist these are used as a source of evidence. However, the Group believes that mining CGUs tend to be unique and have their value determined largely by the nature of the underlying ore body. The fair value therefore is typically determined by calculating the value of the CGU using an appropriate valuation methodology such as calculating the post-‐tax net present value using a discounted cash flow forecast (as described in value in use). Exploration and evaluation assets Under IFRS 6 exploration and evaluation assets are assessed for impairment when facts and circumstances suggest that the carrying amount of the assets may exceed their recoverable amount. When this occurs, any impairment loss is immediately charged to the income statement.

60
Notes to the Accounts (continued) 10 Impairment of Non-‐financial assets (excluding Inventories and deferred tax) (continued) Akanani exploration and evaluation asset The Akanani CGU is currently at prefeasibility study level and value in use calculations for the CGU are calculated using cash flows derived from the results of the latest study. Given the Akanani CGU is at the exploration and evaluation stage it is reasonably possible that the completion of that stage will result in changes to indicated and inferred reserves of PGM ounces and a further refinement of capital and operating expenses. In addition the quantity of resources is also sensitive to the long-‐term metal prices. Adverse changes in reserves and resources, capital and operating expenses, and long-‐term metal prices might cause the recoverable amount to fall below the carrying amount of the CGU. As mentioned above, the Akanani CGU was impaired in 2012, and given any reasonable possible change in assumptions could have an impact on the carrying amount, a formal impairment assessment was performed again at 31 March 2015. Goodwill The recoverable amount of goodwill, as allocated to relevant CGU’s, has been tested for impairment annually, or when such events or changes in circumstances indicate that it may be impaired. Any impairment is recognised immediately in the income statement. Impairment losses within a CGU are allocated first to goodwill and then to reduce the carrying amounts of the other assets in the unit on a pro-‐rata basis.
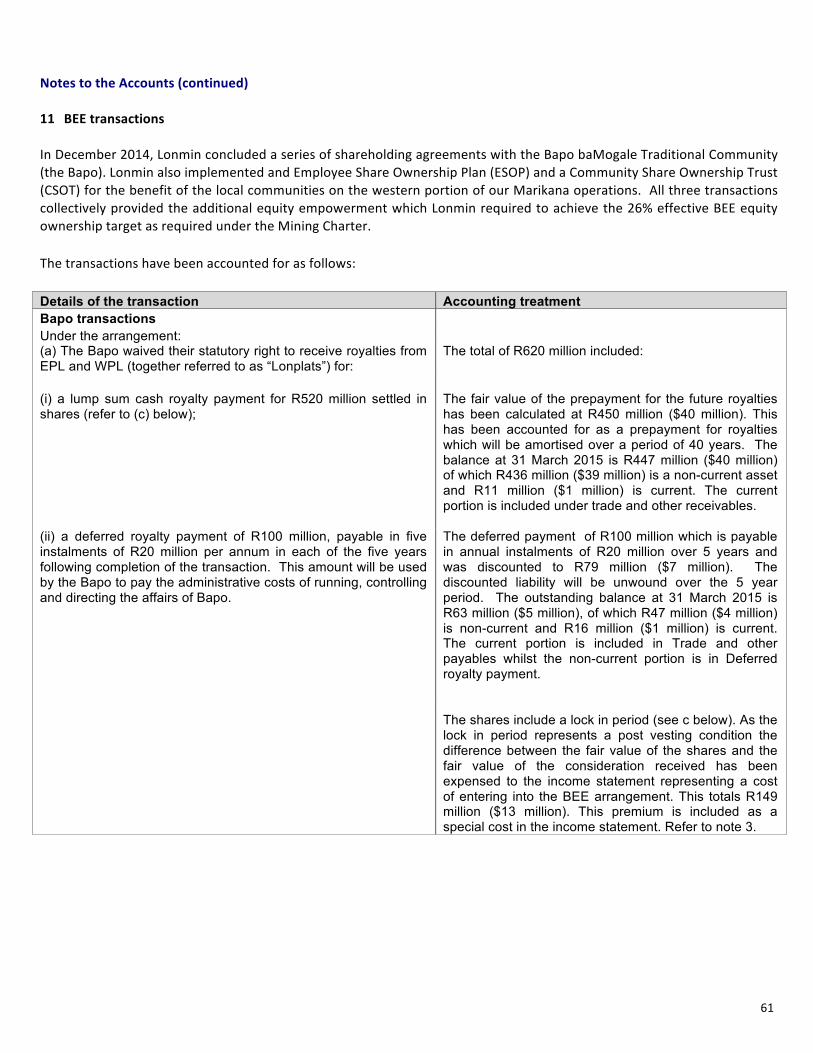
61
Notes to the Accounts (continued) 11 BEE transactions In December 2014, Lonmin concluded a series of shareholding agreements with the Bapo baMogale Traditional Community (the Bapo). Lonmin also implemented and Employee Share Ownership Plan (ESOP) and a Community Share Ownership Trust (CSOT) for the benefit of the local communities on the western portion of our Marikana operations. All three transactions collectively provided the additional equity empowerment which Lonmin required to achieve the 26% effective BEE equity ownership target as required under the Mining Charter. The transactions have been accounted for as follows: Details of the transaction Accounting treatment Bapo transactions Under the arrangement: (a) The Bapo waived their statutory right to receive royalties from EPL and WPL (together referred to as “Lonplats”) for:
The total of R620 million included:
(i) a lump sum cash royalty payment for R520 million settled in shares (refer to (c) below);
The fair value of the prepayment for the future royalties has been calculated at R450 million ($40 million). This has been accounted for as a prepayment for royalties which will be amortised over a period of 40 years. The balance at 31 March 2015 is R447 million ($40 million) of which R436 million ($39 million) is a non-current asset and R11 million ($1 million) is current. The current portion is included under trade and other receivables.
(ii) a deferred royalty payment of R100 million, payable in five instalments of R20 million per annum in each of the five years following completion of the transaction. This amount will be used by the Bapo to pay the administrative costs of running, controlling and directing the affairs of Bapo.
The deferred payment of R100 million which is payable in annual instalments of R20 million over 5 years and was discounted to R79 million ($7 million). The discounted liability will be unwound over the 5 year period. The outstanding balance at 31 March 2015 is R63 million ($5 million), of which R47 million ($4 million) is non-current and R16 million ($1 million) is current. The current portion is included in Trade and other payables whilst the non-current portion is in Deferred royalty payment.
The shares include a lock in period (see c below). As the lock in period represents a post vesting condition the difference between the fair value of the shares and the fair value of the consideration received has been expensed to the income statement representing a cost of entering into the BEE arrangement. This totals R149 million ($13 million). This premium is included as a special cost in the income statement. Refer to note 3.
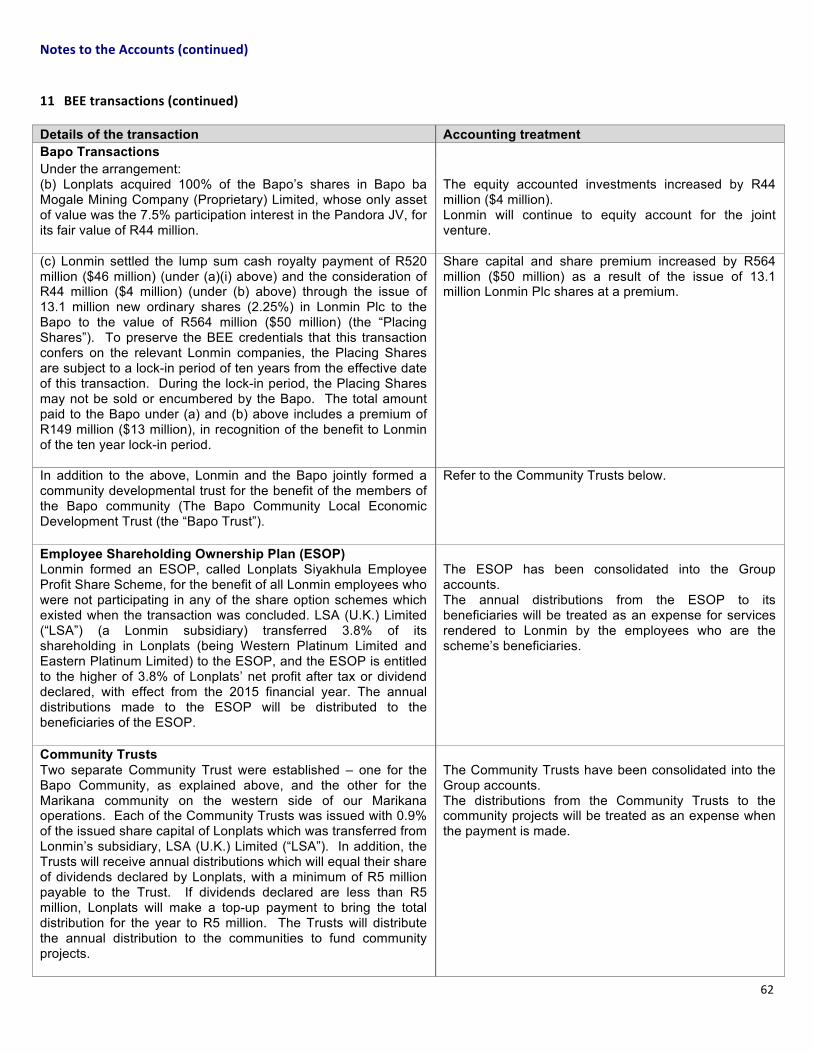
62
Notes to the Accounts (continued)
11 BEE transactions (continued) Details of the transaction Accounting treatment Bapo Transactions Under the arrangement: (b) Lonplats acquired 100% of the Bapo’s shares in Bapo ba Mogale Mining Company (Proprietary) Limited, whose only asset of value was the 7.5% participation interest in the Pandora JV, for its fair value of R44 million.
The equity accounted investments increased by R44 million ($4 million). Lonmin will continue to equity account for the joint venture.
(c) Lonmin settled the lump sum cash royalty payment of R520 million ($46 million) (under (a)(i) above) and the consideration of R44 million ($4 million) (under (b) above) through the issue of 13.1 million new ordinary shares (2.25%) in Lonmin Plc to the Bapo to the value of R564 million ($50 million) (the “Placing Shares”). To preserve the BEE credentials that this transaction confers on the relevant Lonmin companies, the Placing Shares are subject to a lock-in period of ten years from the effective date of this transaction. During the lock-in period, the Placing Shares may not be sold or encumbered by the Bapo. The total amount paid to the Bapo under (a) and (b) above includes a premium of R149 million ($13 million), in recognition of the benefit to Lonmin of the ten year lock-in period.
Share capital and share premium increased by R564 million ($50 million) as a result of the issue of 13.1 million Lonmin Plc shares at a premium.
In addition to the above, Lonmin and the Bapo jointly formed a community developmental trust for the benefit of the members of the Bapo community (The Bapo Community Local Economic Development Trust (the “Bapo Trust”).
Refer to the Community Trusts below.
Employee Shareholding Ownership Plan (ESOP) Lonmin formed an ESOP, called Lonplats Siyakhula Employee Profit Share Scheme, for the benefit of all Lonmin employees who were not participating in any of the share option schemes which existed when the transaction was concluded. LSA (U.K.) Limited (“LSA”) (a Lonmin subsidiary) transferred 3.8% of its shareholding in Lonplats (being Western Platinum Limited and Eastern Platinum Limited) to the ESOP, and the ESOP is entitled to the higher of 3.8% of Lonplats’ net profit after tax or dividend declared, with effect from the 2015 financial year. The annual distributions made to the ESOP will be distributed to the beneficiaries of the ESOP.
The ESOP has been consolidated into the Group accounts. The annual distributions from the ESOP to its beneficiaries will be treated as an expense for services rendered to Lonmin by the employees who are the scheme’s beneficiaries.
Community Trusts Two separate Community Trust were established – one for the Bapo Community, as explained above, and the other for the Marikana community on the western side of our Marikana operations. Each of the Community Trusts was issued with 0.9% of the issued share capital of Lonplats which was transferred from Lonmin’s subsidiary, LSA (U.K.) Limited (“LSA”). In addition, the Trusts will receive annual distributions which will equal their share of dividends declared by Lonplats, with a minimum of R5 million payable to the Trust. If dividends declared are less than R5 million, Lonplats will make a top-up payment to bring the total distribution for the year to R5 million. The Trusts will distribute the annual distribution to the communities to fund community projects.
The Community Trusts have been consolidated into the Group accounts. The distributions from the Community Trusts to the community projects will be treated as an expense when the payment is made.
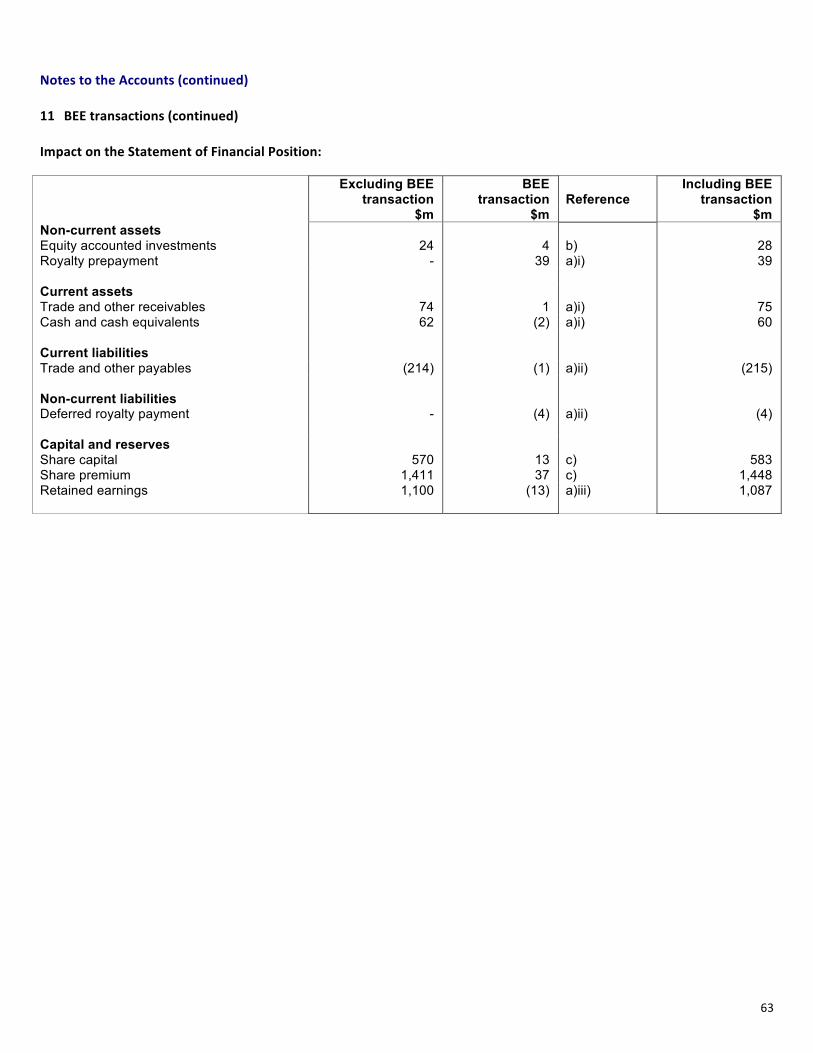
63
Notes to the Accounts (continued) 11 BEE transactions (continued) Impact on the Statement of Financial Position: Excluding BEE
transaction BEE
transaction Reference
Including BEE transaction
$m $m $m Non-current assets Equity accounted investments 24 4 b) 28 Royalty prepayment - 39 a)i) 39 Current assets Trade and other receivables 74 1 a)i) 75 Cash and cash equivalents 62 (2) a)i) 60 Current liabilities Trade and other payables (214) (1) a)ii) (215) Non-current liabilities Deferred royalty payment - (4) a)ii) (4) Capital and reserves Share capital 570 13 c) 583 Share premium 1,411 37 c) 1,448 Retained earnings 1,100 (13) a)iii) 1,087