major time-use survey results of the korean people in...
TRANSCRIPT

142
언론정보연구
48권 2호, 2011년, 142∼180http://icr.snu.ac.kr/jcr
서울대학교 언론정보연구소
* This paper was presented at IATUR 2011 Conference in Oxford, UK(August 1-
3, 2011) and revised.
** correspondent author
Major Time-Use Survey Results of the Korean People in 2010 and Changes during the Industrialization Period*
Kwang Yung ChooProfessor Emeritus, Dept. of Communication, Seoul National [email protected]
Jae-Hyun LeeProfessor, Dept. of Communication, Seoul National [email protected]
Chong-Hyun Song**Assistant Professor, School of Communication, Sunmoon University
This paper is firstly to present the latest time-use survey results of the Korean people as revealed in the 2010 national survey. The survey was done during the middle of October 2010 utilizing a national sample of 3,500 people over ten years of age. The results of the data analysis have revealed some significant changes since the immediately previous 2005 survey. But the more interesting changes are revealed since the first survey in 1981. Thus the second purpose of the paper is to trace the people’s time-use paternal changes during the country’s 30-year of industrialization. The time series data accumulated during the 30-year
143
period of industrialization vividly expose the people’s time-use patterns, and show how the Western life-style with more leisure and self realization activities had become a trend in Korea with the nation’s industrialization.
K E Y W O R D S Time-use pattern • Time-series data • Industrialization • Informatization
1. Introduction
1) Time Use Studies in Korea
The first time-use study in Korea was initiated by Korean Broadcasting System (KBS) in 1981, and it has regularly been conducted ever since. The corporation recognized the importance of the data on people’s time use for many fields of government and academic research as well as their own programming purposes. And, thus, KBS started their nationwide survey as a public service to make these data available to the general public.
Nine surveys have so far been carried out since the launching, basically once every five years, with the latest one in October 2010. A vast amount of time-series data on Korean people’s time-use behavior, as a result, has been accumulated during the last 30 years. The data are very widely utilized not only by KBS for its programming, but also by numerous academic researchers and policy makers in governmental agencies and industries in the fields of economics, transportation, leisure, advertising, gender research and the like to mention only a few.
These surveys have been, from the start, commissioned to and actually carried out by the Institute of Communication

144
Research (ICR) of Seoul National University to utilize their research expertise and save much of manpower and budget for KBS who has provided the entire funds for all the surveys from its launching. The KBS surveys have also been conducted in close coordination with Japan’s NHK. Both KBS and NHK are the biggest and most prestigious broadcasters in their respective countries and have been maintaining a close cooperative relationship since 1981. They are conducting their surveys during the same period of time every five years to facilitate international comparisons afterwards.
In addition to the KBS study, Korea’s National Statistical Bureau (Statistics Korea), a government agency, also started its own nationwide time use survey in 1999, and has conducted three surveys thus far. While KBS is more interested in collecting data on the uses of various communication media including radio, TV, newspaper, magazine and the most recent new media including the Internet, mobile phones, DMB, IPTV, SNS and the like, Statistics Korea is more concerned about economic activities of the people. They have so far conducted three surveys, once every five years, with the latest one in 2009. Being a government agency, the bureau has much bigger budget and sample sizes. Even though their time use survey began only 11 years ago, it has been established as a regular and important on-going project at the bureau.
This paper is to summarize and present some of the major results of the 2010 survey by KBS and to trace and analyze a few important changes of the Korean people’s time-use patterns since 1981. Time use data are found to be very useful indices of Korea’s profound social change during this period. The data are widely acknowledged as the most extensive and consistent time-series data on people’s time use behaviors in Korea, with the same size samples and identical survey methods since the beginning.

145
2) Outline of the 2010 Survey
(1) Survey Contents
The 2010 survey was especially interested in finding out the change in people’s time use behaviors with the introduction and settling down of the five-day workweek in Korea since the beginning of the 21st Century. Like all the previous surveys, the 2010 survey also was to obtain some pertinent data basically on the following two aspects of people’s time use.
① Amount of time for various activities.National averages of time people spend for various daily activities such as sleep, work, meals, sports, leisure, media uses and so forth in a day were measured. This was to tabulate what people do with their twenty-four hours of time. This was measured during a weekday as well as Saturday and Sunday.
② Temporal locations / Timing of activitiesThis was to measure the percentages of the people engaged in specific activities at a given time of day. That is, the timing for various activities was measured at 15-minute intervals to find out when people do what they do. For example, the percentages of the people sleeping, moving, watching TV or engaged in other activities were all accounted for at specific points of time each day. This would reveal the composition of people’s activities on each time point.
(2) Survey Period
The 2010 survey was conducted during the period of Oct. 16 (Sat.) -Oct. 18 (Mon.), 2010. Due to some budgetary constraints, only three days were chosen to represent both the weekend (Saturday and Sunday) and a weekday (Monday).

146
Until 1995, Fridays were chosen to represent a weekday. But since 2000, Monday was selected instead because Friday was fast becoming a part of the weekend these days.
(3) Sample and Sampling
A sample of 3,500 people was taken to represent the population of people over 10 years of age and older using a multi-step stratified quota sampling method. Using the country’s latest census data, 100 sampling points throughout the country were first selected according to their population sizes, provincial locations and community types. A professional opinion pollster (Korea Research Center) was employed to actually administer the diaries and collect the data in accordance with the design and method preplanned by KBS and ICR.
In each of the 100 sampling points, an interviewer was dispatched to assist the respondents and administer the diaries. In conducting the survey, a set of survey materials, consisted of a cover letter, a diary sheet for three days and instructions as well as a questionnaire to collect various socio-economic data, was used for each respondent.
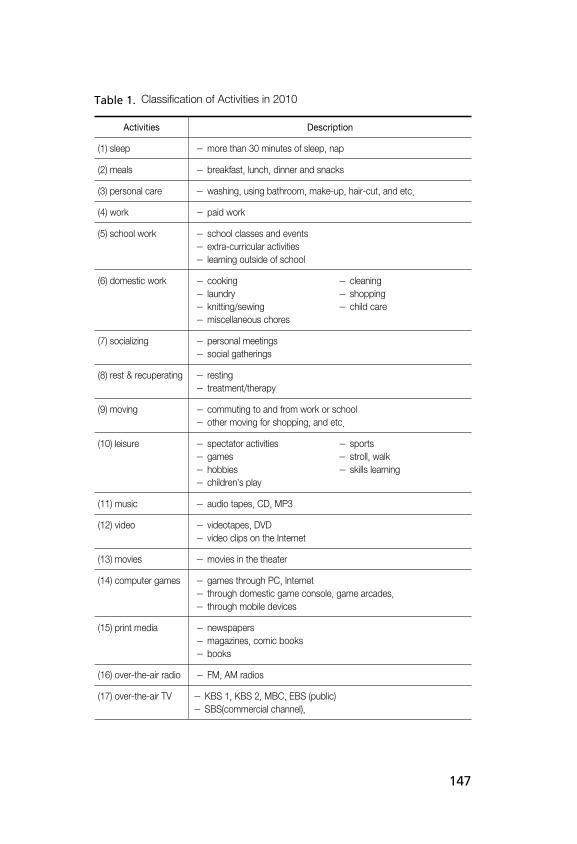
(4) Classification of Activities
People’s various daily activities were classified according to the following categories. The 2010 survey has revised the categorical system remarkably to accommodate the recent communications media uses. In 2000, new types of broadcasting, such as DBS and CATV, PC communication and the Internet were added to the previous categories in order to tabulate the so-called “new media” uses. In 2005, PC communication was collapsed with the Internet. In addition to these, mobile SMS was added to tabulate the increasing use of short message sending through mobile phones, particularly among the younger generations.
147
Activities Description
(1) sleep - more than 30 minutes of sleep, nap
(2) meals - breakfast, lunch, dinner and snacks
(3) personal care - washing, using bathroom, make-up, hair-cut, and etc.
(4) work - paid work
(5) school work - school classes and events - extra-curricular activities - learning outside of school
(6) domestic work - cooking - cleaning - laundry - shopping - knitting/sewing - child care - miscellaneous chores
(7) socializing - personal meetings - social gatherings
(8) rest & recuperating - resting - treatment/therapy
(9) moving - commuting to and from work or school - other moving for shopping, and etc.
(10) leisure - spectator activities - sports - games - stroll, walk - hobbies - skills learning - children’s play
(11) music - audio tapes, CD, MP3
(12) video - videotapes, DVD - video clips on the Internet
(13) movies - movies in the theater
(14) computer games - games through PC, Internet - through domestic game console, game arcades, - through mobile devices
(15) print media - newspapers - magazines, comic books - books
(16) over-the-air radio - FM, AM radios
(17) over-the-air TV - KBS 1, KBS 2, MBC, EBS (public)
- SBS(commercial channel),
Table 1. Classification of Activities in 2010

148
Activities Description
(18) pay TV - (digital) cable TV - (digital) satellite broadcasting - Internet Protocol Television - Digital Multimedia Broadcasting (DMB)
(19) Internet - search information - entertainment - communication - online shopping or transactions
(20) cell phone, - voice call, SMS, mobile Internet
* Items 10-20 were rearranged in more details to account for various new media uses.
In 2010, the new media were again more specifically classified to account for various new services that are relevant for KBS, the broadcaster, and, thus, media uses were separated from the general “leisure” or free-time activities and classified as several individual categories. Leisure in 2010 mainly is consisted of various outdoor free-time activities, and it excludes, unlike the previous surveys, the media use behaviors including TV watching. The following table shows these modifications.
(5) Analysis
The collected data from 3,428 people were coded and analyzed using a special software program developed specifically for this survey. The data were processed to generate the amount of time for specific activities as well as the timing for each activity every 15 minutes. These data were, in turn, cross-tabulated per various socio-economic variables of the respondents. In coding and analyzing the data, some concurrent activities on a given time, especially the various media uses such as TV viewing and radio listening while engaged in some other activities, were both counted as valid dual activities because of the difficulty in

149
distinguishing the main activity from the secondary activity and the relevance of the data for KBS, a broadcaster.
Out of 3,500 diaries, 72 diaries had been deleted for inaccuracies or the lack of information. That is, the final analyses were carried out with 3.428 diaries.
2. Major Results of the 2010 Survey
To briefly summarize the major results of the 2010 survey, the national averages of time people spent for various activities are given in < table 2>. The table gives the means of time spent for major activities by the Korean people in 2010 together with the 2000 and 2005 data for comparisons. The table reveals the following two key trends of change in the first decade of the 21stCentury.
1) Changes After Five-day Workweek
As the country’s economy has grown enormously during the last four decades since the 1970s, Korea is gradually turning into a five-day workweek society since the beginning of the New Millennium. Korean people used to work on Saturday mornings, but presently, except for a few private and small industries and service businesses, most of the public sectors including the government offices and major industries are closed on Saturdays. Schools are currently closed every other Saturdays, but they will also adopt the five-day week from 2012.
This shift is being accelerated as the country is fully industrialized and the whole society is rapidly adjusting to the 40 hour-work week. As a result, this social re-adjustment has expectedly brought about many significant and profound

150
Activities
Mon
day
Saturday
Sunday
2000
2005
2010
change
2000
2005
2010
change
2000
2005
2010
change
Sle
epin
g7/
357/
387/
33-
057/
407/
517/
57 0
68/
388/
408/
48 0
8
Mea
ls1/
461/
481/
5002
1/44
1/47
1/53
06
1/49
1/51
1/5
5 0
4
Per
sona
l Car
e0/
501/
001/
10 1
00/
531/
031/
12 0
91/
011/
07 1
/15
08
Wor
k4/
324/
504/
35 -
153/
553/
493/
18 -
311/
431/
47 1
/33
-14
Dom
estic
Wor
k1/
351/
311/
22 -
091/
391/
391/
30 -
091/
351/
41 1
/28
-13
Soc
ializ
ing
0/45
0/41
0/36
-05
1/05
1/03
0/57
-06
1/32
1/27
1/1
4 -
13
R &
R0/
370/
380/
23 -
130/
350/
390/
28-
060/
360/
39 0
/34
-03
Mov
ing
1/14
1/17
1/19
021/
221/
241/
22 0
21/
141/
24 1
/15
-09
Leis
ure
0/34
1/00
0/40
-20
0/48
1/07
1/03
-04
1/
161/
35 1
/25
-10
Mus
ic0/
020/
060/
0802
0/02
0/06
0/08
02
0/02
0/05
0/0
702
Vide
o0/
010/
000/
0101
0/02
0/01
0/02
01
0/04
0/01
0/0
302
Mov
ies
0/00
0/00
0/00
00
0/01
0/03
0/03
00
0/02
0/03
0/0
2-
01
Com
pute
r G
ame
0/ 0
50/
130/
07 -
060/
120/
230/
15 -
080/
150/
260/
16-
10
Prin
t Med
ia0/
130/
100/
1000
0/14
0/11
0/10
-01
0/16
0/10
0/1
000
Tab
le 2
.B
reak
dow
n of M
ajor
Dai
ly A
ctiv
ities
(nat
iona
l ave
rages
)(u
nit: h
our
/min
ute)

151
Activities
Mon
day
Saturday
Sunday
2000
2005
2010
change
2000
2005
2010
change
2000
2005
2010
change
Rad
io0/
120/
180/
09 -
090/
110/
180/
08 -
100/
090/
12 0
/04
-08
TV2/
242/
091/
46 -
232/
522/
362/
09 -
273/
463/
14 2
/49
-25
Pay
TV
0/09
0/14
0/23
090/
100/
180/
31 1
30/
080/
19 0
/33
14
Inte
rnet
0/11
0/12
0/37
250/
140/
130/
39 2
60/
150/
150/
3722
Cel
l Pho
ne-
0/02
0/25
23-
0/03
0/24
21-
0/03
0/19
16
Tim
e at
Hom
e13
/44
13/3
213
/28
-04
14/2
514
/28
14/5
123
16/3
316
/07
16/4
437
* “
Chan
ge”
den
ote
s th
e diffe
rence
bet
wee
n the
2005
and 2
010
aver
ages
. “T
V”
is ter
rest
rial
tel
evis
ion o
nly
. “L
eisu
re”
excl
udes
indoor
med
ia u
ses,
and m
ainly
consi
sts
of
outd
oor
free
-tim
e ac
tiviti
es.
152
changes in the people’s lives in general, and this is reflected specifically in their time use patterns.
The five-day workweek, widely taking roots in the society, is believed to have brought about the following changes in time use behaviors of the people.
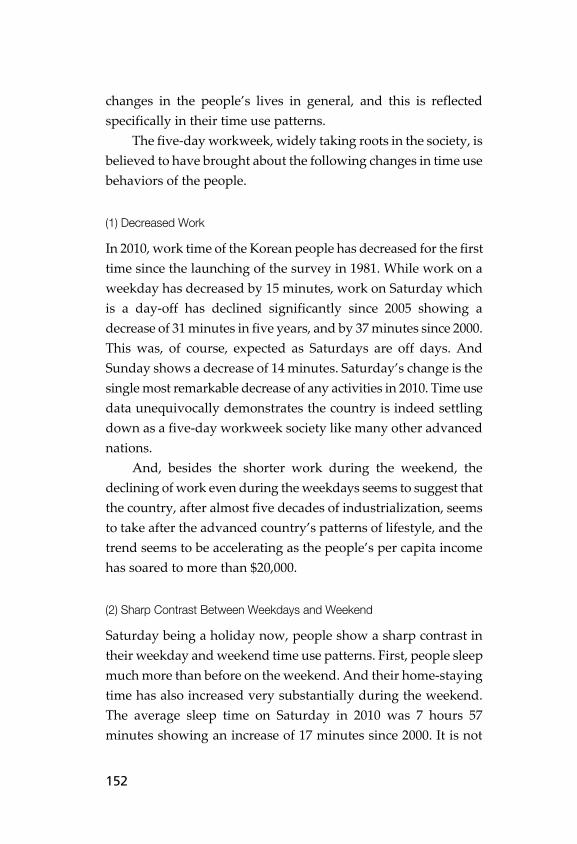
(1) Decreased Work
In 2010, work time of the Korean people has decreased for the first time since the launching of the survey in 1981. While work on a weekday has decreased by 15 minutes, work on Saturday which is a day-off has declined significantly since 2005 showing a decrease of 31 minutes in five years, and by 37 minutes since 2000. This was, of course, expected as Saturdays are off days. And Sunday shows a decrease of 14 minutes. Saturday’s change is the single most remarkable decrease of any activities in 2010. Time use data unequivocally demonstrates the country is indeed settling down as a five-day workweek society like many other advanced nations.
And, besides the shorter work during the weekend, the declining of work even during the weekdays seems to suggest that the country, after almost five decades of industrialization, seems to take after the advanced country’s patterns of lifestyle, and the trend seems to be accelerating as the people’s per capita income has soared to more than $20,000.
(2) Sharp Contrast Between Weekdays and Weekend
Saturday being a holiday now, people show a sharp contrast in their weekday and weekend time use patterns. First, people sleep much more than before on the weekend. And their home-staying time has also increased very substantially during the weekend. The average sleep time on Saturday in 2010 was 7 hours 57 minutes showing an increase of 17 minutes since 2000. It is not

153
surprising at all to find the people sleep much more during the weekend, but it is quite remarkable to notice that the differences between a weekday and a Saturday or a Sunday have become much bigger. Korean people in 2000, on the average, slept 7 hours 35 minutes on Saturday and 8 hours 38 minutes on Sunday. Whereas, in 2010, while a weekday does not show much change (-2 minutes) from 2005, Saturday and Sunday show big increases of sleep time by 17 minutes and 10 minutes, respectively since 2000.
People’s home-staying time during the weekend has increased substantially as well. People were found to stay 23 minutes more at home on Saturday and 37 minutes longer on Sunday than five years ago. This, of course, seems to be a natural result of the five-day workweek with less work during the weekend.
(3) Shifts in Leisure and Socializing Time
Time for leisure in 2010 has declined by 20-minutes on a weekday, and 4 minutes and 10 minutes on Saturday and Sunday, respectively. But this seemingly substantial decrease is due to the fact that music listening, movies, video tape watching and computer games are separated from this category in 2010 in order to measure these media uses more specifically. When the combined time for these activities is considered, the decrease of leisure is only about 4 to 7 minutes each day.
However, this is to be noticed. In 2005, the Korean people’ leisure time showed the largest increase among all activities. Leisure time increased by 35 minutes (weekday), 25 minutes (Saturday) and 21 minutes (Sunday) in five years suggesting a significant lifestyle change of the people during the period. People were found to spend more time for “active leisure” which is an end in itself for self-realization (Choo, 2002).

154
Thus, in 2010, it seems that people have reached the peak in their leisure time.
Time for socializing also shows substantial decreases in 2010. It is 5 minutes less (Weekday), 6 minutes less (Saturday) and 13 minutes less (Sunday) than the 2005 averages. This also tells an important lifestyle change. The net decreases of combined time of leisure, computer games and socializing amounts to 31 minutes on a weekday, 18 minutes on Saturday and 33 minutes on Sunday. The big decrease in free-time activities is totally unexpected as it was believed that people would be spending more time for leisure and games when they have Saturdays off.
In this regard, a question arises as to why people spend less time for their leisure and socializing while they have more free time on Saturdays. These changes in leisure and socializing are believed to be related mainly to the surge of the “new media” use during this period which will be delved into further in the ensuing pages.
2) Waning of Television and Surge of New Media
(1) Television’s Decline
Another significant change during the 5-year period since 2005 is found in people’s TV watching patterns. The average of TV watching time has fallen by 23 minutes on a weekday, by 27 minutes on Saturday, and another 25 minutes on Sunday since 2005. Even though TV watching is still the most popular pastime of the Korean people and comprises the biggest free time activity (106 minutes on a weekday, 129 minutes on Saturday and 169 minutes on Sunday), the decrease is very substantial.
TV watching has been decreasing slightly since 1995, but the trend seems to have been accelerated even faster during the last ten years since 2000. This is quite different from the trend of Japan
155
where TV watching is increasing steadily as the country has become an aging society with the older people watching more television than before (Nakano, 2006). This also seems to be closely related to the recent surge of the new media as will be further discussed.
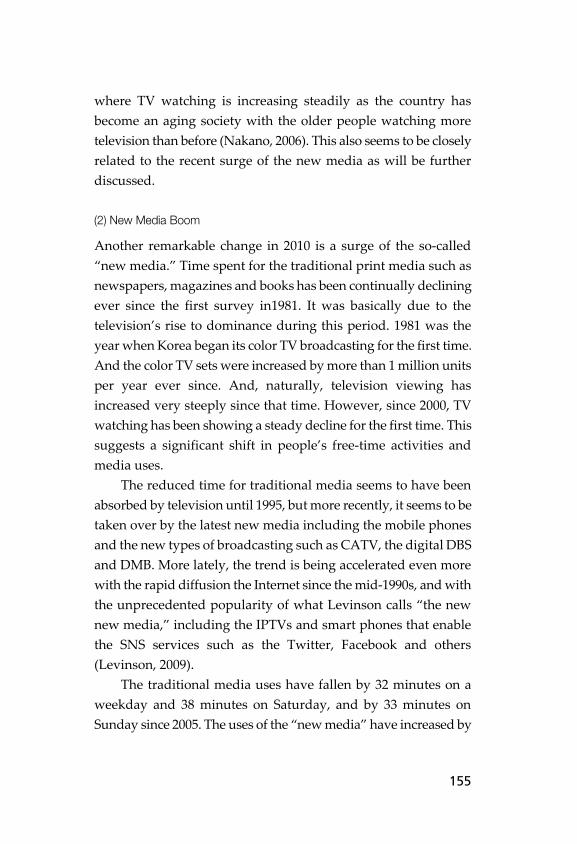
(2) New Media Boom
Another remarkable change in 2010 is a surge of the so-called “new media.” Time spent for the traditional print media such as newspapers, magazines and books has been continually declining ever since the first survey in1981. It was basically due to the television’s rise to dominance during this period. 1981 was the year when Korea began its color TV broadcasting for the first time. And the color TV sets were increased by more than 1 million units per year ever since. And, naturally, television viewing has increased very steeply since that time. However, since 2000, TV watching has been showing a steady decline for the first time. This suggests a significant shift in people’s free-time activities and media uses.
The reduced time for traditional media seems to have been absorbed by television until 1995, but more recently, it seems to be taken over by the latest new media including the mobile phones and the new types of broadcasting such as CATV, the digital DBS and DMB. More lately, the trend is being accelerated even more with the rapid diffusion the Internet since the mid-1990s, and with the unprecedented popularity of what Levinson calls “the new new media,” including the IPTVs and smart phones that enable the SNS services such as the Twitter, Facebook and others (Levinson, 2009).
The traditional media uses have fallen by 32 minutes on a weekday and 38 minutes on Saturday, and by 33 minutes on Sunday since 2005. The uses of the “new media” have increased by

156
61 minutes on a weekday, 60 minutes on Saturday and 52 minutes on Sunday, respectively. This substantial increase of the new media time is the single most significant change in the 2010 survey. Korea currently ranks one of the very top in the world in their diffusion rates of various new media. These new media recently, with their unprecedented speed of innovations and diffusion rate in the history of any media, seem to almost force the people to reorganize their free-time activities and communication styles. This point will be further taken up in the later chapters when considering the impact of the industrialization in Korea on time use behaviors of the people.
To summarize the major changes during the five year period since 2005, firstly, Korean people’s work time, has decreased for the first time in 2010. They were found to be working less than before on a weekday, let alone the weekend as the five-day workweek settles down in the society since the beginning of the 21st Century. They sleep more as Saturdays are off now, showing a sharper contrast between the weekdays and the weekend in their time-budgeting patterns. This resembles the typical lifestyles of an advanced industrial country.
Second important change in 2010 is the reorganization of the people’s media using patterns. Television viewing still is the main free-time activity in Korea, but unlike some other aging societies, television watching keeps declining since 2000. And, moreover, other free-time activities like socializing, computer games and old media uses all show sharp declines in 2010. Despite the newly acquired Saturday’s free time, people spend much less time for these activities than before. It was inferred that these changes could only be attributed to the surge of “new new media” These new media of communication seem to profoundly affect the people’s lifestyles, and the people’s time use patterns clearly reveal this reorganization of time budgeting.

157
1980 1990 2000 2005 2010
Population (thousands)MaleFemaleTotal
19,23618,88838,124
21,56821,30142,869
23,66723,34147,008
23,62423,65547,279
24,04524,17448,219
Rural PopulationTotal (thousands)% of total
11,460
30.6
7,49817.3
5,60012.2
3,415
7.1
3,068
6.4
Population Density (per Km2) 385.1 431.9 464.0 474.0 489.0
Birth Rate 2.83 1.59 1.47 1.08 1.24
Life Expectancy (year) 65.8 69.2 75.6 77.2 80.5
GDP ($ Billion)GNI/Capita ($)Export Total ($Billion)Import Total ($Billion)
62.21,597
17.50522.292
252.56,147
65.01669.844
511.810,831
172.268160.482
787.516,291
284.419265.238
1143.020,759
467.400425.700
Economically Active (thousands)
14,431 18,539 22,134 23,743 24,836
Employment (thousands)FemaleUnemployedTotal
5,222
74813,683
7,376
45418,085
8,769
88721,156
9,526
97922,856
10,000
83124,005
Households (thousands) 7,969 11,355 14,312 15,880 17,334
* Sources: compiled from the statistics by the Bank of Korea, Statistics Korea and others.
Table 3. Major Social Indices of Korea Since 1980
3. Industrialization and Time Use Change Since 1981
1) Social Change in Korea Since 1960
(1) Economic Development and Industrialization/Post-Industrialization
Korea is one of the very few countries that were successful in industrializing its economy in the 20thcentury. The country, from the ashes of the Korean War in the early 1950s, has transformed itself into an industrialized society from a backward agricultural economy during a relatively short period of only four decades

158
since the 1970s. More recently, especially since the mid 1990s, the so-called “informatization,” or “post-industrialization,” of the society, is rapidly underway. The country has undergone a truly profound social change during this process, not only in its economy but also in the various social, political and cultural areas as well.
As the following <table 3> clearly shows, the country’s change, or development, is truly remarkable. First of all, the country’s GDP has soared from a mere $62.2 billion mark in 1980 to $1143.0 billion in 2010. The total, in 1970, was only $8 billion, thus, it has soared almost 150 times in 40 years. Accordingly, GNI per capita has increased from $1,579 in 1980 ($249 in 1970, $80 in 1960) to $20,759 during the same period. The total number of the employed has almost doubled from about 13.7 million in 1980 to over 24 million in 2010 as a result.
Korea’s economy has fully industrialized during this period, and it is often referred to as a “newly industrialized economy,” or NIE. And the size of its economy ranks the 11th in the world. The country joined OECD in 1995,and became a member of the G20 in1999. Korea hosted the prestigious group’s summit meeting in November of2010. The 2010 G20 Seoul Summit was the fifth of its kind to discuss the global financial and the world economy attended by the heads of the governments of the member nations.
(2) Urbanization and Population Concentration
The country’s rapid industrialization has inevitably resulted in urbanization by luring the rural labor forces to the urban areas with the increased employment opportunities for better paying jobs. The percentage of the rural population, once more than 70% of the country’s total population in the 1950s (67% in 1960, 49.8% in 1970, 30.64% in 1980), has plummeted to only 6.4 % in 2010, signifying a complete demise of the traditional agricultural
159
society in Korea. This influx, or internal migrants from the rural areas into the
cities has resulted in a high rate of urban concentration and has become a new kind of social problem. Korea’s urban concentration ratio is 81.5% as of 2009. According to an ADB (Asian Development Bank) study, it ranks 6thin the world after the city states of HongKong, Singapore and Nauru(100%), and after Australia(88.7%) and New Zealand(86.6%). Japan ranks 11th(66.5%), Taiwan16th(59.1%), China22nd (46.6%) and India34th(29.4%), respectively(Chosunilbo, 2010).
The total population of the so-called Capital City Area which is consisted of the capital of the country Seoul, its neighboring City of Incheon and the Province of Gyeong-gi, is some 23.83 million or 49.1% of the country’s total population. Almost a half of the country’s population live in an area (11,820 Km2) approximately two-thirds of the size of either Beijing (17,000 Km2), or the New York Metropolitan Area (17,400 Km2). Korea’s population density (489 per Km2) is one of the highest in the world, and the concentration in a small area around the capital city only aggravates the situation(Hankookilbo, 2011).
The exodus of the rural population to urban cities has unavoidably resulted in the population decrease and shortages of labor in these rural areas. The populations in rural areas keep declining, and many remaining young farmers are literally “importing” their brides from other countries in the Southeast Asia these days.
The cities where population has more than doubled in this period, on the other hand, have different problems of their own including the air and water pollutions, traffic jams, urban crimes and other social ills. However, the biggest of them all is a housing shortage. South Korea (94,000 Km2), is approximately the size of the State of Indiana in the U.S., and cities are experiencing severe
160
shortage of land to be able to accommodate the influx of migrants in a short time. Thus, the only solution was to develop numerous high-rise community housing, or multi-family attached housing complexes including apartments, condominiums (they all are called the “apartments”) and townhouses (the “villas”). These community housing, or homes, comprises 72% of the total housing units in the country, and the Capital City Area has even higher concentration rate of 82% (Statistics Korea, the 2010 Census Data).
(3) Socio-Political Change
The rapid industrialization and urbanization had tremendous impacts on the traditional customs and values as well. The traditional large families in the agricultural Korean society where three or even four generations lived together in a household have all but disappeared and have been broken up into so many “nuclear families.” Thus, the number of households has more than doubled in 30 years. Divorce, a taboo in the Confucian society until the 1970s, is now so common that it is not a stigma anymore, and one out of three marriages is breaking up these days. The rate is one of the highest in the world.
While life expectancy has gradually but notably increased, the birth rate, which was the biggest social problem until the 1980s, has plummeted so abruptly these days that the Korean government is in a frenzy to boost population growth again with numerous incentives and subsidies for childbirths. The nation’s birth rate of 1.08 in 2005 was the lowest in the world. But it has grown slightly to 1.24 in 2010 owing to various promotional policies by the government.
Politically Korea has experienced a very turbulent change as well during the same period. A military coup d’état in 1961toppled the country’s democratic government since the

161
ItemsYear
1980 1990 2000 2005 2010
Automobiles 528 3,395 12,059 15,397 18,130
Telephone Lines 2,705 13,276 21,932 22,920 20,090('09)
Mobile Phones 2.7('84) 80.1 30,887('02) 38,731 49,610
Internet Users - 366('95) 25,650('02) 31,580('04) 37,010
Color TV Sets 139 14,427 19,020 23,750 23,681('09)
Refrigerators 12,459 13,387 15,929 16,500 17,045('09)
Washing Machines 9,754 12,214 12,750 14,250 16,247('09)
PCs 1,097 7,824 9,316 24,259 34,870
* Sources: compiled from the data by Statistics Korea, the Bank of Korea and others.
Table 4. Telecommunications and Home Appliances in Korea (unit: 1,000)
nation’s independence in 1948, and a harsh authoritarian military dictatorship lasted for 32 years. But in 1993, the military stepped down and a popularly-elected civilian government was fully restored bringing back a democratic government again.
With the rapid economic development, Korean women’s social and political participation has vastly increased as well. They are not any more confined to their homes. With the increased employment opportunities, Korean women have become an integral part of the country’s economic force now. As of 2010, women comprise some 41.4% of the country’s total work force. The number has more than doubled since 1970.
Korean women’s sense of their rights and gender equality has also been heightened enormously. The traditional male preference at childbirths and discrimination against women in employment and social participation has been greatly mitigated, if not completely eliminated. Korean women these days are more active than ever before in economics activities, politics, and all other areas of social participation (Choo, 2004). Even the college

162
entrance rate of high school girls (82.4%) surpassed that of boys (81.6%) in 2009 for the first time.
Korean people’s quality of life, at least in material terms, has improved tremendously during the same period as the following <table 4> reflects.
Automobiles and all kinds of home appliances are not luxury items any more. They are as abundant as in any other society. The country is now rapidly taking shape as a “post-industrial society,” or the “Information Society,” with one of the highest percentages of personal computer users and the Internet users, let alone the xDSL subscribers and all kinds of “new media” including the smart phones, IPTVs, 4-G mobile phones and others. Moreover, as the country is adapting to the 5-day workweek system, the people’s time-use patterns are quickly changing as never before. A series of time-use data since 1981 clearly reveals some of these social development and lifestyle changes in the Korean society.
2) Industrialization and Time Use Change
Since the first time use survey in 1981, the Korean people have indeed shown enormous changes in their time-use patterns. This is, first of all, believed to have been brought about by the country’s economic and social development as described earlier.
The following <table 5> summarizes and compares the time means of major activities since 1981. Only one survey in each decade is included in the table to trace the general trend of change.
A close analysis of the table shows the following several trends of change during the past thirty years of industrialization and social development.
(1) Big Increase of Work
The first noticeable change during the period is a big increase of

163
1981 1990 2000 2010
Sleep Week.Sat.Sun.
7/387/388/16
7/568/028/55
7/357/408/38
7/337/578/48
Meals Week.Sat.Sun.
1/351/341/42
1/411/411/49
1/461/441/49
1/501/531/55
PersonalCare
Week.Sat.Sun.
1/051/071/05
0/591/001/04
0/500/531/01
1/101/121/15
Work Week.Sat.Sun.
3/182/581/58
3/373/051/41
4/323/551/43
4/353/181/33
Domestic Work Week.Sat.Sun.
1/562/052/22
1/281/341/38
1/351/391/35
1/221/301/28
Socializing Week.Sat.Sun.
0/501/041/28
0/501/131/42
0/451/051/32
0/360/571/14
R & R Week.Sat.Sun.
0/470/470/51
0/440/460/46
0/370/350/36
0/230/280/34
Moving Week.Sat.Sun.
1/131/171/03
1/091/161/02
1/141/221/14
1/191/221/15
Leisure Week.Sat.Sun.
0/350/441/06
0/310/400/53
0/441/051/39
0/401/031/25
Music Week.Sat.Sun.
---
---
0/020/020/02
0/080/080/07
Video Week.Sat.Sun.
---
---
0/010/020/04
0/010/020/03
Movies Week.Sat.Sun.
---
---
0/000/010/02
0/000/030/02
Table 5. Time Use Change During 1981∼2010 (national averages)(unit: hour /minute)

164
1981 1990 2000 2010
Computer Game Week.Sat.Sun.
---
---
0/050/120/15
0/070/150/16
PrintMedia
Week.Sat.Sun.
0/280/290/29
0/250/250/26
0/130/140/16
0/100/100/10
Radio Week.Sat.Sun.
0/460/410/34
0/320/290/25
0/120/110/09
0/090/080/04
TV Week.Sat.Sun.
1/492/263/15
2/032/453/40
2/242/523/46
1/462/092/49
Pay TV Week.Sat.Sun.
---
---
0/090/100/08
0/230/310/33
Internet Week.Sat.Sun.
---
---
0/080/100/11
0/370/390/37
Cellphone Week.Sat.Sun.
---
---
---
0/250/240/19
Home Staying Week.Sat.Sun.
14/5515/4417/47
14/1715/1417/35
13/4414/2516/32
13/2814/5116/44
* “TV” is terrestrial television only. “Leisure” in 2010 is mainly the outdoor free-time activities,
excluding media uses.
time people spend for their work. The <table 5> shows the national average of work time on a weekday in 2010 amounts to 4 hours35 minutes, revealing a hefty increase of 58 minutes since 1981, though it has decreased somewhat since 2005. On Saturday, it has increased by 15 minutes. But on Sunday it has fallen by 11 minutes. This change seems to reflect the country’s economic development which has created numerous jobs.
This trend is even clearer when the averages of only the
165
working people are considered. Many more people work now than in 1981, and they work for much longer hours. In 1981, about 49.7% of the people worked for an average of 6 hours 38 minutes each on a weekday, but in 2010 some 57.1% of the people (7.4% points more) worked for 8 hours and 01 minute (1 hour 23 minutes more). On Saturday in 1981, 50.9% of the people worked for an average of 5 hours 55 minutes, while in 2010 quite fewer people (44.7%) worked for a much longer average of 7 hours and 22 minutes. But on Sunday in 2010, much fewer (21.3%) people worked than in 1981 (37.2%) for an average of 7 hours 19 minutes. The average is more than tripled since 1981 when it was only 2 hours 24 minutes.
Thus, unlike in the early 1980s when the country was not yet fully industrialized and the unemployment rate was relatively higher, Koreans now seem to show an advanced pattern of working longer hours during the weekdays and take the weekends off from work. The rapid industrialization in Korea resulted in a severe shortage of labor since the early 1990s, especially for comparatively low-paying menial works. Thus, currently the situation is augmented by the importation of foreign laborers from a few South East Asian countries. Government data in 2009 reveal that some 1.1 million foreigners, including more than 575,000 laborers and some 125,000 brides from abroad, live in Korea, and the country is turning into a ”multi-cultural” society for the first time in history (http://culturenori.tistory.com/872).
(2) Decreased Domestic Work
Time for domestic work has also substantially decreased during the period. The average of domestic work in 1981 was 1 hour 56 minutes on a weekday. But it has been declining gradually ever since, and was reduced by 25 minutes to 1 hour 22 minutes in 2010. But it was decreased by only 4 minutes on Saturday, and on

166
Sunday it was 10 minutes less. Domestic work, though, is rapidly increasing since 2005, suggesting that more recently people do more house chores during the weekends as the 5-day workweek settles down.
The number of people who do any domestic work at all also shows a similar declining trend. This gradual decline in domestic work seems to be, besides the 5-day workweek, the results of the following three factors. Firstly, the wide availability of many convenient and affordable home appliances such as vacuum cleaners, washing machines, rice cookers and others has helped save much time. These appliances have saturated the Korean homes with the increased personal incomes. Secondly, with their enhanced employment opportunity and social participation, fewer people, let alone fewer women, seem to be able to find as much time for domestic work as before.
In 1981, on a weekday, some 65.7% of people did some domestic work, but the percentage was only 51.2% (-14.5% point) in 2010. On Saturday it has also fallen from 69.3% to 53.4 % (-15.9% point) and on Sunday from 73.7% to 58.4% (-15.3% point). Thus it seems clear that quite fewer Koreans than before do their domestic work these days and for far shorter time. These averages household chores are about one hour less than other countries and are one of the lowest in the world (Fisher and Robinson, 2011).
This short housework is also believed due to the community housing system in Korea as described earlier. As more than 72 % of the households throughout the country live in collective community housing complexes such as the condominiums, apartments or townhomes that are managed by professional companies specifically employed for each complex for the maintenance, security and gardening, heating and other works. Residents in these housing complexes do not have to spend their

167
time for the maintenance of the house or other facilities. This seems to be the major reason for the shortest domestic work in Korea.
(3) Television’s Rise to Dominance
The period since 1981 is when the time use studied have been regularly conducted in Korea, and it precisely coincides with the time when television has risen to its undisputed dominance among various mass media and free-time activities in the country. The country started its color TV broadcasting only in 1981 even though the Korean TV makers had been selling the color TV sets to the foreign markets for many years. The number of color TV sets was only 139,000 at the time when it first started. But the number had exploded to 1.3 million within a year, and it has been increasing by more than a million sets per year ever since. The total number in 2010 exceeds 23 million sets, and television watching has become the national pastime, “colonizing” all the free-time activities ever since (Choo, 2002).
During this period, TV watching has very steeply increased until 1995, but more recently it shows a sign of gradual declining. On a weekday in 2010, the average time for TV watching is 106 minutes. And it is 129 minutes on Saturday and 169 minutes on Sunday. These averages in 1981 were 3 minutes more on a weekday, 17 minutes less on Saturday and 26 minutes less on Sunday. Thus it seems that TV watching has been on the decline, or has not changed much since 1981.
But, as the previous <table 5> shows, in 2010 the Pay TVs were separated from the traditional TVs, and were not included in general TV watching. Thus, when these two are combined, TV watching has continuously increased until 1995 when the averages peaked to 143 minutes on a weekday (+34 minutes since 1981), 187 minutes on Saturday (+41 minutes) and 242 minutes on
168
1981 1985 1990 1995 2000 2005 2010
Weekday
0 min 13 12 11 10 15 27 28
15 min ∼ 1 hour 22 24 19 17 15 16 19
1 hour 15 min ∼ 2 hours 30 29 29 25 22 22 21
2 hours 15 min ∼ 3 hours 21 18 20 20 19 17 14
3 hours 15 min and over 15 16 21 28 28 24 19
Saturday
0 min 10 10 10 7 13 16 25
15 min ∼ 1 hour 14 16 14 13 12 14 16
1 hour 15 min ∼ 2 hours 25 23 21 18 18 20 19
2 hours 15 min ∼ 3 hours 21 21 18 19 19 17 14
3 hours 15 min and over 29 29 37 43 38 33 26
Sunday
0 min 8 7 7 6 9 12 18
15 min ∼ 1 hour 10 11 9 9 7 10 13
1 hour 15 min ∼ 2 hours 17 18 16 13 15 17 17
2 hours 15 min ∼ 3 hours 19 18 16 15 15 16 16
3 hours 15 min and over 46 45 52 56 54 45 37
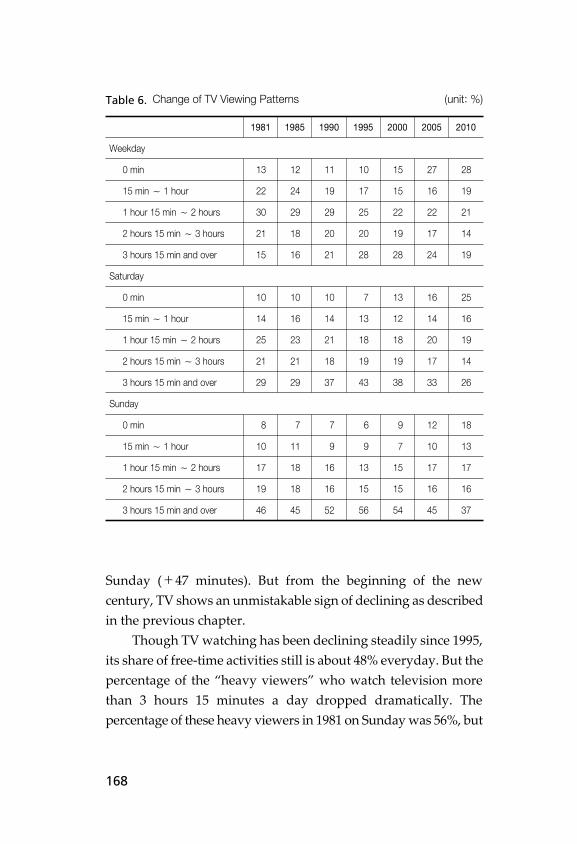
Table 6. Change of TV Viewing Patterns (unit: %)
Sunday (+47 minutes). But from the beginning of the new century, TV shows an unmistakable sign of declining as described in the previous chapter.
Though TV watching has been declining steadily since 1995, its share of free-time activities still is about 48% everyday. But the percentage of the “heavy viewers” who watch television more than 3 hours 15 minutes a day dropped dramatically. The percentage of these heavy viewers in 1981 on Sunday was 56%, but

169
it fell to only 37% in 2010.The dominance of TV is not unique to Korea, and it was at the
cost of other mass media such as newspapers, books and magazines as well as radios. These “old media” have almost fallen to oblivion and virtually replaced by television during this period.
However, since, 1995, television itself shows a small but unmistakable sign of waning for the first time, being replaced by the so-called “new media” such as the Internet, DBS, mobile phones and PCs, or “the new new media” including .the smart phones, iPads, and others that enable the people access to the wireless broadband Internet services. Nonetheless, TV still is enjoying the lion’s share of people’s free-time activities, and the TV’s continued technological innovations such as digitization and multi-functional IPTVs that combine television with personal computers and other machines may help keep its dominance for the time being. But the future seems not very optimistic for television as the radio’s fate was in the 1950s.
(4) Quantitative and Qualitative Change of Leisure
The other striking change in Korean people’s time use during this period, however, has been in their leisure pattern, both quantitatively and qualitatively. Quantitatively, as the previous <table 5> shows, the amount of leisure time has increased substantially during the 30-year period. On a weekday, it has increased by 33 minutes, and on Saturday by 51 minutes and on Sunday by another 60 minutes since 1981.
This change is most notable since 2000. Leisure time has jumped since then. With social development, people’s perception of leisure has changed very rapidly. And people were believed to be trying deliberately to find more time for leisure, especially since 1995 when Korea reached the $10,000 mark of per capita GNI for the first time. It was found in many leisure researches in Korea,
170
Year
Types
1981 1990 2000 2010
Week Sat.. Sun.. Week Sat.. Sun.. Week Sat.. Sun.. Week Sat.. Sun..
Active leisure
Sports 8 10 16 5 7 8 8 10 11 6 10 10
Games 4 5 8 4 6 5 2 4 3 3 4 4
Walk/hiking 4 7 17 4 8 17 13 20 41 8 11 21
Hobbies 4 4 5 7 7 7 3 5 14 15 26 40
Skills 3 2 2 2 2 1 3 2 2 4 3 3
Plays 3 4 7 2 4 5 1 1 1 0 0 0
Socializing 50 64 88 50 73 102 45 65 92 36 57 74
Computer - - - - - - 11 14 15 37 39 37
Sub total 76 98 143 74 107 145 86 121 179 109 150 189
Passive leisure
Movies & Music 10 12 11 5 7 9 3 4 6 9 13 12
Print media 28 29 29 25 25 26 13 14 16 10 10 10
Radio 46 41 34 32 29 25 12 11 9 9 8 4
TV 109 146 195 123 165 220 144 172 226 106 129 169
DBS/CATV - - - - - - 9 10 8 23 31 33
Sub total 193 228 269 185 226 280 181 211 265 157 191 228
Leisure total 269 326 412 259 333 425 267 332 444 266 341 417
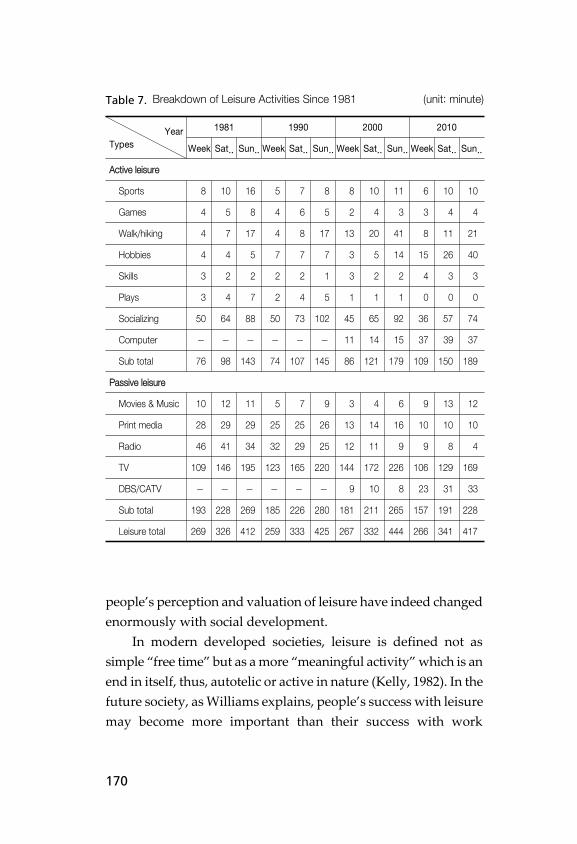
Table 7. Breakdown of Leisure Activities Since 1981 (unit: minute)
people’s perception and valuation of leisure have indeed changed enormously with social development.
In modern developed societies, leisure is defined not as simple “free time” but as a more “meaningful activity” which is an end in itself, thus, autotelic or active in nature (Kelly, 1982). In the future society, as Williams explains, people’s success with leisure may become more important than their success with work

171
because the trend towards post-industrial society will bring about shorter work weeks and more time for leisure (Williams, 1983, p.121). To analyze this qualitative change in Korean people’s leisure, a more detailed breakdown of various leisure activities is given in <table 7>.
In this table, leisure is broadly defined, as in the 2006 analysis (Choo, 2006), to include both the active and passive free-time activities including the various media uses. When the total amounts are compared, it seems as though there had been not much of change due to “the relative constancy” of free time people can spend. The “relative constancy theory” posits that people’s spending and time for mass media and leisure are relatively constant over a period of time (McCombs &Nolan, 1992). That is, time and money spent for mass media or leisure activities are not very likely to change in a short period. Every person has only twenty-four hours a day, and when the physiologically essential activities such as sleep and eating are excluded, people have only so much time for their leisure each day. Thus, leisure time is relatively constant, the theory predicts.
Indeed, the total amount of leisure time seems to be relatively constant and changed very slightly during the period. The table reveals a striking qualitative shift in the Korean people’s composition of leisure, though. First, more people are inclined towards active leisure. The average amount of active leisure has increased by 33 minutes on a weekday, by 52 minutes on Saturday and by 46 minutes on Sunday since 1981. Passive leisure, on the other hand, has fallen by 36 minutes (weekday), by 37 minutes (Saturday), and by 41 minutes (Sunday) during the period.
The increase in active leisure alone is bigger than the total increase of leisure time as a whole since 1981. A significant portion of the reduced amount of passive leisure time, TV watching in particular, seems to have been replaced by more autotelic active

172
leisure including skills-learning, hobbies, travel, walking and hiking as well as physical exercises.
How was this qualitative change of leisure possible? This shift towards active leisure, first of all, can be attributed to the country’s social and economic development. With significantly increased personal income, people now can afford automobiles enabling them to do more outdoor leisure activities such as hiking, travel and physical exercises than before. Secondly, there have been people’s positive attitudinal changes towards active leisure as many Korean leisure researchers have found. It has been indicated that during the past decade Korean people had become very keen and conscious of their leisure as a means to achieve themselves and improve their quality of life as well as enabling them to demonstrate their true ability and capability (Lee, 2000, Choo, 2002). The recent boom of jogging, hiking, and fitness centers in Korea certainly owes to this changed attitude towards more active leisure.
Despite the indisputable dominance by television, Koreans seem to have become as keen and conscious of their quality of life, well-being and leisure as their society developed. As Williams (1983) describes, leisure in Korea seems to have become “not just a non-work,” but a necessary and fulfilling part of life as in other advanced societies.
(5) New Media Surge and Reorganization of Free-Time Activities
Korea is one of the test beds of information and communications technologies in the world as the people are very avid and heavy users of the most recent new media and their services. The number of the high speed digital subscriber lines such as VDSL or ADSL with the speed of 100Mbps in Korea exceeds 17 million lines as of the end of 2010, and the percentage of the personal computers in homes is about 81.8% of the total households. The mobile phone
173
subscribers, as of November 2010, are 50.62 millions, more than the total population, and ranks first in the world in its diffusion ratio. And some 56.6% of the people between 12 to 59 years of age were found to be using the Internet accessing via mobile phones (ETRI, 2011, p.2).
However, the smart phones, compared with many advanced countries like U.S. or U.K., were somewhat delayed in debuting to the Korean market as the Korean makers were a little lagged in developing their own versions of the smart phones and applications. When first introduced to Korea in November of 2009, the number of the smart phone subscribers was only about 10,000. But, presently the number is growing fastest in the world, increasing by 20 % a month. As of March of 2011, the number has surpassed 10 million, and is expected to exceed 25 million by the end of 2012 (http://etoday.co.kr, May 19, 2011).
Such a wide diffusion of IT services and infrastructures in Korea was truly remarkable, and owes its growth, besides the industry, to the government’s aggressive policies to promote IT industry and the “Information Society” as the next cash crop of the country in the coming post-industrial society.
The latest new media, as they diffuse throughout the society, seem to almost force a reorganization of the people’s free-time activities such as TV watching, computer games, and socializing and etc., let alone the “old media” like books, newspapers, magazines and radio. Therefore, it appears that to find more time to spend on these fast evolving new media, people, with only so much limited time each day, would have to reorganize or rearrange their free time activities, basically giving up or reducing the “old media” uses and other free time activities. In other words, new media are usurping the positions of the old media including television and other free-time activities.
Of course, it is not unique to Korea, and is rather a worldwide

174
Activity Weekday Saturday Sunday
Internet 200020052010
1112(+01)37(+25)
1413(-01)39(+26)
1515(0)
37(+22)
Cell Phone
200020052010
-02
25(+23)
-03
24(+21)
-03
19(+16)
Pay TV 200020052010
0914(+05)23(+09)
1018(+08)31(+13)
0819(+11)33(+14)
Sub TotalChange
since 2005since 2000
85(+57)(+65)
94(+60)(+70)
89(+52)(+66)
Computer Games
200020052010
0513(+08)07(-06)
2323(0)
15(-08)
1526(+11)16(-10)
Leisure 200020052010
3460(+26)40(-20)
4867(+19)63(-4)
7695(+19)85(-10)
Socializing 200020052010
4541(-4)36(-5)
6563(-2)57(-6)
9287(-5)74(-13)
Sub TotalChange
since 2005since 2000
83(-31)(-1)
135(-18)(-1)
175(-33)(-8)
PrintMedia
200020052010
1310(-3)10(0)
1411(-3)10(-1)
1610(-6)10(0)
Radio 200020052010
1218(+6)9(-9)
1118(+7)8(-10)
912(+3)4(-8)
TV 200020052010
144129(-15)106(-23)
172156(-16)129(-27)
226194(-32)169(-25)
Sub TotalChange
since 2005since 2000
125(-32)(-44)
147(-38)(-50)
240(-33)(-68)
Net Change Total
since 2005since 2000
(-6)(+20)
(+4)(+19)
(-14)(-10)
* Figures in ( ) are the differences from the immediate previous survey. “TV” is terrestrial television
only.
Table 8. Changes in Free-Time Activities During 2000∼2010 (unit: minute)
175
trend. But the Korean people are one of the heaviest users of these new media in the world. And the speed with which the reorganization of various free time activities takes place is beyond anybody’s expectations. And the survey in 2010 clearly reveals this.
To further illustrate, the following <table 8> compares some of the changes in the typical free-time activities since 2000 when the new media started their diffusion in the country. These free-time activities are grouped into three major categories, that is, the new media (the Internet, cellular phones and Pay TVs), leisure (leisure, socializing and computer games) and the “old media” of mass communication (print media, radio and television).
During the first decade of the new century, the net changes in the total time for these free-time activities are not very significant. The table shows the gains of 20 minutes on a weekday, 19 minutes on Saturday and a decrease of 10 minutes on Sunday. But in the last 5 years since 2005, it shows even smaller changes. Thus it seems to be relatively constant over thirty years. However, there have been very substantial qualitative shifts in these activities.
The most impressive change is the surge of the new media in 10 years, especially during the last five years since 2005. Time people spend for the Internet, cell phones and the Pay TVs jumped since 2000 by 65 minutes on a weekday, 70 minutes on Saturday and 66 minutes on Sunday. And most of these increased amounts of time are since 2005 as the table clearly shows. Whereas, the amounts of time spent for the traditional media, socializing and games, etc. have decreased enormously. When these two categories of activities are combined, they show a net decrease of 63 minutes on a weekday, 55 minutes on Saturday and another 66 minutes on Sunday since 2005.
Of course, this decreased time is not totally absorbed by the new media alone, but it seems that a great portion of it is used for

176
the new media. The only exception may be the time people spend for leisure activities as described in the previous section. Therefore, it is almost certain that most of the people’s time used for the new media basically has come from the old media and at the cost of the socializing time. A new pattern of Korean people’s time budgeting seems to be emerging with the advent of the latest popular new media. These latest media seem to be forcing a reorganization of the people’s traditional free-time activities. The 2010 survey unequivocally shows the shift. As many futurists predict, new media will change our lives even more profoundly, and time use patterns of people will be good indicators of this trend as in the case of Korea in 2010.
4. Summary and Conclusion
This paper was first to summarize the major results of the 2010 Korean time use survey, and to further analyze the time use changes during the country’s industrialization period since 1981 when the country has undergone a truly profound social change, politically, economically and socio-culturally. Korea’s industrialization has vastly improved the country’s economy, and the people have become quite better off than before, at least in the material sense. The industrialization has brought about tremendous changes in people’s lifestyles, and the Korean society now seems very similar to other advanced societies of the West.
Recently, moreover, the Korean society is rapidly taking shape as an “Information Society” with one of the highest ratio of the Internet users, xDSL subscribers and mobile phone users. Also, the country has settled down as a 5-day workweek society in the last ten years as most of the major industries and businesses are closed on Saturdays. These changes and developments are
177
greatly affecting people’s time use behaviors and are well reflected in the survey data. During the past 30 years since the first time-use survey in 1981, Korean people have shown the following conspicuous trends of change that can be attributed mainly to the nation’s industrialization and social development.
• Increased work • Decreased domestic work• Television’s rise to dominance (and start declining)• Contrast between the weekend and weekdays(5-day
workweek)• Increase of active leisure• Surge of new media
Like in many advanced societies, Koreans also seem to experience a “time famine” during the weekdays with their increased work. Thus, they show a distinct contrast between the weekdays and the weekend. They seem to postpone or procrastinate many things like domestic work, leisure and socializing until the weekend, as in many advanced societies.
Even though television still occupies the lion’s share, people’s free-time activities show a few remarkable signs of change since 1995. Time for active leisure such as skills-learning, hobbies, physical exercises and outdoors activities has vastly increased over the period while time for passive leisure, including TV watching, is on a sharp decline since 1995. The latest new media, or “the new new media” of communication are occupying a big portion of the people’s free time, virtually replacing the various old media and other free-time activities. The trend will most likely be accelerated in the future “Information Society,” it appears. However, despite the new media surge of late, the Korean people are still as keen and conscious of their autotelic, or “active” leisure
178
as the people of other advanced countries. The people’s time-use patterns, in this sense, are
culture-specific and mirror the contexts of a society including their social values and lifestyles. The Korean time-use data accumulated since 1981 have certainly proven to be valuable to delineate the country’s developmental characteristics during the thirty years of turbulent societal change of industrialization and “informatization.”

179
References
Choo, K. Y. (1996). Changes in Korean people’s mass media use during the 1980s. Journal of Communication Research, 33, Seoul National University, 51∼80.
Choo, K. Y. (2002). Korean people’s leisure time change during 1981∼2000. Paper presented at IATUR 2002 Conference, Lisbon, Portugal (Oct.15-Oct.18).
Choo, K. Y. (2004). Korean women’s social advancement and changes in their time-use patterns. Paper presented at IATUR 2004 Conference, Rome, Italy (Oct.27-Oct.29).
Choo, K. Y., Lee, J-H., & Song, C-H. (2006). Korean people’s time use patterns in 2005 and changes since 1981. Paper presented at IAIUR 2006 Conference in Copenhagen, Denmark (August 17∼19, 2006).
Cohen, E. (1991). Leisure: The last resort. In B. L. Driver, P. J. Brown & G. L. Peterson (eds.), Benefits of leisure. State College, Pa: Venture.
Diener, E. (1984). Subjective Well-being. Psychological Bulletin, 95(5), 42∼57.
Dumazedier, J. (1967). Toward a society of leisure. New York: Free Press.
ETRI (2011. 5. 13). Weekly ET Trend, p.2.
Fisher, K., & Robinson, J. (2011). Life in 23 countries. In A. C. Michalos (ed.), Social indicators research (pp.295∼304). Oxford University Research Archive.
Jo, K. J. (1985). A Study on perceived conception of work and leisure in different occupational types. Unpublished M.A. thesis, Seoul National University.
KBS (Korean Broadcasting System) (1982). The Korean people’s use of time in 1981. Seoul, Korea.
KBS (Korean Broadcasting System) (1986). The Korean people’s use of time in 1985. Seoul, Korea.
KBS (Korean Broadcasting System) (1991). The Korean people’s use of time in 1990. Seoul, Korea.
KBS (Korean Broadcasting System) (1996). The Korean people’s use of time in 1995. Seoul, Korea.
180
KBS (Korean Broadcasting System) (2001). The Korean people’s use of time in 2000. Seoul, Korea.
KBS (Korean Broadcasting System) (2006). The Korean people’s use of time in 2005. Seoul, Korea.
Kelly, J. (1982). Leisure. London: Prentice-Hall.
Korea’s urban concentration ratio is 6th of Asia.(2010. 9. 20). Chosunilbo. http://businessnews.chosun.com/site/data/html_dir/2010/09/20/2010092000256.html
Korean National Computerization Agency (2010). 2009 Korean Internet White Paper. Seoul, Korea,
Levinson, P. (2009). New new media. New York: Pearson/Penguin.
Lindner, S. (1970). The harried leisure class. New York: Columbia University Press.
Nakano, S. (2006). Turning point of Japanese society: From the latest results in 2005. Paper presented at IATUR 2006 Conference, Copenhagen, Denmark (August 16-18, 2006).
The number of foreigner in Seoul becomes more than 590,000. (2011. 5. 30). Hankookilbo.http://news.hankooki.com/lpage/economy/201105/h2011053020532121500.htm
Williams, F. (1983). The communications revolution. New York: Mentor Books.
최초 투고일 • 2011.06.30
논문 수정일 • 2011.07.28
게재 확정일 • 2011.07.29