master’s thesis - connecting repositories · pdf file3.4.1 contact angle ... in the case...
TRANSCRIPT
Faculty of Science and Technology
MASTER’S THESIS
Study program/ Specialization:
Petroleum Engineering/
Reservoir Engineering
Spring semester, 2011
Open
Writer: John Emeka Udegbunam
…………………………………………
(Writer’s signature)
Faculty supervisor(s): Professor Tor Austad
Dr Skule Strand
Title of thesis:
EOR in Chalk: Optimized Oil Recovery with Modified Seawater.
Credits (ECTS): 30
Key words:
Chalk
Wettability alteration
Modified seawater
Enhanced oil recovery
Pages: 60
+ enclosure: 5
Stavanger, 15 th June, 2011.
Date/year
i
Acknowledgements
I want to use this opportunity to express a heartfelt gratitude to my supervisor, Professor Tor
Austad, for offering me a thesis topic that I find very interesting. His wealth of experience
and passion for his work is a great source of inspiration to me. Prof. Tor is an enthusiastic
person and his door is always open. I consider myself very fortunate to be part of his
outstanding research team.
I also wish to acknowledge the contribution made by Post Doc. Skule Strand, towards the
success of this work. I thank him for his thorough guidance, inspiring discussions, and proof
reading of my thesis. I appreciate his analytical skills and the ability to point out
improvement areas.
I would like to thank the PhD student, Jafar Fathi for his encouragement and immense
assistance in the laboratory tests. He devoted his time to ensure that I made progress, in spite
of the tight schedule that he had during the period.
I would like to thank Hakan Aksulu for his assistance, especially at the later part of my work.
I also wish to acknowledge the University of Stavanger and the Department of Petroleum
Engineering for offering me a good working environment.
I need to say a big thanks to my adorable and devoted wife, Obianuju Udegbuam, for all her
unflinching supports. With her by my side, there is neither a journey that is too far nor a night
that is too dark.
No word can express my warn feelings of thanksgiving to my Divine Creator for making it
possible for me to actualize my dream. His love and grace keep me going, even in the face of
wayward circumstances.
John Emeka Udegbunam

ii
Abstract
The effect of using seawater or modified seawater as a wettability modifier in chalk has been
previously investigated at higher temperatures. This work has shown that “smart water”
improves the oil recovery due to wettability alteration at temperatures above 90°C.
In this work, the effect of modifying the salinity and the ionic composition of seawater on oil
recovery from chalk is studied at lower temperatures, 90 and 70°C.respectively.
The chalk cores with 10 % initial water saturation were saturated ,flooded and aged with the
synthetic crude oil (with AN= 0.5mgKOH/g oil). Then, the cores were imbibed with different
imbibing fluids. The brine VB0S, with no ability to change the wetting condition of the core
was used as the reference brine. Seawater was modified by reducing the concentrations of the
non-active ions, Na and Cl .Also, the concentration of sulfate which has a catalytic effect
on the wettability alteration was increased. The chromatographic wettability test was used to
determine the water-wet surface area of the chalk cores after the spontaneous imbibition tests.
The experimental work showed improved oil recovery when modified seawater was used
both at 90 and 70°C. The surface active ions (SO 2
4- and Ca 2 ) had easier access to the chalk
surface by reducing the concentrations of the non-active ions in seawater. Increasing the
sulfate concentration, improved both imbibition rate and ultimate recovery. For a slightly
water-wet system, “smart water” was able to improve the oil recovery at temperatures down
to 70°C.
The wettability alteration process was confirmed by the chromatographic wettability tests.
The tests indicated that the water-wet surface area in the cores increased with increasing
“smartness” of seawater.
iii
Abbreviations and symbols
A Adsorption area
AN Acid number, mg KOH/g oil
ASTM American Society for Testing and Materials
BN Base number, mg KOH/g oil
C/Co Relative concentration of ions
D Core diameter, cm
DI Deionized water
EOR Enhanced oil recovery
IFT, σ Interfacial tension, mN/m
IOR Improved oil recovery
L Core length, cm
OOIP Original oil in place
PV Pore volume, 3cm
SC Synthetic crude oil
SK Stevns Klint
SW Synthetic seawater
SW0NaCl Modified Synthetic seawater with reduced NaCl
SW0T Synthetic seawater without SO 2
4
SW1/2T Synthetic seawater in which the concentrations of SCN and SO 2
4 is
0.012 mol/l respectively
SW4S0NaCl Modified synthetic seawater with reduced NaCl and with 4 times the
concentration of sulfate
oiS Residual oil saturation, %
wiS Initial water saturation, %
TDS Total dissolved solids, g/l
imT Imbibing temperature, °C
USBM United State Bureau of Mines
VB0S Artificial formation brine with no SO 2
4
WI Chromatographic wettability index
μ Viscosity, cp
Ф Porosity, %
Density difference between oil and water, g/cm3Contents

iv
Contents Acknowledgements .................................................................................................................................. i
Abstract ................................................................................................................................................... ii
Abbreviations and symbols .................................................................................................................... iii
Contents ................................................................................................................................................. iv
1 Introduction ......................................................................................................................................... 1
1.1 Introduction .................................................................................................................................. 1
1.2 Project objectives ......................................................................................................................... 3
2 Theory ................................................................................................................................................. 4
2.1 Carbonates.................................................................................................................................... 4
2.1.1 Chalk ..................................................................................................................................... 4
2.2 Oil recovery ................................................................................................................................. 5
2.2.1 Primary recovery ................................................................................................................... 5
2.2.2 Secondary recovery ................................................................................................................ 6
2.2.3 Tertiary recovery/EOR processes ......................................................................................... 6
2.3 Fluid displacement forces ............................................................................................................ 7
2.3.1 Gravity forces ........................................................................................................................ 8
2.3.2 Capillary forces ..................................................................................................................... 8
2.3.3 Viscous forces ...................................................................................................................... 11
3 Wettability......................................................................................................................................... 13
3.1 Classification of wettability ....................................................................................................... 13
3.2 Mechanisms of wetting alteration .............................................................................................. 15
3.3 Wettability of carbonate reservoirs ............................................................................................ 16
3.4 Methods of wettability measurement ......................................................................................... 16
3.4.1 Contact angle ...................................................................................................................... 17
3.4.2 Amott method ..................................................................................................................... 18
3.4.3 USBM method .................................................................................................................... 20
3.4.4 Chromatographic wettability test ........................................................................................ 22
3.5 Spontaneous imbibition ............................................................................................................. 23
3.6 Seawater as a wettability modifier in chalk reservoirs ............................................................... 24
4 Materials and Methods ...................................................................................................................... 26
4.1 Materials .................................................................................................................................... 26
4.1.1 Core materials ..................................................................................................................... 26
4.1.2 Analytical methods ............................................................................................................. 26

v
4.1.3 Oil samples .......................................................................................................................... 27
4.1.4 Brines .................................................................................................................................. 28
4.2 Core preparation ......................................................................................................................... 29
4.3 Spontaneous imbibition tests ...................................................................................................... 31
4.4 Chromatographic wettability test. .............................................................................................. 33
5 Results and Discussion ..................................................................................................................... 35
5.1 Spontaneous imbibition at 90°C. ............................................................................................... 35
5.2 Spontaneous imbibition at 70°C ................................................................................................. 37
5.3 Chromatographic wettability test analyses................................................................................. 38
6 Conclusions ....................................................................................................................................... 41
References ............................................................................................................................................. 42
Appendix A ......................................................................................................................................... 49
Appendix B ......................................................................................................................................... 55
1
1 Introduction
1.1 Introduction
Carbonate rocks account for about 50 % of the world’s proven oil reserves and many of the
carbonate reservoirs are naturally fractured (Roehl and Choquette, 1985; Høgnessen et al.,
2005). The formations are characterized by heterogeneous porosity and permeability
distributions. In the case of low-porosity and low-permeability carbonate rocks (more
specifically, the rock matrices), the fluid flow in the reservoir can be completely dependent
on the fracture network. The rock matrix only plays a source role analogous to tight-sand
formations and natural-gas flow. Fracture networks can cause uneven sweeping of the
reservoir, leading to early breakthrough of injected fluids in the producing wells and resulting
in low recovery factors. The abundance of carbonate reservoirs has been the subject of
numerous studies attempting to characterize their heterogeneities. Also different types of
fractured reservoirs are classified, and how rock and fluid properties influence ultimate oil
recovery is determined (Manrique et al., 2007; Roehl and Choquette, 1985).
In contrast to sandstone reservoirs, literature data show that about 80-90 % of the world’s
carbonate reservoirs are preferentially oil-wet and they exhibit negative capillary pressure
(Høgnesen et al., 20005). Also according to Chillingar and Yen (1983), experimental survey
on 161 samples from carbonate rocks indicated that 15 % were strongly oil-wet, 65 % were
oil-wet, 12 % were in the intermediate class and 8 % were water-wet. Wettability affects fluid
distribution and flow in the reservoir during production (Anderson, 1986b). And for fractured
carbonate reservoirs, wettability has widely been described as an important factor to consider
for waterflooding to increase oil recovery (Tong et al., 2002; Morrow and Mason, 2001;
Zhou et al., 2000; Hirasaki et al., 2004).The wettability depends both on the nature of the
solid and the fluid properties; both oil and the initial brine (Cuiec 1984). Clean chalk is
naturally water-wet, but crude oil may rupture the water film. The surface active components
(carboxylic materials) of the crude oil can adsorb onto the rock surface, rendering it oil-wet
as described by (Legends, et al., 1998; Kovscek et al., 1993; Kaminsky and Radke, 1998).
The wetting nature of a carbonate reservoir determines the potential of improved oil recovery
by water injection, especially if the formation is highly fractured. This is often the case for
chalk formations. The initial wetting state is mostly governed by the properties of the crude
oil, where the acid number, AN, appeared to be a crucial parameter. The reservoir
temperature plays a minor role as a wetting parameter. Improved oil recovery by water
injection decreases as the water-wetness decreases due to decrease in spontaneous imbibition
(Austad et al., 2005). In a water-wet to mixed-wet formation, injected water may imbibe into
the matrix blocks spontaneously (Torsæter, 1984). However, in an oil-wet rock, spontaneous
imbibition into the matrix blocks may not be possible due to small or negative capillary
pressure. In fractured oil-wet reservoirs, the injected water will advance in the high
2
permeable fractures resulting in early water breakthrough and low oil recovery (Al-Hadhrami
and Blunt, 2000).
Furthermore, many researchers had demonstrated that the surfactant flooding could
enhance oil recovery from fractured carbonates. This is due to the combined effects of
reduction of water-oil-interfacial tension (IFT) and wettability alteration of the carbonates to
a more water-wet condition (Milter and Austad, 1996; Austad et al., 1998; Spinler et al.,
2000; Standnes and Austad, 2000b; Hirasak and Zhang, 2003; Seethepall et al., 2004).
Flooding with cationic surfactants is most effective because they bear the same charge
(positive charge) as the surface of the carbonates (Zhang, 2006). Strand et al. (2003) further
documented that the wettability alteration process is catalyzed by the presence of sulfate ion,
SO 2
4 . Sulfate can adsorb on the carbonates surface due to its strong affinity, and reduces the
positive charge density. However, the reduction of IFT by the surfactant will decrease the
spontaneous imbibition rate and the result is a slow oil recovery process (Zhang, 2006). The
greatest setback to application of the chemical flooding in the fractured carbonate reservoirs
is of economic consideration. The use of surface active additives like cationic surfactants of
the quaternary ammonium type, 33(CHNR , is very expensive. Thus, seawater flooding
became an attractive alternative because it is cheap and readily available.
Water injection for both pressure maintenance and oil displacement is the most
important secondary recovery method in sandstones but has also been implemented with
outstanding success in some carbonate reservoirs (Shariatpanahi et al., 2010). A typical
example is the successful seawater injection into the Ekofisk field in the North Sea. The
reservoir is a mixed-wet and low permeable naturally fractured chalk formation (Thomas et
al., 1987). This great success gave impetus to many research programs to evaluate the
interaction between the carbonate rock and the injected seawater. The mechanism involving
wettability alteration and improved spontaneous imbibition of water into the matrix blocks
are now understood. Previous studies had shown that sulfate was observed to catalyze the
wettability alteration process using cationic surfactants. Seawater contains sulfate, and the
concentration is nearly twice the concentration of calcium (Høgnesen et al., 20005). Recent
laboratory studies (Høgnesen et al., 20005; Austad et at., 2007; Zhang et al.,2007) had
demonstrated that seawater contained potential determining ions (SO 2
4 , Ca 2 and Mg 2 ),
These ions in proper concentration could promote wettability modification to a more water-
wet condition. It was also observed that the spontaneous imbibition of water into the matrix
block was enhanced, and increased oil recovery was observed as the temperature increased.
Furthermore, Høgnesen et al. (2005) pointed out that the oil recovery by spontaneous
imbibition of water into neutral to preferential oil-wet carbonate cores increased as the
concentration of sulfate and temperature increasd. They also determined the affinity of sulfate
towards the chalk surface at different temperatures using the chromatographic separation
between a tracer, SCN , and sulfate. The area between the effluent curve of the tracer and
sulfate is a measure of the affinity of the sulfate towards the chalk sulfate (Strand et al.,
2006).The chemical mechanism involved in the wettability alteration of carbonates by
seawater is now clearly understood and documented (Zhang et al., 2007). It is the mutual
chemical interaction between SO 2
4 , Ca 2 and Mg 2 , at the chalk surface that is responsible
3
for removing the strongly adsorbed carboxylic material from the rock surface. Thus, the
criteria for seawater to act as a wettability modifier, is that the surface active ions have strong
affinity for the chalk surface. Their chemical reactivity increases as the temperature increases
It was observed experimentally that Mg2
was able to substitute Ca2
on the chalk surface at
temperatures above 90⁰C. Strand et al. (2008) also observed that limestone reservoir reacted
chemically in the same manner as chalk towards the potential determining ions, although the
reactivity was lower than for chalk. Chalk is a pure biogenic rock with a much larger surface
area compared to limestone.
The main goal of water-based EOR in carbonates is to imbibe water into the matrix and with
that displace the oil into the fractures where it is further transported to the producer
(Puntervold, 2008).
Normally, reservoir engineers want to remove sulfate from the injected water in order to
prevent souring (H 2 S production) and scale problems (BaSO 4 , SrSO 4 , etc). It is no doubt
that supply of additional sulfate to the injected fluid can enhance these problems, but
significantly increased oil recovery can justify for the extra cost of inhibitors (Høgnesen et
al., 2005)
1.2 Project objectives
The main objective of this project is the optimization of the salinity and the ionic composition
of seawater to improve oil recovery from chalk. This will be investigated by the spontaneous
imbibition (SI) tests at 90 and 70°C respectively. The chromatographic wettability test is used
to determine the water-wet surface area of the chalk cores after the SI tests.
Strand (2005) studied the effect of brine salinity on the SI process, with the brine without
sulfate. The imbibition rate and the oil recovery decreased as the salinity of the imbibing
brine increased. Fathi et al. (2010) studied the effect of modifying the salinity and the ionic
composition of SW at different temperatures; 100, 110 and 120°C. By the reducing the
concentration of NaCl in SW, both imbibition rate and ultimate oil recovery increased
significantly. Also, a decrease in oil recovery was observed when increasing the
concentration of NaCl relative to SW. It was also observed that wettability alteration was not
a low salinity effect, shown by a drastic decrease in oil recovery when seawater was diluted
with deionized water.
In this work, the concentrations of Ca 2 and Mg 2 in seawater are kept constant. Both
cations and anions in seawater mutually compete with each other. By reducing NaCl in
seawater, the surface active ions (SO 2
4 and Ca 2 ) will have easier access to the chalk surface.
Also, increasing the concentration of sulfate, which has a catalytic effect on the wettability
alteration mechanism, increases both imbibition rate and ultimate oil recovery.

4
2 Theory
2.1 Carbonates
The carbonate rocks comprise mainly limestones and dolomites. The Sedimentary rocks
containing more than 50 % of carbonate minerals are defined as carbonates. All minerals
containing the anion, 2
3CO , are classified as carbonates. Limestone is commonly defined as
the sedimentary rock containing more than 50 % of the mineral, calcite (CaCO 3 ). Chalk is a
special type of limestone. Dolomites contain more than 50 % of the mineral dolomite, (
23 )(COCaMg ) (Strand, 2005). Also, the carbonate rocks are grouped as biogenic,
biochemical and organic sediments (Tucker ,2001 ).There origin may be detrital from debris,
of reef type, chemical precipitation of bicarbonate, or from marine mud (Cossé, 1993).
The economic importance of carbonate rocks is due to their rich organic content and
good reservoir properties. The estimated 40-60 % of the world’s total hydrocarbon
production is from carbonate rocks (Flügel, 2004). Many of the biggest carbonate reservoirs
occur in the Middle East. Other areas in which the rock delivers large quantity of oil and gas
are ; West Canada, Mexico, Texas (USA), Norway (Central North Sea), Poland, Kazakhstan,
Western and Southern China, Iran and Libya (Gluyas and Swarbick, 2004).
2.1.1 Chalk
Chalk is a special case of carbonates and it is formed by the stacking of small single-cell
algae. These small single-cell algaes are called coccoliths (Cossé, 1993). The rock is
composed primarily of calcite and is very susceptible to fracture. During sedimentation and
subsequent diagenesis, most of the coccoliths disintegrate to form the characteristic mixture
of intact coccoliths, fragments and grains. Pelagic chalk diagenesis is the way the calcite
skeletons of algal organisms, which provide the original material that becomes chalk ,alter
over geological time after settling on the ocean flow .Single chalk grains have a general size
of 1μm, which explains the large surface area of about 2 gm /2
(Røgen and Fabricius,2002).
The microstructure of chalk is of great importance. The presence or absence of an organic
coating on the chalk particles has consequences for wetting behaviour (Andersen, 1995).
Chalk is an important type of reservoir rock in the North Sea area, e.g., Ekofisk and
Valhall (Zhang, 2006). The porosity of chalk is rather high, but the permeability is low or
very low, about 1 mD (Cossé, 1993). Chalk fields are generally of three types. Many are
anticlines formed over salt dome and others are formed by salt piercements. Generally, these
forming mechanics give rise to fractures (Andersen, 1995).

5
Figure 2.1: Picture of chalk, taken by a scanning electron microscope, showing
coccolithic rings, fragments and pore space.
2.2 Oil recovery
Oil recovery is traditionally subdivided into three stages: primary, Secondary, and tertiary.
Many a time, reservoir production operations are not conducted in the specified order that
tertiary process may be applied at secondary stage instead of waterfloooding. Thus, the term
“tertiary recovery” fell into disfavour in petroleum engineering literature and the designation
of “enhanced oil recovery” (EOR) became more accepted. Another descriptive designation
normally used is “improve oil recovery” (IOR), which includes EOR but also a broader range
of activities, like reservoir characterization, improved reservoir management, and infill
drilling (Green and Willhite, 1998). The Norwegian Petroleum Directorate (1993) defined
IOR as: “Actual measures resulting in an increased oil recovery factor from a reservoir as
compared with the expected value at a certain reference point in time.”
2.2.1 Primary recovery Primary oil recovery refers to simple pressure depletion where only reservoir energy, through
different mechanisms, is used to extract the oil (Castor et al., 198; Farouq-Ali and Stahl,
1970). These natural energy sources are; solution-gas drive, gas-cap drive, natural water
drive, fluid and rock expansion, and gravity drainage. The particular mechanism of lifting oil
to the surface, once it is in the wellbore is not a factor in the classification scheme (Green and
Willhite, 1998).The recovery factor after this depletion period is usually low, and normally,
only 5-30 % of the original oil in place (OOIP) can be produced (Baviere, 1991) .
6
2.2.2 Secondary recovery
Secondary recovery is normally implemented when the reservoir natural energies are not
sufficient to produce hydrocarbon. This involves injection of water or gas, either for pressure
support or for displacement of oil towards the production wells. About 30-70 % of OOIP is
left unproduced after the process (Baviere, 1991). Gas injection is either into a gas cap for
pressure maintenance and gas-cap expansion or into oil column wells. In this process, oil is
displaced immiscibly according to relative permeability and volumetric sweepout
considerations (Green and Willhite, 1998).
2.2.3 Tertiary recovery/EOR processes Unfavourable reservoir characteristics such as heterogeneous rock properties (fractures,
layers with large permeability contrasts, impermeable layers), unfavourable wettability
conditions, or capillary trapped and bypassed oil, results in areas of the reservoir not flooded
by the injected fluid .Approximately 30-70 % of OOIP in the reservoir is left after these
conventional secondary oil recovery processes (Baviere, 1991; Lake, 1989). It is the residual
oil that is left in the reservoir after the secondary recovery that is the target for EOR
processes. Thus, the purpose of initiating tertiary oil recovery processes is to extend lifetime
of oil reservoirs which are approaching economical limit by support of waterflooding or other
conventional methods (Strand, 2005).Tertiary processes use miscible gases, chemicals, and/or
thermal energy to mobilize and displace additional oil after the secondary recovery processes
become uneconomical (Green and Willhite, 1998). EOR is defined by Baviere (1991) as:
“EOR consists of methods aimed at increasing ultimate oil recovery by injecting appropriate
agents not normally present in the reservoir, such as chemicals, solvents, oxidizers and heat
carriers in order to induce new mechanisms for displacing oil.” Zhang (2006) also proposed
the definition of EOR as any method, which is aiming to improve the fluid flow by means of
changing physical property of the reservoir rock or fluids, including wettability, interfacial
tension, fluid density, viscosity, permeability, porosity, pore size, etc.
Green and Willhite (1998) classified EOR processes into five categories: mobility-control,
chemical, miscible, thermal, and other processes such as microbial EOR.
2.2.3.1 Mobility-control processes These processes primarily involve maintaining favourable mobility ratios (M) to improve the
magnitude of macroscopic displacement efficiency. Examples are polymer-augmented
waterflooding and reducing gas mobility with foams. By modifying the viscosity of water by
addition of polymer, a favourable mobility ratio (M<1) is maintained between the injected
polymer solution and the oil /water bank being displaced ahead of the polymer. This results in
a more uniform volumetric sweep of reservoir, both vertically and areally.

7
2.2.3.2 Chemical processes
The EOR processes involve injection of specific liquid chemicals such as surfactants and
alkaline agents. They also require phase-behaviour properties that results in decrease in
interfacial tension (IFT) between the displacing liquid and oil. Examples are
surfactant/polymer processes and alkaline flooding. The surfactants are used to obtain
ultralow IFT. The process has the potential to increase both microscopic and macroscopic
displacement efficiency due presence of polymer mobility buffer. However, the cost of
surfactant is very high, making the process economically unattractive.
2.2.3.3 Miscible processes
The primary objective of the miscible processes is to inject fluids such as carbon (IV) oxide
and hydrocarbon solvents .These fluids directly mix with the oil or generate miscibility in the
reservoir through composition alteration. The fluid Phase behaviour is very important in these
processes. Oil is displaced to the production well by fluids which form a single phase at first
contact or through modification of composition of the injected phase or oil phase, as fluids
move through the reservoir.
2.2.3.4 Thermal processes
These are based on the injection of thermal energy or the in-situ generation of heat. The
alteration of oil viscosity, favourable phase behaviour, and in some cases, chemical reaction,
are the primary mechanisms leading to improve oil recovery. They are further subdivided in
to hot-water floods, Steam processes, and in-situ combustion (Green and Willhite, 1998).
2.2.3.5 Microbial EOR Microbial enhanced oil recovery (MEOR) represents the use of microorganisms to extract the
remaining oil from reservoirs. This technique has the potential to be cost-efficient in the
extraction of oil that is capillary trapped in the pores of reservoir rocks or in areas not swept
by the classical or modern EOR methods (Lazar et al., 2007)
2.3 Fluid displacement forces
Several forces act on the fluids flowing through a porous medium like an oil reservoir. The
most important forces determining the flow of oil and water in porous media are viscous
forces, gravity forces and capillary forces (Morrow, 1979). The active displacement forces in
8
the SI process are gravity and capillary forces. The interplay between these two forces is very
important in situations where the wettability approaches neutral or the interfacial tension
decreases. With a decrease in IFT of several orders of magnitude, the gravity forces may
dominate the flow pattern in the porous media (Strand, 2005)
2.3.1 Gravity forces
The gravity forces during an oil production process are important especially in gas/oil
systems with density difference between the fluid phases (Murty et al., 1987).The gravity
forces are also important under low oil-water IFT conditions (Hornof and Morrow, 1987;
Austad and Milter, 1997). These buoyancy forces are always present in a system of
immiscible fluids and the lighter phase will experience a pressure in upward direction
(Strand, 2005). The pressure difference between oil and water is expressed by equation 2.1
(Cole, 1969
HgPg ..
Where:
Pg Pressure difference between oil and water due to gravity
Density difference between oil and water
g Acceleration due to gravity
H Height of the liquid column
2.3.2 Capillary forces
The capillary forces have great influence on oil recovery efficiency, but the influence differs
fundamentally for non-fractured and fractured reservoirs. Strong capillary forces during
waterflooding will trap oil and cause relatively high residual oil saturation in a non-fractured
reservoir (Anderson, 1987). Reduction in the oil-water IFT to remobilizing residual oil is in
this case the preferred conditions (Taugbøl, 1995). In fractured reservoirs, spontaneous
imbibition of water due to strong capillary forces is regarded as an important and necessary
mechanism to attain high displacement efficiency (Strand, 2005). Capillary forces are often
the strongest forces in a multiphase flow and the combination of all the active surface forces
determines the capillary pressure in the porous rock (Skjæveland and Kleppe, 1992).
Because fluid/fluid interfaces are in tension, a pressure difference exists across the interface
and this pressure is called capillary pressure (Green and Willhite, 1998). Capillary pressure is
defined as the pressure of the non-wetting fluid minus the pressure of the wetting fluid
(Strand, 2005). For oil/water systems, water is regarded as a wetting phase
WNWwoc PPPPP (2.2)
9
Where:
CP Capillary pressure
NWP Pressure of non-wetting phase at interface (o; oil)
WP Pressure of wetting phase at interface (w; water)
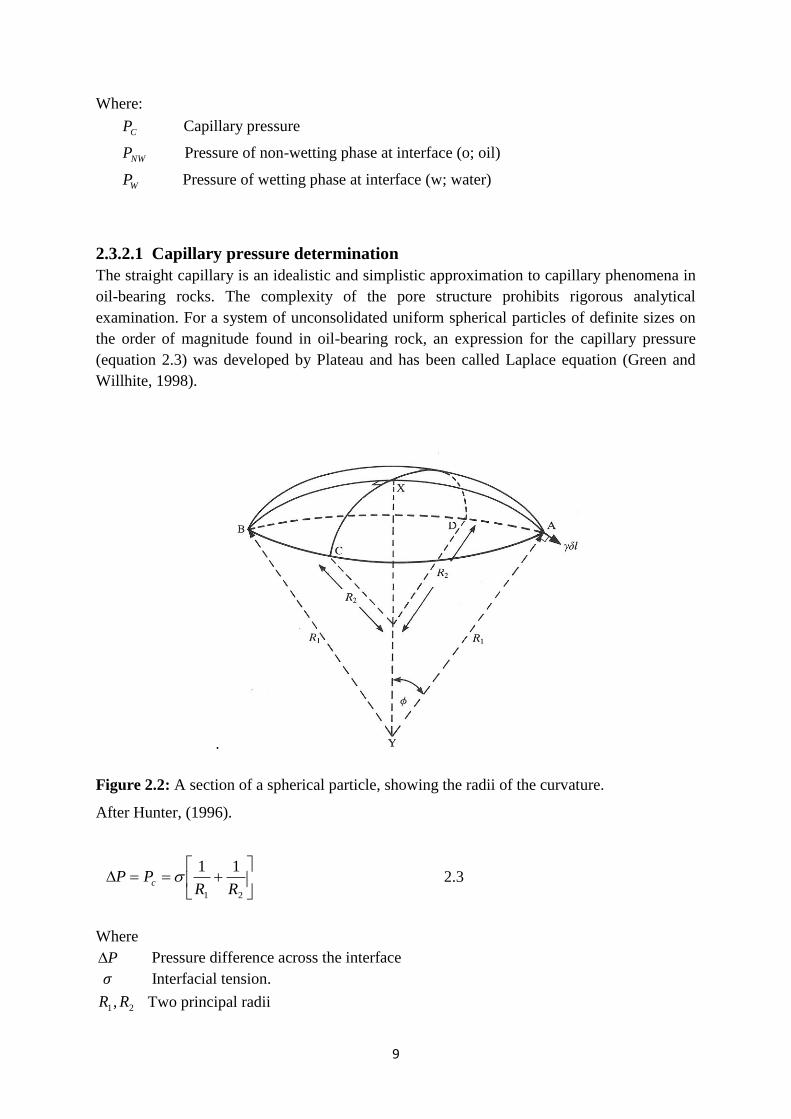
2.3.2.1 Capillary pressure determination
The straight capillary is an idealistic and simplistic approximation to capillary phenomena in
oil-bearing rocks. The complexity of the pore structure prohibits rigorous analytical
examination. For a system of unconsolidated uniform spherical particles of definite sizes on
the order of magnitude found in oil-bearing rock, an expression for the capillary pressure
(equation 2.3) was developed by Plateau and has been called Laplace equation (Green and
Willhite, 1998).
.
Figure 2.2: A section of a spherical particle, showing the radii of the curvature.
After Hunter, (1996).
21
11
RRPP c 2.3
Where
P Pressure difference across the interface
Interfacial tension.
21, RR Two principal radii

10
In a straight capillary, 1/R 1 and 1/R 2 are equal and are given by the radius of the capillary
divided by the cosine of contact angle, cos/r . The cylindrical model is often used to
idealize the complexity of a porous media (Figure 2.3).
The capillary pressure is given by equation 2.4, if we consider a cylindrical pore throat filled
with oil and water, with water as the wetting phase (Strand, 2005).
Figure 2.3: Idealized capillary pressure determination using cylindrical capillary tube model.
After Mørk (2001).
r
P ow
c
cos2 2.4
Where:
r radius of the cylindrical pore channel
ow Interfacial tension (IFT) between oil and water
Contact angle measured through the water phase
From equation 2.4, the capillary pressure is related to the fluid/fluid IFT, the relative
wettability of the fluids (through ), and the size of the capillary ( r ). The capillary pressure
may be positive or negative; the sign merely expresses in which phase the pressure is lower
.The phase with the lower pressure will always be the phase that preferentially wets the
capillary (Green and Willhite, 1998). For the SI processes in oil-wet carbonate reservoir, the
only parameter that can be altered to change the wetting of the rock is the contact angle. This
is done by using seawater with the desired salinity and ionic composition as the imbibing
brine.

11
Figure 2.4: Typical capillary pressure curves for a reservoir rock, water-wet system (Green
and Willhite, 1998).
2.3.3 Viscous forces
The viscous forces in a porous medium are reflected in the magnitude of the pressure drop
that occurs as a result of flow of a fluid through the medium. They can be approximated by
assuming that a porous medium is a bundle of parallel capillary tube. The pressure drop is
given by Poiseuille’s law.
cgr
vLP
2
8 (2.5)
Where:
P Pressure across the capillary tube
L Capillary tube length
r Capillary tube radius
v Average velocity in the capillary tube
Viscosity of flowing fluid
cg Conversion factor
The dimensionless grouping of variables which expresses the ratio of viscous to capillary
forces is called the capillary number ( caN ). Waterfloods typically operate at condition where
caN < 10 6 and values on the order of 10 7 are probably most common. From equation 2.6,
caN increases either by increasing the flow rate of the displacing fluid, increasing the
viscosity of the displacing fluid or reducing IFT between the displaced and displacing fluids
(Green and Willhite, 1998).

12
ow
w
c
vca
v
F
FN
(2.6)
Where:
Fv Viscous force
Fc Capillary force
v Interstitial pore velocity
μw Viscosity of the water
σow Interfacial tension between oil and water

13
3 Wettability
Wettability is the tendency of one fluid to spread on or adhere to a solid surface in the
presence of other immiscible fluids (Anderson, 1986a). Wettability is an important
determining factor in a multiphase flow in reservoir rock, fluid distribution and trapping
(Strand, 2005). Fluid distributions in porous media are affected both by forces at fluid-fluid
interfaces and fluid-solid interfaces. Usually, one phase is more strongly attracted to the solid
than the other phase, when two immiscible fluids are placed in contact with a solid surface.
The more strongly attracted phase is called the wetting phase. Also, rock wettability affects
the nature of fluid saturations and the general relative permeability characteristics of fluid-
rock system. The location of a fluid within the pore structure depends on the wettability of
that phase (Green and Willhite, 1998).
The reservoir wettability is a critical parameter in many types of oil recovery processes.
Recovery of oil by spontaneous imbibition of water into the matrix of fractured reservoirs is a
frequently cited example. Ma et al. (1999) also noted that capillary pressure is the driving
force in spontaneous imbibitions. Wettability remains the key factor in determining capillary
driving force and the related imbibition rate.
3.1 Classification of wettability
Wettability can classified as homogeneous when the rock surface has uniform molecular
affinity to either water or oil. This is again split into strongly water-wet, strongly oil-wet, and
Intermediate-wet categories.
For a strongly oil-wet rock, the oil will contact most of the rock surface and occupy the
smallest pores and the water is in the middle of the larger pores. When this rock is
waterflooded, the oil will remain as a film on the rock surface and in the smallest pores where
water does not penetrate .The water will mainly flow the rock in the larger pore channels as
illustrated by Figure 3.1a.
On the other hand, if water contacts most of the rock surfaces and fills the smallest pores of
the rock, we have a strongly water-wet rock. The oil is located in the center of the larger
pores. If the rock is waterflooded, a snapping phenomenon may occur, leaving oil globules
trapped in the center of the large pores, as show in Figure 3.1b (Strand,2005). Intermediate
wettability occurs when both fluid phases tend to wet the solid, but one is only slightly more
attracted than the other (Green and Willhite, 1998).

14
Figure 3.1: Displacement of oil by water for (a) Oil-wet rock, and (b) Water-wet rock.
After Forrest (1980).
Moreover, the concept of intermediate wettability assumes that all portions of the rock have a
slight but equal preference to being wetted by oil or water.
In contrast, the internal surface of the reservoir rock is composed of many minerals with
different surface chemistry and adsorption properties, leading to variations in wettability.
This heterogeneous wettability may be divided into fractional or mixed wet. In fractional
wettability, (also called heterogeneous, spotted, or dalmatian) crude oil components are
strongly adsorbed in certain areas of the rock. Thus, some portion of the rock is strongly oil-
wet, while the rest is strongly water-wet. The mixed wet is a special type of fractional
wettability when the rock has continuous water-wet and oil-wet regions (Salathiel, 1973;
Strand, 2005). Mixed wettability results from a variation or heterogeneity in chemical
composition of the exposed rock surfaces or cementing-material surfaces in the pores (Green
and Willhite, 1998). In addition, both water and oil can spontaneously imbibe, in some
mixed-wet or fractional wet system (Anderson, 1986b; Cuiec, 1999).
Furthermore, Green and Willhite (1998) gave a quantitative classification of wettabilty based
on contact angles. Contact angle by convention, is measured through water phase and it is a
measure of wettability.
From Figure 3.2, the solid is water-wet if θ < 90⁰ and oil-wet if θ > 90⁰. A contact angle
approaching 0⁰ indicates a strongly water-wet system and an angle approaching 180⁰
indicates a strongly oil-wet system. Intermediate wettability occurs when θ is close to 90⁰.

15
Figure 3.2: Wettability of the oil/water/rock system. After Raza et al. (1968).
Where : θ= Contact angle, ow =IFT at oil-water interface, os = IFT at oil-solid interface ,
ws = IFT at water-solid interface .
3.2 Mechanisms of wetting alteration
Originally, all reservoir rocks are thought to be water-wet. Their wettability could be altered
by the adsorption of polar compounds and/or a deposition of organic matter that was
originally in the crude oil (Anderson, 1986a). The degree of change in wettability can be
determined by the interaction of the oil components, the mineral surfaces, and brine
chemistry (Anderson 1986a; Buckley, 2001).
Adsorption of surface-active polar compounds from the crude oil results in a less water-
wet rock (Puntervold,2008).The main crude oil fractions affecting the wettability in porous
rock are the asphaltenes and resins (Buckley 1996;Xie et al ,2000). Asphaltenes are large
complex molecules, somewhat polar, with molecular weights in the range 600-300,000
(Rønningsen, 1991). Resins are smaller molecules than asphaltenes, but have in general
higher content of the polar elements - nitrogen, sulphur, and oxygen (NSO-compounds).
They are in general more polar than the asphaltenes (Speight,1999; Strand, 2005). These
polar compounds are in either acidic or basic in nature (Anderson, 1986b; Cuiec, 1984).
Skauge et al. (1999) also demonstrated that both acid and base number increased with
increasing asphaltene content.
The mechanism for which a given crude oil to alter the rock wettability can be predicted
according to the so-called G-AB parameters (API gravity, acid number, and base number),
together with the rock materials (Buckley and Liu, 1998). In addition, Puntervold (2008)
noted that the ability of the different polar compounds to alter the rock wettability depended
on the rock type (carbonate or silica). These rocks respond differently to acidic and basic
materials due to opposite surface charges. Standnes and Austad (2000a) observed that the
acid number of the crude oil is one of the crucial factors for the wetting state of carbonate
rock. The water-wetness decreases with increasing acid number. The carbonate rocks are
typically more oil wet than sandstone cores (Treiber et al., 1972). This is because the
carbonate surface is generally positively charged below pH 8 to 9 (Pierre et al., 1990), and
will readily absorb negatively charged acidic groups (Standnes and Austad, 2003). In
16
contrast, sandstone is negatively charged above pH =2 (Menezes et al., 1989), and is able to
adsorb positively charged basic components in oil. The experimental evidence also showed
that the carboxylic material present in crude oil is the most strongly adsorbed polar organic
components onto the carbonate surface (Thomas et al., 1993). This is regarded as the main
cause of oil-wetness of most carbonate reservoirs.
Temperature is also an important parameter influencing the wettability alteration process
(Hjelmeland and Larrondo, 1986; Wang and Gupta, 1995, Liu and Buckley, 1997). However,
the temperature effect on oil wetting is still not clearly understood.
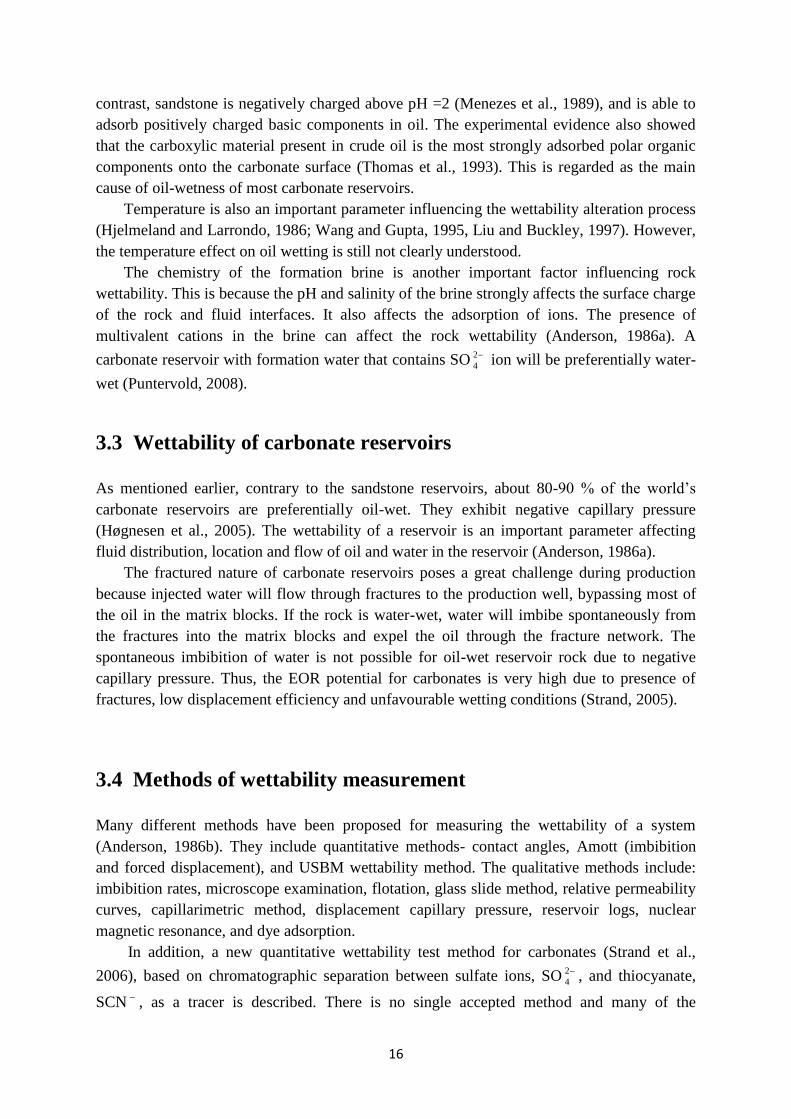
The chemistry of the formation brine is another important factor influencing rock
wettability. This is because the pH and salinity of the brine strongly affects the surface charge
of the rock and fluid interfaces. It also affects the adsorption of ions. The presence of
multivalent cations in the brine can affect the rock wettability (Anderson, 1986a). A
carbonate reservoir with formation water that contains SO 2
4 ion will be preferentially water-
wet (Puntervold, 2008).
3.3 Wettability of carbonate reservoirs
As mentioned earlier, contrary to the sandstone reservoirs, about 80-90 % of the world’s
carbonate reservoirs are preferentially oil-wet. They exhibit negative capillary pressure
(Høgnesen et al., 2005). The wettability of a reservoir is an important parameter affecting
fluid distribution, location and flow of oil and water in the reservoir (Anderson, 1986a).
The fractured nature of carbonate reservoirs poses a great challenge during production
because injected water will flow through fractures to the production well, bypassing most of
the oil in the matrix blocks. If the rock is water-wet, water will imbibe spontaneously from
the fractures into the matrix blocks and expel the oil through the fracture network. The
spontaneous imbibition of water is not possible for oil-wet reservoir rock due to negative
capillary pressure. Thus, the EOR potential for carbonates is very high due to presence of
fractures, low displacement efficiency and unfavourable wetting conditions (Strand, 2005).
3.4 Methods of wettability measurement
Many different methods have been proposed for measuring the wettability of a system
(Anderson, 1986b). They include quantitative methods- contact angles, Amott (imbibition
and forced displacement), and USBM wettability method. The qualitative methods include:
imbibition rates, microscope examination, flotation, glass slide method, relative permeability
curves, capillarimetric method, displacement capillary pressure, reservoir logs, nuclear
magnetic resonance, and dye adsorption.
In addition, a new quantitative wettability test method for carbonates (Strand et al.,
2006), based on chromatographic separation between sulfate ions, SO 2
4 , and thiocyanate,
SCN , as a tracer is described. There is no single accepted method and many of the

17
wettability measurements are also imprecise, particularly close to neutral wettability. One
method may show that a core is mildly oil-wet, while another shows that a core is mildly
water- wet (Anderson,1986b)
3.4.1 Contact angle
The contact angle method is the best measure of the wettability when pure fluids and artificial
cores are used (Anderson, 1986b). A typical oil/water/solid system is shown in Figure 3.2 and
3.3, where the surface energies in the system are related by Young’s equation. By convention,
the contact angle, θ, is measured through the water and the interfacial energy w0 is equal to
.
wsosow cos (3.1)
Contact angles can be either static or dynamic. Static contact angles are formed with a surface
under no applied force other than gravity. Dynamic contact angles are distorted from the
static case by an applied force and can advancing or receding. Advancing contact angles are
formed at the front of the encroaching wetting phase, whereas receding contact angles are
formed at the front of the encroaching non-wetting phase (Strand, 2005).
The commonly used methods in the petroleum industry are the sessile drop method and
the modified sessile drop method (Anderson, 1986b). The sessile drop method uses a single
flat, polished mineral crystal.
(a) Water Wet (b) Oil Wet
Figure 3.3: Contact angle measurements through the water phase.
After Raza et al. (1968).
The modified sessile drop method uses two flat, polished mineral crystals that are mounted
parallel to each other on adjustable posts .An oil drop is placed between the two crystals so
that it contacts a large area of each crystal (Figure 3.4a). After the oil/crystal interface has
aged for a few days, the two crystals are displaced parallel to each other. This shifts the oil
drop and allows brine to move over a portion of the surface previously covered with oil, and
this is shown in Figure 3.4b. The contacts angles measured in this manner are referred to as
water-advancing contact angles.

18
(a) (b
Figure 3.4: Principle of advancing contact angle measurements.
After Craig (1971).
One of the problems in contact-angle measurement is hysteresis, caused by a surface having
many different stable contact angles. Hysteresis is the difference between the advancing and
receding contact angles. The contact-angle hysteresis can be caused by surface roughness,
surface heterogeneity, and surface immobility on a macromolecular scale. Another setback is
that contact angle cannot take into account the heterogeneity of the rock surface.
Furthermore, no information can be gained about the presence or absence permanently
attached organic coatings on reservoir rocks (Anderson, 1986b). Contact angle provides a
direct macroscopic measure of wettability of flat surfaces, but cannot be measured in porous
media with different mineral and surface chemistry (Strand, 2005).
3.4.2 Amott method
Amott test (Amott, 159), is one of the commonly used methods of characterizing wettability
of a porous medium (Ma et al., 1999). It combines imbibition and forced displacement (of
water and oil) to measure the average wettability of a core (Anderson, 1986b).The method is
based on the fact that the wetting fluid generally imbibe spontaneously into the core,
displacing the nonwetting one. Forced displacement is either by centrifuging, as originally
proposed by Amott, or by waterfloding (Cuie, 1984). No stepwise capillary pressure values
are measured during the test. The Amott wettability measurement consists of 5 steps which
include: (1) immerse the core in oil, and measure the volume of water displaced by the
spontaneous (free) imbibition of oil after 20 hours; (2) centrifuge the core in oil until
irreducible water saturation (IWS) is reached, and measure the total amount of water
displaced, including the volume displaced by spontaneous imbibitions; (3) immerse the core
in brine, and measure the volume of oil spontaneously displaced by imbibitions of water after
20 hours; and (4) centrifuge the core in oil until residual oil saturation (ROS) is reached, and
measure the total amount of oil displaced (Anderson, 1986b). Figure 3.5 shows a complete
cycle for Amott method.

19
Figure 3.5: Capillary pressure curve for Amott and Amott-Harvey test method.
The test cycle is divided into five segments:
1. Primary drainage of water by oil to establish initial water saturation, wiS
2. Spontaneous imbibition of water
3. Forced imbibition of water
4. Spontaneous drainage of oil
5. Forced drainage of oil
The modified Amott wettability test, called Amott-Harvey relative displacement index
( AHI ) is used by some researchers (Anderson, 1986b).This method offers a single value that
can be used for mathematical modeling.
The Amott wettability indices to water WI and oil OI are defined respectively as:
WFWS
WS
wSS
SI
(3.2)
And
OFOS
OS
OSS
SI
(3.3)
Where:
WSS : the saturation change during a spontaneous imbibitions of water;
WFS : the saturation change during a forced imbibition of water;

20
OSS : the saturation change during a spontaneous drainage of oil;
OFS : the saturation change during a forced drainage of oil.
The Amott-Harvey relative displacement index is the displacement-by-water ratio minus the
displacement-by-oil ratio:
OWAH III (3.4)
Thus, this combines the two ratios into a single wettability index that varies from +1 for
complete water wetness to -1 for complete oil wetness. Cuiec (1984) further gave the index
ranges as: 13.0 AHI for water-wet system, 3.03.0 AHI for intermediate wet
system, and 3.01 AHI for oil-wet system. The Amott test gives a defined scale for the
wettability. The test is widely used and measurement is easy to perform. However, Amott
method is insensitive close to neutral wettability (Anderson, 1986b). It does not discriminate
adequately between systems that give high wettability index to water (Ma et al., 1999).
3.4.3 USBM method
The USBM test (Donaldson et al., 1969) also measures the average wettability of the core. It
has advantage over Amott wettability test because of its sensitivity close to neutral
wettability. A minor disadvantage is that USBM wettability index can only be measured on
plug-size samples because the sample must be spun in a centrifuge. Also, the USBM test also
cannot determine whether a sytem has fractional or mixed wettability.
The USBM test compares the work necessary for one fluid to displace the other. Because
of favorable free-energy change, the work required for the wetting fluid to displace the non-
wetting fluid from the core is less than the work required for the opposite displacement. It has
been shown that the required work is proportional to the area under the capillary pressure
curve. Thus, if a core is water-wet, the area under the brine-drive capillary pressure curve
(when the water displaces the oil) is smaller than area under the capillary pressure curve for
the opposite displacement (Anderson, 1986b).

21
Figure 3.6: USBM wettability measurement (Donaldson et al. 1969)
In the USBM test, after spontaneous imbibition starting at wiS is complete, the sample is then
subjected to forced displacement of oil by centrifuging with the speed increased by
increments, until capillary pressure of -10 psi is reached. A capillary pressure curve is derived
from the centrifuge data, and the area under the forced imbibition curve, A 2 , is determined,
see Figure 3.6. The core sample is then submerged in oil. After spontaneous imbibition of oil
is complete, the centrifuge method, as in the first step is used to measure the drainage curve
for displacement of water by oil. In the second step, the capillary pressures and average
saturations are measured until a capillary pressure of 10 psi is reached. The area under the
drainage curve is designated as A 1 . The USBM method uses the ratio of areas under the oil-
and brine drive curves to calculate a wettability index ( USBMWI ) according to Eq. 3.5
WI )log(2
1
A
AUSBM (3.5)
When USBMWI is greater than zero, the core is water-wet, and when USBMWI is less than zero,
the core is oil-wet. A wettability index close to zero means that the core is neautrally wet.
The larger the absolute value of USBMWI , the greater the wetting preference (Anderson,
1986b).
22
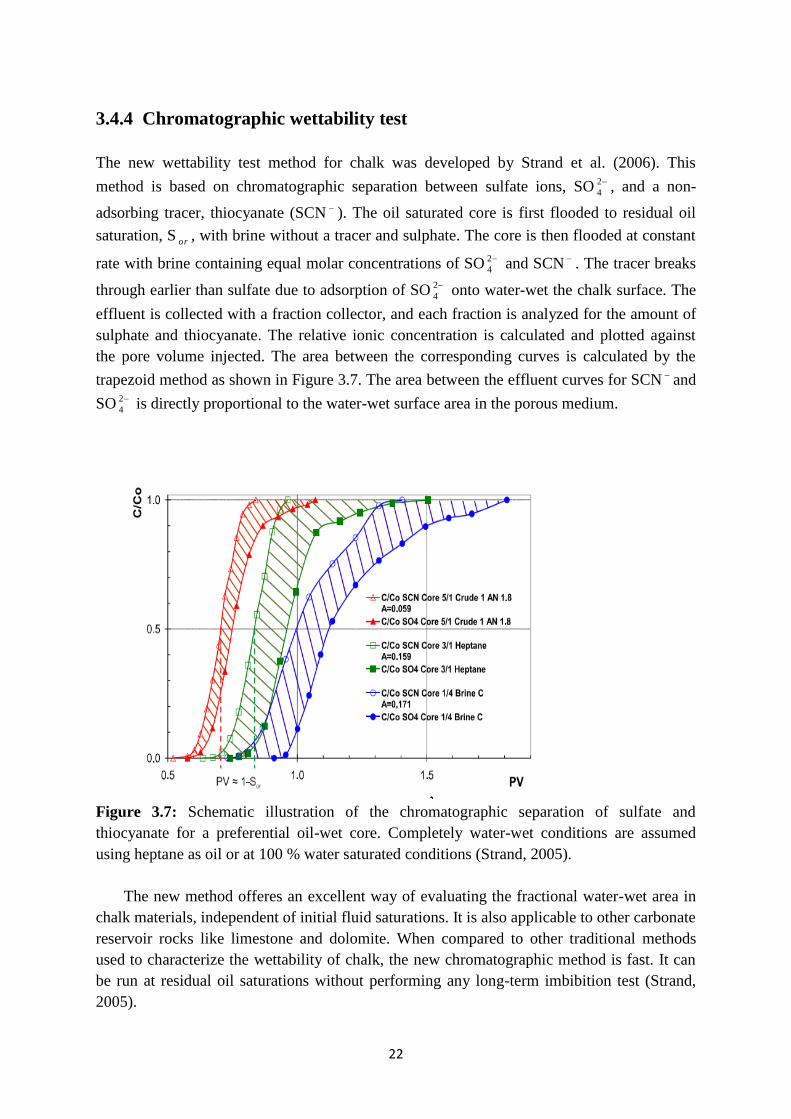
3.4.4 Chromatographic wettability test
The new wettability test method for chalk was developed by Strand et al. (2006). This
method is based on chromatographic separation between sulfate ions, SO 2
4 , and a non-
adsorbing tracer, thiocyanate (SCN ). The oil saturated core is first flooded to residual oil
saturation, S or , with brine without a tracer and sulphate. The core is then flooded at constant
rate with brine containing equal molar concentrations of SO 2
4 and SCN . The tracer breaks
through earlier than sulfate due to adsorption of SO 2
4 onto water-wet the chalk surface. The
effluent is collected with a fraction collector, and each fraction is analyzed for the amount of
sulphate and thiocyanate. The relative ionic concentration is calculated and plotted against
the pore volume injected. The area between the corresponding curves is calculated by the
trapezoid method as shown in Figure 3.7. The area between the effluent curves for SCN and
SO 2
4 is directly proportional to the water-wet surface area in the porous medium.
Figure 3.7: Schematic illustration of the chromatographic separation of sulfate and
thiocyanate for a preferential oil-wet core. Completely water-wet conditions are assumed
using heptane as oil or at 100 % water saturated conditions (Strand, 2005).
The new method offeres an excellent way of evaluating the fractional water-wet area in
chalk materials, independent of initial fluid saturations. It is also applicable to other carbonate
reservoir rocks like limestone and dolomite. When compared to other traditional methods
used to characterize the wettability of chalk, the new chromatographic method is fast. It can
be run at residual oil saturations without performing any long-term imbibition test (Strand,
2005).

23
The new wetting index ( NEWWI ) is defined as:
eHep
wettNew
A
AWI
tan
Where:
NewWI = Fraction of water-wetness
WettA = The area between the thiocyanate and sulfate curves generated by
flooding a core at S or
eHepA tan =The reference area between the thiocyanate and sulfate curves, generated by
flooding a core assumed to be completely water-wet.
According to the definition of NewWI :
NewWI = 1.0 represents a completely water-wet system
NewWI = 0.5 represents neutral wettability
NewWI = 0.0 represents a completely oil-wet system.
3.5 Spontaneous imbibition
Spontaneous imbibition can be defined as the process by which one fluid displaces another
from a porous medium as a result of capillary forces only. It has been widely studied because
of its importance in oil recovery, with much emphasis on carbonate rocks. Water imbibition
is fundamental to both waterflood and steamdrive performance in low permeability reservoir
rocks such as diatomite and chalk. Imbibition is an immiscible displacement process whereby
a non-wetting fluid within a porous medium, is spontaneously expelled by wetting fluid that
surrounds the medium. Wetting fluid is drawn into the medium by capillary suction. This
phenomenon is caused by the differential attraction forces between the pore walls and fluids.
The spontaneous imbibtion could be described by either a diffusion-like equation or a frontal-
advance equation, depending on assumptions.
However, the rate of imbibition is primarily dependent on the rock permeability, pore
structure, wettability, and the interfacial tension between the resident fluid and the imbibing
phase. On a macroscopic scale, capillary imbibitions forces determine in part, how rapidly
and easily a hydraulically fractured water injector injects water into a low permeability
formation. They also determine at what rate the injected water propagates. In naturally
fractured system with high degree of interconnectedness, imbibition forces must be strong for
a waterflood to be successful. If they are not, water will propagate through the fracture
network from injector to producer and the waterfood will fail.
24
3.6 Seawater as a wettability modifier in chalk reservoirs
Some of the previous work that investigated the spontaneous imbibition mechanism in chalk
was performed with surfactants. Strand et al. (2003) discovered that sulfate ions present in the
imbibing fluid catalyzed the wettability alteration process. The result initiated another work
(Strand et al., 2006) to explore the potential of sulphate as a wettablity alteration agent, using
seawater as the imbibing fluid. Seawater contains a large amount of sulfate. The spontaneous
imbibition tests showed that seawater was able to alter the wetting of chalk and improve oil
recovery.
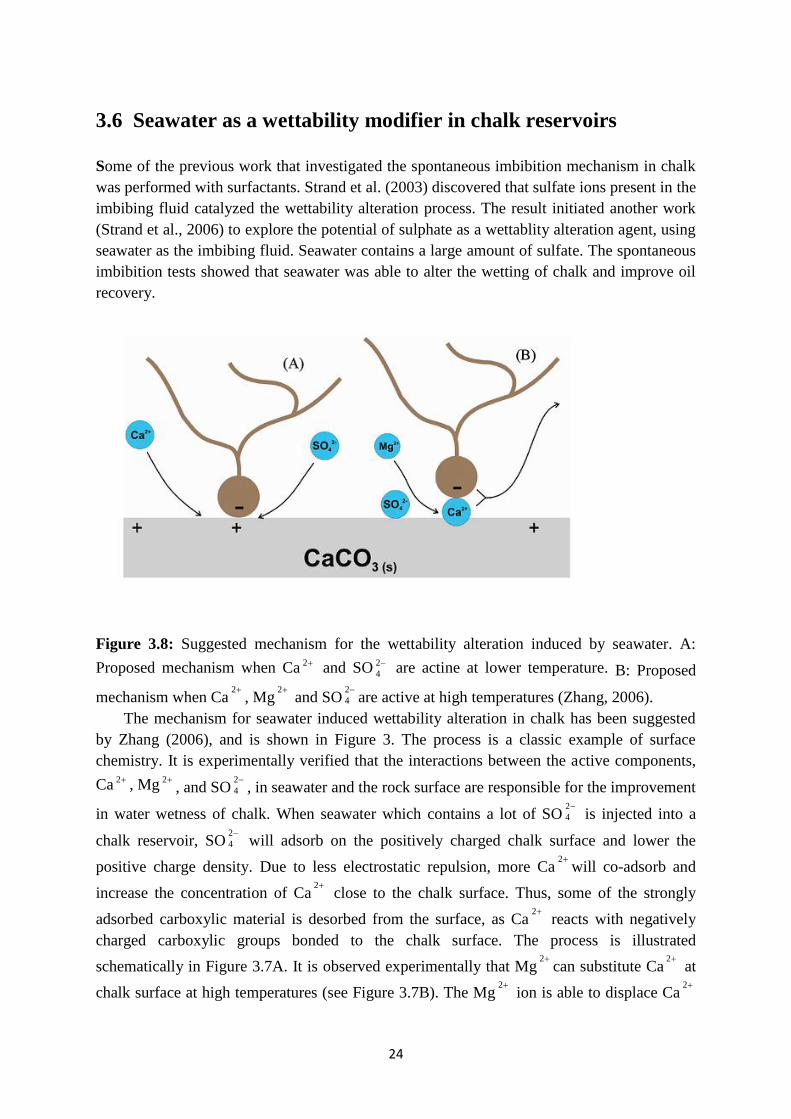
Figure 3.8: Suggested mechanism for the wettability alteration induced by seawater. A:
Proposed mechanism when Ca 2 and SO 2
4 are actine at lower temperature. B: Proposed
mechanism when Ca2
, Mg2
and SO2
4 are active at high temperatures (Zhang, 2006).
The mechanism for seawater induced wettability alteration in chalk has been suggested
by Zhang (2006), and is shown in Figure 3. The process is a classic example of surface
chemistry. It is experimentally verified that the interactions between the active components,
Ca 2 , Mg 2, and SO
2
4 , in seawater and the rock surface are responsible for the improvement
in water wetness of chalk. When seawater which contains a lot of SO2
4 is injected into a
chalk reservoir, SO2
4 will adsorb on the positively charged chalk surface and lower the
positive charge density. Due to less electrostatic repulsion, more Ca2
will co-adsorb and
increase the concentration of Ca2
close to the chalk surface. Thus, some of the strongly
adsorbed carboxylic material is desorbed from the surface, as Ca2
reacts with negatively
charged carboxylic groups bonded to the chalk surface. The process is illustrated
schematically in Figure 3.7A. It is observed experimentally that Mg2
can substitute Ca2
at
chalk surface at high temperatures (see Figure 3.7B). The Mg2
ion is able to displace Ca2

25
linked to carboxylic groups on the chalk surface, provided that access is obtained through the
aqueous phase. The combined effects remove the organic material, making the chalk surface
to be less oil-wet.
In addition, the affinity of 2
4SO towards chalk surface increases with temperature
(Strand et al., 2006). By using the chromatographic separation, the area between SCN and
SO 2
4 is a measure of the affinity of the sulfate towards the chalk surface. The concentration
of sulfate present in the imbibing fluid and temperature are important determining
parameters. The SI rate increases with increasing concentration of SO 2
4 , due to increased
rate of diffusion of the ion towards the imbibing front. In effect, the ability of seawater to act
as a wettability modifier of oil-wet chalk depends on the presence of the potential
determining ions and temperature. And these ions could only be active in the aqueous phase,
provided by the seawater. Thus, seawater can be modified to contain these ions in proper
concentration to improve oil recovery from fractured chalk or limestone reservoirs.
26
4 Materials and Methods
4.1 Materials
4.1.1 Core materials
Outcrop chalk from Stevns Klint near Copenhagen, Denmark, was used as the porous
medium. The chalk is of Maastrichtian age and highly porous. The material is homogeneous
and composed mainly of fine-graded coccolithic matrix, similar to North Sea chalk oil
reservoirs. The porosity is in the range of 44-50 %, with low permeability in the range of 1-2
mD. A single chalk grain has a general size of 1μm, and has large surface area of
approximately 2 m 2 /g (Røgen and Fabricious, 2002).
4.1.2 Analytical methods
Density measurements
The density measurements of the oil samples were performed on an Anton Parr DMA 4500
Density Meter. The instrument can be found in Appendix A.3. The measurements were done
at 20°C. The instrument was first cleaned with white spirit, and then with acetone. A small
amount of the oil sample was injected gradually into the tube and the density was determined.
The sample should be free of gas bubbles and the measurements were repeated to ensure
accuracy.
Viscosity measurements
The viscosity measurements were performed on a Physica UDS 200 Universal Dynamic
Spectrometer (see Appendix A.4). The measurements were done at 20°C. The shear rates
were set between 10-1000 1/s. and the instrument accuracy was tested deionized (DI) water.
About 2.2 ml of the oil sample fluid was placed on the metal plate. Then, the apparatus was
set in measuring position with the plates close to each other The viscosity of the oil was
determined through shear stress/shear rate relation.
Acid and base number determination
A Mettler Toledo DL55 automatic titrator was used to measure the acid and base number of
different oil samples. The methods used, developed by Fan and Buckley (2007), involved
potentiometric titrations using an internal standard. They are the modified versions of ASTM
D2896 for base number (AN) and ASTM D664 for acid number (AN) titration. See Appendix
A.5 for more details.

27
4.1.3 Oil samples
Heidrum oil
The acid number is the important wetting parameter for chalk, and by vary the acid number it
is possible to change the initial wetting of the chalk core. The biodegraded Heidrun crude oil
with AN=2.80 and BN=0.74 mgKOH/g oil, was used as the base crude oil. This oil was
sampled from a new well during a well-test.
RES40
The oil was prepared by diluting Heidrun oil with n-heptane in the ratio of 60:40 by volume.
Then, the oil was centrifuged and filtered through a 0.65 μm Millipore filter to remove any
unconsolidated particles that were present in the crude oil. The acid and base numbers were
AN = 1.80 and BN = 0.42 mg KOH/g oil. No precipitation of asphaltenes was observed
during storage.
RES40-0
The oil was prepared by adding 10 wt% silica gel to RES40 crude oil in two steps to remove
surface active polar components like carboxylic material. After stirring the mixture on a
magnetic stirrer for 6 days, the mixture was centrifuged to separate the oil from silica gel
which settled at the bottom of the centrifuge bottle. Then, the oil was filtered through a 0.65
μm Millipore filter. The AN and BN were both zero.
SC Oil
The RES40 and RES40-0 oil samples were mixed by mass in the ratio of 20:80, to get
synthetic crude oil. The acid and base numbers of the oil were AN=0.50 and BN=0.30 mg
KOH/g oil respectively. This oil was used in all the SI tests. The densities, viscosities, acid
and base numbers of all the oil samples were measured according to the procedures outlined
earlier. The results are presented in Table 4.1
Table 4.1: Oil properties
Oil type μ (cP) ρ (g/cm 3 ) AN (mg KOH/g oil) BN (mg KOH/g oil)
Heidrun 20.47 0.886 2.80 0.74
Res40 3.17 0.809 1.80 0.42
Res40-0 2.44 0.801 0.00 0.00
SC Oil 2.53 0.800 0.50 0.30

28
4.1.4 Brines
The different brines used as the imbibing fluids with their compositions are given in Table
4.2.The salts that were used in preparing the fluids included: NaHCO 3 , KCl, NaCl, MgCl 2
.6H 2 O, CaCl 2 .2H 2 O and Na 2 SO 4 . NaCl was only added when preparing the following
brines SW, SW0T, SW1/2T and VB0S. In addition, KSCN and LiCl were added when
preparing SW1/2T. All salts were PA-graded and delivered by Merck. The required amount
of different salts was dissolved in the deionized (DI) water. Then, the brine was stirred on a
magnetic stirrer for about 2 hours to ensure homogeneous mixture. It was filtered through a
0.22 μm Millipore filter to remove undissolved salt particles that might block pore throats
during the SI tests. The stirring and filtration set-ups can be found in Appendix A.2.
Table 4.2: The compositions and properties of the brines.
Brines
Ions VB0S
(mol/l)
SW
(mol/l)
SW0NaCl
(mol/l)
SW4S0NaCl
(mol/l)
SW0T
(mol/l)
SW1/2T
(mol/l)
HCO
3 0.009 0.002 0.002 0.002 0.002 0.002
Cl 1.070 0.525 0.126 0.126 0.583 0.538
SO 2
4 0.000 0.024 0.024 0.096 0.000 0.012
SCN 0.000 0.000 0.000 0.000 0.000 0.012
Mg 2 0.008 0.045 0.045 0.045 0.045 0.045
Ca 2 0.029 0.013 0.013 0.013 0.013 0.013
Na 1.000 0.450 0.050 0.194 0.460 0.427
K 0.005 0.010 0.010 0.010 0.010 0.022
Li 0.000 0.000 0.000 0.000 0.000 0.012
Ionic
Strength
1.112
0.657
0.257
0.473 0.643 0.645
TDS (g/l)
62.80
33.39
10.01
16.79 33.39 33.39
The VB0S was used as the reference brine. It was similar in composition to the Valhall
formation water.
As the spontaneous imbibing brine, SW was synthetic seawater. This brine was termed
“smart water”. The modified seawater was obtained by changing the salinity and the ionic
composition of SW. “Smartness” in this context refers to the ability of seawater to alter the
wetting nature of chalk to improve oil recovery.
For SW0NaCl, NaCl was not added to the composition of SW. This fluid was referred to as
“Smarter Water”.

29
The brine SW4S0NaCl, was SW depleted in NaCl and spiked with 4 times the concentration
of sulfate. The brine was regarded as “Smartest Water”.
Both SW0T and SW1/2T, were used for the chromatographic wettability tests. The SW0T
was SW without SO 2
4 . The brine SW1/2T, was SW with SCN and Li as tracers. The
concentrations of Ca 2 and Mg 2 respectively in all the brines except VB0S were kept
constant.
4.2 Core preparation
Initial core preparation
All cores were prepared in similar way to establish initial reservoir conditions. The procedure
for core preparation was similar to the standard method described by Standnes and Austad
(2000a). All cores used for the SI experiment, were drilled from the same chalk block with an
oversized core bit in the same direction. They were dried at 90°C to a constant weight, and
shaved to a diameter (~ 3.8 cm) using lathe. Then, they were cut with a diamond saw to the
same length (~ 7.0 cm).
The next step was removal of easily dissolvable salt. The core was evacuated to remove
any trapped gases, and then saturated with DI water under vacuum for 2 hours. Then, the core
was placed in a Hassler core holder (see Appendix A.7) with a confining pressure of 25bar.
The core was flooded at 90°C, with 250ml of DI water at the rate of 0.2 ml/min. The removal
of dissolvable sulfates present in the core was confirmed by a batch test, showing no
precipitation of 4BaSO when barium chloride was added to the effluent. Then, the core was
dried in the oven to a constant weight at 90°C. Equation 4.1 represents the chemical reaction
for a batch test.
Ba 2)(aq + S SO 2
4 )(aq → BaSO 4 (4.1)
Establishing initial water saturation ( wiS )
The core was saturated under vacuum with the brine (VB0S) for 2 hours. The pore volume
and porosity of the core were determined by considering the weight difference after
saturation (Eq.4.2 &4.3).
VBOS
drysat
p
MMV
(4.2)
100*b
p
V
V (4.3)
pSVB
drys
wiV
MMS wi
1*)(
0
(4.4)

30
Where:
pV = pore volume; satM = weight of the core at 100 % VB0S saturation;
dryM = dry weight of the core; wisM = weight of the core at initial water saturation; SVB0 =
density of VB0S; bV = core bulk volume; and Ф = porosity of the core (%).
To establish wiS of 10 %, the 100 % VB0S-saturated cores were drained on a porous plate,
using water-saturated nitrogen gas. As the pressure in the porous plate was gradually
increased to 8.5bar, the total water saturation decreased. The initial water saturation for the
core was determined using Equation 4.3. Also, the description of the porous plate technique
can be found in Appendix A.8.
Establishing initial oil saturation and aging
To establish the initial oil saturation, the core was placed in a Hassler core holder. A
confining pressure of 25bar was applied to ensure good sealing between the core and rubber
sleeve. Also, a backpressure of 10bar kept the fluid from boiling at high temperature. The
core was vacuumed for 15 min and saturated with SC oil. Then, it was flooded at 50°C with
1.5 PV of the oil in each direction, at the rate of 0.2 ml/min.
After flooding the cores with SC oil, they were wrapped with Teflon tape to prevent
unrepresentative adsorption of polar components on the chalk surface. Then, the cores were
put in the aging cells, surrounded with the oil. They were aged 4 weeks at 90°C. The initial
oil saturation ( oiS ) of the cores were determined using Equation 4.7, knowing the volume of
the oil in the core after aging. Table 4.3 presents the properties of all cores used in the SI tests
at different temperature.
VBOSpo VVV (4.5)
SVB
drys
SVB
MMV wi
0
0
(4.6)
p
o
oiV
VS (4.7)
Where:
oiS = initial oil saturation; SVBV 0 = volume of VB0S in the core before aging;
oV = volume of oil in the core after aging.
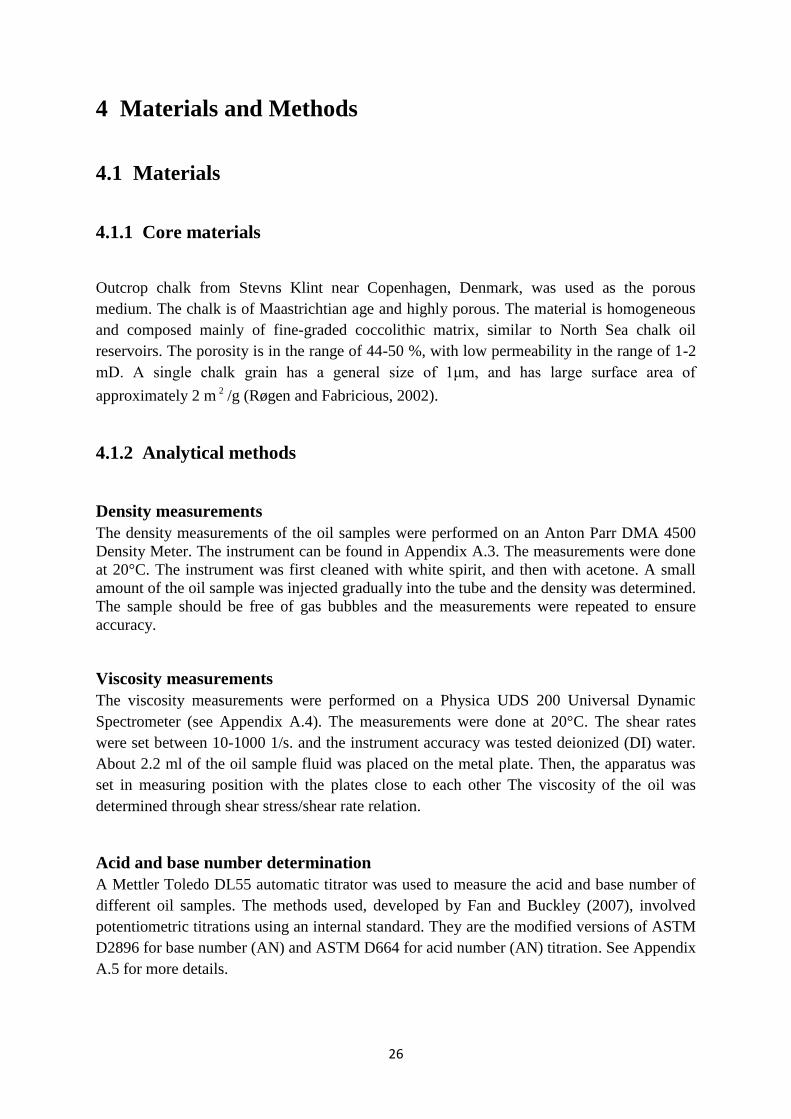
31
Table 4.3: Core Properties
Core
ID
L
(cm)
D
(cm)
bV
(cm 3 )
pV
(cm 3 )
Ф
(%)
wiS
(%)
oiS
(%)
Comments
SK#1 7.02 3.80 79.61 37.91 48 10 90
SI at 90 ⁰C
SK#2 7.00 3.80 79.39 37.08 47 10 90 -
SK#3 7.02 3.79 79.20 36.27 46 11 89 SI at 90 ⁰C
SK#4 7.00 3.79 78.97 38.34 49 9 - -
SK#5 7.02 3.80 79.61 37.13 47 9 91 SI at 90 ⁰C
SK#6 7.02 3.80 79.61 36.74 46 10 90 SI at 90 ⁰C
SK#7 7.01 3.81 79.92 36.98 46 11 89 SI at 70 ⁰C
SK#8 7.00 3.81 79.81 35.37 44 11 89 SI at 70 ⁰C
SK#9 7.01 3.81 79.92 35.53 44 10 90 SI at 70 ⁰C
4.3 Spontaneous imbibition tests
The SI at 90°C (Steel cell)
Four different SI tests were performed at 90°C:
The SI with VB0S - VB0S and the reference core represented a system with no
chemical wettability alteration
The SI with SW - the brine which has be defined as a “Smart Water”
The SI with SW0NaCl - the brine confirmed to be “Smarter Water”
The SI with SW4S0NaCl - the brine with increased concentration of sulfate and was
termed the “Smartest Water”.
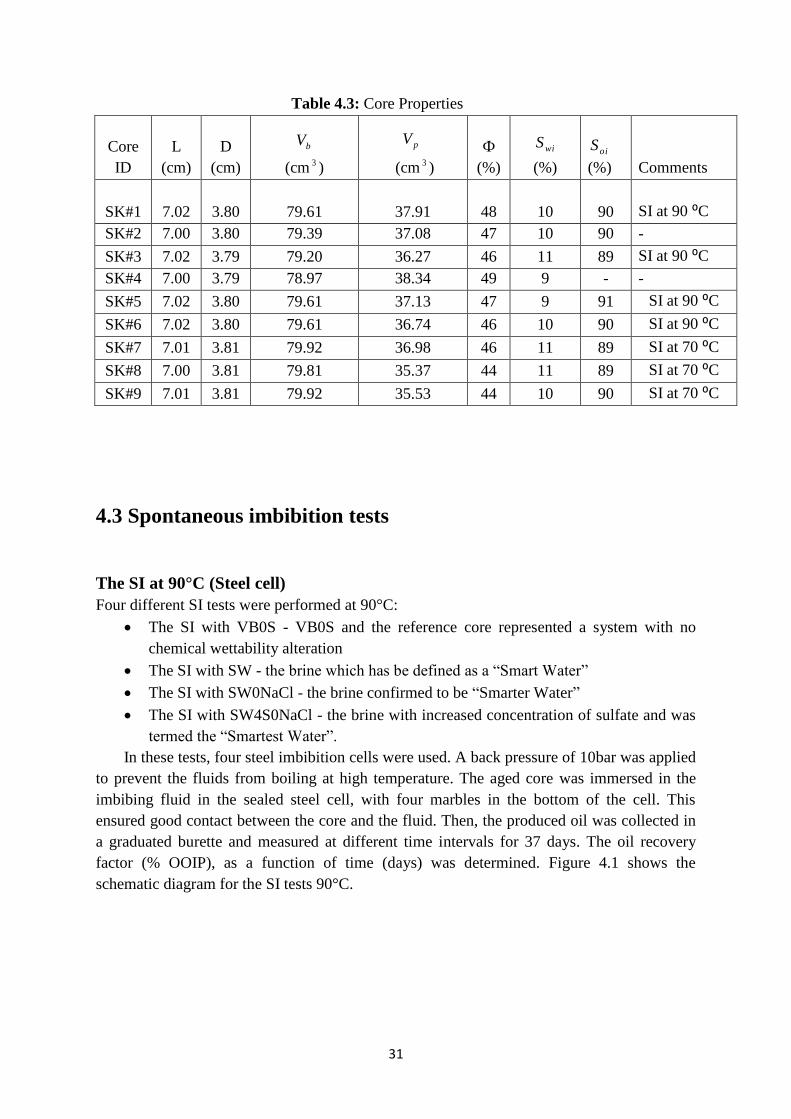
In these tests, four steel imbibition cells were used. A back pressure of 10bar was applied
to prevent the fluids from boiling at high temperature. The aged core was immersed in the
imbibing fluid in the sealed steel cell, with four marbles in the bottom of the cell. This
ensured good contact between the core and the fluid. Then, the produced oil was collected in
a graduated burette and measured at different time intervals for 37 days. The oil recovery
factor (% OOIP), as a function of time (days) was determined. Figure 4.1 shows the
schematic diagram for the SI tests 90°C.
32
Figure 4.1: The SI test unit at higher temperature (Zhang, 2006)
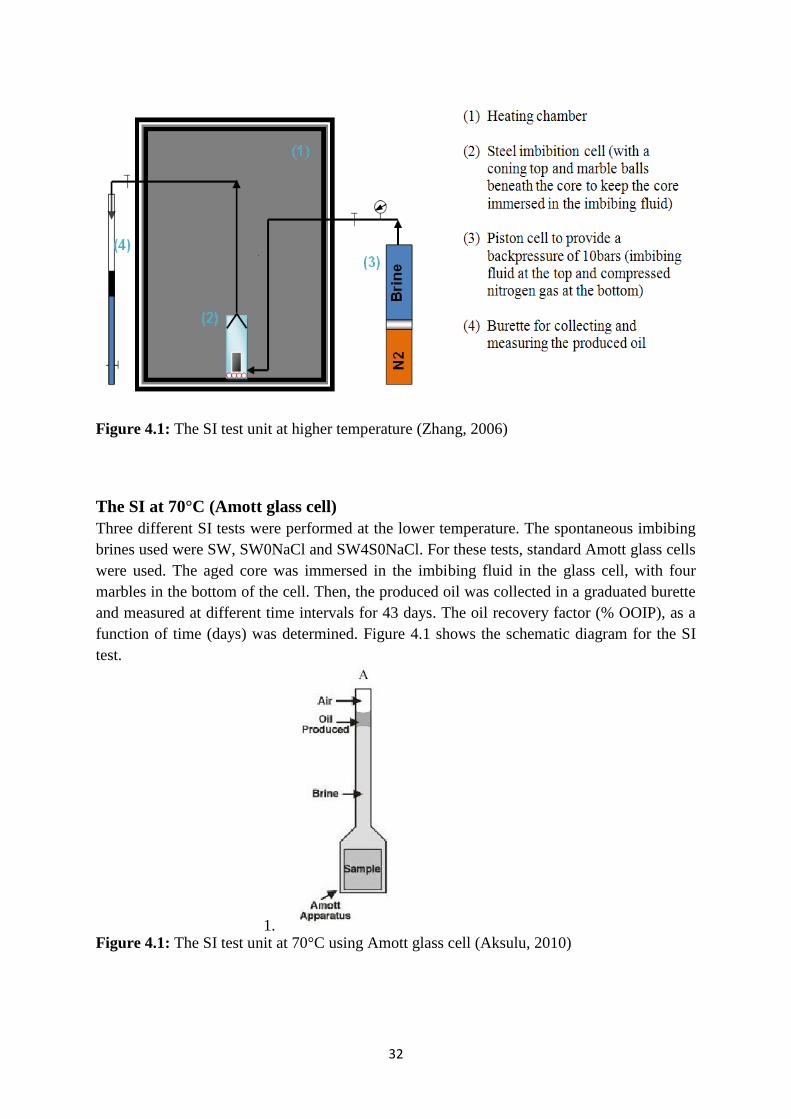
The SI at 70°C (Amott glass cell)
Three different SI tests were performed at the lower temperature. The spontaneous imbibing
brines used were SW, SW0NaCl and SW4S0NaCl. For these tests, standard Amott glass cells
were used. The aged core was immersed in the imbibing fluid in the glass cell, with four
marbles in the bottom of the cell. Then, the produced oil was collected in a graduated burette
and measured at different time intervals for 43 days. The oil recovery factor (% OOIP), as a
function of time (days) was determined. Figure 4.1 shows the schematic diagram for the SI
test.
1. Figure 4.1: The SI test unit at 70°C using Amott glass cell (Aksulu, 2010)

33
4.4 Chromatographic wettability test.
The chromatographic wettability test was used to determine the water-wet surface area of the
chalk core after spontaneous imbibition with the imbibing brine. The test is based on the
chromatographic separation between non-adsorbing tracer, SCN , and sulfate ion, SO 2
4 .
The core was placed in a Hassler core holder and a confining pressure of 25bar was
applied. The core was flooded at constant back pressure of 10 bars with at least 2.0 PV of
SW0T brine (without SO 2
4 and tracers) at the rate of 0.20ml/min. This was followed by
another 2.0 PV at the rate of 0.40 ml/min, to establish residual oil saturation ( orS ). The rate
was again reduced to 0.20 ml/min and the effluent was checked for SO 2
4 . After at least 1.0
PV was injected and no SO 2
4 was observed in the effluent, the injection fluid was changed to
SW1/2T brine (containing SO 2
4 , and the tracers SCN- and Li
+). The effluent was collected in
fractions of 1-4 ml using a fraction collector (see Figure 4.2). Totally, more than 2.0 PV of
SW1/2T was injected.
Each fraction was diluted 200 times with DI water, using Gilson GX-271 Liquid
Handler. It was filtrated and transferred to 1.5ml HPLC glasses. The samples were analysed
for concentrations of SO 2
4 and tracer, SCN-, using Dionex ICS-3000 Ion Chromatograph.
The concentration of each ion relative to the initial concentration was plotted against the
injected pore volume. The area between the tracer and the sulfate curves is directly
proportional to the water-wet surface area inside the core. This is based on the fact that the
chromatographic separation takes place only at the water-wet sites. The area ratio between
the tracer and sulfate curves of the sample, A wet , and a reference cleaned water-wet core,
A ref . The wettability index (WI) is a measure of the water-wet surface fraction of the core
sample.
ref
wet
A
AWI (4.3)
Where: WI = 0 is completely oil-wet, WI = 0.5 is neutral wettability, and WI = 1, is
completely water-wet.
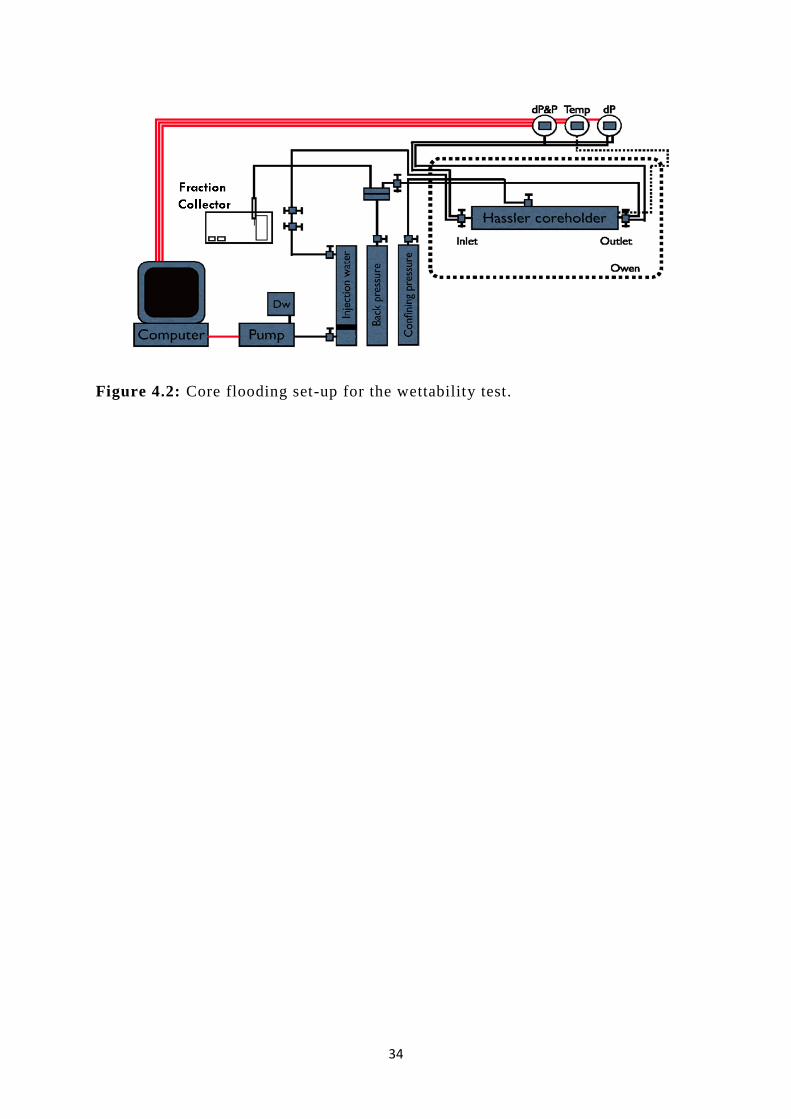
34
Figure 4.2: Core flooding set-up for the wettability test.

35
5 Results and Discussion
In this section, the results of the SI and chromatographic wettability tests are presented and
discussed.
5.1 Spontaneous imbibition at 90°C.
Four cores with the same initial conditions were used. The 10% initial water saturation was
established using porous plate technique. The cores were saturated, flooded and aged with SC
oil (with AN= 0.5mgKOH/g oil). The cores were imbibed in steel cells with different
imbibing brines (VB0S, SW, SW0NaCl, and SW4S0NaCl), at 90°C. The results of the SI
tests are presented in Figure 5.1.
Figure 5.1: The effects of modifying the salinity and the ionic compositions on oil recovery
from oil-saturated chalk cores with different imbibing brines (VB0S, SW, SW0NaCl and
SW4S0NaCl). Conditions: imT = 90°C, wiS ≈ 10 %.
The SI with formation brine (VB0S) gave a recovery plateau of 17 % after 30 days.
UsingVB0S as the imbibing fluid, no chemical wettability alteration was expected to take
place and the result represented the initial wetting condition of the core. Close to 7 % of the
recovery could be due to thermal expansion. The result indicated that the core behaved
slightly water-wet.
0 %
20 %
40 %
60 %
0 10 20 30 40 50
Re
cove
ry F
acto
r (%
OO
IP)
Time (days)
SW SK#6
SW0NaCl SK#3
SW4S0NaCl SK#5
VB0S SK#1
36
The second core was imbibed with SW. The recovery plateau of 38 % was reached after 34
days. The effect of using “Smart Water” can be easily seen. A 21 % increase in oil recovery
compared to the brine (VB0S) with no ability to change the wetting condition, was observed.
The third core was imbibed with SW0NaCl. The ultimate recovery from this core was 46%
after 31 days. By using the brine with reduced concentrations of non-active ions (Na and
Cl ), an additional 29 % of OOIP was recovered compared to the formation brine.
The fourth core was imbibed with SW4S0NaCl. This imbibing brine was regarded as the
“Smartest Water”. The concentration of sulfate in SW was increased 4 times to obtain the
brine. The SI with the brine gave a recovery plateau of 62 % after 31 days. This was the oil
recovery normally obtained for a completely water-wet core. In comparison to VB0S, a 45 %
increase in the recovery was obtained. The result showed that the rate of imbibition was
greatly improved due to the catalytic effect of sulfate and reduced concentration of the non-
active ions.
The performance of different imbibing brines showed that oil recovery could be
improved by modifying the salinity and the ionic composition of SW. Both Na and Cl
ions were regarded as the non-active ions in the SI process. Reducing the concentrations of
these ions, gave the active ions (SO 2
4 and Ca 2 ) easier access to the chalk surface. This
equally reduced the salinity of seawater.
The sulfate ion, SO 2
4 , present in seawater acted as a catalyst in the wettablity alteration
mechanism As SO 2
4 adsorbed onto the chalk surface, there was co-adsorption of Ca2
to
release the adsorbed carboxylic material This reduced the concentration of sulfate at the
imbibition front. Thus, increasing the concentration of sulfate, increased both the imbibition
rate and the ultimate recovery.

37
5.2 Spontaneous imbibition at 70°C
Three cores with the same initial conditions were used. The 10% initial water saturation was
established using porous plate technique. The cores were saturated, flooded and aged with SC
oil (with AN= 0.5mgKOH/g oil). The cores were imbibed in standard Amott glasses with
different imbibing brines (SW, SW0NaCl, and SW4S0NaCl) at 90°C. The results of the SI
tests are presented in Figure 5.2.
Figure 5.2: The effects of modifying the salinity and the ionic compositions on oil recovery
from oil-saturated chalk cores with different imbibing brines (SW, SW0NaCl and
SW4S0NaCl). Conditions: imT = 70°C, wiS ≈ 10 %.
The first core was imbibed with SW and a recovery plateau of 41 % was reached after 39
days. This showed that SW could be used as a wettability modifier for a slightly water-wet
chalk core at temperature close to 70°C.
The second core was imbibed with SW0NaCl. The SI with the brine gave a recovery plateau
of 46 % after 39 days. The increment was to the modification in the salinity and the ionic
composition of seawater.
The spontaneous imbibing brine for the third core was SW4S0NaCl. The ultimate recovery
from the core was 51 % of OOIP. The brine was confirmed to be the “smartest water”, as
both imbibition rate and oil recovery were improved.
0 %
20 %
40 %
60 %
0 10 20 30 40 50
Re
cove
ry F
acto
r (%
OO
IP)
Time (days)
SW SK#9
SW0NaCl SK#8
SW4S0NaCl SK#7
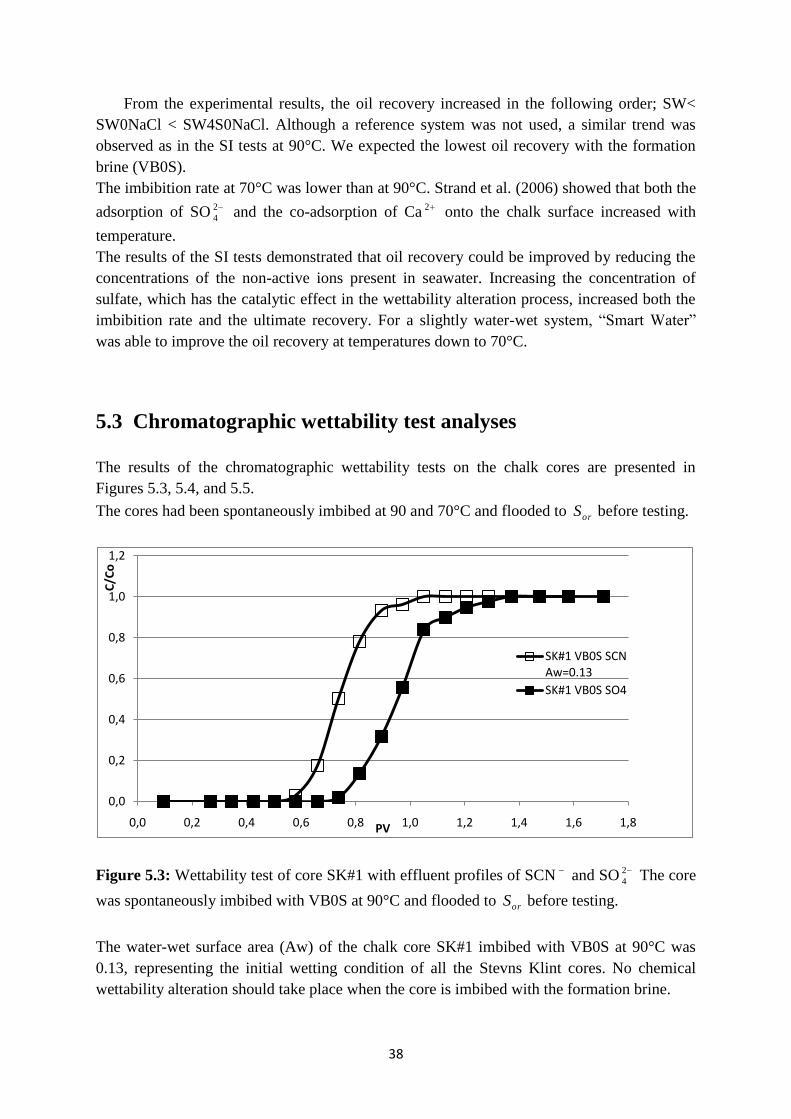
38
From the experimental results, the oil recovery increased in the following order; SW<
SW0NaCl < SW4S0NaCl. Although a reference system was not used, a similar trend was
observed as in the SI tests at 90°C. We expected the lowest oil recovery with the formation
brine (VB0S).
The imbibition rate at 70°C was lower than at 90°C. Strand et al. (2006) showed that both the
adsorption of SO 2
4 and the co-adsorption of Ca 2 onto the chalk surface increased with
temperature.
The results of the SI tests demonstrated that oil recovery could be improved by reducing the
concentrations of the non-active ions present in seawater. Increasing the concentration of
sulfate, which has the catalytic effect in the wettability alteration process, increased both the
imbibition rate and the ultimate recovery. For a slightly water-wet system, “Smart Water”
was able to improve the oil recovery at temperatures down to 70°C.
5.3 Chromatographic wettability test analyses
The results of the chromatographic wettability tests on the chalk cores are presented in
Figures 5.3, 5.4, and 5.5.
The cores had been spontaneously imbibed at 90 and 70°C and flooded to orS before testing.
Figure 5.3: Wettability test of core SK#1 with effluent profiles of SCN and SO 2
4 The core
was spontaneously imbibed with VB0S at 90°C and flooded to orS before testing.
The water-wet surface area (Aw) of the chalk core SK#1 imbibed with VB0S at 90°C was
0.13, representing the initial wetting condition of all the Stevns Klint cores. No chemical
wettability alteration should take place when the core is imbibed with the formation brine.
0,0
0,2
0,4
0,6
0,8
1,0
1,2
0,0 0,2 0,4 0,6 0,8 1,0 1,2 1,4 1,6 1,8
C/C
o
PV
SK#1 VB0S SCN Aw=0.13
SK#1 VB0S SO4

39
Figure 5.4: Wettability test of cores (SK#6, SK#3, and SK#5) with effluent profiles of SCN
and SO 2
4 .The cores were spontaneously imbibed with (SW, SW0NaCl, and SW4S0NaCl)
respectively at 90°C, and flooded to orS before testing
The core SK#6 imbibed with SW had a water-wet surface area of 0.16. The effect of using
seawater was seen. The Aw of the core increased because the wettabiliy alteration process
had taken place.
The Aw of the core SK#3 spontaneously imbibed with SW0NaCl was 0.17. The increment in
the area was due to the modification in the salinity and the ionic composition of the seawater.
The Aw of the core SK#5 imbibed with SW4S0NaCl was 0.17. The water-wetness of the
core was improved by increasing the “smartness” of seawater.
0,0
0,2
0,4
0,6
0,8
1,0
1,2
0,0 0,2 0,4 0,6 0,8 1,0 1,2 1,4 1,6 1,8 2,0
C/C
o
PV
SK#6 SW SCN Aw=0.16
SK#6 SW SO4
SK#3 SW0NaCl SCN Aw=0.17
SK#3 SW0NaCl SO4
SK#5 SW4S0NaCl SCN Aw=0.18
SK#5 SW4SNaCl SO4

40
Figure 5.5: Wettability test of cores (SK#6, SK#3, and SK#5) with effluent profiles of SCN
and SO 2
4 .The cores were spontaneously imbibed with brines (SW, SW0NaCl, and
SW4S0NaCl) respectively at 70°C, and flooded to orS before testing
The Aw of the core SK#9 spontaneously imbibed with SW at 70°C was 0.13.
The core SK#8 imbibed with SW0NaCl was 0.19. The water-wetness of the core was
improved by modifying the salinity and the ionic composition of seawater.
The water-wet surface area of the core SK#7 imbibed with SW4S0NaCl was 0.20. The water-
wetness of the core was increased by improving the “smartness” of seawater.
A similar trend was observed both at 90 and 70°C, though seawater was less effective at
70°C. The wettability tests confirmed the chemical wettability alteration process. The results
showed the effect of modifying the salinity and the ionic composition of seawater. The chalk
core became more water-wet with increasing “smartness” of the imbibing fluid.
0
0,2
0,4
0,6
0,8
1
1,2
0 0,2 0,4 0,6 0,8 1 1,2 1,4 1,6 1,8 2
C/C
o
PV
SK#9 SW SCN Aw=0.13
SK#9 SW SO4
SK#8 SW0NaCl SCN Aw=0.19SK#8 SW0NaCl SO4
SK#7 SW4S0NaCl SCN Aw=0.20 SK#7 SW4S0NaC SO4
41
6 Conclusions
The main objective of the project was to modify the salinity and the ionic composition of
seawater to improve the ultimate oil recovery in the slightly water wet chalk cores. The
conclusion can be briefly summarized as:
The imbibition rate and ultimate recovery were increased by reducing the
concentration of non-active ions like Na
and Cl
in seawater.
A decrease in the concentrations of non-active ions, Na and Cl reduced the salinity
and improved the reactivity of the surface active ions, SO2
4 and Ca2
. The ions will
have easier access to the chalk surface.
Increasing the sulphate concentration which has a catalytic effect on the wettability
alteration, improved both the imbibition rate and ultimate recovery.
For slightly water-wet systems, improved oil recovery with “Smart Water” was
observed both at 90 and 70°C.
The chromatographic wettability tests confirmed the chemical wettability alteration
process. The results showed that the water-wetness of the chalk core increased with
increasing “smartness” of seawater.
42
References
1. Aksulu, H., 2010. “Effect of Core Cleaning Solvents on Wettability Restoration and Oil
Recovery by Spontaneous Imbibition in Surface Reactive, Low Permeable Limestone
Reservoir Core.” M.Sc. Thesis University of Stavanger, Norway.
2. Al-Hadhrami, H.S. and Blunt, M. J., 2000. “Thermally Induced Wettability Alteration
to Improve Oil Recovery in Fractured Reservoir.” Paper SPE 59289 presented at
SPE/DOE Improved Oil Recovery Symposium, Tulsa , OK, USA, April 3-5
3. Amott, E., 1959. “Observations Relating to the Wettability of Porous Rock.” Petroleum
Transactions, AIME, pp. 156-162.
4. Andersen, M.A., 1995. “Petroleum Research in North Sea Chalk.” Amoco Norway Oil
Company and RF –Rogaland Research. ISBN 82-7220-725-7.
5. Anderson, W.G., 1986a. “Wettability Literature Survey - Part 1: Rock /Brine/Oil
Interactions and the Effects of Core Handling on Wettability.” Journal of Petroleum
Technology, October, 1125-1144.
6. Anderson, W.G., 1986b. “Wettability Literature Survey - Part 1: Rock/Oil/Brine
Interactions and the Effects of Core Handling on Wettability.” Journal of Petroleum
Technology, October, pp. 1125-1144
7. Anderson, W.G., 1986b. “Wettability Literature Survey - Part 2: Wettability
Measurements.” Journal of Petroleum Technology, November, pp.1246-1262.
8. Anderson, W.G., 1987. “Wettability Literature Survey-Part 6: The Effect of Wettability
on Waterflooding.” Journal of Petroleum Technology, December, pp.1605-1622.
9. ASTM, I, 1988. “ASTM 2896-88 Standard test method for base number of petroleum
products by potentiometric perchloric acid titration, in Annual Book of ASTM
Standards.” Philadelphia.
10. ASTM, I, 1988. “ASTM 664-89 Standard test method for acid number of petroleum
products by potentiometric titration, in Annual Book of ASTM Standards.”
Philadelphia.
11. Austad, T.; Matre, B.; Milter, J.; Sævareid, A.; and Øyno, L. , 1998. “Chemical
Flooding of Oil Reservoir 8. Spontaneous Oil Expulsion from Oil-and Water-wet Low
Permeable Chalk Material by Imbibition of Aqueous Surfactant Solutions.” Colloids
and Surfaces A: Physiochemical and Engineering Aspects, 137, 117-129.
12. Austad, T. and Milter, J., 1997. “Spontaneous Imbibition of Water into Low Permeable
Chalk at Different Wettabilities Using Surfactants.” Paper SPE 37236 presented at the
International Symposium on Oilfield Chemistry held in Houston,TX, USA, February
18-21.
13. Austad, T.; Strand, S.; Høgnesen, E. J. and Zhang, P., 2005. “Seawater as IOR Fluid in
Fractured Chalk.” Paper SPE 93000 presented at the SPE International Symposium on
Oilfield Chemistry held in Houston, Texas, USA, 2-4 February.
14. Austad, T.; Strand, S.; Madland, M. V.; Puntervold, T.and Korsnes, R.I., 2007.
“Seawater in Chalk: An EOR and Compaction Fluid.” Paper IPTC 11370 presented at
the International Petroleum Technology Conference, Dubai U.A.E. December 4-6.
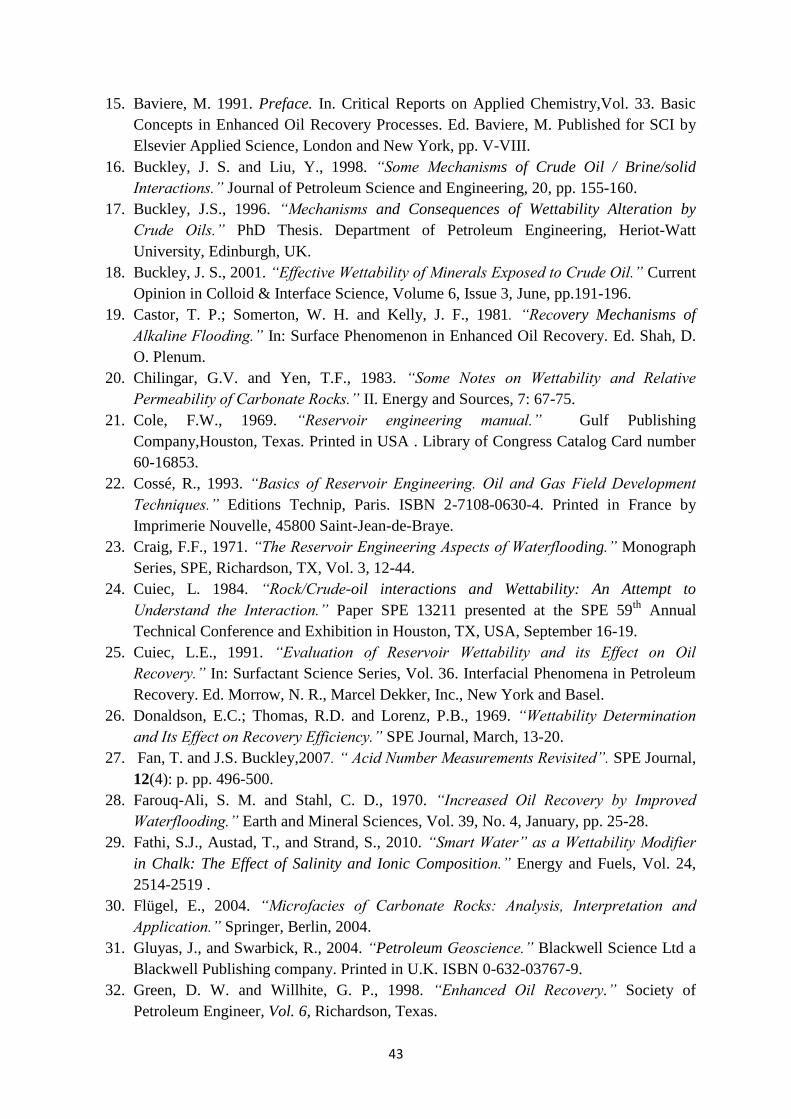
43
15. Baviere, M. 1991. Preface. In. Critical Reports on Applied Chemistry,Vol. 33. Basic
Concepts in Enhanced Oil Recovery Processes. Ed. Baviere, M. Published for SCI by
Elsevier Applied Science, London and New York, pp. V-VIII.
16. Buckley, J. S. and Liu, Y., 1998. “Some Mechanisms of Crude Oil / Brine/solid
Interactions.” Journal of Petroleum Science and Engineering, 20, pp. 155-160.
17. Buckley, J.S., 1996. “Mechanisms and Consequences of Wettability Alteration by
Crude Oils.” PhD Thesis. Department of Petroleum Engineering, Heriot-Watt
University, Edinburgh, UK.
18. Buckley, J. S., 2001. “Effective Wettability of Minerals Exposed to Crude Oil.” Current
Opinion in Colloid & Interface Science, Volume 6, Issue 3, June, pp.191-196.
19. Castor, T. P.; Somerton, W. H. and Kelly, J. F., 1981. “Recovery Mechanisms of
Alkaline Flooding.” In: Surface Phenomenon in Enhanced Oil Recovery. Ed. Shah, D.
O. Plenum.
20. Chilingar, G.V. and Yen, T.F., 1983. “Some Notes on Wettability and Relative
Permeability of Carbonate Rocks.” II. Energy and Sources, 7: 67-75.
21. Cole, F.W., 1969. “Reservoir engineering manual.” Gulf Publishing
Company,Houston, Texas. Printed in USA . Library of Congress Catalog Card number
60-16853.
22. Cossé, R., 1993. “Basics of Reservoir Engineering. Oil and Gas Field Development
Techniques.” Editions Technip, Paris. ISBN 2-7108-0630-4. Printed in France by
Imprimerie Nouvelle, 45800 Saint-Jean-de-Braye.
23. Craig, F.F., 1971. “The Reservoir Engineering Aspects of Waterflooding.” Monograph
Series, SPE, Richardson, TX, Vol. 3, 12-44.
24. Cuiec, L. 1984. “Rock/Crude-oil interactions and Wettability: An Attempt to
Understand the Interaction.” Paper SPE 13211 presented at the SPE 59th
Annual
Technical Conference and Exhibition in Houston, TX, USA, September 16-19.
25. Cuiec, L.E., 1991. “Evaluation of Reservoir Wettability and its Effect on Oil
Recovery.” In: Surfactant Science Series, Vol. 36. Interfacial Phenomena in Petroleum
Recovery. Ed. Morrow, N. R., Marcel Dekker, Inc., New York and Basel.
26. Donaldson, E.C.; Thomas, R.D. and Lorenz, P.B., 1969. “Wettability Determination
and Its Effect on Recovery Efficiency.” SPE Journal, March, 13-20.
27. Fan, T. and J.S. Buckley,2007. “ Acid Number Measurements Revisited”. SPE Journal,
12(4): p. pp. 496-500.
28. Farouq-Ali, S. M. and Stahl, C. D., 1970. “Increased Oil Recovery by Improved
Waterflooding.” Earth and Mineral Sciences, Vol. 39, No. 4, January, pp. 25-28.
29. Fathi, S.J., Austad, T., and Strand, S., 2010. “Smart Water” as a Wettability Modifier
in Chalk: The Effect of Salinity and Ionic Composition.” Energy and Fuels, Vol. 24,
2514-2519 .
30. Flügel, E., 2004. “Microfacies of Carbonate Rocks: Analysis, Interpretation and
Application.” Springer, Berlin, 2004.
31. Gluyas, J., and Swarbick, R., 2004. “Petroleum Geoscience.” Blackwell Science Ltd a
Blackwell Publishing company. Printed in U.K. ISBN 0-632-03767-9.
32. Green, D. W. and Willhite, G. P., 1998. “Enhanced Oil Recovery.” Society of
Petroleum Engineer, Vol. 6, Richardson, Texas.
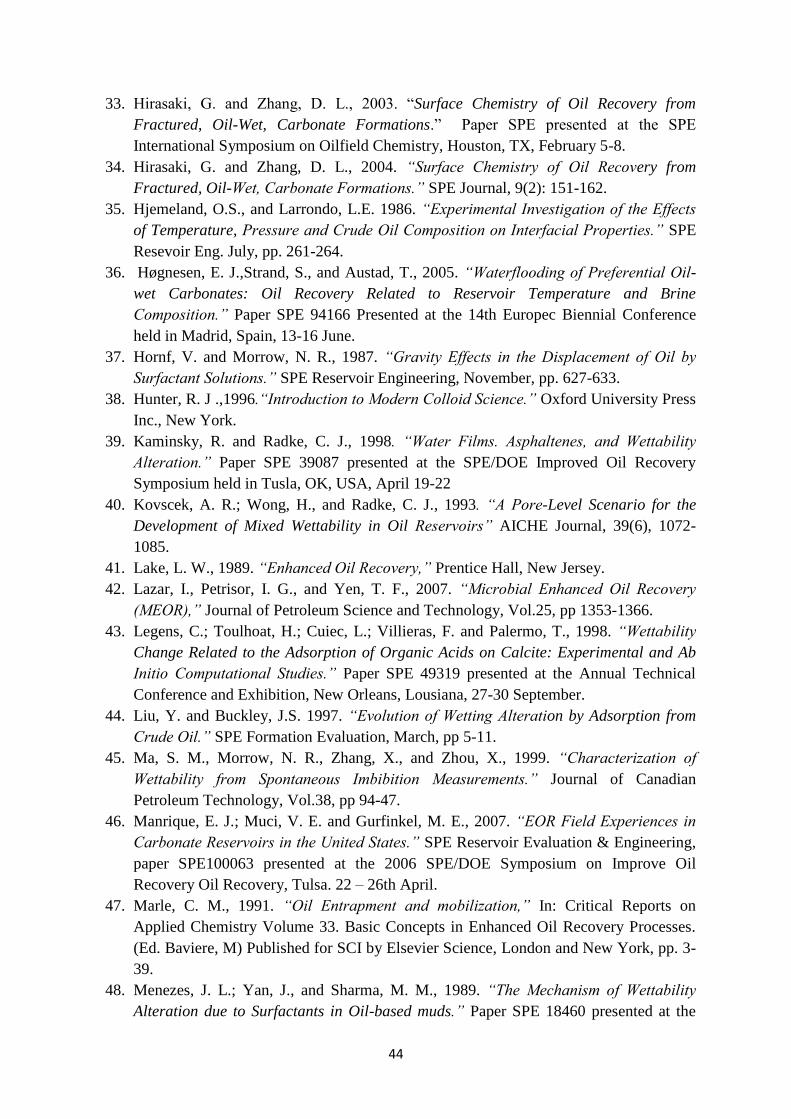
44
33. Hirasaki, G. and Zhang, D. L., 2003. “Surface Chemistry of Oil Recovery from
Fractured, Oil-Wet, Carbonate Formations.” Paper SPE presented at the SPE
International Symposium on Oilfield Chemistry, Houston, TX, February 5-8.
34. Hirasaki, G. and Zhang, D. L., 2004. “Surface Chemistry of Oil Recovery from
Fractured, Oil-Wet, Carbonate Formations.” SPE Journal, 9(2): 151-162.
35. Hjemeland, O.S., and Larrondo, L.E. 1986. “Experimental Investigation of the Effects
of Temperature, Pressure and Crude Oil Composition on Interfacial Properties.” SPE
Resevoir Eng. July, pp. 261-264.
36. Høgnesen, E. J.,Strand, S., and Austad, T., 2005. “Waterflooding of Preferential Oil-
wet Carbonates: Oil Recovery Related to Reservoir Temperature and Brine
Composition.” Paper SPE 94166 Presented at the 14th Europec Biennial Conference
held in Madrid, Spain, 13-16 June.
37. Hornf, V. and Morrow, N. R., 1987. “Gravity Effects in the Displacement of Oil by
Surfactant Solutions.” SPE Reservoir Engineering, November, pp. 627-633.
38. Hunter, R. J .,1996.“Introduction to Modern Colloid Science.” Oxford University Press
Inc., New York.
39. Kaminsky, R. and Radke, C. J., 1998. “Water Films. Asphaltenes, and Wettability
Alteration.” Paper SPE 39087 presented at the SPE/DOE Improved Oil Recovery
Symposium held in Tusla, OK, USA, April 19-22
40. Kovscek, A. R.; Wong, H., and Radke, C. J., 1993. “A Pore-Level Scenario for the
Development of Mixed Wettability in Oil Reservoirs” AICHE Journal, 39(6), 1072-
1085.
41. Lake, L. W., 1989. “Enhanced Oil Recovery,” Prentice Hall, New Jersey.
42. Lazar, I., Petrisor, I. G., and Yen, T. F., 2007. “Microbial Enhanced Oil Recovery
(MEOR),” Journal of Petroleum Science and Technology, Vol.25, pp 1353-1366.
43. Legens, C.; Toulhoat, H.; Cuiec, L.; Villieras, F. and Palermo, T., 1998. “Wettability
Change Related to the Adsorption of Organic Acids on Calcite: Experimental and Ab
Initio Computational Studies.” Paper SPE 49319 presented at the Annual Technical
Conference and Exhibition, New Orleans, Lousiana, 27-30 September.
44. Liu, Y. and Buckley, J.S. 1997. “Evolution of Wetting Alteration by Adsorption from
Crude Oil.” SPE Formation Evaluation, March, pp 5-11.
45. Ma, S. M., Morrow, N. R., Zhang, X., and Zhou, X., 1999. “Characterization of
Wettability from Spontaneous Imbibition Measurements.” Journal of Canadian
Petroleum Technology, Vol.38, pp 94-47.
46. Manrique, E. J.; Muci, V. E. and Gurfinkel, M. E., 2007. “EOR Field Experiences in
Carbonate Reservoirs in the United States.” SPE Reservoir Evaluation & Engineering,
paper SPE100063 presented at the 2006 SPE/DOE Symposium on Improve Oil
Recovery Oil Recovery, Tulsa. 22 – 26th April.
47. Marle, C. M., 1991. “Oil Entrapment and mobilization,” In: Critical Reports on
Applied Chemistry Volume 33. Basic Concepts in Enhanced Oil Recovery Processes.
(Ed. Baviere, M) Published for SCI by Elsevier Science, London and New York, pp. 3-
39.
48. Menezes, J. L.; Yan, J., and Sharma, M. M., 1989. “The Mechanism of Wettability
Alteration due to Surfactants in Oil-based muds.” Paper SPE 18460 presented at the
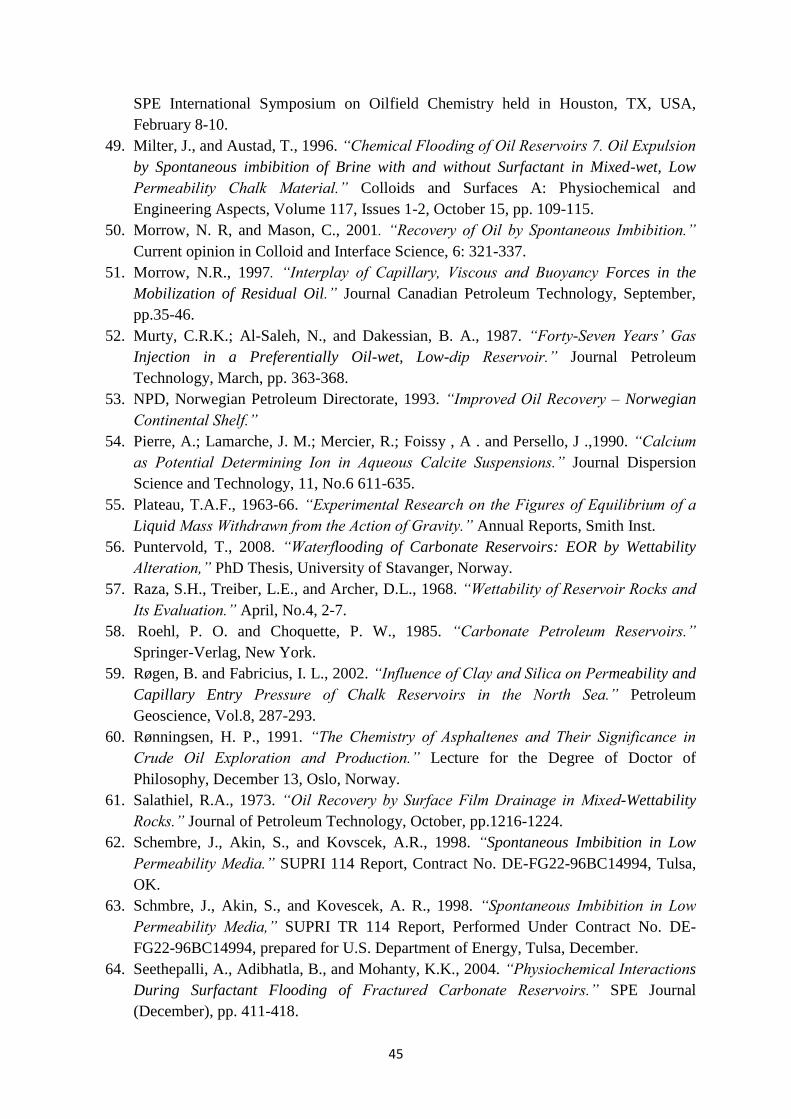
45
SPE International Symposium on Oilfield Chemistry held in Houston, TX, USA,
February 8-10.
49. Milter, J., and Austad, T., 1996. “Chemical Flooding of Oil Reservoirs 7. Oil Expulsion
by Spontaneous imbibition of Brine with and without Surfactant in Mixed-wet, Low
Permeability Chalk Material.” Colloids and Surfaces A: Physiochemical and
Engineering Aspects, Volume 117, Issues 1-2, October 15, pp. 109-115.
50. Morrow, N. R, and Mason, C., 2001. “Recovery of Oil by Spontaneous Imbibition.”
Current opinion in Colloid and Interface Science, 6: 321-337.
51. Morrow, N.R., 1997. “Interplay of Capillary, Viscous and Buoyancy Forces in the
Mobilization of Residual Oil.” Journal Canadian Petroleum Technology, September,
pp.35-46.
52. Murty, C.R.K.; Al-Saleh, N., and Dakessian, B. A., 1987. “Forty-Seven Years’ Gas
Injection in a Preferentially Oil-wet, Low-dip Reservoir.” Journal Petroleum
Technology, March, pp. 363-368.
53. NPD, Norwegian Petroleum Directorate, 1993. “Improved Oil Recovery – Norwegian
Continental Shelf.”
54. Pierre, A.; Lamarche, J. M.; Mercier, R.; Foissy , A . and Persello, J .,1990. “Calcium
as Potential Determining Ion in Aqueous Calcite Suspensions.” Journal Dispersion
Science and Technology, 11, No.6 611-635.
55. Plateau, T.A.F., 1963-66. “Experimental Research on the Figures of Equilibrium of a
Liquid Mass Withdrawn from the Action of Gravity.” Annual Reports, Smith Inst.
56. Puntervold, T., 2008. “Waterflooding of Carbonate Reservoirs: EOR by Wettability
Alteration,” PhD Thesis, University of Stavanger, Norway.
57. Raza, S.H., Treiber, L.E., and Archer, D.L., 1968. “Wettability of Reservoir Rocks and
Its Evaluation.” April, No.4, 2-7.
58. Roehl, P. O. and Choquette, P. W., 1985. “Carbonate Petroleum Reservoirs.”
Springer-Verlag, New York.
59. Røgen, B. and Fabricius, I. L., 2002. “Influence of Clay and Silica on Permeability and
Capillary Entry Pressure of Chalk Reservoirs in the North Sea.” Petroleum
Geoscience, Vol.8, 287-293.
60. Rønningsen, H. P., 1991. “The Chemistry of Asphaltenes and Their Significance in
Crude Oil Exploration and Production.” Lecture for the Degree of Doctor of
Philosophy, December 13, Oslo, Norway.
61. Salathiel, R.A., 1973. “Oil Recovery by Surface Film Drainage in Mixed-Wettability
Rocks.” Journal of Petroleum Technology, October, pp.1216-1224.
62. Schembre, J., Akin, S., and Kovscek, A.R., 1998. “Spontaneous Imbibition in Low
Permeability Media.” SUPRI 114 Report, Contract No. DE-FG22-96BC14994, Tulsa,
OK.
63. Schmbre, J., Akin, S., and Kovescek, A. R., 1998. “Spontaneous Imbibition in Low
Permeability Media,” SUPRI TR 114 Report, Performed Under Contract No. DE-
FG22-96BC14994, prepared for U.S. Department of Energy, Tulsa, December.
64. Seethepalli, A., Adibhatla, B., and Mohanty, K.K., 2004. “Physiochemical Interactions
During Surfactant Flooding of Fractured Carbonate Reservoirs.” SPE Journal
(December), pp. 411-418.
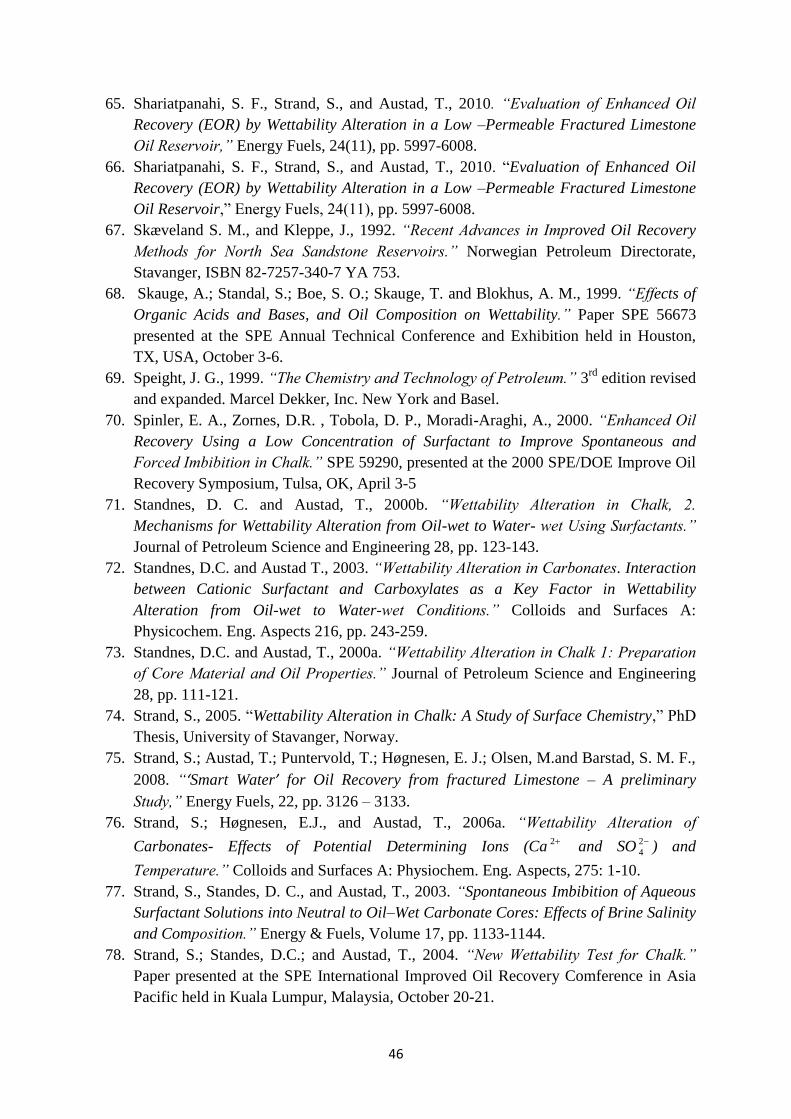
46
65. Shariatpanahi, S. F., Strand, S., and Austad, T., 2010. “Evaluation of Enhanced Oil
Recovery (EOR) by Wettability Alteration in a Low –Permeable Fractured Limestone
Oil Reservoir,” Energy Fuels, 24(11), pp. 5997-6008.
66. Shariatpanahi, S. F., Strand, S., and Austad, T., 2010. “Evaluation of Enhanced Oil
Recovery (EOR) by Wettability Alteration in a Low –Permeable Fractured Limestone
Oil Reservoir,” Energy Fuels, 24(11), pp. 5997-6008.
67. Skæveland S. M., and Kleppe, J., 1992. “Recent Advances in Improved Oil Recovery
Methods for North Sea Sandstone Reservoirs.” Norwegian Petroleum Directorate,
Stavanger, ISBN 82-7257-340-7 YA 753.
68. Skauge, A.; Standal, S.; Boe, S. O.; Skauge, T. and Blokhus, A. M., 1999. “Effects of
Organic Acids and Bases, and Oil Composition on Wettability.” Paper SPE 56673
presented at the SPE Annual Technical Conference and Exhibition held in Houston,
TX, USA, October 3-6.
69. Speight, J. G., 1999. “The Chemistry and Technology of Petroleum.” 3rd
edition revised
and expanded. Marcel Dekker, Inc. New York and Basel.
70. Spinler, E. A., Zornes, D.R. , Tobola, D. P., Moradi-Araghi, A., 2000. “Enhanced Oil
Recovery Using a Low Concentration of Surfactant to Improve Spontaneous and
Forced Imbibition in Chalk.” SPE 59290, presented at the 2000 SPE/DOE Improve Oil
Recovery Symposium, Tulsa, OK, April 3-5
71. Standnes, D. C. and Austad, T., 2000b. “Wettability Alteration in Chalk, 2.
Mechanisms for Wettability Alteration from Oil-wet to Water- wet Using Surfactants.”
Journal of Petroleum Science and Engineering 28, pp. 123-143.
72. Standnes, D.C. and Austad T., 2003. “Wettability Alteration in Carbonates. Interaction
between Cationic Surfactant and Carboxylates as a Key Factor in Wettability
Alteration from Oil-wet to Water-wet Conditions.” Colloids and Surfaces A:
Physicochem. Eng. Aspects 216, pp. 243-259.
73. Standnes, D.C. and Austad, T., 2000a. “Wettability Alteration in Chalk 1: Preparation
of Core Material and Oil Properties.” Journal of Petroleum Science and Engineering
28, pp. 111-121.
74. Strand, S., 2005. “Wettability Alteration in Chalk: A Study of Surface Chemistry,” PhD
Thesis, University of Stavanger, Norway.
75. Strand, S.; Austad, T.; Puntervold, T.; Høgnesen, E. J.; Olsen, M.and Barstad, S. M. F.,
2008. “‘Smart Water’ for Oil Recovery from fractured Limestone – A preliminary
Study,” Energy Fuels, 22, pp. 3126 – 3133.
76. Strand, S.; Høgnesen, E.J., and Austad, T., 2006a. “Wettability Alteration of
Carbonates- Effects of Potential Determining Ions (Ca 2 and SO 2
4 ) and
Temperature.” Colloids and Surfaces A: Physiochem. Eng. Aspects, 275: 1-10.
77. Strand, S., Standes, D. C., and Austad, T., 2003. “Spontaneous Imbibition of Aqueous
Surfactant Solutions into Neutral to Oil–Wet Carbonate Cores: Effects of Brine Salinity
and Composition.” Energy & Fuels, Volume 17, pp. 1133-1144.
78. Strand, S.; Standes, D.C.; and Austad, T., 2004. “New Wettability Test for Chalk.”
Paper presented at the SPE International Improved Oil Recovery Comference in Asia
Pacific held in Kuala Lumpur, Malaysia, October 20-21.

47
79. Strand, S; Standnes, D.C; and Austad, T; 2006. “New wettability test for chalk based
on chromatographic separation of SCN and SO 2
4 .” Journal of Petroleum Science and
Engineering, 2006. 52(1-4): p. 187-197
80. Taber, J. J.; Martin, F.D. and Seright, R. S., 1996. “EOR Screening Criteria Revisited,”
paper SPE 35385 presented at the 1996 SPE Improved Oil Recovery Symposium,
Tulsa, Ok, April 21-24
81. Taugbøl, K., 1995. “Chemical Flooding of Oil Reservoirs. Low Tension Polymer Water
Flood.” PhD Thesis, Department of Chemistry, University of Bergen, Norway.
82. Thomas, L.K.; Dixon, T. N; Evans, C. E.and Vienot, M. E., 1987. “Ekofisk Waterflood
Pilot.” Journal Petroleum Technology, February, pp. 221-232.
83. Thomas, M.M.; Clouse, J.A. and Longo, J .M, 1993. “Adsorption of Organic
Compounds on Carbonate Minerals 3. Influence on Dissolution Rates.” Chemical
Geology 109, pp.227-237.
84. Tong, Z. X.; Morrow, N, R. and Xie, X., 2002. “Spontaneous Imbibition For Mixed-
Wettability States In Sandstone Induced By Adsorption From Crude Oil.” Presented at
the 7th International Symposium on Reservior Wettability, Tasmania, Australia, 12-14
March.
85. Torsæter, O., 1984. “An Experimental Study of Water Imbibition in Chalk from the
Ekofisk Field.” Paper SPE/DOE 12688 presented at the SOE/DOE Fourth Symposium
on Enhanced Oil Recovery, Tulsa, OK. April 15-18.
86. Treiber L. E., Archer, D.L., Owens, W.W., 1972. “A laboratory Evaluation of the
Wettability of 50 Oil –Producing Reservoirs.” SPE Journal 12, 531-540.
87. Tucker, M. E., 2001. “Sedimentary Petrology: An Introduction to the Origin of
Sedimentary Rocks.” Blackwell Science, Oxford.
88. Wang,W. and Gupta, A. 1995. “Investigation of the Effect of Temperature and
Pressure on Wettability Using Modified Pendant Drop Method.” Paper SPE 30544
presented at the SPE Annual Technical Conference and Exhibition held in Dallas, TX,
USA, October 22-25.
89. Xie, X.; Morrow, N. R., and Buckley, J. S., 2000. “Contact Angle Hysteresis and the
Stability of Wetting Changes Induced by Adsorption from Crude Oil.” Paper presented
at the 6th
International Symposium on Reservoir Wettability and Its Effect on Oil
Recovery, Socorro, NM, USA. September 27-28.
90. Yousef, A. A.; Al-Saleh, S.; Al-Kaabi, A. and Al-Jawfi, M., 2010. “Laboratory
Investigation of Novel Oil Recovery Method for Carbonate Reservoirs,” Paper
CSUG/SPE 137634, presented at the Canadian Unconventional Resources &
International Petroleum Conference, Calgary, Alberta, Canada, 19-21 October.
91. Zhang, P., 2006. “Water-based EOR in Fractured Chalk - Wettability and Chemical
Additives.” PhD Thesis, University of Stavanger, Norway.
92. Zhang, P.and Austad, T. 2006. “Wettability and Oil Recovery from Colloids and
Surfaces A: Physiochemical & Engineering Aspects, 279, 179-187.
93. Zhang, P.; Tweheyo, M.T., and Austad, T., 2007. “Wettability Alteration and Improved
Oil Recovery by Spontaneous Imbibition of Seawater into Chalk: Impact of the

48
Potential Determining Ions: Ca 2 , Mg 2, and SO 2
4 .” Colloids and Surfaces A:
Physiochemical & Engineering Aspects, 301, 199-208.
94. Zhou, X.; Morrow, N. R. and Ma, S., 2000. “Interrelationship of Wettability, Initial
Water Saturation, Aging Time and Oil Recovery by Spontaneous Imbibition and
Waterflooding.” SPE Journal, 5(2): 199-207(June).
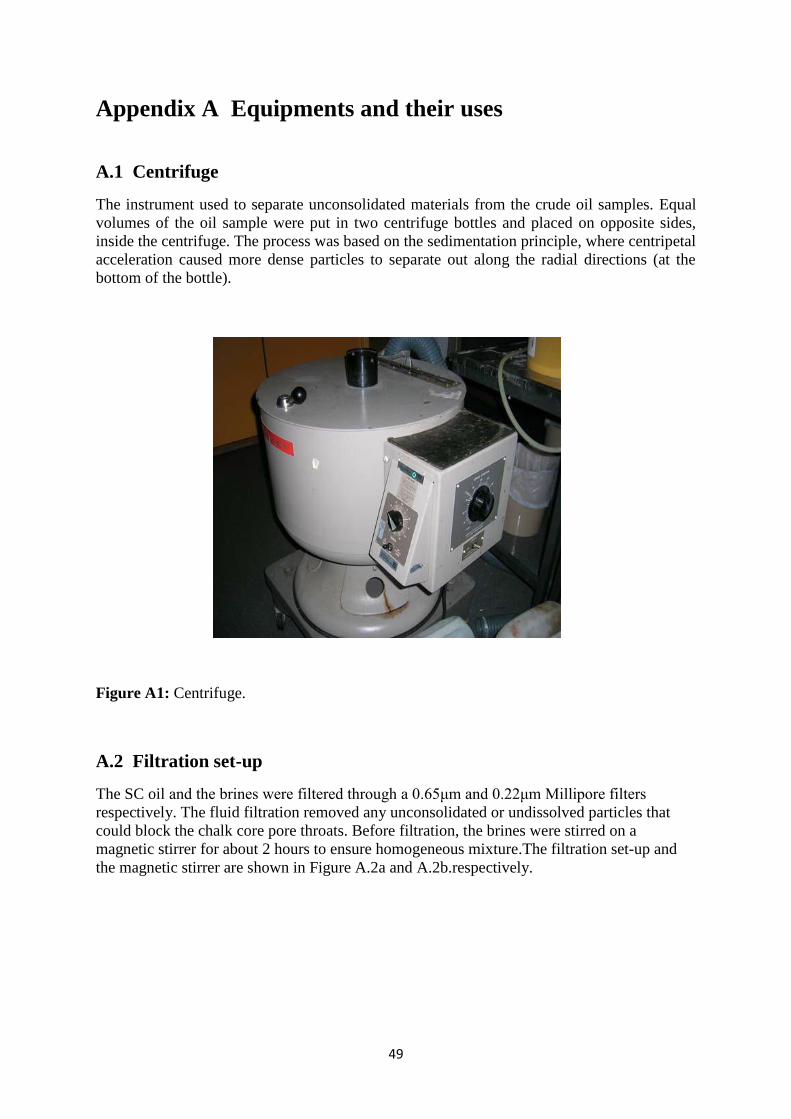
49
Appendix A Equipments and their uses
A.1 Centrifuge
The instrument used to separate unconsolidated materials from the crude oil samples. Equal
volumes of the oil sample were put in two centrifuge bottles and placed on opposite sides,
inside the centrifuge. The process was based on the sedimentation principle, where centripetal
acceleration caused more dense particles to separate out along the radial directions (at the
bottom of the bottle).
Figure A1: Centrifuge.
A.2 Filtration set-up
The SC oil and the brines were filtered through a 0.65μm and 0.22μm Millipore filters
respectively. The fluid filtration removed any unconsolidated or undissolved particles that
could block the chalk core pore throats. Before filtration, the brines were stirred on a
magnetic stirrer for about 2 hours to ensure homogeneous mixture.The filtration set-up and
the magnetic stirrer are shown in Figure A.2a and A.2b.respectively.
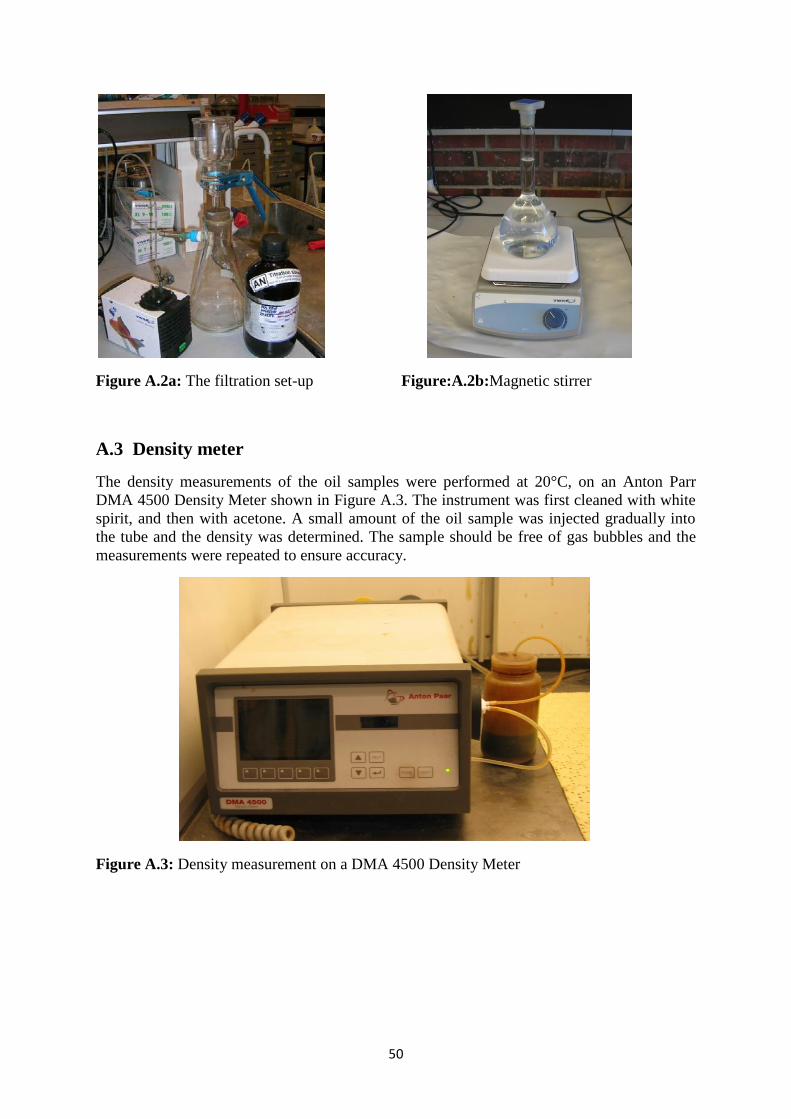
50
Figure A.2a: The filtration set-up Figure:A.2b:Magnetic stirrer
A.3 Density meter
The density measurements of the oil samples were performed at 20°C, on an Anton Parr
DMA 4500 Density Meter shown in Figure A.3. The instrument was first cleaned with white
spirit, and then with acetone. A small amount of the oil sample was injected gradually into
the tube and the density was determined. The sample should be free of gas bubbles and the
measurements were repeated to ensure accuracy.
Figure A.3: Density measurement on a DMA 4500 Density Meter

51
A.4 Universal dynamic spectrometer
The viscosity measurements were performed on a Physica UDS 200 Universal Dynamic
Spectrometer shown in Figure A.4. The measurements were done at 20°C. The shear rates
were set between 10-1000 1/s. and the instrument accuracy was tested with deionized (DI)
water. About 2.2 ml of the oil sample fluid was placed on the metal plate. Then, the apparatus
was set in measuring position with the plates close to each other The viscosity of the oil was
determined through shear stress/shear rate relation.
Figure A.4: Viscosity measurement on a Universal Dynamic Spectrometer
A.5 Automatic titrator
A Mettler Toledo DL55 automatic titrator was used to measure the acid and base
numbers of different oil samples. The methods used, developed by Fan and Buckley
(2007), involved potentiometric titrations using an internal standard. They are the
modified versions of ASTM D2896 for base number and ASTM D664 for acid
number titration. Figure A.5 shows the instrument and Table A.1 outlines the procedures for
acid number titration of the crude oil samples
Figure A.5: Automatic titrator for measuring the AN and BN of the oil samples.
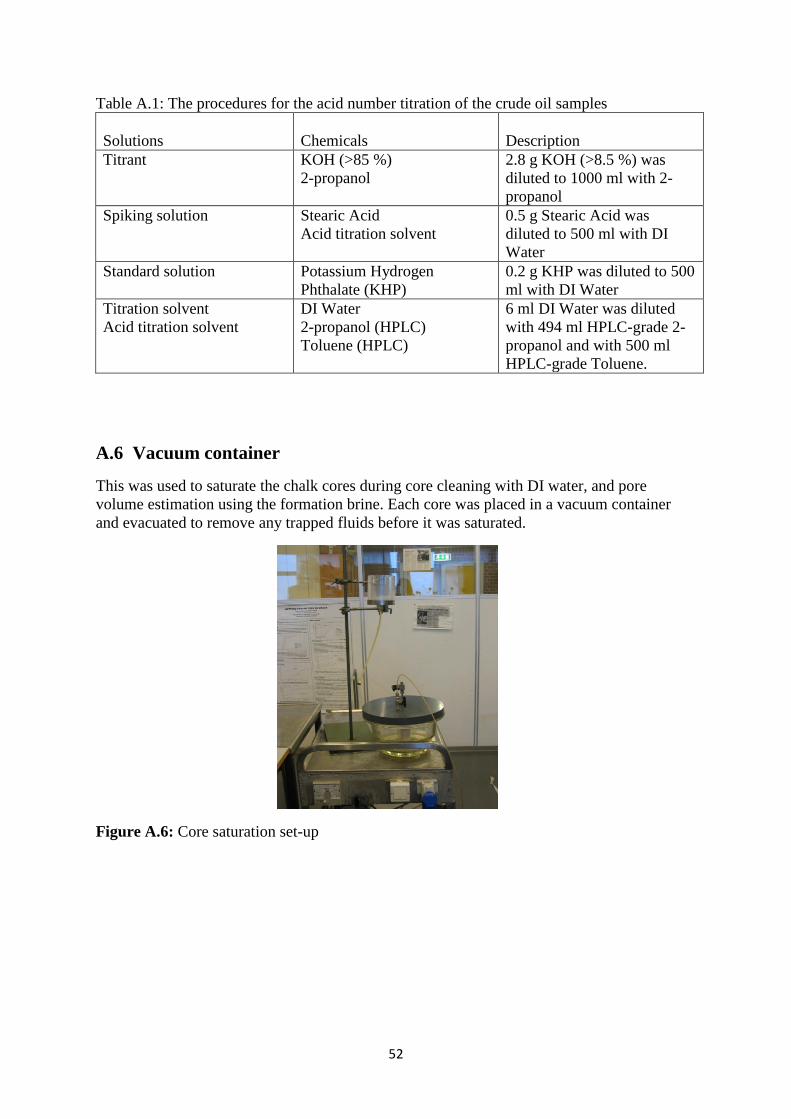
52
Table A.1: The procedures for the acid number titration of the crude oil samples
Solutions
Chemicals
Description
Titrant KOH (>85 %)
2-propanol
2.8 g KOH (>8.5 %) was
diluted to 1000 ml with 2-
propanol
Spiking solution Stearic Acid
Acid titration solvent
0.5 g Stearic Acid was
diluted to 500 ml with DI
Water
Standard solution Potassium Hydrogen
Phthalate (KHP)
0.2 g KHP was diluted to 500
ml with DI Water
Titration solvent
Acid titration solvent
DI Water
2-propanol (HPLC)
Toluene (HPLC)
6 ml DI Water was diluted
with 494 ml HPLC-grade 2-
propanol and with 500 ml
HPLC-grade Toluene.
A.6 Vacuum container
This was used to saturate the chalk cores during core cleaning with DI water, and pore
volume estimation using the formation brine. Each core was placed in a vacuum container
and evacuated to remove any trapped fluids before it was saturated.
Figure A.6: Core saturation set-up

53
A.7 Hassler core holder
The instrument was used for core flooding, both in core handling and in the chromatographic
wettability tests. The HPLC pump model 305, with a 10SC piston head, delivered by Gilson
was used in core flooding experiment and the fraction collector model 222 XL was used in
the wettability tests. The chalk core was placed inside a rubber sleeve in a central position
and then inserted inside the core holder. Then, a confining pressure of 25bar was applied.
Figure A.7: Hassler core holder used for all core flooding.
A.8 Porous plate
To establish wiS of 10 %, the 100 % VB0S-saturated cores were drained on the porous
plate, using water-saturated nitrogen gas. As the pressure in the porous plate was
gradually increased to 8.5bar, the total water saturation decreased. Then, the actual
initial water saturation for the core was determined using The initial water saturation, wiS
of about 10% was established by draining 100 % VB0S-saturated cores on the porous plate
using water saturated nitrogen gas, given by Figure A.8a. The water saturation decreased as
the pressure in the porous plate was gradually increased to about 8.5 bar, as shown in Figure
A.8b.

54
Figure A.8a: Establishing initial water saturation on a porous plate.
Figure A.8a: The plot showing decreasing water saturation as pressure was gradually
increased in the porous plate technique.
0 %20 %40 %60 %80 %
100 %120 %140 %160 %180 %200 %220 %240 %260 %280 %300 %320 %340 %360 %380 %400 %420 %440 %
0 2 4 6 8 10 12 14
Satu
rati
on %
Pressure (bars)

55
Appendix B Experimental data
B.1 Spontaneous imbibition at 90°C
Table B.1: Oil recovery from the chalk cores imbibed with different imbibing brines, as a
function of time.
Time Cumulative Oil Recovery(ml)
Recovery factor
(days) SW#1 SW#6 SW#3 SW#5 SW#1 SW#6 SW#3 SW#5
0 - 0.0 0.0 0.0 - 0 % 0 % 0 %
0 - 1.0 2.7 2.5 - 3 % 8 % 8 %
1 - 4.7 7.0 9.3 - 14 % 22 % 28 %
2 - 6.4 8.6 1.2 - 20 % 27 % 37 %
3 0 7.2 9.4 13.2 0 % 22 % 29 % 40 %
4 0.4 7.7 10.1 14.2 1 % 24 % 31 % 43 %
5 1.4 8.3 10.7 15.2 4 % 25 % 33 % 46 %
6 1.7 8.7 11.1 15.6 5 % 27 % 35 % 47 %
8 2.5 9.3 11.7 16.6 7 % 28 % 36 % 50 %
10 2.9 9.8 12.1 17.1 9 % 30 % 38 % 51 %
12 3.2 10.2 12.7 17.9 10 % 31 % 40 % 54 %
14 3.6 10.5 13.3 18.4 11 % 32 % 41 % 55 %
16 3.9 10.8 13.4 18.7 12 % 33 % 42 % 56 %
20 4.3 11.2 13.8 19.6 13 % 34 % 43 % 59 %
23 4.7 11.5 14.0 19.8 14 % 35 % 44 % 59 %
28 5.3 12.0 14.5 20.3 16 % 37 % 45 % 61 %
31 5.5 12.2 14.7 20.5 16 % 37 % 46 % 62 %
34 5.6 12.3 14.8 20.7 17 % 38 % 46 % 62 %
37 5.6 12.4 14.9 20.8 17 % 38 % 46 % 62 %
Note:
Brine Core ID OOIP (ml)
VB0S SW#1 32.85
SW SW#6 32.70
SW0NaCl SW#3 32.11
SW4S0NaCl SW#5 33.29

56
B.2 Spontaneous imbibition at 70°C
Table B.2: Oil recovery from the chalk cores, imbibed with different
imbibing brines, as a function of time.
Time Cumulative oil Recovery(ml) Recovery factor
(days) SW#9 SW#8 SW#7 SW#9 SW#8 SW#7
0 0.0 0.0 0 0 % 0 % 0 %
0 3.3 2.8 2.3 11 % 9 % 7 %
1 7.6 8.0 7.0 24 % 26 % 23 %
1 8.3 9.0 7.7 27 % 29 % 25 %
2 8.9 9.7 9.0 28 % 31 % 29 %
3 9.6 10.5 10.2 31 % 34 % 33 %
4 9.9 11.0 10.7 32 % 35 % 35 %
7 10.8 11.9 12.2 35 % 38 % 39 %
8 11.0 12.2 12.4 35 % 39 % 40 %
10 11.3 12.7 12.9 36 % 41 % 42 %
15 11.8 13.3 13.9 38 % 43 % 45 %
18 12.0 13.6 14.3 38 % 44 % 46 %
21 12.2 13.8 14.6 39 % 44 % 47 %
23 12.3 13.9 14.8 39 % 45 % 48 %
25 12.3 14.0 15.0 39 % 45 % 48 %
27 12.4 14.0 15.0 40 % 45 % 48 %
30 12.6 14.2 15.4 40 % 46 % 50 %
33 12.6 14.2 15.6 40 % 46 % 50 %
39 12.7 14.3 15.8 41 % 46 % 51 %
43 12.8 14.4 15.9 41 % 46 % 51 %
Note:
Brine Core ID OOIP (ml)
SW SW#9 31.24
SW0NaCl SW#8 31.11
SW4S0NaCl SW#7 31.01
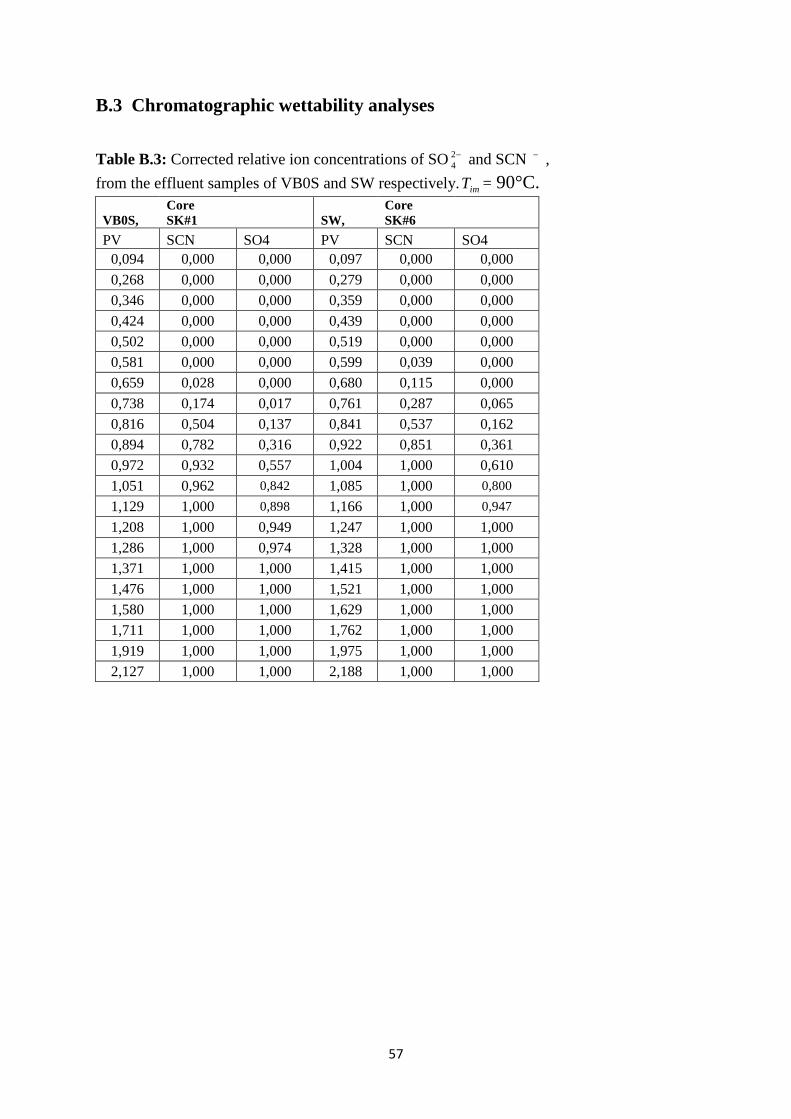
57
B.3 Chromatographic wettability analyses
Table B.3: Corrected relative ion concentrations of SO 2
4 and SCN ,
from the effluent samples of VB0S and SW respectively. imT = 90°C.
VB0S,
Core
SK#1 SW,
Core
SK#6
PV SCN SO4 PV SCN SO4
0,094 0,000 0,000 0,097 0,000 0,000
0,268 0,000 0,000 0,279 0,000 0,000
0,346 0,000 0,000 0,359 0,000 0,000
0,424 0,000 0,000 0,439 0,000 0,000
0,502 0,000 0,000 0,519 0,000 0,000
0,581 0,000 0,000 0,599 0,039 0,000
0,659 0,028 0,000 0,680 0,115 0,000
0,738 0,174 0,017 0,761 0,287 0,065
0,816 0,504 0,137 0,841 0,537 0,162
0,894 0,782 0,316 0,922 0,851 0,361
0,972 0,932 0,557 1,004 1,000 0,610
1,051 0,962 0,842 1,085 1,000 0,800
1,129 1,000 0,898 1,166 1,000 0,947
1,208 1,000 0,949 1,247 1,000 1,000
1,286 1,000 0,974 1,328 1,000 1,000
1,371 1,000 1,000 1,415 1,000 1,000
1,476 1,000 1,000 1,521 1,000 1,000
1,580 1,000 1,000 1,629 1,000 1,000
1,711 1,000 1,000 1,762 1,000 1,000
1,919 1,000 1,000 1,975 1,000 1,000
2,127 1,000 1,000 2,188 1,000 1,000

58
Table B.4: Corrected relative ion concentrations of SO 2
4 and SCN ,
from the effluent samples of SW0NaCl and SW4S0NaCl respectively.
imT = 90°C.
SW0NaCl,
Core
SK #3 SW4S0NaCl,
Core
SK #5
PV SCN SO4 PV SCN SO4
0,098 0,000 0,000 0,094 0,000 0,000
0,282 0,000 0,000 0,272 0,000 0,000
0,364 0,000 0,000 0,352 0,000 0,000
0,446 0,000 0,000 0,430 0,000 0,000
0,528 0,000 0,000 0,510 0,000 0,000
0,611 0,014 0,000 0,590 0,000 0,000
0,694 0,095 0,000 0,670 0,047 0,000
0,776 0,313 0,072 0,750 0,225 0,000
0,857 0,619 0,203 0,831 0,491 0,066
0,940 0,830 0,434 0,910 0,798 0,303
1,022 0,942 0,629 0,991 0,928 0,501
1,105 0,989 0,723 1,070 0,975 0,663
1,187 1,000 0,855 1,151 1,000 0,852
1,269 1,000 0,935 1,231 1,000 0,870
1,352 1,000 0,950 1,311 1,000 0,954
1,442 1,000 0,984 1,397 1,000 0,983
1,552 1,000 1,000 1,503 1,000 1,000
1,663 1,000 1,000 1,609 1,000 1,000
1,800 1,000 1,000 1,742 1,000 1,000
2,020 1,000 1,000 1,954 1,000 1,000
2,238 1,000 1,000 2,154 1,000 1,000
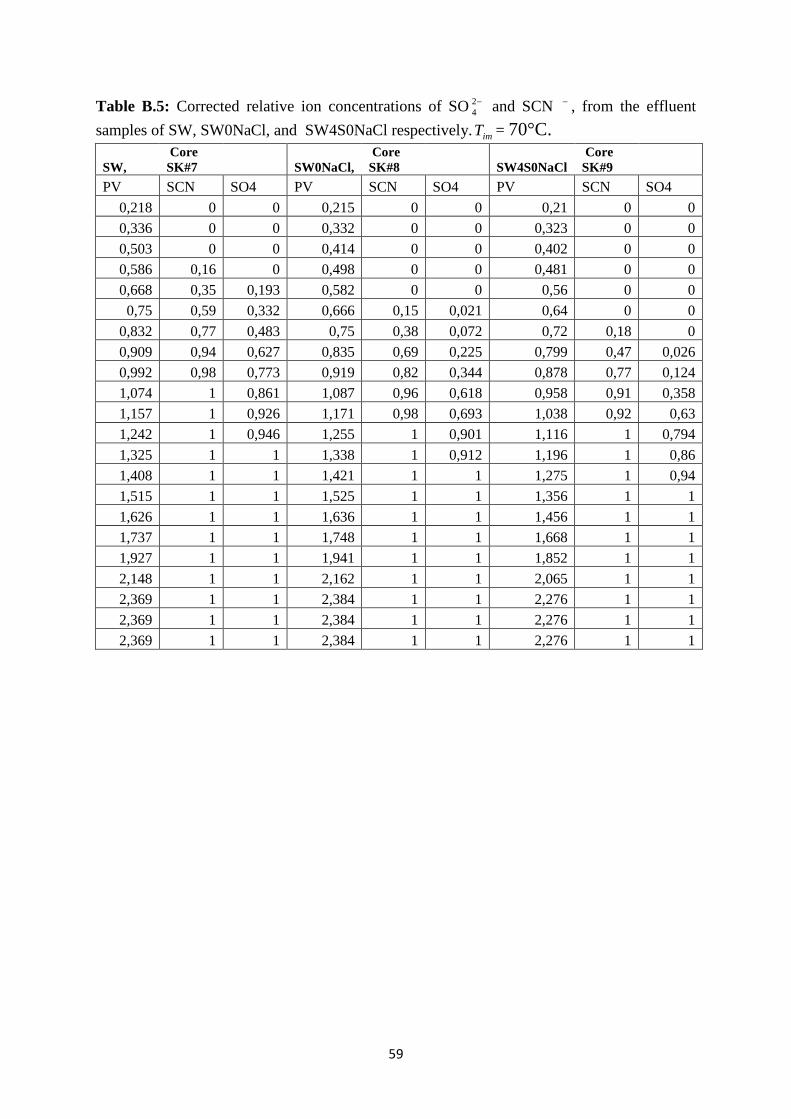
59
Table B.5: Corrected relative ion concentrations of SO 2
4 and SCN , from the effluent
samples of SW, SW0NaCl, and SW4S0NaCl respectively. imT = 70°C.
SW,
Core
SK#7 SW0NaCl,
Core
SK#8 SW4S0NaCl
Core
SK#9
PV SCN SO4 PV SCN SO4 PV SCN SO4
0,218 0 0 0,215 0 0 0,21 0 0
0,336 0 0 0,332 0 0 0,323 0 0
0,503 0 0 0,414 0 0 0,402 0 0
0,586 0,16 0 0,498 0 0 0,481 0 0
0,668 0,35 0,193 0,582 0 0 0,56 0 0
0,75 0,59 0,332 0,666 0,15 0,021 0,64 0 0
0,832 0,77 0,483 0,75 0,38 0,072 0,72 0,18 0
0,909 0,94 0,627 0,835 0,69 0,225 0,799 0,47 0,026
0,992 0,98 0,773 0,919 0,82 0,344 0,878 0,77 0,124
1,074 1 0,861 1,087 0,96 0,618 0,958 0,91 0,358
1,157 1 0,926 1,171 0,98 0,693 1,038 0,92 0,63
1,242 1 0,946 1,255 1 0,901 1,116 1 0,794
1,325 1 1 1,338 1 0,912 1,196 1 0,86
1,408 1 1 1,421 1 1 1,275 1 0,94
1,515 1 1 1,525 1 1 1,356 1 1
1,626 1 1 1,636 1 1 1,456 1 1
1,737 1 1 1,748 1 1 1,668 1 1
1,927 1 1 1,941 1 1 1,852 1 1
2,148 1 1 2,162 1 1 2,065 1 1
2,369 1 1 2,384 1 1 2,276 1 1
2,369 1 1 2,384 1 1 2,276 1 1
2,369 1 1 2,384 1 1 2,276 1 1