mat 150 algebra class #17. objectives graph and apply exponential functions find horizontal...
TRANSCRIPT

Objectives
Graph and apply exponential functionsFind horizontal asymptotesGraph and apply exponential growth functionsGraph and apply exponential decay functionsCompare transformations of graphs of exponential functions
Exponential FunctionIf b is a positive real number, b 1, then the functionf(x) = bx is an exponential function. The constant b is called the base of the function, and the variable x is theexponent.
Example
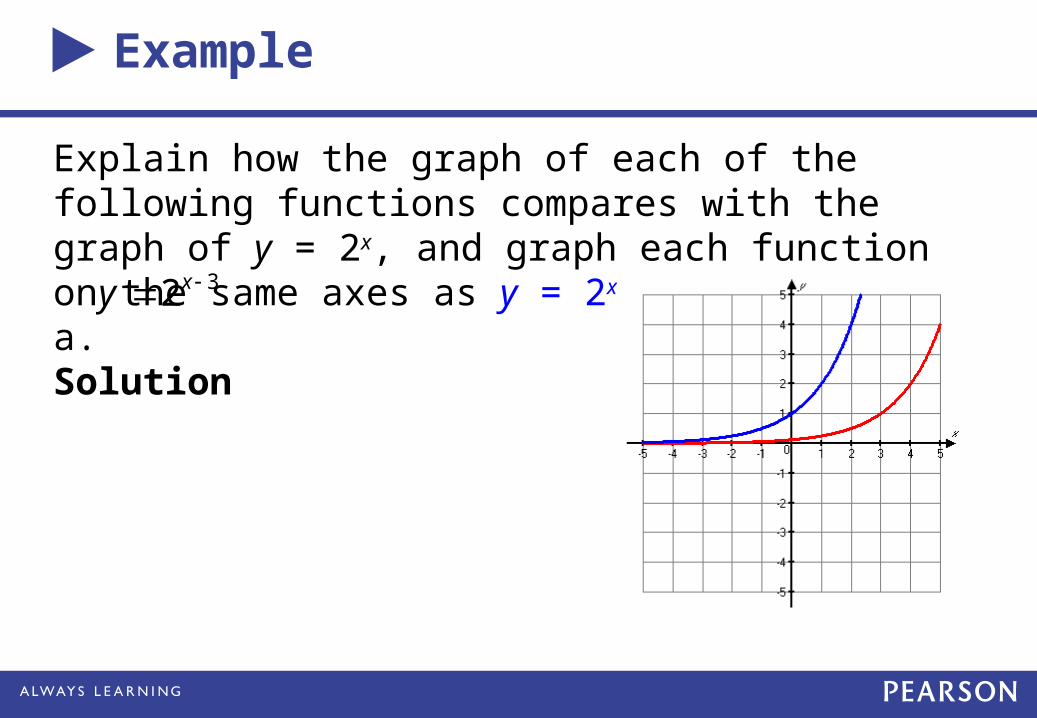
Explain how the graph of each of the following functions compares with the graph of y = 2x, and graph each function on the same axes as y = 2x.a.Solution
32xy
Example
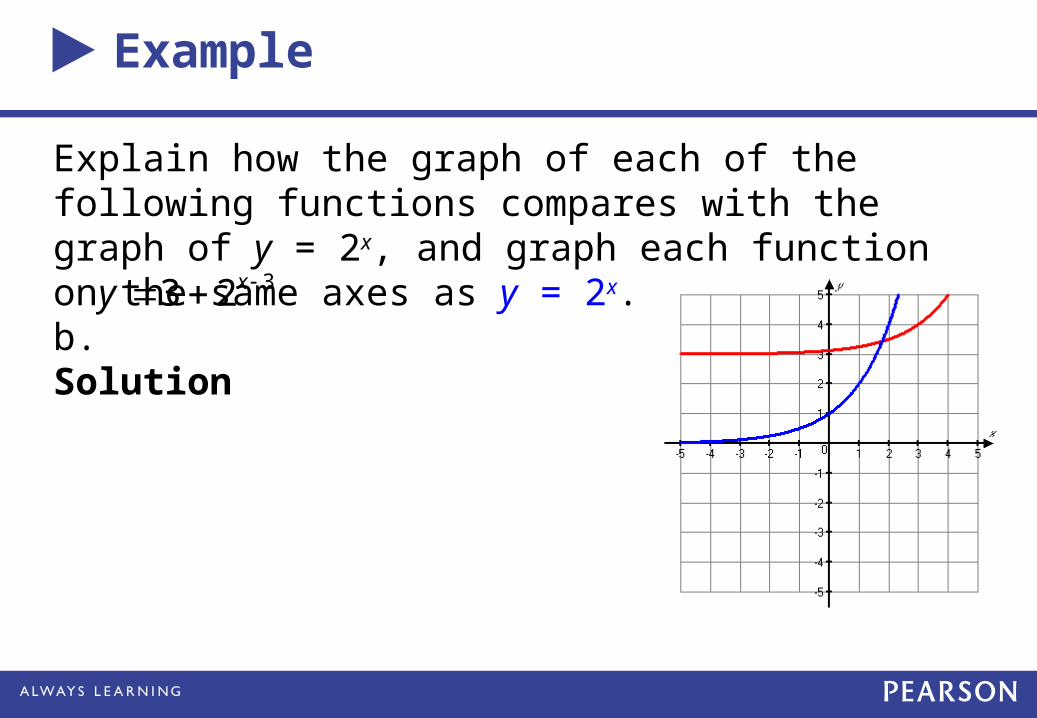
Explain how the graph of each of the following functions compares with the graph of y = 2x, and graph each function on the same axes as y = 2x.b.Solution
33 2xy
Example
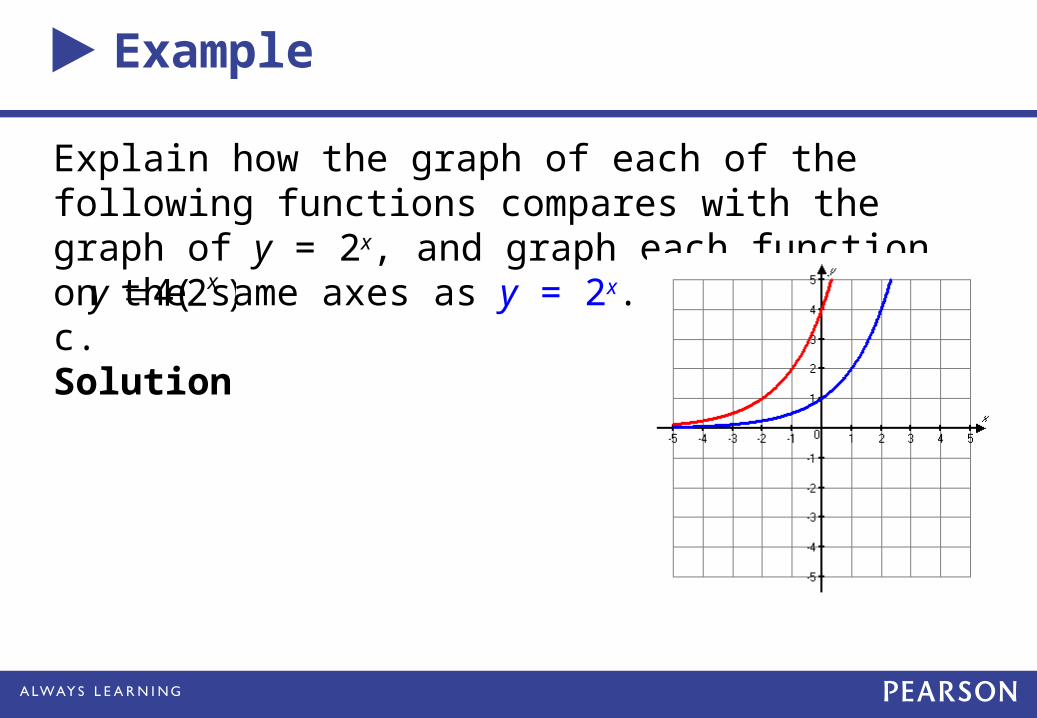
Explain how the graph of each of the following functions compares with the graph of y = 2x, and graph each function on the same axes as y = 2x.c.Solution
4(2 )xy
Example
Suppose that inflation is predicted to average 4% per year for each year from 2012 to 2025. This means that an item that costs $10,000 one year will cost $10,000(1.04) the next year and $10,000(1.04)(1.04) = 10,000(1.042) the following year.a. Write the function that gives the cost of a $10,000 item
t years after 2012.Solution
Example
Suppose that inflation is predicted to average 4% per year for each year from 2012 to 2025. This means that an item that costs $10,000 one year will cost $10,000(1.04) the next year and $10,000(1.04)(1.04) = 10,000(1.042)the following year.b. Graph the growth model found in part (a) for t = 0 to t = 13. Solution
Example
Suppose that inflation is predicted to average 4% per year for each year from 2012 to 2025. This means that an item that costs $10,000 one year will cost $10,000(1.04) the next year and $10,000(1.04)(1.04) = 10,000(1.042) the following year.c. If an item costs $10,000 in 2012, use the model to
predict its cost in 2025. Solution
Example
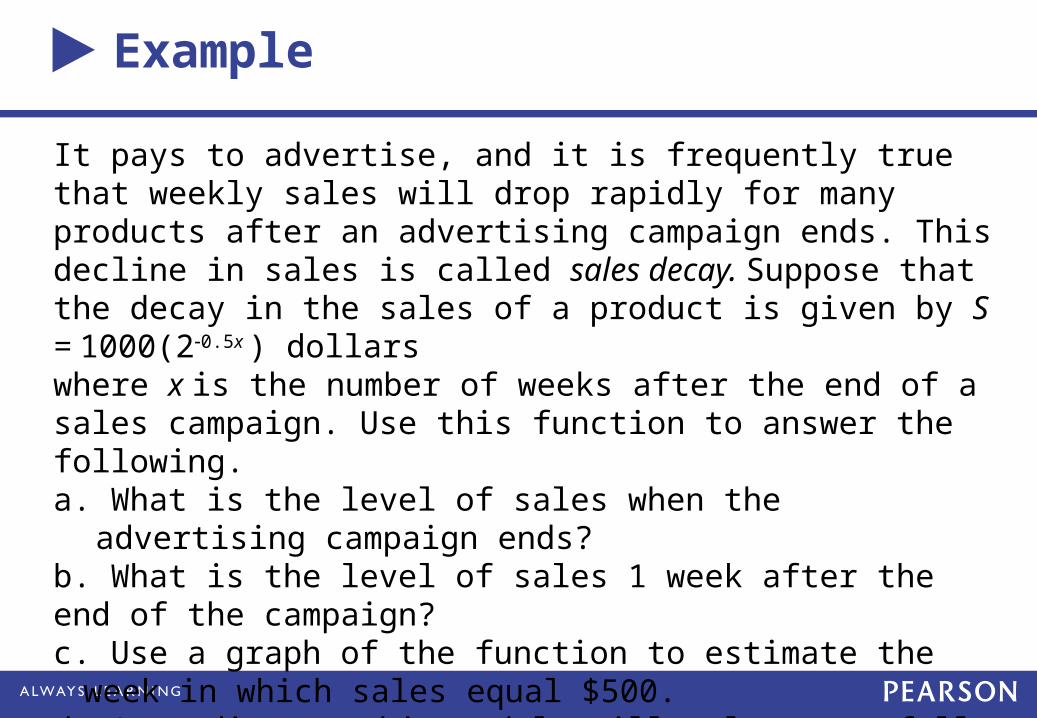
It pays to advertise, and it is frequently true that weekly sales will drop rapidly for many products after an advertising campaign ends. This decline in sales is called sales decay. Suppose that the decay in the sales of a product is given by S = 1000(20.5x ) dollarswhere x is the number of weeks after the end of a sales campaign. Use this function to answer the following.a. What is the level of sales when the advertising campaign ends?b. What is the level of sales 1 week after the end of the campaign? c. Use a graph of the function to estimate the week in which sales
equal $500.d. According to this model, will sales ever fall to zero?
Example
a. What is the level of sales when the advertising campaign ends?
b. What is the level of sales 1 week after the end of the campaign?
Solution
Example
c. Use a graph of the function to estimate the week in which sales equal $500.
Solution
Example
d. According to this model, will sales ever fall to zero?
Solution
The Number e
The number e is an irrational number with a decimal approximation of 2.718281828.
Example
If $10,000 is invested for 15 years at 12% compounded continuously, what is the future value of the investment?
Solution
Assignment
Pg. 321-323#1-3#13-18#23-25*(Graph both functions on the same graph and then compare the two. You need to be detailed when graphing.) #29,33,40