measurement of halo current in the ht-2 tokamak...
TRANSCRIPT
i ii~~=!~""""~~ ~~=~~" ~-.~~~~C
Measurement of Halo Current in the HT-2 Tokamak and Investigation of a Scallng Law
ABE Mitsushi, TADOKORO Takahiro, DOI Akira, NAKAYAMA Takeshi, OTSUKA Michio and NISHIO Satoshil)
Power & Industrial Systems R&D Division. Hitachi Ltd.
Hitachi 319-1221, Japan
1) Naka Fusion Research Establishment. Japan Atomic Energy Research Institute,
lbaraki 311-01 93, Japan
(Received 8 May 1997/Accepted 7 January 1998)
Abstract The halo current, which flows between the plasma and plasma facing components in a vacuum
vessel during disruptions, was measured in the Hitachi tokamak HT-2 and the scaling law of the magni-
tude was examined based on the balance of the electromagnetic forces. Electrode plates were placed
where they touched the plasma during the disruptions. A halo current flowed through the electrodes
and the electrode currents were measured by Rogowski coils. The measurements showed the followings.
(1) The halo current intensity IHL is large during vertical displacement event (VDE) with rapid lp decay
and high toroidal field BT. (2) The product of IHL and duration time increases with lp but have no de-
pendence on BT. (3) The halo current reduces the shell effect, destabilizing the plasma position. (4) A
scaling law, based on a force balance on the plasma, gives an approximate estimation of the halo current
magnitudes for various tokamaks.
Keywords: tokamak, disruption, VDE, halo current
1. Introduction
The next step in magnetic fusion research will be
experiments on a large scale fusion device like the
ITER (International Thermonuclear Experimental Re-
actor) [1]. The most important point in designing such
a large magnetic fusion device is to design a machine
which withstands the strong electromagnetic forces. The
most important electromagnetic force on the vacuum
vessel is that during a disruption including a VDE
(Vertical Displacement Event) [ 2] . In designing existing
tokamak, the force was estimated by calculating magni-
tudes of the eddy current on the vacuum vessel and in-
teraction with magnetic field. The eddy current is
induced by the rapid disruptive plasma current (Ip)
decay. However experiments on the JET tokamak
showed that the force on the vacuum vessel is not only
due to eddy currents but also due to poloidal current
which is known as an halo current [3]・ The current
flows between the plasma and the vacuum vessel. A va-
cuum vessel design must take into account the halo cur-
rent [4]. Then, experiments to understand the electro-
magnetic force due to the halo current are being carried
out in large tokamaks [5-9]. On the other hand, a small
tokamak has an advantage of easy modification of the
vacuum vessel. So we have carried out experiments on
the HT-2 to understand characteristics and scaling of
the halo currents, and present the finding in this paper.
Experiments to understand the characteristics of
disruptive lp decay were previously carried out in the
HT-2, by using magnetic analysis, which reconstructed
corresponding author~ e-mail: abem@ erl.hitachi. co.jp
49 1

j~ ~7 ・ ~~~~~~AD ~'j~~~--._~d~~
the poloidal field distribution from the measured mag-
netic field data [4,10,11] . These results showed that the
electromagnetic force due to the halo currents can be a
major force during a disruption. Now we discuss the
disruptive plasma current decay, especially the force
balance on the plasma taking into account of halo cur-
rent, using the magnetic analysis at first. Then, we de-
scribe halo current measurements. Finally, we discuss a
scaling law of the halo current magnitude.
2. Experimental Device HT-2 Experiments were carried out on the Hitachi To-
kamak HT-2, which is a small tokamak with parameters
listed on Table 1. Figure I shows the poloidal cross sec-
tion of HT-2. There are two types of poloidal field coils
(PFCs). One is the HY-coils. They (HYI to HY8) are
multivariablly controlled poloidal field coils HPFC
[ 12] . The other is single functional PFCS such as hori-
zontal field coil (DH-coil), rapid control horizontal
field coil (AH-coil) and biasing coil (B-coil) for iron
core magnetization. The power supplies are transistor
choppers which are operated by up to 5 kHZ pulse
width modulated (PWM) pulses. The choices of con-
nections between HY-coils and the power supplies are
rather arbitrary. In this experimental series, two kind of
connections were used. Their plasma cross-sectional
shapes are shown in Fig. 2. Figure 2(a) is a plasma cre-
ated by a hybrid type poloidal field coil (A-connec-
tion). Figure 2(b) is a plasma created by B-connection
which is useful to create a plasma with high elongation.
In the A-connection, usually six HY-coils (HY2 to
HY7) are used for a plasrna discharge with six inde-
pendently controlled power supplies. Each coil current
can be controlled independently and variation of the
current distribution on the HY-coils can change the
index of vertical field nv = -(R/Bv) (aBvlaR) (then,
the plasma elongation) and plasma triangularity, as well
Table I Parameters of HT-2.
1998~~ 5 ~]
0.6
o .4
E O,2 ~.
N c:
o ~'
co o o a co ~2 ~:s
L (D > ~O 2
E
~: o) a)
l:
-0.4
-0.6
o.o
Fig. 1
02
ol
o
-o 1
-o.2
0.2 0.4 0.6 0.8 1 .o Maior radius R (m)
Poloidal cross section of the HT-2 tokamak.
(b)
~~~~~~
o 25 o 45 o 65 o 25 o 45 o 65 Major radius (m)
Fig. 2 Plasma cross sectional shapes with vertical elonga-
tion in HT-2 experiments. (a) Plasma created by 6
independent PFCs. (b) Plasma created by independ-
ent OH coil and 8 PFC driven by 4 power supplies.
as plasma positions (vertical position Zp and major
radius position Rp). In the B-connection, eight coils
(HYI to HY8) are used with four independently con-
trolled power supplies. The degree of freedom is less
than the A-connection and triangularity is not controll-
able.
The HT-2 is well equipped with poloidal magnetic
field sensors, which are 15 flux loops, 36 magnetic
probes for poloidal field measurements and two Ro-
gowski coils for plasma current measurements. Among
them, one Rogowski coil and 12 magnetic probes are
492

~~~~5tt;"--'1~~'~~FB)~ Measurement of Halo Current in the HT-2 Tokamak and Investigation of the Scaling Law F~ ~~ , EEI~"p~f4~
placed inside the vacuum vessel. This arrangement
allows sensing of the eddy currents on the vacuum
vessel wall flowing in the toroidal direction. Recon-
struction of the poloidal magnetic field is carried out
using two techniques. One is a technique described in
Refs. [ 10,13] and based on the algorithm developed by
Swain et al. [14], but our reconstruction includes the
magnetic field due to eddy currents on the vacuum
vessel [13]. The other is a technique based on MHD
equilibrium computation and the algorithm developed
by Lao et al. [15]. However, our reconstruction con-
tains the eddy current and poloidal field due to TFC
error field [16].
While the iron core produces a significant mag-
netic field and can not be ignored, the magnetic field
can be calculated assuming a circular cross section with
infinite length. The accuracy of this assumption was
confirmed by an experiment in the former Hitachi To-
kamak HT-1 [17].
Experiments were carried out with vertically
elongated plasmas, which vertical position Zp Was sta-
bilized by an active feedback control. However in order
to trigger VDE, the control was stopped during a dis-
charge. Then, the VDE developed and we measured
halo currents.
Electrodes had been placed in the vacuum vessel,
facing the plasma, in order to measure the halo current.
The placements of the electrodes and Rogowski coils
on the poloidal cross section are shown in Fig. 3. Six
toroidal rows of electrodes were placed and bottom two
rows of electrodes had Rogowski coils to measure halo
Voltage measurement
[t_~ ~} vacuum vessel
ll
currents. Top two rows were insulated electrically from
the vacuum vessel and voltage between these electrodes
could be measured. Each row was divided into four
electrodes in the toroidal direction, and halo currents
were measured in every 90 degrees toroidal section on
bottom two rows. Electrodes numbered 1,3,5,7 were
placed on the small major radius (R) row and those
numbered 2,4,6,8 were placed on large R row. During
the VDE in the experimental series, plasma position
was tuned to disrupt between the bottom two electrode
rows as shown in Fig. 3. In order to optimize the
plasma position, the vertical field offset was changed
shot by shot. Then, the electrode currents IEI to IE8
were measured. The halo current intensity IHL may be
defined as integrated value on plasma facing wall. How-
ever, total electrode currents as shown by the equations
below are used in the following parts of this paper,
IEI = IEI + IE3 + IE5 + IE7 , (1)
IEO = IE2 + IE4 + I + IE8 , (2) E6
where subscripts show the electrode number for identi-
fication. Usually, we take IEO as IHL in the following
part of this research. The plasma positions at which
plasmas disrupted were confirmed by the magnetic ana-
lysis.
E E, ~r cT)'
co
3. Characteristics of Halo Current in HT-2
Since our final objective of this paper is to obtain a
scaling law of the IHL, we discuss the characteristics
necessary to understand the law. The experimental data
discussed in this section are not only measured halo
current (IEI' IEo) but also information obtained by the
magnetic analysis in the HT-2.
Electrode ¥l
L (Insulated) l
¥¥¥ // ~ i h'/
1: '~_-/ ¥ /¥/¥
~¥
--~ /
If ¥l 1 )l /
!
I
l
plasma I
~
,t
'RO owski coil
Fig. 3 Placements of electrodes in HT-2
for halo current measurements.
.
.
-L
vacuum vessel
3.1 Force balance and results of magnetic analysis
A tokamak plasma has not only toroidal current
but also poloidal current component, and the plasma
experiences a vertical electromagnetic force FzP de-
scribed by,
FzP = FzPpl + FZPE + FZPPFC (3)
where FzPpl is due to interaction between toroidal field
and poloidal current, FZPE is due to poloidal field of
eddy current on vacuum vessel and FZPPFC is due to po-
loidal field of PFCs. The reaction force against FZPE is
on the vacuum vessel and
FZPE ~ (4) . -FZVE
where FZVE is a force on vacuum vessel due to eddy
493

j~ ;~:7 ・ f^k-~~l~~~:~~--**#< ~~74~~~i~ 5 ~* 1998~~ 5 )~
current induced by plasma movement. The FZVE (or
FzPE) and FZPPFC can be obtained from the toroidal cur-
rent calculated by magnetic analysis based on measured
poloidal field data [4,10,11]. However, since the
plasma is in equilibrium condition, the FzP is estimated
to be roughly zero and the FzPpl can be calculated by,
FzPpl = =(FzPE + FzPPFC) = Fzv* _ Llz ' ' ~ r' PPFC (5)
Figure 4 shows results of magnetic analysis for a
VDE with plasma cross sectional shape of Fig. 2(b).
Time evolutions of lp, Poloidal field Bp at poloidal
angle 270 degrees, Zp as current center, vertical forces
on plasma and vacuum vessel FzPT, FZVT are plotted in
Fig. 4(a), and Fig. 4(b) shows flux contours during dis-
ruptive lp decay. The superscripts P and V means that
the forces are acting on the plasma and vacuum vessel
respectively, and superscript T means that the forces
are calculated from toroidal currents only. The forces
FzPT, FZVT are obtained by magnetic analysis and the
forces due to halo currents are not included, i.e., FZPT
FZPE + FzPPFc, and FZVT _ FzPpl is the real force on va-
cuum vessel. Since no toroidal current other than eddy
current flows on vacuum vessel, the FZVT is equal to
FzVE' The plasma current flows in the dotted area. Two
Bp's are for inside (IN) and outside (OUT) of the va-
cuum vessel. In normal magnetic configuration (before
18.6 ms), the Bp's are positive. However, during VDE,
the signals change their signs, showing that the mag-
netic axis moved out of the plasma region after 18.8
ms .
As discussed in Ref. [4], the disruption occurs
with two lp decay phases. During the first decay phase,
lp decays roughly constant decay rate (dlp/dt) and dur-
ing second decay phase it decays exponentially. Total
decay time is around I ms in the HT-2. During the first
phase, the magnetic axis exists in the plasma and hot
core plasma still exists in the closed flux surface as
shown in Fig. 4 upper figure, while the scrape off layer
(SOL) current develops. Entering the second phase,
magnetic axis moves on the vacuum vessel wall and all
(a) 40
30
< ~1 20 ~ *
10 plasma current
O
(b)
0.1
IN
0.03
~ --~--~ ~ ~-H - - * ~ OUT O ~~' ~ o* cO
-0.03 poloidal field (e=270')
. 1~
lb,~..,_
/-h E ~l N +J O ~: o)' a)
I -0.1
E~ O o ~ ~ -4
-8
- O Z ~ h -200 ,L
N LL _400
- O Z ~ ~N 200
LL -400
18 19
-0.2
0.1
~ E ~ N +' O Jc o)
o I -0.1
-0.2
1 8.4ms
'l
' ' :_1~ : . : :;'-
' '/'~ ' ' ' I ""' ' '/'~'~'1~1"" '¥
. * * . ¥' ' '¥' '
/' "r:~:~:~1~:~¥' : :¥' '
' '/' ' '*' ;¥" ::!: :~ ;/' "(:;r'++4+' h ' ~. ,¥' t
' t j' :/:;1 : :*.*: ~~+:¥:¥ ¥ 1'¥::¥;¥;t
'!' ; ' "' :'r' ;¥'."~: . .1_ . ' '7,,.f"' ..:;~.,~. ~~: { :f ' ~ ~ ~
:/: ~{i{
" ; /'/'1'i' :¥: i¥~~:¥:¥a*~*' ' I "',f':/: : ; )
' ' : ~ : :-: :f~'77tT:)~:., ~ ' ' i~ * "¥' ~'~~t*' '+
18.8ms
: r'
"::l . .1F*'
' 'l'
'/' ' ' '/~~' ' ' ' l¥ ' ' ' ' ;¥" I :¥;
':/
':: : :~ : : '
~~: : : [¥{ : :¥:
' ' [ ~: : :
¥ " ' ' l¥{ : :¥; ;¥:
..¥""""" ~ ' ' I : :¥: :¥; '¥
;" ' ' I'~ : : ' :
[
Fig. 4
0.28 0.38 0.48 0.58
Time (ms) MaiOr radiuS R(m) Typical VDE in HT-2 analyzed by magnetic analysis. (a) Time evolution of p]asma current /p and forces. FZPT and FZVT
are vertical forces acting on plasma and vacuum vessel calcu]ated by toroidal current only. FzPPI and Fzvpl are vertical
forces acting on plasma and vacuum vessel due to po[oidal current. (b) Magnetic surfaces during disruptive /p decay.
Time 18.4 ms has magnetic axis during the first phase and time 18.8 ms has no magnetic axis during the second
phase.
494

~~-7~~"~~~^)~ Measurement of Halo Current in the HT-2 Tokamak and Investigation of the Scaling Law ~~**"~, EEIF~"~f 4ti~
magnetic surfaces in the plasma are open as shown in
Fig. 4 Iower figure. Then, plasma is cooled down in-
stantly to several eV temperature. During the first
phase the decay rate dlp/dt depends on the poloidal
magnetic field configuration, while during the second
phase no explicit dependence is observed. This is be-
cause, during the first phase the plasma moves and the
motion depends on the poloidal configuration and a
rapid motion is related to a rapid lp decay [4] ・ The
highly elongated plasma has a rapid lp decay in the first
phase. The second phase has no magnetic axis and no
movement is observed for all kinds of initial plasma
shapes and the decay time constant of the exponential
decay has no dependence on the poloidal magnetic
field configuration.
The arrows on Fig. 4(a) are forces due to the halo
current calculated by Eq. (5). Estimated actual electro-
magnetic forces on the plasma and vacuum vessel are
shown by dotted lines. Assuming the current path
length on the vacuum vessel is 0.12 m which is consist-
ent with magnetic analysis, 3.75 kA halo current is esti-
mated from BT = 1.0 T and 450 N force from Fig. 4.
This current corresponds to 90/. of initial plasma cur-
rent lpo = 42 kA. According to the magnetic analysis
results, following halo current characteristics could be
understood.
(1) Halo current and total force become peak values
at start time of the second phase.
(2) Halo current is large during lp decay phase.
(3) Halo current flow direction is same as TFC current
direction on a poloidal cross section.
A tokamak should be designed to withstand the
peak electromagnetic force, which is observed at the
start of the second phase. The force on the vessel FZVE
calculated by toroidal current is roughly zero at the
start of the second phase, at which time FzPpl has its
peak value. This is consistent with the fact that during
the second phase, no significant motion of plasma cur-
rent center is observed. The force balance at this time
is,
FZPpl = _FZPPFC (6)
meaning that, the PFCS push plasma on the open flux
surface through poloidal magnetic field, while the
plasma is supported by vacuum vessel through the halo
current. The fact that the largest FzPpl is observed at the
start of the second phase means that the open flux sur-
face plays a major role for the halo current. We can
assume that the path length on vacuum vessel in
poloidal direction is equal to Al (= 1.0ap roughly, the
ap is a plasma minor radius) and FZPPFC is equal to
-2JrRpB~FClp. Equation (6) become,
Al IPEAKBT = ~2JTR BPFClpS , PR HL
(7)
where superscript s of lpS means the lp Value is at start
of second phase. This force balance shows the IHPLEAK is
proportional to B~FC which is a radial component of
equilibrium vertical field due to PFCs. Since B~FC is
equal to -nvB~FCZp/Rp, where nv is a decay index of
the vertical field, it can be understood that a VDE of
high I nvl (high elongation) has a large halo current. We
discuss this characteristics by direct poloidal SOL cur-
rent measurements in the following section.
3.2 Results of halo current measurements
We have discussed halo current characteristics
from magnetic analysis based on poloidal magnetic field
measurement in the former section and in this section
we will discuss the characteristics by the direct
measurement of the halo current, which was measured
as the summation of the electrode currents. Typical
time evolutions of lp, halo current IHL (= IEO : in the
following part of this paper, a waveform of IHL is rep-
resented by IEo), electrode currents (IE1' IE2), Zp and
visible light intensity (CIII, ionization energy is 24 eV)
are plotted in Fig. 5. Positive electrode current means
that the halo current is flowing from the plasma
through the electrode into the vacuum vessel. Since the
electrode currents (IE1' IE2) are roughly same magni-
tude with opposite direction, we believe that the plasma
disrupted at radial position just between these two elec-
trodes as shown in Fig. 3. From these measured data
and total electrode current IEO thought to be equal to
IHL, following facts can be read.
(1) The halo current flows only during disruptive lp
decay.
(2) The halo current takes its peak value at start time
of the second phase.
(3) The halo current flows toward the same direction
as the TFC coil current on a poloidal cross-section.
Considering the flux contour on Fig. 4 and electrode
placement on Fig. 3 , this shows that halo current flows
along magnetic force lines.
(4) Step increases of electrode currents are observed
in coincident with positive lp spikes, which occur at
same time as negative loop voltage Vl spikes. This
makes plasma current distributions flat and the plasma
current flow in the scraped off layer.
(5) Oscillating signals are observed in first phase.
These oscillational signal characteristics are considered
to be representing the MHD oscillation in the plasma.
However, since the typical oscillating frequency is
495
j~ ;~7 ・ ~~~~~~Arl~"~~~~-pd~~ 1998~P 5 ~l
~ ~ ~ o*
~ ~ J I
20
10
o
_ o O uJ c, -1 .o
~ O.5
UJ O
~ ~ c¥:
UJ
o
-0.5
O
:) -4 ~ I
Z
-< 2 1 ,L N O
21 .6 22.4 23.2 24.0 Time (ms)
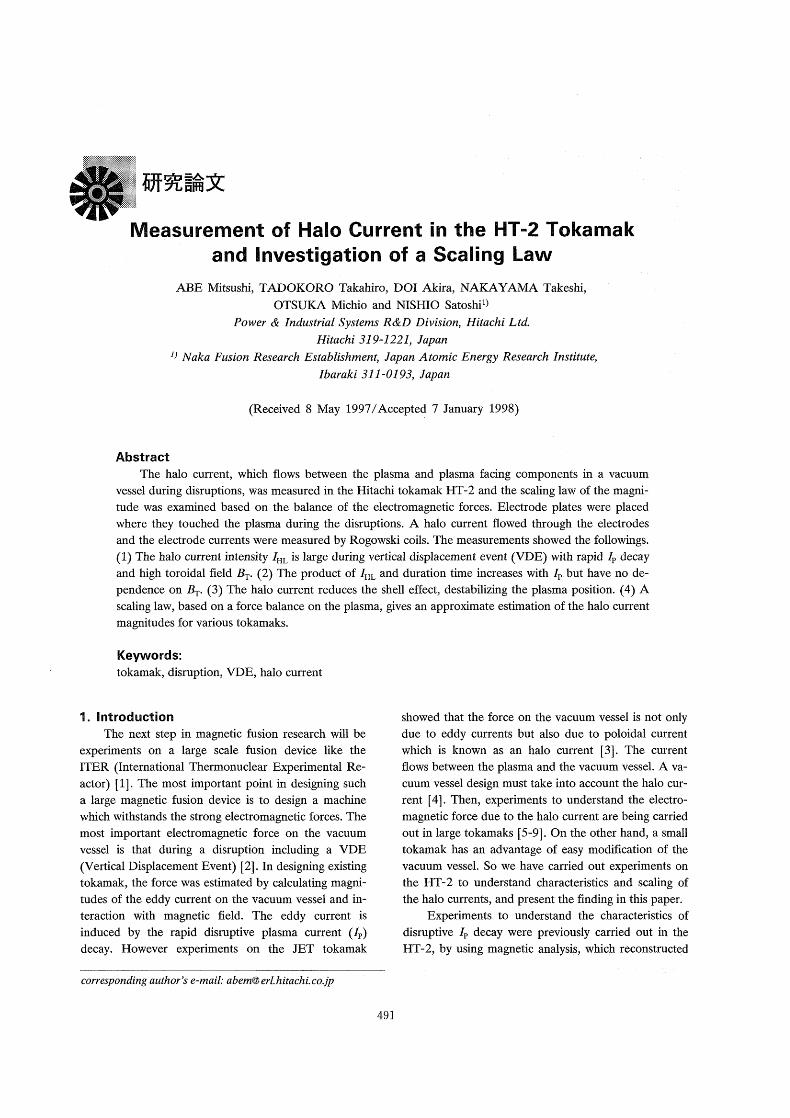
Fig. 5 Typical downward disruption with halo current in
HT-2 at BT = 0.8 T. P[asma current /p, halo current
/H~' electrode currents /E1・ /E2. vertical plasma posi-
tion Zp and light intensity from CHI(C2+) are plotted.
The vertical dashed line is a time that the second
phase (ll) of disruptive /p decay start. The first
phase is shown by I. Positive electrode current
means the current flows from plasma into vacuum vessel.
40
< ~:: 2C ~~
~~ O ~ O J I - -1 <~ 0.5
Lu O ~ -0.5
< ~ 0.5 ~-~J O
-0.5
<~e,+_ 0.5
(c' O UJ
~ -0.5
<x ,0.5
~ O -O 5
Plasma current 21 27 BT=0.6T
higher than 50 kHZ in HT-2 and a few kHZ in large to-
kamaks, such short force pulse can be ignored in the
mechanical design.
The results (1-3) are consistent with the results
from magnetic analysis (Fig. 4), in which electromag-
netic forces were discussed. Other than electrode cur-
rent waveforms, the intensity of Clll is decreased in the
second phase, suggesting that plasma is cooled down to
a very low temperature, which is consistent with the
magnetic analysis again, i.e. no closed flux in the
plasma during second phase. According to these results
of section 3.1 and 3.2, we will pay attentions on the
halo current at the start time of second phase to
examine the IHP~AK-
3.3
and
Dependence of halo current magnitude on toroidal field and plasma current
Halo current is suggested to be affected by BT, IP
B~FC, as discussed on section 3.1. Equation (7)
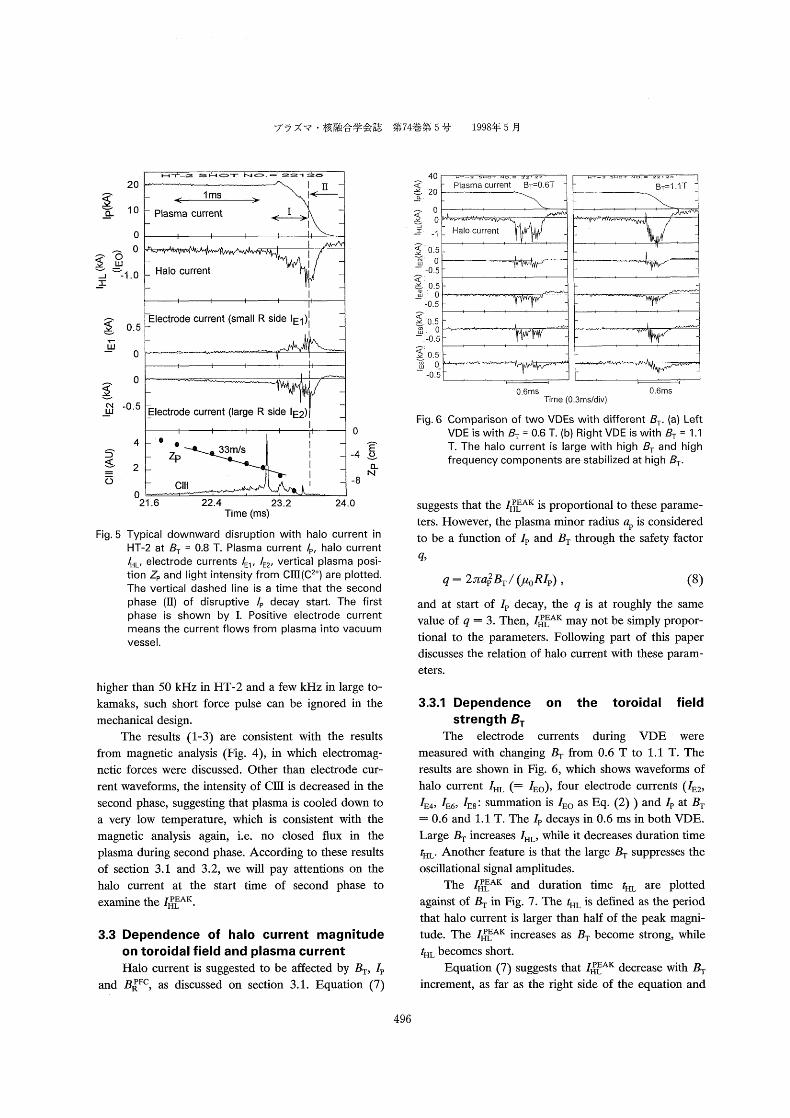
Fig. 6
Halo current
o 6ms 0.6ms Time (0.3ms/div)
Comparison of two VDES with different BT' (a) Left
VDE is with BT = 0.6 T. (b) Right VDE is with BT = 1.1
T. The halo current is large with high BT and high
frequency components are stabilized at high BT.
suggests that the IHPLEAK is proportional to these parame-
ters. However, the plasma minor radius ap is considered
to be a function of lp and BT through the safety factor
q,
q = 2gTap2BT/ (/loRlp) , (8)
and at start of lp decay, the q is at roughly the same
value of q = 3. Then, IHPLEAK may not be simply propor-
tional to the parameters. Following part of this paper
discusses the relation of halo current with these param-
eters.
3.3.1 Dependence on the tOroidal field Strength BT
The electrode currents during VDE were measured with changing BT from 0.6 T to 1.1 T. The
results are shown in Fig. 6, which shows waveforms of
halo current IHL (= IEo), four electrode currents (IE2,
IE4, IE6, IE8 : summation is IEO as Eq. (2) ) and lp at BT
= 0.6 and 1.1 T. The lp decays in 0.6 ms in both VDE.
Large BT increases IHL, while it decreases duration time
tHL. Another feature is that the large BT suppresses the
oscillational signal amplitudes.
The IHPLEAK and duration time tHL are plotted
against of BT in Fig. 7 . The tHL is defined as the period
that halo current is larger than half of the peak magni-
tude. The IHPLEAK increases as BT become strong, while
tHL becomes short.
Equatron (7) suggests that IHPLEAK decrease with BT
increment, as far as the right side of the equation and
496

~~~~5t~~*-'-1~~'~~EE~~ Measurement of Halo Current in the HT-2 Tokamak and Investigation of the Scaling Law p~ ~~ , EEIF'~"~f{~
~2 ~_
~
~ a'
(Q
> ~: 1 (U (1)
~ ~ c (1'
::l
o ~2 (o
:C: o
><
- - tHL x
x x
e
e
IHLPEAK e
o
X'~ .~ x
0.6 0.7 0.8 0.9 i.O i 1 Toroidal fi~ld strength BT(T)
0.5:
0.4.
031 ~~ E_ JI
0.2* -
o. 1
o
Dependence of halo current on toroidal field strength BT. The halo current has a positive de-
pendence on BT.
becomes small with increasing BT With constant q = 3
and this results in large Zp displacement at start of the
second phase and large B~FC in Eq. (7). This fact can
change the BT dependence of the IHPLEAK. For weak BT,
the lp starts to decrease when vertical displacement and
B~Q are still small, meaning that the destabilizing force
is weak, plasma movement is slow and the tHL is ex-
pected to be long.
Fig. 7
A I are constant. However, this idea conflicts with the
experimental results, which can be explained as follows.
The lp decay starts with roughly q = 3 and the plasma
cross sectional area is considered not to change much
during lp decay as Fig. 4. The halo current flows on the
SOL and the flow is on the open flux surface during lp
decay along half circular shaped magnetic surface at
about r = 0.5 ap (ap : at start of lp decay). The ap
3.3.2 Dependence of halO Current on the ini-tial plasma current
The VDE experiments with lpo = 25, 20, 15, 10
kA were carried out in order to obtain the relation be-
tween lp and IHL and the results are shown in Fig. 8 .
The decay rates dlp/dt's of the two phases are roughly
same for these VDEs, except lpo = 10 kA case in which
the first phase is not clear. The VDES With lpo = 25, 20,
1 5 kA have peak IHPLEAK of roughly I kA, while lpo = 10
kA VDE has very small IHPLEAK and large lpo VDE has
long tHL. The parameter IHPLEAKtHL can be roughly ex-
pressed by,
IHPLEAK tHL = 0.037(l~ - 8 [kA]) [AS] (9)
The reason why halo current is small at ~ = 10
40 -2 s OT O.= Plasma current
21 29
< 20 ~ ~ O
r'
-< O ~:
~ -1
40
< ~・:
~ ~ 20
_ o < ~ J o ~
l -1
lp0=25kA
1 ms
-2 s OT O lp0= I OkA
21 32
1 ms
Fig. 8 Dependence of ha]o current on plasma current ~. The peak current does not depend on ~ at ~ > 15 kA but product
of peak current and duration time has positive dependence on ~.
497
j~ ;~~7 ・ ~~~~~i~~~~~~~-"~.*.
kA and expected to be zero at around lpo = 8 kA, can
be recognized as follows. The halo current considered
to be originally a poloidal component of plasma cur-
rent, which component is small at a condition of poloi-
dal beta fip = 1.0, at which plasma kinetic pressure P
and poloidal magnetic pressure B~/(2l/o) are balanced.
Such low lp Plasma can be at this condition during
VDE. For example, electron density n* = 6XI019 m~3
and electron temperature T* = 7 eV give plasma pres-
sure of P = 78 Pa, while B~/(2/lo) was 78 Pa at lp = 7
kA assuming ap = 0.1 m. We consider that the reason
why halo current is small at lpo = 10 kA is that poloidal
component current in plasma is small.
'~,
< ~: ,,'~,
~
15
O
(a)H ~2 s OT r'o'= '997 O. 24ms BT::1. IT
~ plasma current I fp i =51 MA/s
'~,
< !~ ¥j J I
o Halo current
-800 (Large R side)
~ <!~ 75
~ CL
'~ < ~: *~, J I
'~ < ~( ¥l CL
'~,
< ~: ,~' J I
O
o
-800
15
o
O
-800
O. 6mS
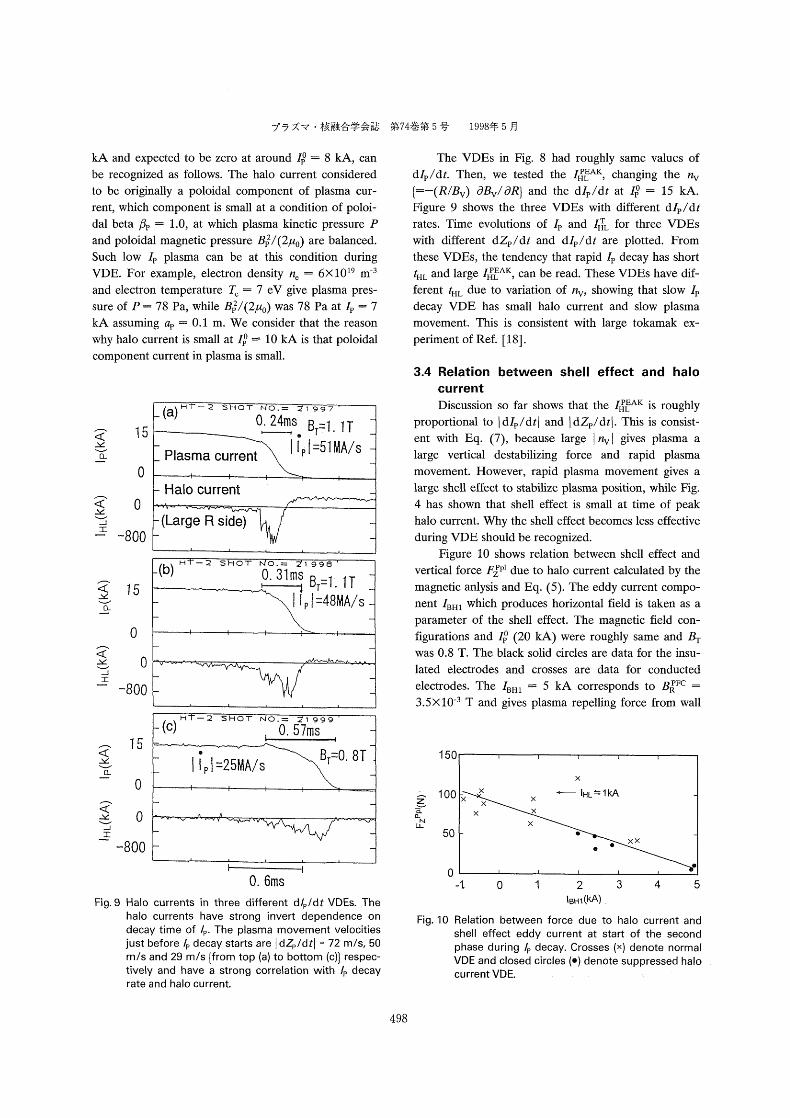
Fig.9 Halo currents in three different d/p/dt VDEs. The
halo currents have strong invert dependence on decay time of /p. The plasma movement velocities just before /p decay starts are I dZpldtl = 72 m/s, 50
m/s and 29 m/s {from top (a) to bottom (c)} respec-
tively and have a strong correlation with lp decay
rate and halo current.
~~74~~~~ 5 ~~+ 1998~j~ 5 ~J
The VDES in Fig. 8 had roughly same values of
dlp/dt. Then, we tested the IHPLEAK, changing the nv
{=-(R/Bv) aBVlaRJ and the dlp/dt at lpo = 15 kA.
Figure 9 shows the three VDES With different dlp/dt
rates. Time evolutions of lp and IHTL for three VDES
with different dZp/dt and dlp/dt are plotted. From
these VDEs, the tendency that rapid lp decay has short
tHL and large IHPLEAK, can be read. These VDES have dif-
ferent tHL due to variation of nv, showing that slow lp
decay VDE has small halo current and slow plasma
movement. This is consistent with large tokamak ex-
periment of Ref. [18] .
3.4 Relation between shell effect and halo
current Discussion so far shows that the IHPLEAK is roughly
proportional to I dlp/dtl and I dZp/dt]. This is consist-
ent with Eq. (7), because large I nv I gives plasma a
large vertical destabilizing force and rapid plasma
movement. However, rapid plasma movement gives a
large shell effect to stabilize plasma position, while Fig.
4 has shown that shell effect is small at time of peak
halo current. Why the shell effect becomes less effective
during VDE should be recognized.
Figure 10 shows relation between shell effect and
vertical force FzPpl due to halo current calculated by the
magnetic anlysis and Eq. (5). The eddy current compo-
nent IBHI which produces horizontal field is taken as a
parameter of the shell effect. The magnetic field con-
figurations and lpo (20 kA) were roughly same and BT
was 0.8 T. The black solid circles are data for the insu-
lated electrodes and crosses are data for conducted
electrodes. The IBHI = 5 kA corresponds to B~FC =
3.5xl0-3 T and gives plasma repelling force from wall
Z ~ N LL
i50
100
50
o
)<
x
X
X X
x
x
- IHL~FlkA
e o x><
Fig. 10 -1 4 5 1 3
O 2 IBHI (kA)
Relation between force due to halo current and shell effect eddy current at start of the second
phase during /p decay. Crosses (x) denote normal
VDE and closed circles (e) denote suppressed halo
current VDE.
498

Measurement of Halo Current in the HT-2 Tokamak and Investigation of the Scaling Law F~~"~, EEIF'~'=~?4til
of 1 10 N at lps = 13 kA. The data points are roughly on
the line from IBHI = O kA, FzPpl = 100 N to IBHI = 5
kA, FzPpl = O N. This means that forces from shell effect
and halo current are in a tradeoff relation. We claim
that the halo current decreases the shell effect and ac-
celerates the plasma motion and lp decay.
There are two reasons that decrease the shell ef-
fect. One is that, Iarge IHL (or FzPpl) means that the SOL
current is large, and the plasma current in the core
plasma is relatively small, while the current which is ef-
fective for the shell effect is that in the core because the
current position is moving. The other is that the halo
current is the plasma current which penetrates into the
vacuum vessel and the current on the vessel is in oppo-
site toroidal direction of the shell effect. The halo
current produces a stabilizing force on SOL plasma,
however it has no effect on the core plasma of the first
phase. The core plasma can be stabilized by the shell
effect, on which the halo current has no effect. The
movement of the core plasma, then lp decay is faster
with halo current than without it.
The maximum halo current is observed with IBHI =
O kA. This is a condition for Eq. (7) and consistent
with Fig. 4. This fact can be a help to discuss the halo
current intensities in tokamaks.
Figure 1 1 compares lp decay characteristics of
VDE on insulated electrodes and conducted electrodes.
The lp decayed in 1.6 ms on insulated electrodes (Fig.
1 1(a)), while 0.8 ms on conducted electrodes (Fig.
11(b)). Insulated electrodes are placed at top as illus-
trated in Fig. 3 and VTL Was measured there, while halo
current was measured at bottom. The differences in
waveforms of VTL and IHTL between Fig. 1 1(a) and Fig.
1 1(b) are due to the direction of VDE or conductive
condition of electrodes. It can be clearly understood
that reduction of halo current results in slow plasma
movement and slow lp decay during VDE.
4. Formulation of Halo Current Scaling Law
The experimental results discussed in the former
section can be summarized as follows.
( 1) The characteristics of halo current estimated from
force balance based on magnetic analysis are consistent
with directly measured halo current.
(2) Peak halo current IHPLEAK is observed at start of the
second phase, at which time, electromagnetic force due
to poloidal field by PFCS are balanced with force due
to halo current and shell effect is weak.
~ <~ 20
~ o
- 600 < H~ O J -:: -600
~> 30 ~ >~
,~ > ,~' J H >
CO
300
O
-300
~I
8
~ 4 E o ~ ONCL
-4
-8
Fig. 1 1
Time 2ms Time 1 ms
Plasma current lp decay and plasma vertical position Zp (O) movement during VDE to insulated electrode and con-
ducted electrode. Halo current and e]ectrodes currents were measured at bottom and top respectively. The /p decay
rate and measured /HTL, VTL values depended on VDE direction. (a) Upward VDE toward insulated electrodes which is
iocated at top. (b) Downward VDE toward conducted eiectrodes which is located at bottom.
499

j~ ;~7 ・ ~~~~~ki~~~:A*--_~*~ 1998~j~ 5 ~j
(3) A VDE with rapid plasma vertical movement and
lp decay has large halo current, which is due to large
destabilizing force.
We discuss a scaling law for halo current with
above experimental results. The term (2) supports force
balance equation of Eq. (7), which we use to get the
law in this paper. The balance is shown in Fig. 12 sche-
matically. Plasma cross sectional shape during normal
operation is shown by a dotted line and the solid lines
show flux surfaces at start of the VDE second phase.
The force FZPPFC which pushes down the plasma, while
FzPpl pushes up it. These two forces are balanced each
other in peak halo current condition at the start of the
second phase.
4.1 Discussion on scaling law of halo current
magnitude As discussed so far, Eq. (7) is a basic scaling law
for the halo current. However, it is necessary to change
such parameters as B~FC and lp into machine parame-
ters like maj or and minor radii of the plasma or vacuum
vessel. Since we are considering the force balance at
start time of the second phase and the plasma area on
/ ¥ //p~ma ~fore VDE ¥¥
Current oenter before VDE
X
E
poloidal section does not change much during VDE,
the plasma current center position Zp is approximated
by,
~
Plas
~
FHL ' ll
><C ent c
/
~PFC ~
current
-'-'F IHL
;~* C::l
~:
A model for a halo current scaling law. Forces due
to halo current and PFC fie!d are balanced at start
of the second phase in disruptive /p decay. Scrape-
off plasma current is flowing in dashed area. Forces due to eddy current can be ignored at this
timing.
Zp = -(hv a ) (10) where hv is a vertical minor radius of the vacuum vessel
and ap can be understood a distance from plasma
center to vessel wall, as shown in Fig. 1 2. Using the
decay index of the vertical field, B~FC can be expressed
by,
BPFC = _nv(Bv/Rp)(hv ~ ap) (11) R
In this equation, the vertical field Bv can be easily cal-
culated for lpo by Shafranov's equation. The plasma
current lp in Eqs. (10) and (11) is that at start of the
second phase, which is estimated to be,
lpS = IpoQv/(Qp[5 eV] + Qv) ' ( 1 2)
at maximum [ 1 1]. The largest lpS is calculated to be 0.7
lpo in the HT-2 because of Qp(5 eV) = 6 m~ and Qv =
14 m~~. As Al is assumed to be about ap and using Eqs.
(11) and (12), the force balance Eq. (7) at start time of
disruptive lp decay second phase, yields IHPLEAK of,
IHPLEAK = 2JcnvBvlpS(hv ~ ap)1(ap BT) (13)
where ap is related to q by Eq. (8), and we adopt values
of just before disruptive lp decay for ap and around q =
3, i.e. ap is calculated by Eq. (8) with lp = Ipo. Since the
Bv is a function of lpo, the peak halo current IHPLEAK of
Eq. (13) is a function of BT and lpo. Figure 13 shows IHL
as a function of BT With a lpo of 20 kA, which is consist-
ent with the experimental results of Fig. 7. The IHPLEAK'S
are calculated with three q values of 2.5, 3.0 and 3.5.
Equation (13) represents the positive dependence on
~ ~ J :C:
i. 5
l. O
o. 5
Fig. 12 o
A
~
A
x
--~--~;-*=e-
A X
q L 2.5 1.0
3.5 O.75
3.0 1.0
A X
A X
lp0=20kA.
ap0=0. I m
nv=-1 .9
A X
Fig. 13
o. 6 o. 8 o. 9 l. o o. 7
BTCr)
Simu]ated haio current peak vaiues against toroidal field strength BT for HT-2
means Al/apo.
l. l
plotted
The L
500

Measurement of Halo Current in the HT-2 Tokamak and Investigation of the Scaling Law FD! ~~~ ,
Q EHF'~'=~f 4L~
BT and we can conclude that Eq. ( 1 3) roughly explains
the experimental results with around q = 3, claiming
that the halo current magnitude can be explained by the
force balance on the plasma.
The scaling law of Eq. (13) was adopted to other
tokamaks. The number nv is estimated from geometri-
cal magnetic field configuration as
nv = ~(R/Bv)(aBvlaR) = -(R/Bv)(aBR/ aZ)
~~ RBR/(BvhNL) , (14) where we assume that the plasma has a divertor con-
figuration and null point is at Z = -hNL. In this equa-
tion Bv, BR are poloidal magnetic fields due to PFCS at
the vacuum vessel center and null point respectively.
The hNL is a vertical distance from magnetic axis to null
point of poloidal field and is approximately equal to hv'
Since the BR is canceled by the field due to plasma cur-
rent at the null point, we use BR = /40lpo/(2Jthv) at Z =
-hNL. The Zp at start of the second phase is -(hv ~
ap). Assumption of linear dependence of BR on vertical
position yields BR = /lolpo(hv ~ ap)/(2Jth~) at Zp =
-(hv ~ ap). Then, FZPFC is,
FZPFC = /loRplpOlpS (hv ~ ap)/(h~) .
and halo current is
IHPLEAK = /loRplpOlpS (hv ~ ap)/(apBThv2)
(15)
(16)
where ap is a minor radius with q = 3 with lpo and this
equation gives halo current magnitude of plasma with
null point.
Table 2 shows scaled halo currents for several to-
kamaks, where the lpS was assumed to be lp0/2. The
scaled IHPLEAK'S are consistent with experimental results
for tokamaks other than ITER. Then we can say that
the scaling law of Eq. (16) can provide a good estima-
tion of the IHPLEAK for various tokamaks' VDES and the
scaling law is useful equation for estimation of halo cur-
rent magnitude. This scaling law gives 3.1 MA halo
current for ITER and the magnetic force is estimated to
be 64 MN. In the Table 2 estimation, Iarge uncertain-
ties are due to the uncertainty of lpS. We assume that lps
is lp0/2 for all tokamaks in Table 2 estimation. However
our experimental results showed that lpS is small with
low Qv [11]. Then we can say that low Qv tokamak
like ITER is expected to have a smaller halo current
magnitude than the table 2 values.
5. Conclusion In order to examine characteristics and a scaling
law of halo current which flows between plasma and
vacuum vessel, an experimental study of force balance
on plasma and halo current measurements during
VDES Were carried out in the Hitachi Tokamak HT-2.
The former was based on magnetic analysis using
measured poloidal magnetic field data and the latter
was based on the direct measurements using electrodes
facing the plasma. The following findings were ob-
tained.
(a) The halo current becomes its peak value at start of
the second phase of disruptive lp decay.
(b) The peak current of IHL is large in high toroidal
field BT and in rapid lp decay VDE.
(c) The product of IHL and duration time increases
with lp but had no dependence on BT.
(d) The halo current reduces the shell effect, destabi-
lizing the plasma position.
(e) The lp decay rate can be reduced by insulated first
wall.
Table 2 Estimation of halo currents using the scaling law.
501

~~74~~~~~ *o =~. 1998~~ 5 ~
(D At the time that halo current takes its peak value,
the electromagnetic force on plasma due to PFCS is bal-
anced with force due to halo current.
Following the experimental results, a scaling law
based on the force balance of plasma was proposed.
The scaling law gives approximate estimations of the
halo current magnitudes for various tokamaks and pre-
dicts 3.1 MA halo current with 64 MN vertical force
for the ITER.
Acknowledgments The authors thank Dr. Yoshino and Dr.
of JAERI for fruitful discussions.
Neyatani
References [ 1] R. Aymar, 16th IAEA Fusion Energy Conference,
Montreal. Canada, 7-11 October, (1996), IAEA-
CN-64/01-1. [2] A. Doi, K. Takeuchi, M. Abe, M. Otsuka et al.,
Abstract of the 9th annual meeting of the Japan So-
ciety of Plasma Science and Nuclear Fusion Re-
search, 121 (1992).
[3] P. Noll, L. Sonnerup, C. Froger, M. Huguet and J.
Last, Fusion Technology 15, 259 (1989).
[4] M. Abe, K. Takeuchi and M. Otsuka, J. Plasma
Fusion Res. 69, 352 (1993).
[5] M.A. Pick, P. Noll, P. Barabaschi, F.B. Marcus
and L. Rossi, Proc. 14th Symposium on Fusion
Engineering, p.187 (1992).
[6] L.L. Lao and T.H. Jensen, Nucl. Fusion 31, 1909
(1991).
[7] A.G. Kellman, ITER Specialist Meeting on Verti-
cal Displacement Events and Disruption Generated
Runa wa y El ectrons, July 23-25, Garching,
(1990).
[8] E.J. Strait, L.L. Lao, J.L. Luxon and E.E. Reis,
Nucl. Fusion 31, 527 (1991).
[9] Y. Neyatani, R. Yoshino and T. Ando, Fusion
Technology 28, 1634 (1995).
[ 10] M. Abe, K. Takeuchi, H. Fukumoto, M. Shimizu
and M. Otsuka, Jpn. J. Appl. Phys. 29, 395 (1990).
[1l] M. Abe, A. Doi and M. Otsuka, J. Plasma Fusion
Res. 71, 620 (1995). (in Japanese).
[ 12] M. Abe and K. Takeuchi, Fusion Technology 29,
277 (1996).
[13] M. Abe, A. Doi, K. Takeuchi, M. Otsuka, S. Ni-
shio et al., J. Plasma Fusion Res. 70, 671 (1994).
[14] D.W. Swain and G.H. Neilson, Nucl. Fusion 22,
1015 (1982).
[15] L.L. Lao, H. St. John, R.D. Stambaugh, A.G.
Kellman and W. Pfeiffer, Nucl. Fusion 30, 1035
(1990).
[ 16] M. Abe and K. Takeuchi, Kakuyugo-Kenkyu 67,
257 (1992).
[17] M. Abe, M. Otsuka. M. Nishi, T. Kanamori, T.
Kobayashi and S. Uchikawa, Proc. 9th Symposium
on Engineering Problem of Fusion Research,
Chicago 1981.
[18] R. Yoshino, Y. Neyatani, N. Isei, Y. Koide, Y.
Kawano, A. Tanga, D. Campbell, M.F. Johnson
and L. Rossi, 15th International Conference on
Plasma Physics and Controlled Nuclear Fusion Re-
search, Seville, Spain, 26 September - I October,
( 1994), IAEA-CN-60/A-5-II-2.
502