medicinski fakultet antonela matananeuron.mefst.hr/docs/graduate_school/tribe/repozitorij... ·...
TRANSCRIPT
SVEUČILIŠTE U SPLITU
MEDICINSKI FAKULTET
ANTONELA MATANA
IDENTIFIKACIJA GENETSKIH I OKOLIŠNIH ČIMBENIKA
UKLJUČENIH U REGULACIJU FUNKCIJE ŠTITNE I DOŠTITNE
ŽLIJEZDE
DOKTORSKA DISERTACIJA
Mentorica: prof. dr. sc. Tatijana Zemunik
Split, 2018.

Ova doktorska disertacija izrađena je na Katedri za medicinsku biologiju,
Medicinskog fakulteta Sveučilišta u Splitu. Istraživanja su provedena u sklopu istraživačkog
projekta Hrvatske zaklade za znanost „Otkrivanje novih genskih lokusa uključenih u
regulaciju funkcije štitne i doštitne žlijezde“ (broj projekta 1498), pod vodstvom prof. dr. sc.
Tatijane Zemunik.

ZAHVALE
Veliko hvala mojoj mentorici, prof. dr. sc. Tatijani Zemunik, koja mi je omogućila da slijedim
svoje snove za edukacijom. Hvala na ukazanom povjerenju, strpljenju, korisnim savjetima i
smjernicama, kao i na nesebično prenesenom znanju kroz posljednje četiri godine.
Hvala svim suradnicima koji su sudjelovali u nastajanju disertacije, a posebice kolegama s
Katedre za medicinsku biologiju. Hvala na prijateljstvu i zabavno provedenom vremenu,
hvala na konstruktivnim savjetima i prijedlozima.
Hvala prof. dr. sc. Damiru Sapunaru i prof. dr. sc. Liviji Puljak na potpori i motivaciji kroz
poslijediplomski studij.
Hvala 'Veseloj družini' i svim prijateljima i dragim osobama na potpori i razumijevanju.
Hvala Marini što sa mnom dijeli svaki trenutak i što je uvijek uz mene.
Neizmjerno hvala tati i mami, bratu i sestri. Hvala vam što ste me uvijek podržavali i
vjerovali u mene. Da nije bilo vas, ne bi bilo ovog, kao ni bilo kojeg drugog mog uspjeha.
I na kraju, mom najdražem Lovri hvala što svemu daje smisao i značaj. Hvala ti što si mi
uvijek bio snaga, hrabrost i motivacija. Uz oslonac poput tebe ništa nije teško.
1
1. SADRŽAJ
1. SADRŽAJ .............................................................................................................................. 1
2. POPIS OZNAKA I KRATICA .............................................................................................. 2
3. PREGLED OBJEDINJENIH RADOVA ............................................................................... 3
3. 1. UVOD ............................................................................................................................ 4
3.1.1. Paratireoidni hormon (PTH), protutijela protiv štitne peroksidaze (TPO-At) i
tireoglobulina (Tg-At) ........................................................................................................ 4
3.1.2. Genetski čimbenici ................................................................................................... 5
3.1.3. Okolišni čimbenici ................................................................................................... 6
3.1.4. Ciljevi istraživanja .................................................................................................... 7
3.2. PREGLED METODOLOGIJE OBJEDINJENIH RADOVA ........................................ 8
3.2.1. Ispitanici ................................................................................................................... 8
3.2.2. Fenotipski podaci ..................................................................................................... 8
3.2.3. Genotipski podaci ..................................................................................................... 9
3.2.4. Statistička analiza ................................................................................................... 10
3.3. PREGLED REZULTATA OBJEDINJENIH RADOVA ............................................. 13
3.3.1. Cjelogenomska analiza povezanosti za razinu PTH .............................................. 13
3.3.2. Cjelogenomska analiza povezanosti za razine Tg-At i TPO-At ............................ 18
3.3.3. Namirnice povezane s Tg-At i TPO-At .................................................................. 25
3.4. RASPRAVA OBJEDINJENIH RADOVA ................................................................... 28
3.5. ZAKLJUČCI OBJEDINJENIH RADOVA .................................................................. 32
3.6. KRATKI SAŽETAK NA HRVATSKOM JEZIKU ..................................................... 33
3.7. KRATKI SAŽETAK NA ENGLESKOM JEZIKU (SUMMARY) ............................. 34
3.8. LITERATURA .............................................................................................................. 35
4. ŽIVOTOPIS ......................................................................................................................... 40
5. PRESLIKE OBJEDINJENIH RADOVA ............................................................................ 45
2
2. POPIS OZNAKA I KRATICA
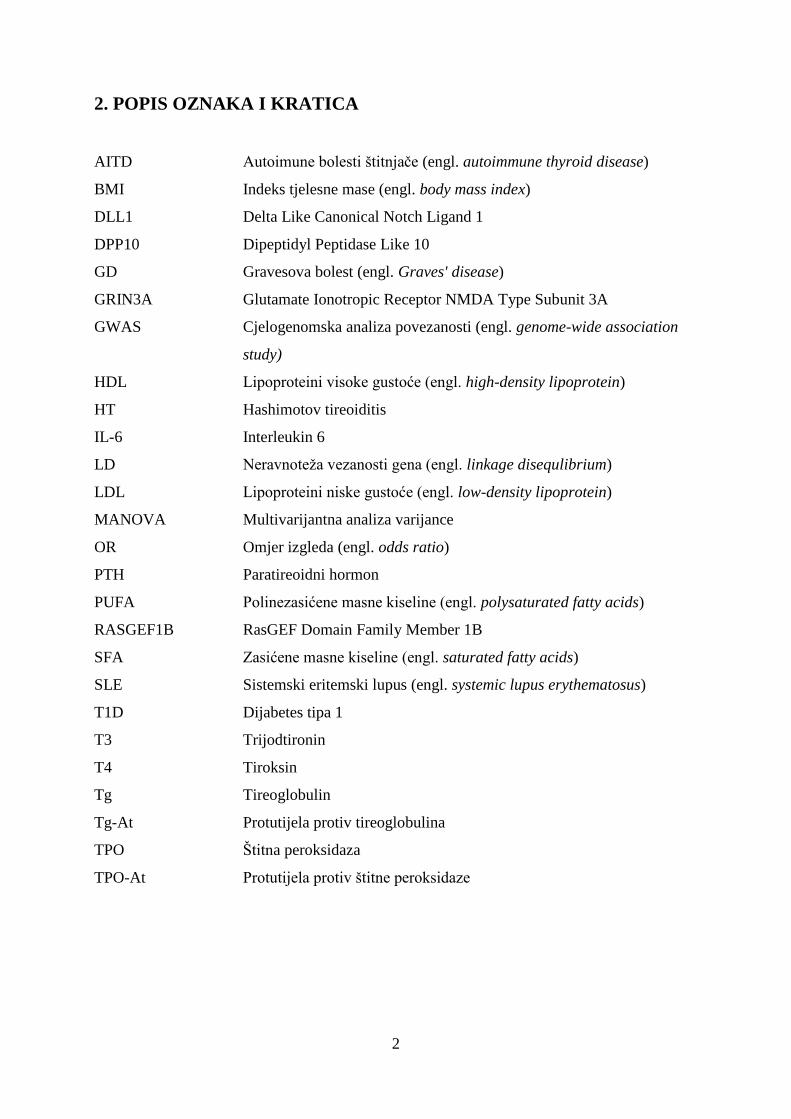
AITD Autoimune bolesti štitnjače (engl. autoimmune thyroid disease)
BMI Indeks tjelesne mase (engl. body mass index)
DLL1 Delta Like Canonical Notch Ligand 1
DPP10 Dipeptidyl Peptidase Like 10
GD Gravesova bolest (engl. Graves' disease)
GRIN3A Glutamate Ionotropic Receptor NMDA Type Subunit 3A
GWAS Cjelogenomska analiza povezanosti (engl. genome-wide association
study)
HDL Lipoproteini visoke gustoće (engl. high-density lipoprotein)
HT Hashimotov tireoiditis
IL-6 Interleukin 6
LD Neravnoteža vezanosti gena (engl. linkage disequlibrium)
LDL Lipoproteini niske gustoće (engl. low-density lipoprotein)
MANOVA Multivarijantna analiza varijance
OR Omjer izgleda (engl. odds ratio)
PTH Paratireoidni hormon
PUFA Polinezasićene masne kiseline (engl. polysaturated fatty acids)
RASGEF1B RasGEF Domain Family Member 1B
SFA Zasićene masne kiseline (engl. saturated fatty acids)
SLE Sistemski eritemski lupus (engl. systemic lupus erythematosus)
T1D Dijabetes tipa 1
T3 Trijodtironin
T4 Tiroksin
Tg Tireoglobulin
Tg-At Protutijela protiv tireoglobulina
TPO Štitna peroksidaza
TPO-At Protutijela protiv štitne peroksidaze
3
3. PREGLED OBJEDINJENIH RADOVA
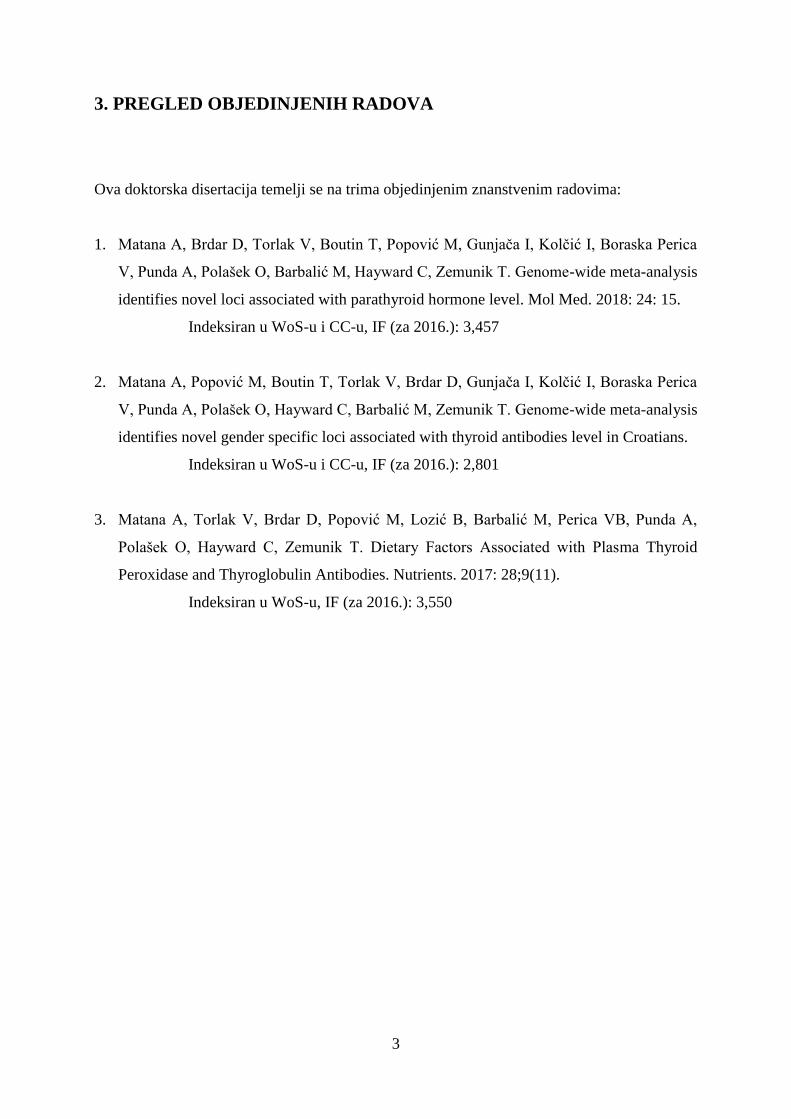
Ova doktorska disertacija temelji se na trima objedinjenim znanstvenim radovima:
1. Matana A, Brdar D, Torlak V, Boutin T, Popović M, Gunjača I, Kolčić I, Boraska Perica
V, Punda A, Polašek O, Barbalić M, Hayward C, Zemunik T. Genome-wide meta-analysis
identifies novel loci associated with parathyroid hormone level. Mol Med. 2018: 24: 15.
Indeksiran u WoS-u i CC-u, IF (za 2016.): 3,457
2. Matana A, Popović M, Boutin T, Torlak V, Brdar D, Gunjača I, Kolčić I, Boraska Perica
V, Punda A, Polašek O, Hayward C, Barbalić M, Zemunik T. Genome-wide meta-analysis
identifies novel gender specific loci associated with thyroid antibodies level in Croatians.
Indeksiran u WoS-u i CC-u, IF (za 2016.): 2,801
3. Matana A, Torlak V, Brdar D, Popović M, Lozić B, Barbalić M, Perica VB, Punda A,
Polašek O, Hayward C, Zemunik T. Dietary Factors Associated with Plasma Thyroid
Peroxidase and Thyroglobulin Antibodies. Nutrients. 2017: 28;9(11).
Indeksiran u WoS-u, IF (za 2016.): 3,550
4
3. 1. UVOD
3.1.1. Paratireoidni hormon (PTH), protutijela protiv štitne peroksidaze (TPO-At) i
tireoglobulina (Tg-At)
Hormon doštitne žlijezde (paratireoidni hormon, PTH) je najvažniji čimbenik u
regulaciji izvanstanične koncentracije kalcija (1). Balans kalcija u krvi od izuzetne je važnosti
za normalno funkcioniranje srca, živčanog sustava, bubrega i kostiju (2). Metabolizam kalcija
reguliran je putem tri glavna mehanizma: koštanih promjena, bubrežne reapsorpcije i
intestinalne apsorpcije (3). Paratireoidne stanice osjetljive su na promjenu koncentracije
kalcija u krvi, te reagiraju na pad koncentracije kalcija pojačanim izlučivanjem PTH i obrnuto
(4). PTH stimulira aktivnosti osteoklasta (stanica koje su odgovorne za razgradnju koštane
mase u kostima), što dovodi do oslobađanja kalcija u izvanstaničnu tekućinu. Nadalje, potiče
reapsorpciju kalcija u završnim distalnim bubrežnim kanalićima i početnim sabirnim cijevima
te u manjoj mjeri i u uzlaznom kraku Henleove petlje, što uzrokuje smanjeno izlučivanje
kalcija. Također, PTH ima neizravan učinak na apsorpciju kalcija u crijevima tako što
povećava crijevnu apsorpciju kalcija induciranjem sinteze aktivnog metabolita vitamina D
(1,25(OH)2D3) u proksimalnim bubrežnim kanalićima, koji regulira apsorpciju kalcija u
gastrointestinalnom traktu (5-7).
Tireoidna peroksidaza (TPO) i tireoglobulin (Tg) su glavne sastavnice štitne žlijezde
koje igraju ključnu ulogu u sintezi hormona štitne žlijezde, tiroksina (T4) i trijodtironina (T3)
(8). Tg jest veliki glikoprotein (660 kDa) koji sadržava aminokiseline tirozina koje se vežu s
jodom u stvaranju hormona štitnjače (9). Unutarstanični jod se oksidira uz pomoć enzima
TPO, kako bi se mogao izravno vezati na tirozinske ostatke molekule tireoglobulina. Kad je
sustav peroksidaze zakočen zaustavlja se stvaranje hormona štitnjače (10).
Autoimune bolesti štitnjače (engl. autoimmune thyroid disease, AITD) spadaju u
najčešće autoimune bolesti te pogađaju 2-5% generalne populacije (11). Povišena razina
protutijela protiv TPO (TPO-At) i/ili Tg (TG-At) može predstavljati ranu fazu u patogenezi
AITD (12). Najčešće autoimune bolesti štitne žlijezde su Hashimotov tireoiditis (HT) i
Gravesova bolest (engl. Graves' disease, GD). HT se manifestira destrukcijom tkiva štitnjače i
smanjenom proizvodnjom hormona štitne žlijezde (hipotireoza), dok GD karakterizira
prekomjerna proizvodnja hormona štitne žlijezde (hipertireoza) (13, 14). Pozitivni nalaz TG-
At prisutan je kod 60-80% osoba oboljelih od HT, te kod 30-60% osoba oboljelih od GD, dok
5
su povišena TPO-At prisutna kod 90-95% osoba oboljelih od HT i kod 80% osoba oboljelih
od GD (15).
Razine hormona doštitne i štitne žlijezde te protutijela protiv štitne žlijezde smatraju se
složenim fenotipovima koji su rezultat interakcije između multiplih gena s malim ili
umjerenim učinkom i jednako važnih čimbenika okoliša.
3.1.2. Genetski čimbenici
Prema provedenim blizanačkim studijama, procjenjuje se da 60% varijacije u razini
PTH određuju genetski čimbenici (16), dok postotak varijacije u razinama protutijela protiv
štitne žlijezde koji se može pripisati genetskim čimbenicima ovisi o spolu. Pokazano je da je
39% varijacije u serumskoj razini Tg-At kod muškaraca i 75% kod žena, te 61% u serumskoj
razini TPO-At kod muškaraca i 72% kod žena genetički uvjetovano (17). Preostali postotak u
varijaciji se može pripisati okolišnim čimbenicima.
Kako bi se definirali genetski čimbenici povezani s određenim svojstvom ili bolesti u
novije vrijeme provode se cjelogenomske analize povezanosti (engl. genome wide association
studies, GWAS). Najvažnija prednost ovog pristupa jest ta što se provodi bez unaprijed
postavljene hipoteze o povezanosti određenog gena i istraživanog svojstva, već se
istovremeno testira i do nekoliko milijuna genetskih polimorfizama (18). Cjelogenomskim
analizama povezanosti otkriveni su brojni genetski polimorfizmi u podlozi različitih bolesti i
kvantitativnih obilježja.
Osim naše studije (Rad 1), do sada je publicirana samo jedna cjelogenomska analiza
povezanosti za serumsku razinu PTH, u kojoj je identificirano pet genetskih lokusa koji su
povezani s razinom PTH (19). Identificirani genetski lokusi smješteni su u blizini gena
CYP24A1, CLDN14, RTDR1 i CaSR te unutar gena RGS14. Međutim, zajednički učinak
navedenih pet genetskih lokusa objašnjava samo 4,2% varijacije u razini PTH, što upućuje na
zaključak kako postoje mnogi drugi polimorfizmi koji još uvijek nisu otkriveni, a ukupno
značajno doprinose nasljednoj komponenti za vrijednosti PTH. Štoviše, od navedenih pet
polimorfizama samo su tri potvrđena u neovisnoj replikacijskoj kohorti (CYP24A1, RGS14,
CLDN14 lokusi) (19).
Do trenutka publiciranja naše studije (Rad 2) nije bila objavljena niti jedna
cjelogenomska analiza povezanosti za Tg-At, te su bile publicirane samo dvije cjelogenomske
analize povezanosti za TPO-At, od kojih je jedna provedena kod bijelaca (20) a druga kod
Azijata (21). Također, publicirana je i studija (22) u kojoj je testirana povezanost 20 genetskih
polimorfizama koji su u prije objavljenoj cjelogenomskoj analizi (20) dosegli sugestivnu
6
razinu značajnosti za povezanost s razinom TPO-At. U navedenim studijama identificirano je
devet genetskih polimorfizama povezanih s razinom i/ili pozitivnim nalazom TPO-At,
uključujući varijante u blizini gena TPO, HCP5, HLA-DPB1 te unutar gena ATXN2, MAG13,
KALRN, BACH2, RERE, HLA-DOB. Zajednički učinak navedenih devet genetskih
polimorfizama objašnjava 4,1% varijacije u razini TPO-At (22). Iz navedenog proizlazi
nužnost dodatnih genetičkih istraživanja koja će doprinijeti otkrivanju pretpostavljenih čestih
varijanti koje utječu na razine PTH, Tg-At i TPO-At.
3.1.3. Okolišni čimbenici
Osim genetskih čimbenika, ističe se važnost utjecaja okolišnih čimbenika na razine
hormona doštitne i štitne žlijezde te protutijela protiv štitne žlijezde. Istraživanja su pokazala
da žene imaju višu razinu PTH od muškaraca, te da s dobi raste i razina PTH (23). Nadalje,
pokazano je da razina PTH varira ovisno i o rasi; naime Afroamerikanci imaju veću razinu
hormona od pripadnika bijele rase (23, 24). Također je pokazano da pušači imaju nižu razinu
PTH od nepušača, te da osobe s većim indeksom tjelesne mase ( engl. body mass index, BMI)
imaju višu razinu PTH (25). Viša razina PTH povezuje se i s višom serumskom razinom
urične kiseline, nižom serumskom razinom kalcija, nižom serumskom razinom 25 (OH)D,
višim sistoličkim i dijastoličkim krvnim tlakom (23, 26, 27), a vjerojatno postoji povezanost s
još velikim brojem nedefiniranih okolišnih čimbenika.
Za nastanak protutijela protiv štitne žlijezde odgovoran je visok unos joda ili suvišak
joda u organizmu (28-30). Od ostalih okolišnih čimbenika, pokazano je da pušenje pospješuje
nastanak GD, dok nema utjecaja na razvoj HT (28). Prema istraživanjima, umjerena
konzumacija alkohola ima dobrotvornu ulogu za razvoj GD i HT (28, 31). Niski unos selena
te niska serumska razina vitamina D se povezuju s većim rizikom za razvoj AITD (28, 31).
Stres bi također mogao biti rizični faktor za razvoj GD, dok utjecaj stresa na nastanak HT nije
dovoljno istražen (28, 31). Unos estrogena djeluje protektivno na nastanak GD (28). Nadalje,
pokazano je da virusne infekcije imaju ulogu u nastanku GD i HT, kao i upotreba različitih
lijekova (28, 31). Što se tiče prehrambenih navika, provedene su samo dvije studije u kojima
je utvrđena protektivna uloga veganske prehrane na razvoj hipotireoze, te protektivna uloga
veganske i vegetarijanske prehrane na razvoj hipertireoze (32, 33). Nedostatak navedene dvije
studije jest taj što hipotireoza i hipertireoza nisu klinički dijagnosticirane, već su ispitanici
samostalno popunjavali upitnik u kojem su naveli boluju li od spomenutih bolesti štitne
žlijezde.

7
3.1.4. Ciljevi istraživanja
Potaknuti prethodno navedenim, osnovni cilj ovog istraživanja bio je cjelogenomskim
analizama povezanosti identificirati nove genetske čimbenike povezane s razinama PTH, Tg-
At i TPO-At u plazmi. S obzirom da postoje evidentne kliničke razlike u razinama PTH, TPO-
At i Tg-At kod muškaraca i kod žena, dodatni cilj ovog istraživanja bio je ispitati postoje li
razlike u genetskoj regulaciji ovih fenotipova kod muškaraca i žena.
Drugi cilj istraživanja bio je ispitati povezanost prehrambenih navika, kao okolišnog
čimbenika, s povišenim razinama protutijela protiv Tg i TPO.
8
3.2. PREGLED METODOLOGIJE OBJEDINJENIH RADOVA
3.2.1. Ispitanici
Istraživanje se provelo na ispitanicima koji su uključeni u projekt „10 001 Dalmatinac
– Hrvatska biobanka“ (34). U genetičkom dijelu istraživanju inicijalno je sudjelovalo 2 869
ispitanika s područja grada Splita te otoka Korčule i Visa, dok je u istraživanju povezanosti
prehrambenih navika s protutijelima Tg-At i TPO-At sudjelovalo 1887 ispitanika s područja
grada Splita te otoka Korčule. U istraživanje su bili uključeni punoljetni ispitanici koji su
dobrovoljno potpisali informirani pristanak nakon upoznavanja s ciljevima istraživanja.
Kako bi se eliminirao nepoželjni utjecaj određenih faktora na rezultate, primijenjeni su
dolje navedeni kriteriji isključenja. U cjelogenomskoj analizi povezanosti za PTH, iz
istraživanja su isključeni ispitanici koji su liječeni zbog poremećaja doštitne žlijezde, kao i
ispitanici čije su vrijednosti PTH u plazmi manje od 5 pg/ml što je blizu donje granice
detekcije razine PTH pomoću korištenog kita (4.3 pg/ml). U cjelogenomskim analizama
povezanosti za protutijela Tg-At i TPO-At, iz istraživanja su isključeni ispitanici koji boluju
od neke bolesti štitne žlijezde, zatim ispitanici koji su pod terapijom zbog poremećaja štitne
žlijezde te ispitanici koji su operirali štitnu žlijezdu. Nakon primjene kriterija isključenja, u
cjelogenomskoj analizi povezanosti za PTH sudjelovalo je ukupno 2 596 ispitanika, za Tg-At
2 629 ispitanika, a za TPO-At 2 618 ispitanika. Istraživanje u kojem se ispitivala povezanost
prehrambenih navika s pozitivnim protutijelima Tg-At i TPO-At dizajnirano je kao
istraživanje slučajeva i kontrola (engl. case-control study). Skupinu slučajeva (N=462) činili
su oni kod kojih je razina Tg-At i/ili TPO-At bila veća od referentnih vrijednosti, odnosno
skupinu kontrola (N=1 425) oni kojima su razine Tg-At i TPO-At bile unutar referentnih
vrijednosti. Iz studije su isključene kontrole koje su bile pod terapijom zbog poremećaja štitne
žlijezde (N=27) ili su bile podvrgnute operaciji štitne žlijezde (N=10). Na posljetku, u
istraživanje je bilo uključeno 462 ispitanika i 1388 kontrola.
3.2.2. Fenotipski podaci
Za svakog od ispitanika bila je dostupna sveobuhvatna baza fenotipskih podataka koja
uključuje podatke koji su dobiveni anketnim upitnicima, antropološkim i biokemijskim
mjerenjima te fizikalnim i kliničkim pregledima ispitanika.
9
3.2.2.1. Biokemijska mjerenja
Plazma za analizu dobivena je iz uzorka periferne krvi, te je nakon centrifugiranja i
odvajanja krvnih stanica odmah pohranjena na -80°C. Mjerenje koncentracije PTH u plazmi
ispitanika obavljeno je ručnom metodom radioimunoesej, a rezultat je dobiven mjerenjem na
scintilacijskom brojaču Capintec (Ramsey, New Jersey, USA). Mjerenje koncentracije TPO-
At i Tg-At u plazmi ispitanika obavljeno je imunoesej metodom kemiluminscencije
korištenjem instrumenta LIAISON (DiaSorin, Saluggia, Italy).
Mjerenja su obavljena na zavodu za Nuklearnu medicinu u Kliničkom bolničkom
centru Split. Referentne vrijednosti za razinu PTH u plazmi su 12,26-35,50 pg/ml, za Tg-At
<16 IU/mL te za TPO-At 5-100 IU/mL.
3.2.2.2. Upitnik o prehrambenim navikama
Podaci o prehrambenim navikama za svakog ispitanika dobiveni su upitnikom koji je
sadržavao pitanja o učestalosti konzumacije 54 namirnice. Na pitanje: „Koliko često
konzumirate navedene namirnice?“ ispitanici su mogli izabrati jedan od ponuđenih odgovora:
„svaki dan“, „2-3 puta tjedno“, „1 put tjedno“, „povremeno“ ili „nikada“. Upitnik je
sadržavao i 4 dodatna pitanja o učestalosti konzumacije raznih vrsta masnoća, a ponuđeni
odgovori su bili: „uvijek“, „ponekad“ i „nikad“. Za potrebe statističke analize, kategorijski
odgovori o učestalosti konzumacije namirnica su pretvoreni u ekvivalentne tjedne unose na
sljedeći način: kategorija „svaki dan“ pretvorena je u 7 puta tjedno, kategorija „2-3 puta
tjedno“ u 2,5 puta tjedno, „povremeno“ u 0,5 puta tjedno i „nikada“ u 0 puta tjedno. Odgovori
za konzumaciju raznih vrsta masnoća su također pretvoreni u tjedne unose: odgovor „uvijek“
je pretvoren u 7 puta tjedno, „ponekad“ u 2,5 puta tjedno i „nikada“ u 0 puta tjedno.
3.2.3. Genotipski podaci
3.2.3.1. Genotipizacija
Uzorci ispitanika s otoka Korčule kao i 531 ispitanika iz Splita (Split 1) genotipizirani
su na genotipizacijskoj platformi HumanCNV370-Duo BeadChip (Illumina, San Diego,
California, USA), kojom se dobiju podatci za 350 000 genetskih polimorfizama. Uzorak za
preostalih 481 ispitanika iz Splita (Split 2) genotipiziran je na Illumina HumanOmniExpress
BeadChip platformi (Illumina, San Diego, California, USA) koja obuhvaća 969 919 genetskih
polimorfizama. Genotipizacija uzoraka ispitanika s otoka Visa napravljena je na
10
HumanHap300-Duo BeadChip platformi (Illumina, San Diego, California, USA) kojom se
dobiju podatci za 317 509 polimorfnih varijanti.
Nakon genotipizacije, provedena je kontrola kvalitete genotipiziranih podataka. Iz
daljnje analize su isključeni genetski polimorfizmi čija je frekvencija rjeđeg alela manja od
1%, zatim polimorfizmi koji ne zadovoljavaju Hardy-Weinbergovu jednadžbu, te
polimorfizmi koji nisu uspješno genotipizirani kod barem 98% ispitanika. Nadalje, iz analize
su izbačeni i ispitanici koji nisu uspješno genotipizirani na barem 97% genetskih
polimorfizama.
3.2.3.2. Imputacija genotipova
Metoda imputacije genotipova (metoda kojom se s određenom vjerojatnošću predviđa
genotip ispitanika za genetske polimorfizme koji nisu direktno genotipizirani) obavljena je na
Sveučilištu u Edinburghu. Imputacija za uzroke ispitanika s otoka Korčule i Visa obavljena je
korištenjem softvera IMPUTE2 prema bazi „1 000 Genoma“ (prema engl. „1 000 Genomes
project“). Uzorci ispitanika sa splitskog područja su prikupljeni i genotipizirani u dva navrata
(Split 1 i Split2). Split 2 je imputiran prema bazi „1 000 Genoma“, dok je Split 1 imputiran
prema spojenom referentnom panelu „1 000 Genoma“ i Splita 2.
Nakon imputacije, provedena je kontrola kvalitete imputiranih podataka. Iz analize su
isključeni genetski polimorfizmi čija je frekvencija rjeđeg alela manja od 1%, zatim
polimorfizmi koji ne zadovoljavaju Hardy-Weinbergovu jednadžbu te polimorfizmi čiji je
info score (parametar kvalitete imputacije) manji od 0.4.
Konačan broj genetskih polimorfizama uključenih u analizu bio je 9 182 797 za
kohortu Korčula, 8 865 173 za kohortu Vis te 8 777 560 za kohortu Split. Broj genetskih
polimorfizama koji su se preklapali u sve tri kohorte bio je 7 411 206.
3.2.4. Statistička analiza
3.2.4.1. Cjelogenomske analize povezanosti
Cjelogenomske analize povezanosti provedene su za svaku kohortu zasebno. Potom su
meta-analizom objedinjeni rezultati pojedinačnih analiza za područja grada Splita, te otoka
Korčule i Visa.
Prije provođenja cjelogenomskih analiza povezanosti razine PTH, Tg-At i TPO-At
prilagođene su za utjecaj dobi i spola, odrednica za koje je pokazano da utječu na razinu
istraživanih fenotipova. Prilagodba se provela metodom linearne regresije, u kojoj je zavisna
11
varijabla bila razina hormona/protutijela, dok su nezavisne varijable bile dob i spol. Potom su
se dobiveni reziduali iz linearne regresije transformirali kako bi se postigla normalna
distribucija, te su oni predstavljali novi fenotip koji se dalje analizirao.
Cjelogenomska analiza povezanosti provela se pomoću linearnog mješovitog modela
(engl. linear mixed model), u kojem su transformirani reziduali zavisna varijabla, a genetski
polimorfizmi prestavljaju nezavisnu varijablu, pri čemu se radi prilagodba za srodstvo
ispitanika. Analize se provode korištenjem aditivnog genetičkog modela. Kako je već prije
naglašeno, ovim pristupom se istovremeno testira nekoliko milijuna polimorfnih varijanti, te
je zbog višestrukog testiranja potrebno prilagoditi granicu značajnosti. Zbog činjenice da je
milijun genetskih polimorfizama nezavisno, za granicu značajnosti uzima se 5×10⁻⁸
(0.05/106). Cjelogenomske analize povezanosti za kohortu Split provele su se pomoću
računalnog programa SNPTEST (35), dok su se za kohorte Korčulu i Vis provele pomoću
paketa ‘GenABEL’ (36) i ‘VariABEL’ (37) programa R.
S obzirom da postoje razlike u razinama PTH, Tg-At i TPO-At kod muškaraca i kod
žena, cjelogenomske analize provedene su i za svaki spol zasebno. Cjelogenomske analize
povezanosti po spolu provedene su na isti način kao i primarne cjelogenomske analize, jedina
iznimka je što se u ovim analizama fenotip prilagodio samo za godine, a ne i spol.
3.2.4.2. Meta-analize
Meta-analiza cjelogenomskih analiza povezanosti, koje su provedene za svaku od triju
kohorti posebno, provela se prema metodi fiksnih učinaka također korištenjem programa R
(38).
Rezultati meta-analiza su grafički prikazani pomoću Manhattan (engl. Manhattan plot)
i kvantil-kvantil grafova (engl. quantile-quantile plot, QQ plot) koji su kreirani korištenjem
paketa 'qqman' programa R (39). Regionalni grafovi povezanosti za polimorfizme od interesa
(engl. regional association plot) generirani su korištenjem programa 'Locus Zoom' (40), dok
je grafikon raspona pouzdanosti (engl. forest plot) generiran korištenjem paketa 'MultiABEL'
programa R (41).
3.2.4.3. Bivarijantna analiza
Za Tg-At i TPO-At, svojstva u umjereno visokoj korelaciji (r=0.5-0.7), dodatno je
provedena i bivarijantna cjelogenomska analiza u kojoj je ispitana povezanost genetskih
polimorfizama s linearnom kombinacijom protutijela protiv Tg-At i TPO-At. Povezanost je
12
testirana multivarijantnom analizom varijance (MANOVA). Osim na cjelokupnom uzorku,
bivarijantna cjelogenomska analiza povezanosti provedena je i na uzorku žena (r=0,6-0,7),
dok korelacija između razina Tg-At i TPO-At kod muškaraca nije bila dovoljno visoka da bi
se provela ovakva vrsta analize (r=0,3). Bivarijantne cjelogenomske analize provedene su
pomoću paketa 'MultiABEL' programa R (41).
3.2.4.4. Prehrambene namirnice povezane s Tg-AT i TPO-AT
Kako bi se ispitala međuovisnost učestalosti konzumacije ukupno 58 namirnica, te
kako bi se broj početnih varijabli smanjio na manji broj ključnih faktora, provedena je
faktorska analiza. Faktori su rotirani ortogonalnom rotacijom (varimax metoda) kako bi se
povećala interpretabilnost rješenja. Pogodnost korištenja faktorske analize na danim podacima
testirana je pomoću Kaiserove mjere za adekvatnost uzorkovanja, te pomoću Bartlettovog
testa za značajnost broja faktora. Svi faktori sa svojstvenom vrijednošću većom od 1 su
zadržani za daljnju analizu.
Povezanost faktora s pozitivnim nalazom protutijela protiv štitne žlijezde testirana je
pomoću logističke regresije. Nezavisne varijable koje su bile uključene u logističku regresiju
su spol i prehrambeni faktori, dok je zavisna varijabla bila pozitivnost TPO-At i/ili Tg-At. Sve
statističke analize provedene su u programu SPSS (prema engl. Statistical Package for the
Social Sciences 16,0; Chicago, Illinois, SAD).
13
3.3. PREGLED REZULTATA OBJEDINJENIH RADOVA
3.3.1. Cjelogenomska analiza povezanosti za razinu PTH
Nakon primjene kriterija isključenja, u istraživanju je sudjelovalo ukupno 2 596
ispitanika čije su karakteristike prikazane u Tablici 1.
Tablica 1. Karakteristike ispitanika uključenih u studiju.
Karakteristike Korčula Vis Split
Broj ispitanika uključenih u analizu 806 831 959
Žene, N (%) 524 (65%) 486 (58%) 586 (61%)
Medijan godine, (qL,qU) 57 (47, 67) 57 (45,69) 52 (40, 61)
Medijan PTH, pg/ml (qL,qU) 19.9 (13.7, 29.1) 25.9 (18.4, 32.1) 21.6 (17.2, 26.5)
Oznake: qL- donji kvartil, qU-gornji kvartil.
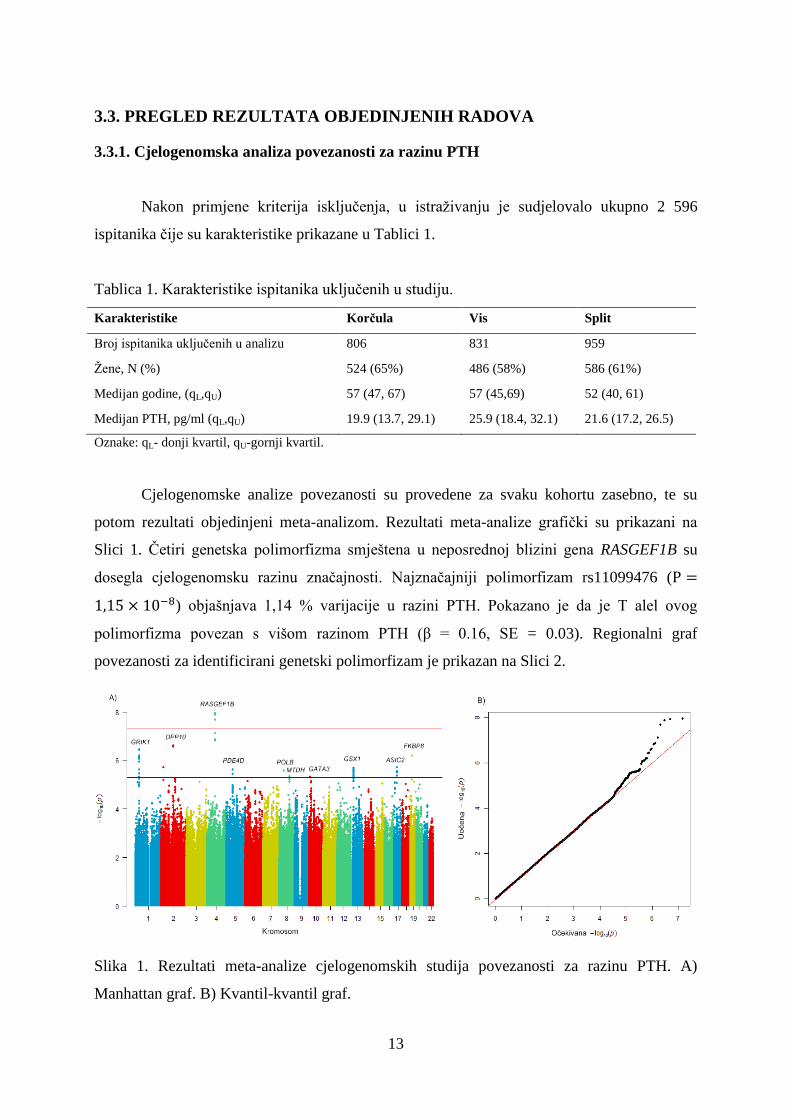
Cjelogenomske analize povezanosti su provedene za svaku kohortu zasebno, te su
potom rezultati objedinjeni meta-analizom. Rezultati meta-analize grafički su prikazani na
Slici 1. Četiri genetska polimorfizma smještena u neposrednoj blizini gena RASGEF1B su
dosegla cjelogenomsku razinu značajnosti. Najznačajniji polimorfizam rs11099476 (
) objašnjava 1,14 % varijacije u razini PTH. Pokazano je da je T alel ovog
polimorfizma povezan s višom razinom PTH (β = 0.16, SE = 0.03). Regionalni graf
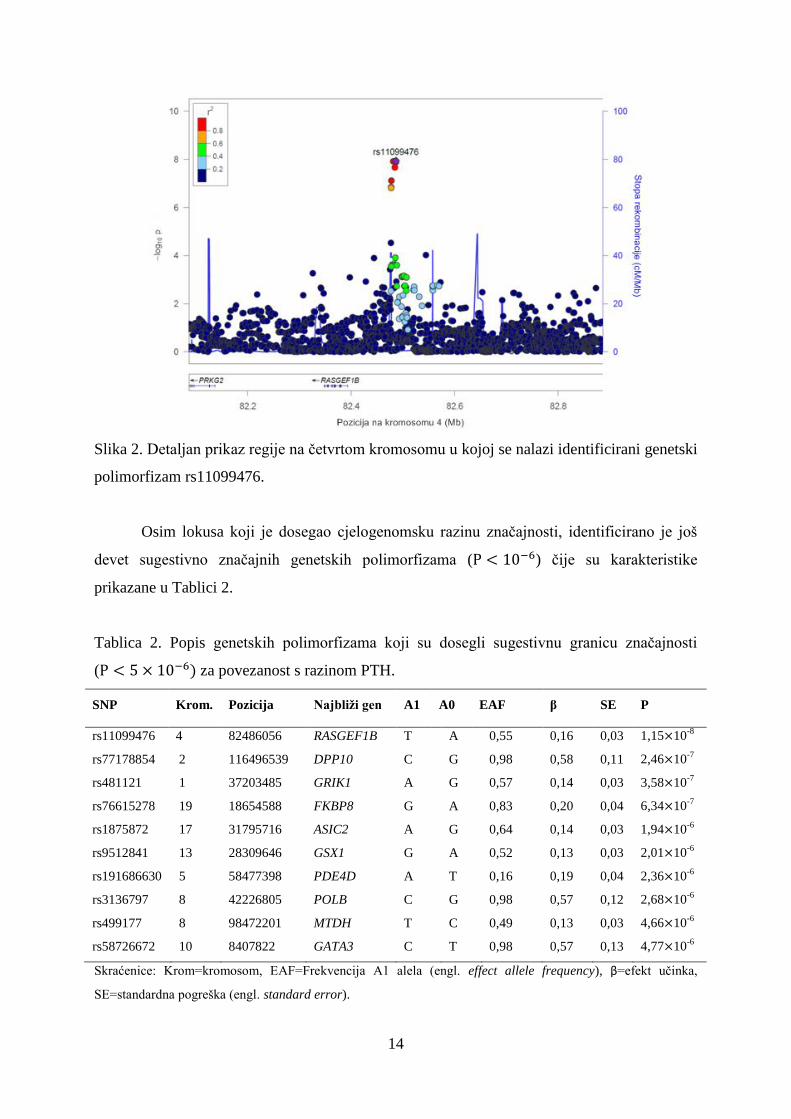
povezanosti za identificirani genetski polimorfizam je prikazan na Slici 2.
Slika 1. Rezultati meta-analize cjelogenomskih studija povezanosti za razinu PTH. A)
Manhattan graf. B) Kvantil-kvantil graf.
14
Slika 2. Detaljan prikaz regije na četvrtom kromosomu u kojoj se nalazi identificirani genetski
polimorfizam rs11099476.
Osim lokusa koji je dosegao cjelogenomsku razinu značajnosti, identificirano je još
devet sugestivno značajnih genetskih polimorfizama ( ) čije su karakteristike
prikazane u Tablici 2.
Tablica 2. Popis genetskih polimorfizama koji su dosegli sugestivnu granicu značajnosti
( za povezanost s razinom PTH.
SNP Krom.
Pozicija Najbliži gen A1 A0 EAF β
SE
P
rs11099476 4 82486056 RASGEF1B T A 0,55 0,16 0,03 1,15 10-8
rs77178854 2 116496539 DPP10 C G 0,98 0,58 0,11 2,46 10-7
rs481121 1 37203485 GRIK1 A G 0,57 0,14 0,03 3,58 10-7
rs76615278 19 18654588 FKBP8 G A 0,83 0,20 0,04 6,34 10-7
rs1875872 17 31795716 ASIC2 A G 0,64 0,14 0,03 1,94 10-6
rs9512841 13 28309646 GSX1 G A 0,52 0,13 0,03 2,01 10-6
rs191686630 5 58477398 PDE4D A T 0,16 0,19 0,04 2,36 10-6
rs3136797 8 42226805 POLB C G 0,98 0,57 0,12 2,68 10-6
rs499177 8 98472201 MTDH T C 0,49 0,13 0,03 4,66 10-6
rs58726672 10 8407822 GATA3 C T 0,98 0,57 0,13 4,77 10-6
Skraćenice: Krom=kromosom, EAF=Frekvencija A1 alela (engl. effect allele frequency), β=efekt učinka,
SE=standardna pogreška (engl. standard error).
15
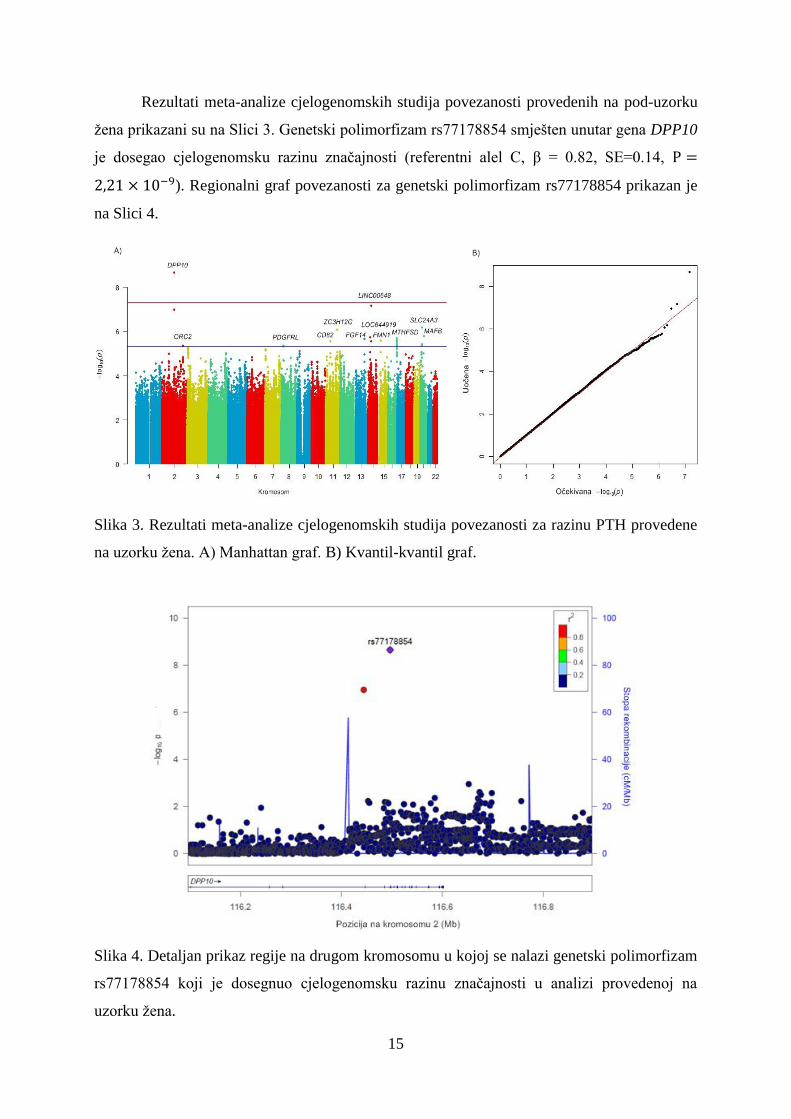
Rezultati meta-analize cjelogenomskih studija povezanosti provedenih na pod-uzorku
žena prikazani su na Slici 3. Genetski polimorfizam rs77178854 smješten unutar gena DPP10
je dosegao cjelogenomsku razinu značajnosti (referentni alel C, β = 0.82, SE=0.14,
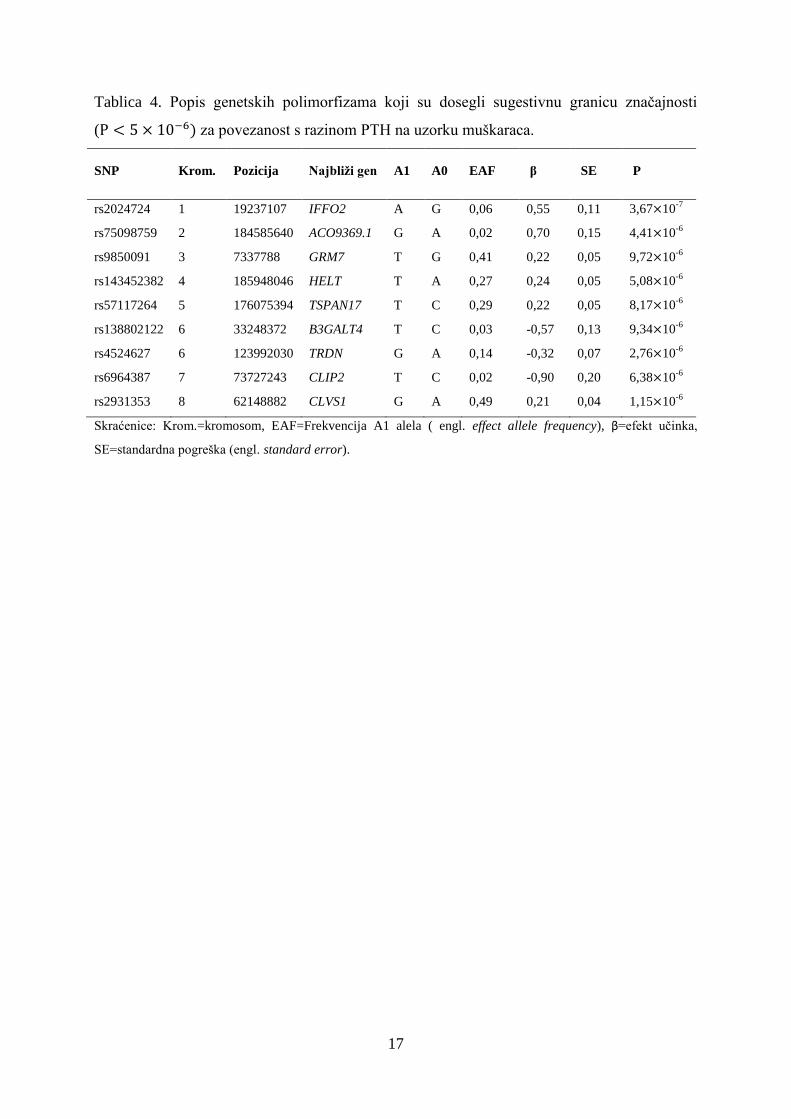
). Regionalni graf povezanosti za genetski polimorfizam rs77178854 prikazan je
na Slici 4.
Slika 3. Rezultati meta-analize cjelogenomskih studija povezanosti za razinu PTH provedene
na uzorku žena. A) Manhattan graf. B) Kvantil-kvantil graf.
Slika 4. Detaljan prikaz regije na drugom kromosomu u kojoj se nalazi genetski polimorfizam
rs77178854 koji je dosegnuo cjelogenomsku razinu značajnosti u analizi provedenoj na
uzorku žena.

16
Tablica 3 prikazuje sve genetske polimorfizme koji su u meta-analizi provedenoj na
uzorku žena dosegli sugestivnu granicu značajnosti. Niti jedan genetski polimorfizam nije
dosegao cjelogenomsku razinu značajnosti u meta-analizi provedenoj na uzorku muškaraca
(Tablica 4).
Tablica 3. Popis genetskih polimorfizama koji su dosegli sugestivnu granicu značajnosti
( za povezanost s razinom PTH na uzorku žena.
SNP Krom.
Pozicija Najbliži gen A1 A0 EAF β
SE
P
rs77178854 2 116496539 DPP10 C G 0,98 0,82 0,14 2,21 10-9
rs1890709 14 49101833 LINC00648 A G 0,34 0,20 0,04 7,12 10-8
rs16981087 20 19739954 SLC24A3 G C 0,78 0,22 0,04 6,99 10-7
rs661171 11 110016519 ZC3H12C G T 0,72 0,20 0,04 8,94 10-7
rs74629672 20 39105870 MAFB T A 0,94 0,43 0,09 1,68 10-6
rs1349573 14 41403160 LOC644919 G A 0,05 0,45 0,10 1,94 10-6
rs3866634 16 86567929 MTHFSD G A 0,93 0,32 0,07 2,14 10-6
rs7997888 13 102759325 FGF14 A G 0,04 0,49 0,10 2,19 10-6
rs5024438 15 33077401 FMN1 G A 0,74 0,23 0,05 2,76 10-6
rs77796218 11 44580581 CD82 C T 0,97 0,49 0,10 2,84 10-6
rs13406545 2 201792123 ORC2 T A 0,18 0,21 0,05 4,54 10-6
rs2588129 8 17462468 PDGFRL A G 0,03 0,54 0,12 4,57 10-6
Skraćenice: Krom=kromosom, EAF=Frekvencija A1 alela (engl. effect allele frequency), β=efekt učinka,
SE=standardna pogreška (engl. standard error).
17
Tablica 4. Popis genetskih polimorfizama koji su dosegli sugestivnu granicu značajnosti
( za povezanost s razinom PTH na uzorku muškaraca.
SNP Krom.
Pozicija Najbliži gen A1 A0 EAF β
SE
P
rs2024724 1 19237107 IFFO2 A G 0,06 0,55 0,11 3,67 10-7
rs75098759 2 184585640 ACO9369.1 G A 0,02 0,70 0,15 4,41 10-6
rs9850091 3 7337788 GRM7 T G 0,41 0,22 0,05 9,72 10-6
rs143452382 4 185948046 HELT T A 0,27 0,24 0,05 5,08 10-6
rs57117264 5 176075394 TSPAN17 T C 0,29 0,22 0,05 8,17 10-6
rs138802122 6 33248372 B3GALT4 T C 0,03 -0,57 0,13 9,34 10-6
rs4524627 6 123992030 TRDN G A 0,14 -0,32 0,07 2,76 10-6
rs6964387 7 73727243 CLIP2 T C 0,02 -0,90 0,20 6,38 10-6
rs2931353 8 62148882 CLVS1 G A 0,49 0,21 0,04 1,15 10-6
Skraćenice: Krom.=kromosom, EAF=Frekvencija A1 alela ( engl. effect allele frequency), β=efekt učinka,
SE=standardna pogreška (engl. standard error).
18
3.3.2. Cjelogenomska analiza povezanosti za razine Tg-At i TPO-At
Nakon primjene kriterija isključenja, u cjelogenomskoj analizi povezanosti za Tg-At
sudjelovalo je ukupno 2 629 ispitanika, a za TPO-At ukupno 2 618 ispitanika. Osnovne
karakteristike ispitanika uključenih u studiju su prikazane u Tablici 5.
Tablica 5. Karakteristike ispitanika uključenih u studiju.
Tg-At Split Korčula Vis
Ukupan broj ispitanika 942 819 868
Žene, n (%) 587 (62%) 522 (64%) 487 (56%)
Godine, medijan (qL,qU) 52 (40,61) 57 (47,67) 57 (45,69)
Tg-Ab, IU/mL medijan (qL,qU) 6.90 (5.00,15.80) 11.90 (8.10, 32.25) 9.90 (5.10,19.20)
TPO-At Split Korčula Vis
Ukupan broj ispitanika 942 819 857
Žene, n (%) 587 (62%) 522 (64%) 484 (57%)
Godine, medijan (qL,qU) 52 (40,61) 57 (47,67) 57 (45,69)
TPO-Ab, IU/mL medijan (qL,qU) 2.5 (1.3, 7.9) 7.90 (3.85, 18.10) 4.10 (1.80, 11.50)
Oznake: qL- donji kvartil, qU-gornji kvartil.
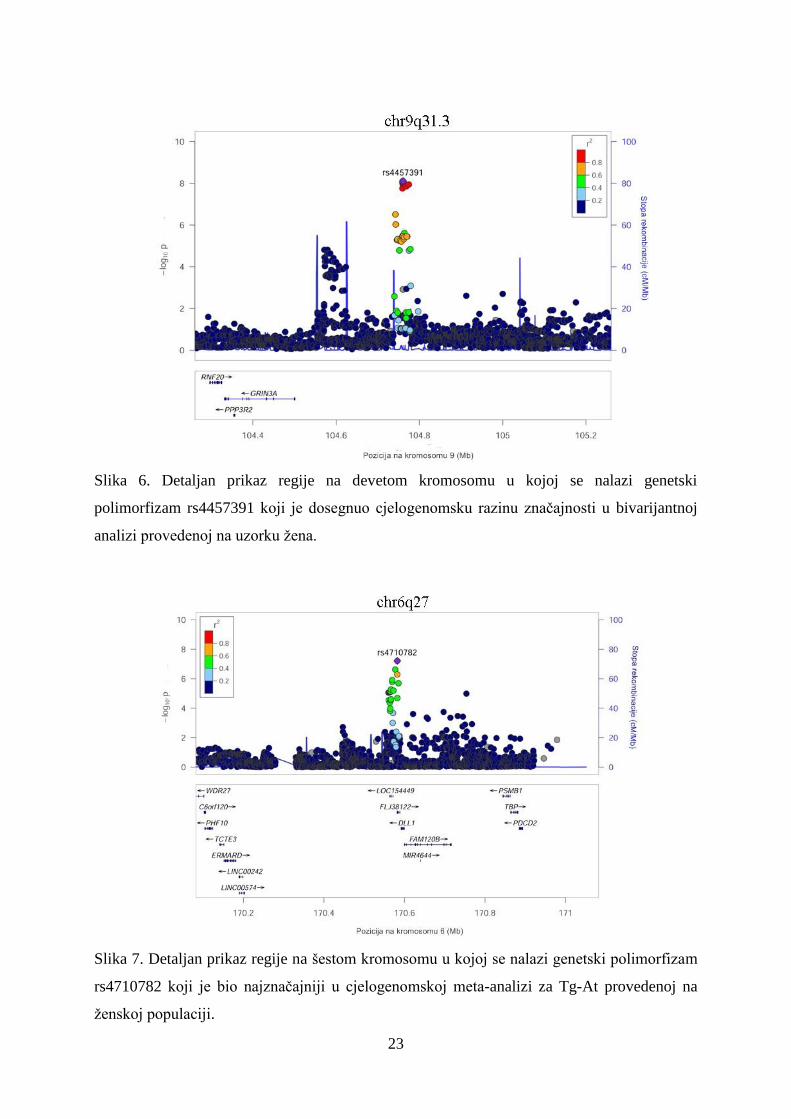
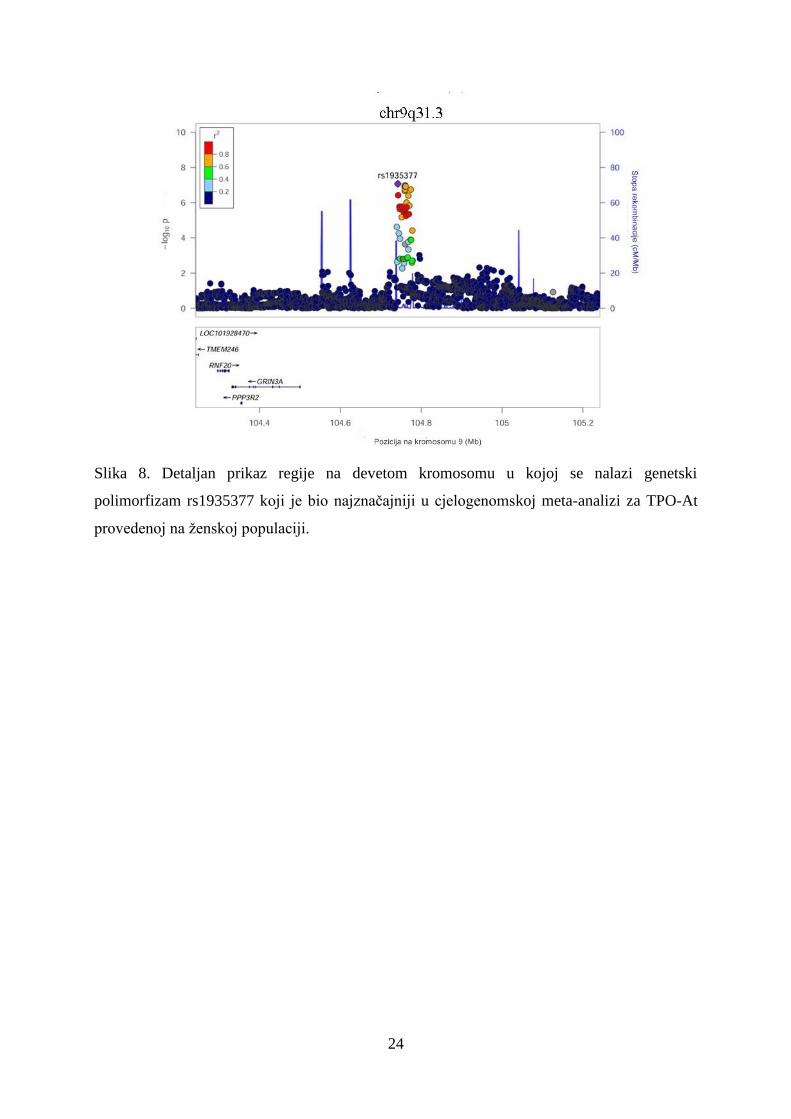
Tablice 6 i 7 prikazuju statistički najznačajnije genetske polimorfizme dobivene u
meta-analizi cjelogenomskih analiza povezanosti za razinu Tg-At, odnosno za razinu TPO-At.
Niti jedan genetski polimorfizam nije dosegao cjelogenomsku granicu značajnosti u
generalnoj populaciji. U ženskoj populaciji graničnu razinu značajnosti pokazao je genetski
polimorfizam smješten u blizini gena DLL1 za povezanost s razinom Tg-At (rs4710782,
), te genetski polimorfizam smješten pokraj gena GRIN3A za povezanost s
razinom TPO-At (rs1935377, ). U analizama provedenima u muškoj
populaciji nije identificiran niti jedan statistički značajan genetski polimorfizam (Tablica 6,
Tablica 7).

19
Tablica 6. Popis genetskih polimorfizama koji su dosegli sugestivnu granicu značajnosti
( za povezanost s razinom Tg-At u cjelokupnom uzorku, te na pod-uzorcima
žena i muškaraca.
SNP Krom. Pozicija Najbliži gen A1 A0 EAF β SE P
Generalna populacija
rs10889518 1 65544151 AK4 A T 0,14 -0,27 0,05 1,27 10-7
rs58150014 10 4249354 KLF6 G A 0,11 0,22 0,05 2,39 10-6
rs13253854 8 93372260 RUNX1T1 C A 0,22 0,16 0,03 3,30 10-6
Ženska populacija
rs4710782 6 170582064 DLL1 C G 0,32 0,21 0,04 6,16 10-8
rs183893980 7 155106435 INSIG1 A G 0,28 0,23 0,05 8,87 10-7
rs1935377 9 104742291 GRIN3A T C 0,37 -0,18 0,04 1,18 10-6
rs12437330 14 98424701 LINC01550 A G 0,19 -0,21 0,04 1,78 10-6
rs1889066 10 59776781 IPMK G A 0,07 0,33 0,07 2,05 10-6
rs60767289 22 48875139 FAM19A5 G A 0,23 -0,20 0,04 2,25 10-6
rs10889518 1 65544151 JAK1 T A 0,14 -0,32 0,07 3,10 10-6
rs2238186 14 72925171 RGS6 G C 0,20 -0,21 0,05 3,31 10-6
rs6573038 14 56022792 KTN1 T T 0,28 0,18 0,04 4,37 10-6
rs1405966 2 49716853 FSHR A G 0,20 0,21 0,05 4,58 10-6
Muška populacija
rs73399159 10 134943325 ADGRA1 G A 0,13 -0,33 0,07 2,73 10-7
rs323907 7 34736202 NPSR1 C T 0,09 0,37 0,07 3,45 10-7
rs9365994 6 158611258 GTF2H5 C A 0,19 0,27 0,05 6,91 10-7
rs1288213 5 162212404 CCNG1 A G 0,24 -0,24 0,05 7,21 10-7
rs4801635 19 56372705 NLRP4 C T 0,39 0,21 0,04 9,41 10-7
rs6097767 20 52717067 CYP24A1 A G 0,07 -0,37 0,08 2,20 10-6
rs11952006 5 159022804 ADRA1B A G 0,16 0,27 0,06 3,14 10-6
rs2458778 11 131467380 NTM C A 0,19 -0,25 0,05 3,60 10-6
rs1716169 12 123716930 MPHOSPH9 T A 0,23 -0,23 0,05 3,63 10-6
rs9590671 13 42726974 DGKH C T 0,41 -0,19 0,04 4,51 10-6
rs78029223 16 53662833 RPGRIP1L C T 0,13 0,32 0,07 4,75 10-6
Skraćenice: Krom=kromosom, EAF=Frekvencija A1 alela (engl. effect allele frequency), β=efekt učinka,
SE=standardna pogreška (engl. standard error).

20
Tablica 7. Popis genetskih polimorfizama koji su dosegli sugestivnu granicu značajnosti
( za povezanost s razinom TPO-At u cjelokupnom uzorku, te na pod-uzorcima
žena i muškaraca.
SNP Krom. Pozicija Najbliži gen A1 A0 EAF β SE P
Generalna populacija
rs10753297 1 34438957 CSMD2 T A 0,38 -0,14 0,03 5,59 10-7
rs7200247 16 74637011 GLG1 G A 0,44 -0,13 0,03 1,53 10-6
rs11197050 10 116834272 ATRNL1 A C 0,13 0,22 0,05 1,71 10-6
rs12890844 14 92816329 SLC24A4 G A 0,30 0,15 0,03 2,31 10-6
rs34926168 14 26550405 NOVA1 C T 0,35 0,14 0,03 3,65 10-6
rs1029422 7 117595829 LSM8 G A 0,20 0,16 0,04 4,48 10-6
Ženska populacija
rs1935377 9 104742291 GRIN3A T C 0,37 -0,20 0,04 8,58 10-8
rs10001304 4 154460808 KIAA0922 A G 0,23 -0,20 0,04 1,40 10-6
rs13242614 7 132966299 EXOC4 T C 0,06 -0,36 0,08 2,05 10-6
rs2088197 4 59978132 LOC105377247 G A 0,36 0,17 0,04 3,35 10-6
rs4818857 21 45073775 HSF2BP G C 0,24 -0,21 0,04 3,73 10-6
rs1326248 10 21030854 NEBL C T 0,40 0,17 0,04 4,16 10-6
rs184205168 2 78108992 LRRTM4 T A 0,14 -0,30 0,07 4,95 10-6
Muška populacija
rs2428361 17 31277765 SPACA3 C T 0,27 0,25 0,05 9,16 10-7
rs11256909 10 6169140 PFKFB3 A C 0,28 0,23 0,05 9,61 10-7
rs1326128 13 50885410 DLEU1 G A 0,46 0,20 0,04 1,28 10-6
rs61976526 14 95474079 DICER1 G A 0,29 -0,22 0,05 2,32 10-6
rs144436018 2 82236090 LOC102724542 G A 0,22 0,25 0,05 2,86 10-6
rs2952635 7 157508424 PTPRN2 A G 0,20 0,25 0,05 3,68 10-6
rs111821600 15 24046166 NDN A G 0,10 -0,40 0,09 3,81 10-6
Skraćenice: Krom=kromosom, EAF=Frekvencija A1 alela (engl. effect allele frequency), β=efekt učinka,
SE=standardna pogreška (engl. standard error).
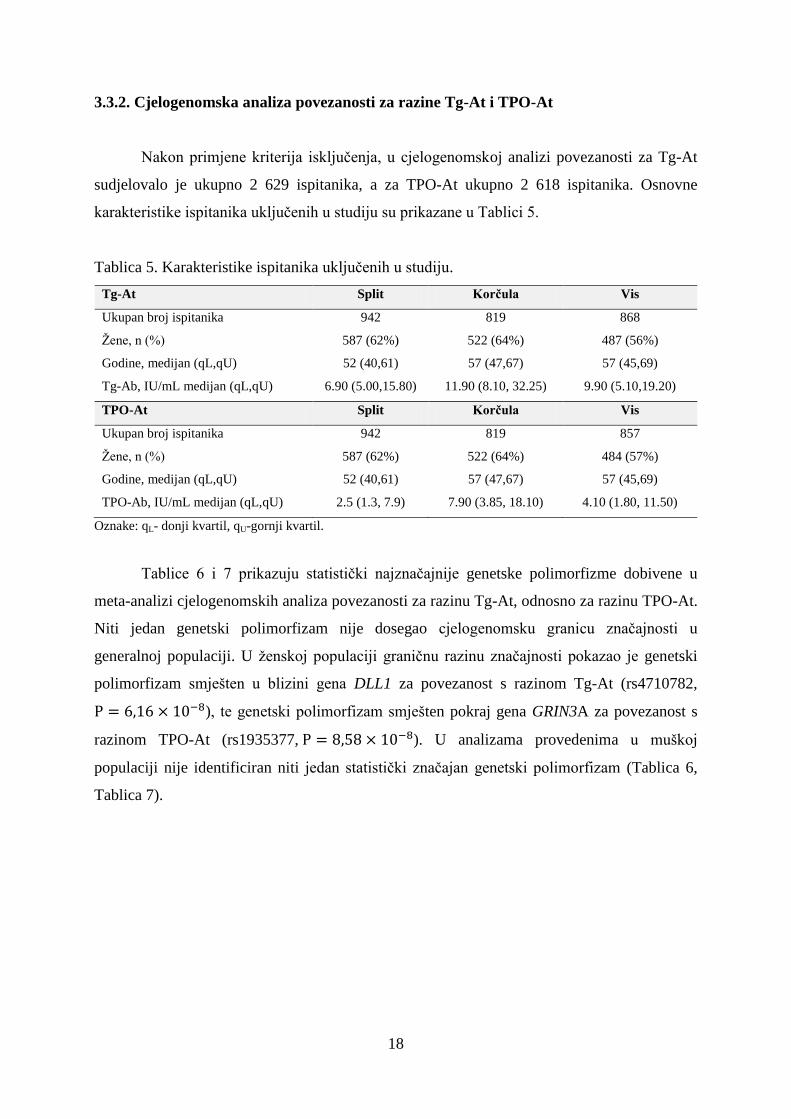
U bivarijantnoj analizi, koja je provedena na cjelokupnom uzorku za Tg-At i TPO-At
simultano, niti jedan genetski polimorfizam nije dosegnuo cjelogenomsku razinu značajnosti
(Tablica 8). Međutim, u bivarijantnoj analizi koja je provedena u ženskoj populaciji,
cjelogenomsku razinu značajnosti dosegao je genetski polimorfizam smješten u blizini gena
GRIN3A (rs4457391, ). Slika 5 prikazuje rezultate bivarijantne analize na

21
pod-uzorku žena, a u Tablici 8 su prikazani genetski polimorfizmi koji su pokazali sugestivnu
granicu značajnosti.
Tablica 8. Popis genetskih polimorfizama koji su dosegli sugestivnu granicu značajnosti
( u bivarijantnoj analizi provedenoj na cjelokupnom uzorku, te na pod-uzorku
žena.
SNP Krom. Pozicija Gen A1 A0 EAF β SE P
Generalna populacija
rs8067305 17 1975657 SMG6 A G 0,61 0,01 0,002 1,28 10-6
rs4480845 17 1958609 HIC1 C T 0,62 0,01 0,003 1,55 10-6
rs611909 6 165924970 PDE10A T G 0,81 0,01 0,003 2,73 10-6
rs56076527 16 74984725 WDR59 A G 0,07 -0,02 0,004 2,76 10-6
rs17121639 1 61590306 NFIA T A 0,06 -0,02 0,004 2,97 10-6
rs11012384 10 21198380 NEBL T G 0,58 0,01 0,002 3,60 10-6
rs9999798 4 168977085 ANXA10 T C 0,13 0,01 0,002 3,61 10-6
rs147936643 6 159828376 SOD2 T C 0,23 0,01 0,003 4,01 10-6
rs76802275 8 51222395 SNTG1 A C 0,09 -0,01 0,002 4,21 10-6
Ženska populacija
rs4457391 9 104760468 GRIN3A G A 0,59 -0,03 0,005 7,76 10-9
rs206327 13 32994393 N4BP2L1 C A 0,20 0,02 0,004 6,6 10-7
rs10495300 1 230881762 CAPN9 T C 0,23 0,02 0,004 1,1 10-6
rs2238186 14 72925171 RGS6 C G 0,20 0,02 0,004 2,3 10-6
rs6554389 4 57708759 REST T C 0,10 0,02 0,004 2,5 10-6
rs183893980 7 155106435 INSIG1 G A 0,72 0,03 0,006 2,9 10-6
rs515579 6 165927101 PDE10A C T 0,46 0,02 0,005 3,2 10-6
rs72773267 5 103380718 NUDT12 C T 0,09 0,02 0,005 3,6 10-6
rs28882827 21 29123595 ADAMTS5 C T 0,05 0,02 0,004 3,8 10-6
Skraćenice: Krom=kromosom, EAF=Frekvencija A1 alela (engl. effect allele frequency), β=efekt učinka,
SE=standardna pogreška (engl. standard error).

22
Slika 5. Rezultati meta-analize cjelogenomskih studija povezanosti na pod-uzorku žena za A)
bivarijantnu analizu, B) za razinu Tg-At i C) za razinu TPO-At.
23
Slika 6. Detaljan prikaz regije na devetom kromosomu u kojoj se nalazi genetski
polimorfizam rs4457391 koji je dosegnuo cjelogenomsku razinu značajnosti u bivarijantnoj
analizi provedenoj na uzorku žena.
Slika 7. Detaljan prikaz regije na šestom kromosomu u kojoj se nalazi genetski polimorfizam
rs4710782 koji je bio najznačajniji u cjelogenomskoj meta-analizi za Tg-At provedenoj na
ženskoj populaciji.
24
Slika 8. Detaljan prikaz regije na devetom kromosomu u kojoj se nalazi genetski
polimorfizam rs1935377 koji je bio najznačajniji u cjelogenomskoj meta-analizi za TPO-At
provedenoj na ženskoj populaciji.
25
3.3.3. Namirnice povezane s Tg-At i TPO-At
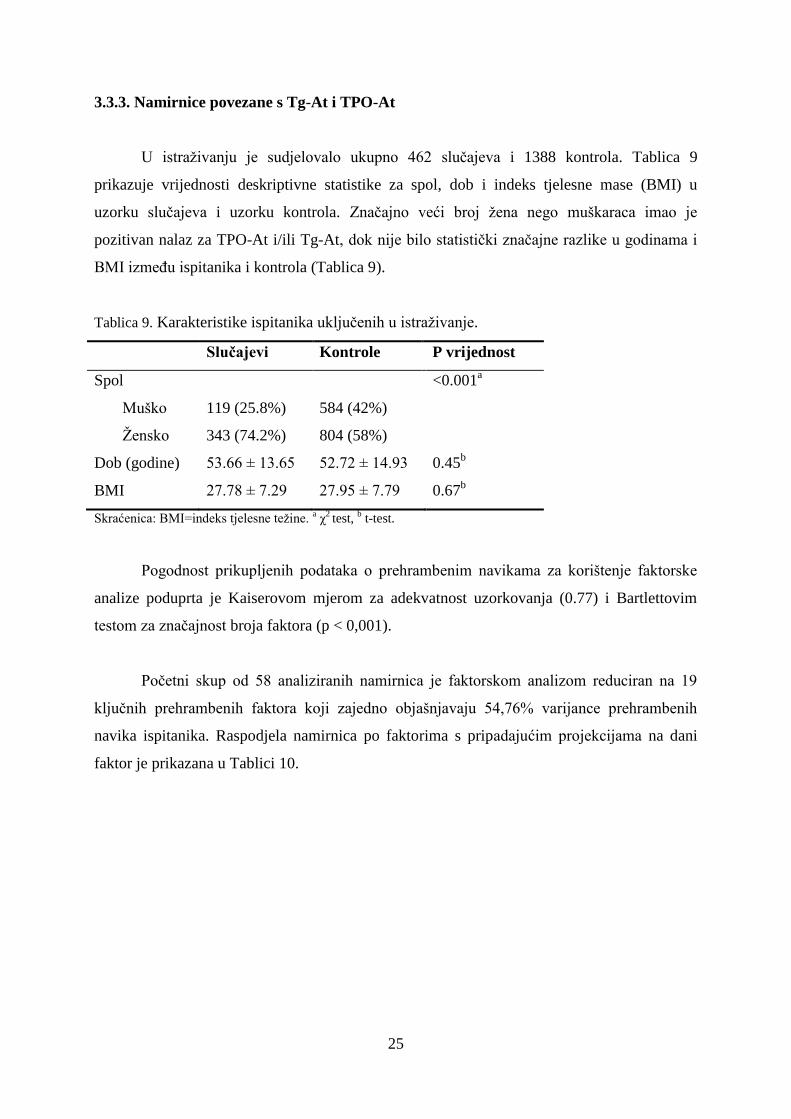
U istraživanju je sudjelovalo ukupno 462 slučajeva i 1388 kontrola. Tablica 9
prikazuje vrijednosti deskriptivne statistike za spol, dob i indeks tjelesne mase (BMI) u
uzorku slučajeva i uzorku kontrola. Značajno veći broj žena nego muškaraca imao je
pozitivan nalaz za TPO-At i/ili Tg-At, dok nije bilo statistički značajne razlike u godinama i
BMI između ispitanika i kontrola (Tablica 9).
Tablica 9. Karakteristike ispitanika uključenih u istraživanje.
Slučajevi Kontrole P vrijednost
Spol <0.001a
Muško 119 (25.8%) 584 (42%)
Žensko 343 (74.2%) 804 (58%)
Dob (godine) 53.66 ± 13.65 52.72 ± 14.93 0.45b
BMI 27.78 ± 7.29 27.95 ± 7.79 0.67b
Skraćenica: BMI=indeks tjelesne težine. a χ
2 test,
b t-test.
Pogodnost prikupljenih podataka o prehrambenim navikama za korištenje faktorske
analize poduprta je Kaiserovom mjerom za adekvatnost uzorkovanja (0.77) i Bartlettovim
testom za značajnost broja faktora (p < 0,001).
Početni skup od 58 analiziranih namirnica je faktorskom analizom reduciran na 19
ključnih prehrambenih faktora koji zajedno objašnjavaju 54,76% varijance prehrambenih
navika ispitanika. Raspodjela namirnica po faktorima s pripadajućim projekcijama na dani
faktor je prikazana u Tablici 10.
26
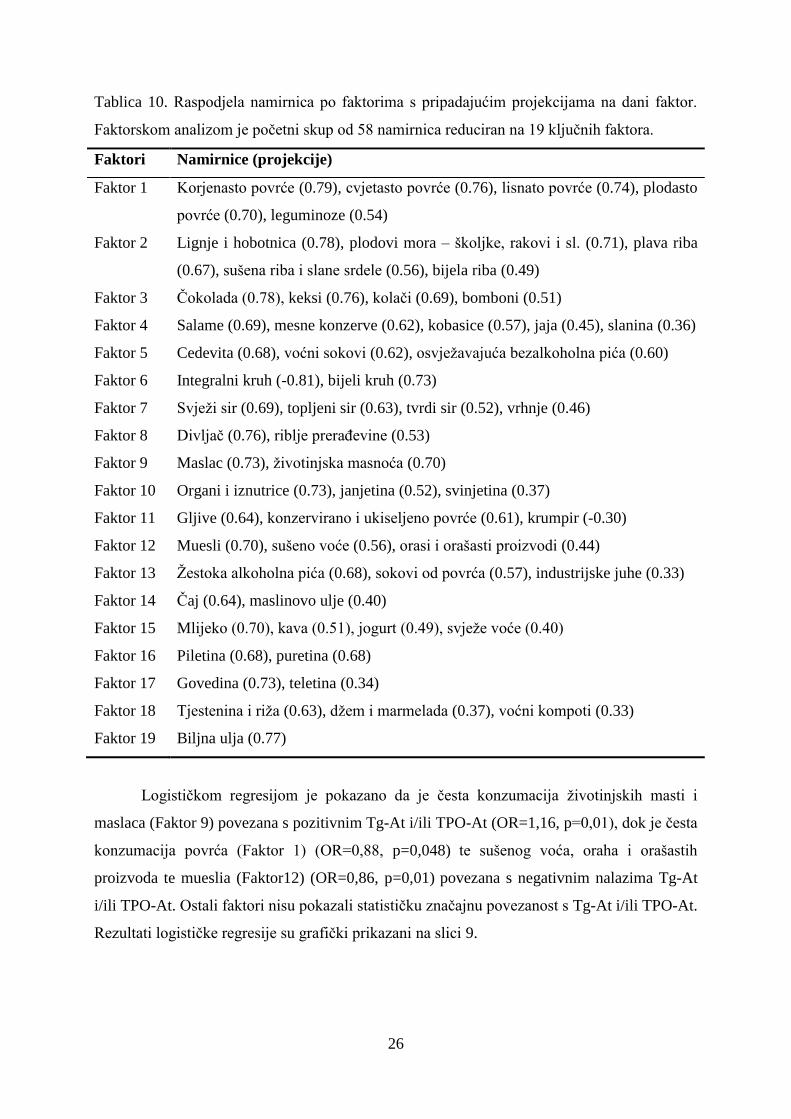
Tablica 10. Raspodjela namirnica po faktorima s pripadajućim projekcijama na dani faktor.
Faktorskom analizom je početni skup od 58 namirnica reduciran na 19 ključnih faktora.
Faktori Namirnice (projekcije)
Faktor 1 Korjenasto povrće (0.79), cvjetasto povrće (0.76), lisnato povrće (0.74), plodasto
povrće (0.70), leguminoze (0.54)
Faktor 2 Lignje i hobotnica (0.78), plodovi mora – školjke, rakovi i sl. (0.71), plava riba
(0.67), sušena riba i slane srdele (0.56), bijela riba (0.49)
Faktor 3 Čokolada (0.78), keksi (0.76), kolači (0.69), bomboni (0.51)
Faktor 4 Salame (0.69), mesne konzerve (0.62), kobasice (0.57), jaja (0.45), slanina (0.36)
Faktor 5 Cedevita (0.68), voćni sokovi (0.62), osvježavajuća bezalkoholna pića (0.60)
Faktor 6 Integralni kruh (-0.81), bijeli kruh (0.73)
Faktor 7 Svježi sir (0.69), topljeni sir (0.63), tvrdi sir (0.52), vrhnje (0.46)
Faktor 8 Divljač (0.76), riblje prerađevine (0.53)
Faktor 9 Maslac (0.73), životinjska masnoća (0.70)
Faktor 10 Organi i iznutrice (0.73), janjetina (0.52), svinjetina (0.37)
Faktor 11 Gljive (0.64), konzervirano i ukiseljeno povrće (0.61), krumpir (-0.30)
Faktor 12 Muesli (0.70), sušeno voće (0.56), orasi i orašasti proizvodi (0.44)
Faktor 13 Žestoka alkoholna pića (0.68), sokovi od povrća (0.57), industrijske juhe (0.33)
Faktor 14 Čaj (0.64), maslinovo ulje (0.40)
Faktor 15 Mlijeko (0.70), kava (0.51), jogurt (0.49), svježe voće (0.40)
Faktor 16 Piletina (0.68), puretina (0.68)
Faktor 17 Govedina (0.73), teletina (0.34)
Faktor 18 Tjestenina i riža (0.63), džem i marmelada (0.37), voćni kompoti (0.33)
Faktor 19 Biljna ulja (0.77)
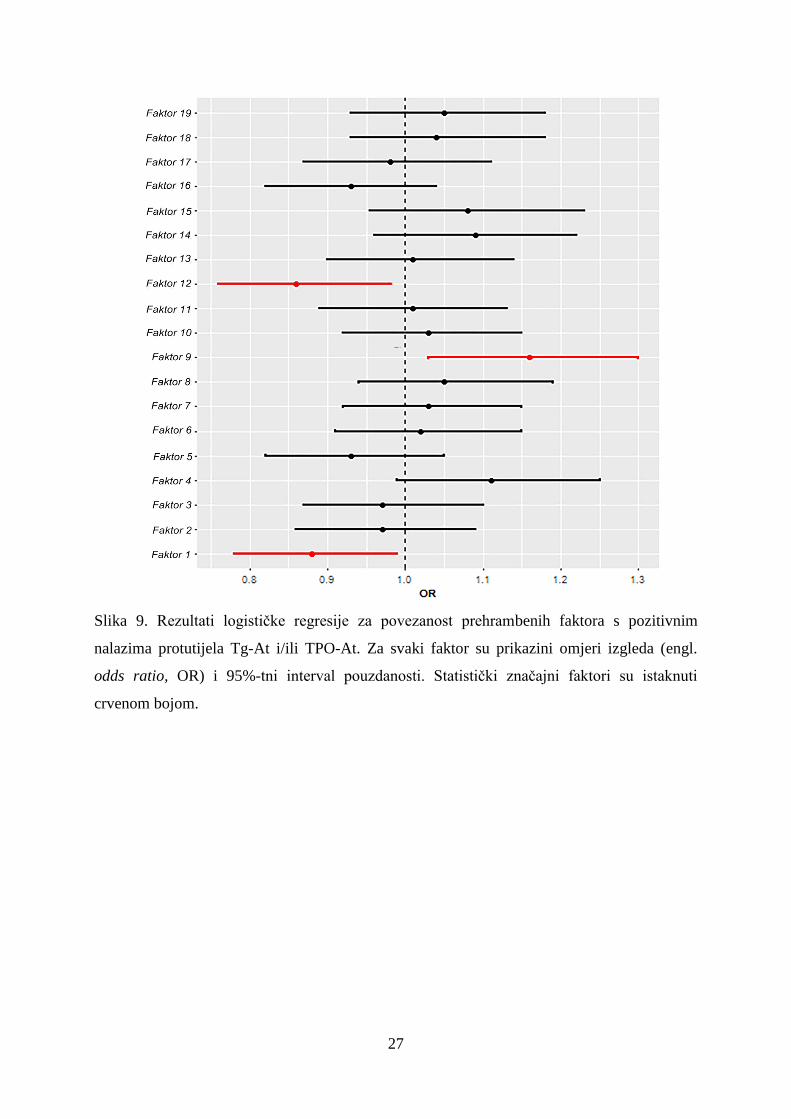
Logističkom regresijom je pokazano da je česta konzumacija životinjskih masti i
maslaca (Faktor 9) povezana s pozitivnim Tg-At i/ili TPO-At (OR=1,16, p=0,01), dok je česta
konzumacija povrća (Faktor 1) (OR=0,88, p=0,048) te sušenog voća, oraha i orašastih
proizvoda te mueslia (Faktor12) (OR=0,86, p=0,01) povezana s negativnim nalazima Tg-At
i/ili TPO-At. Ostali faktori nisu pokazali statističku značajnu povezanost s Tg-At i/ili TPO-At.
Rezultati logističke regresije su grafički prikazani na slici 9.
27
Slika 9. Rezultati logističke regresije za povezanost prehrambenih faktora s pozitivnim
nalazima protutijela Tg-At i/ili TPO-At. Za svaki faktor su prikazini omjeri izgleda (engl.
odds ratio, OR) i 95%-tni interval pouzdanosti. Statistički značajni faktori su istaknuti
crvenom bojom.
28
3.4. RASPRAVA OBJEDINJENIH RADOVA
Iako genetski faktori znatno utječu na razine PTH te Tg-At i TPO-At, zajednički
učinak do sada otkrivenih genetskih polimorfizama objašnjava vrlo mali udio individualne
varijabilnosti u razinama ovih fenotipova. Doprinos ovog istraživanja očituje se prvenstveno
identifikacijom novih genetskih polimorfizama koji su povezani s razinama PTH, Tg-At i
TPO-At u generalnoj populaciji. Također, s obzirom da postoje kliničke razlike u funkciji
štitne i doštitne žlijezde kod muškaraca i kod žena, u sklopu ovog istraživanja provedene su
po prvi put i cjelogenomske analize povezanosti za svaki spol zasebno. Na taj način su se
ispitale razlike po spolu u genetskim odrednicama razine hormona/protutijela doštitne i štitne
žlijezde.
U sklopu naše studije (Rad 1) identificiran je novi lokus u neposrednoj blizini gena
RASGEF1B za povezanost s plazma razinom PTH. RASGEF1B je gvanin nukleotidni
izmjenjujući faktor sa specifičnošću za Rap2A protein koji je član porodice Ras-sličnih G
proteina (42). Na cjelogenomskoj razini značajnosti pokazano je da su varijacije u blizini gena
RASGEF1B povezane i s visinom (43, 44). Visina pozitivno korelira sa učinkovitošću
apsorpcije kalcija, važnom odrednicom ravnoteže kalcija (45). Također, određena razina
povezanosti je uočena za varijacije u ovom genu s gustoćom kostiju, opsegom bokova te
serumskom razinom cistatina C (46, 47). PTH je značajni negativni prediktor gustoće kostiju
u području kukova (48). Serumska razina cistatina C je biomarker bubrežne funkcije i
kronične bubrežne bolesti (47). Poremećena funkcija bubrega može utjecati na PTH
stimuliranu reapsorpciju kalcija i sintezu 1,25(OH)2D3 (1, 5, 6). Međutim, potrebne su daljnje
funkcionalne studije gena RASGEF1B kako bi se razumjeli mehanizmi u pozadini uočene
povezanosti s razinom PTH.
U okviru iste studije (Rad 1) po prvi put su provedene cjelogenomske analize
povezanosti za plazma razine PTH odvojeno po spolu. U navedenim analizama identificiran je
dodatni lokus unutar gena DPP10 kod žena, čime je ukazano na postojanje spolnih
specifičnosti u genetskim odrednicama razine PTH. DPP10 je član serinske obitelji proteaza,
eksprimiran u mozgu, gušterači i nadbubrežnoj žlijezdi (44). Može služiti kao prognostički
marker za rak debelog crijeva (49). Zanimljivo je napomenuti da su visoke serumske razine
PTH povezane s rakom distalnog dijela debelog crijeva kod žena, ali ne i kod muškaraca (50).
Prisutnost DPP10 u endokrinim stanicama upućuje na moguću dodatnu ulogu proteina u

29
regulaciji sekrecije hormona (51), što također podupire naš rezultat. No svakako, potrebne su
dodatne funkcionalne studije gena DPP10 kako bi se razjasnio dobiveni rezultat.
U sklopu naše druge studije (Rad 2), bivarijantnom analizom provedenom na pod-
uzorku žena identificiran je novi lokus u blizini gena GRIN3A za povezanost s protutijelima
Tg-At i TPO-At. Isti lokus pokazao je graničnu povezanost s razinom TPO-At kod žena, dok
je lokus smješten pokraj gena DLL1 pokazao graničnu povezanost s razinom Tg-At, također
kod žena.
Gen GRIN3A kodira pod-jedinicu N-metil-D-aspartat receptora koji pripadaju super-
obitelji ionskih kanala reguliranih glutamatom. Eksprimiran je u mozgu, koštanoj srži,
imunološkom sustavu te u muškom i ženskom tkivu (52). Varijacije u ovom genu su povezane
s povišenom razinom lipoproteina visoke gustoće (engl. high-density lipoprotein, HDL), te sa
sniženim razinama lipoproteina niske gustoće (engl. low-density lipoprotein, LDL) i
triglicerida. Snižene razine hormona štitne žlijezde u jetri imaju utjecaj na smanjenje
kolesterola te posljedično i na povećanje razine triglicerida, ukupnog i LDL kolesterola.
Pokazano je da su snižene razine LDL-a povezane s hipotireozom (53). Važno je naglasiti da
je pronađena povezanost intronske varijante rs9792648 gena GRIN3A i hipotireoze
(P=2.7 10-5
) (54), što ide u prilog našem rezultatu. Međutim, potrebne su funkcionalne
studije gena GRIN3A kako bi se razjasnila povezanost ovog gena s razinama protutijela protiv
štitne žlijezde.
Gen DLL1 je homolog Notch Delta liganda te je član delta/serrate/jagged obitelji (55).
Posreduje u odlukama o staničnoj sudbini tijekom limfopoeze. Notch signalni put sudjeluje u
promicanju sazrijevanja CD4 i CD8 T staničnih linija (56). CD4 T stanice induciraju B
stanice u proizvodnji protutijela i kod HT i kod GD, dok CD8 T stanice uzrokuju smrt
tireocita kod HT (15). Varijacije u blizini ovog gena do sada su povezane s dijabetesom tipa 1
(T1D) te su također sugestivno povezane sa sistemskim eritemskim lupusom (SLE) (57, 58).
T1D i SLE se često pojavljuju uz AITD kod istih pojedinaca (59, 60). Kako bi se razjasnila
priroda povezanosti gena DLL1 i razine protutijela protiv tireoglobulina, potrebne se daljnje
studije.
Kako je već ranije naglašeno, razine protutijela Tg-At i TPO-At osim genetskih
čimbenika određuju i razni okolišni čimbenici. Potaknuti nezastupljenošću studija o
povezanosti prehrambenih navika s protutijelima protiv štitne žlijezde, u sklopu naše treće
studije (Rad 3) po prvi put je analizirana povezanost opsežnog skupa namirnica (58 različitih
30
namirnica) s pozitivnim nalazom protutijela Tg-At i/ili TPO-At. Rezultati studije sugeriraju
da je česta konzumacija životinjskih masti i maslaca povezana s pozitivnim nalazima Tg-At
i/ili TPO-At, dok je česta konzumacija povrća te sušenog voća, oraha i orašastih proizvoda te
mueslia povezana s negativnim nalazima Tg-At i/ili TPO-At.
Maslac i životinjske masti su bogate zasićenim masnim kiselinama (engl. saturated
fatty acids, SFA) (61, 62), dok su povrće, žitarice i orašasti proizvodi bogati polinezasićenim
masnim kiselinama (engl. polysaturated fatty acids, PUFA) (63). Sve namirnice koje su
pokazale povezanost s negativnim nalazom Tg-At i/ili TPO-At (povrće, sušeno voće, orasi i
orašasti proizvodi, muesli) su bogate omega-6 i omega-3 PUFA.
Omega-6 i omega-3 PUFA su ključne strukturne i funkcijske komponente
membranskih fosfolipida te služe kao prekursori za sintezu eikozanoida. Ove dvije vrste
PUFA imaju suprotan učinak na upalne reakcije; naime omega-6 PUFA služe kao prekursori
upalnih eikozanoida dok omega-3 PUFA generiraju protu-upalne eikozanoide (64). S obzirom
da je pretvorba omega-6 PUFA u omega-3 PUFA u ljudskom organizmu manja od 5%, razina
protu-upalnih eikozanoida gotovo u cijelosti ovisi o količini n-3 PUFA unesenih prehranom
(61). Eikozanoidi, kao što su eikozapentaenoična kiselina i dokosaheksaenoična kiselina, su
uključeni u regulaciju proupalnih citokina te djeluju kao protu-upalni medijatori; stoga
pogodno djeluju na status autoimunih bolesti kao što je reumatoidni artritis (64).
Studije provedene na eksperimentalnim životinjama su pokazale da prehrana bogata
omega-3 PUFA potiskuje upalu koja prati autoimune reakcije (65-68). Rezultati ukazuju da
omega-3 PUFA smanjuju diferencijaciju naivnih CD4+ T stanica u Th17 stanice
modificirajući regije lipidnih splavi u njihovoj plazma membrani te smanjuju stvaranje IL-6
receptora (65). Poznato je da Th17 stanice pozitivno koreliraju sa serumskom razinom Tg-At
i/ili TPO-At (69). Nadalje, nedavno objavljene studije su pokazale da Th17 stanice imaju
ključnu ulogu u patogenezi AITD (70, 71).
Povrće, sušeno voće, orasi i orašasti proizvodi te muesli su bogati omega-3 masnim
kiselinama te se čini da ove namirnice smanjuju stvaranje protutijela TPO-At i/ili Tg-At.
Suprotno tome, izgleda da zasićene masne kiseline životinjskog porijekla imaju štetan efekt za
stvaranje TPO-At i/ili Tg-At. Česta konzumacija maslaca i masti životinjskog porijekla može
rezultirati u niskom omjeru omega-3 masnih kiselina/omega-6 masnih kiselina, zbog čega
dolazi do nedostatka supresije diferencijacije Th17 T stanica, što rezultira stvaranjem
protutijela TPO-At i/ili Tg-At (65).
Fitosteroli imaju imunomodulatorna i protu-upalna svojstva, a nalaze se u umjerenim
količinama u povrću i u malim količinama u orašastim proizvodima (72, 73). Jedan od

31
predloženih načina njihove imunomodulatorne aktivnosti je smanjenje plazma razine IL-6. S
obzirom da je IL-6 glavni stimulator u diferencijaciji Th17 stanica, moguće obrazloženje
protektivnog efekta fitosterola u patogenezi AITD jest redukcija plazma razine IL-6.
Polifenoli imaju protu-upalna, imunomodulatorna i antioksidativna svojstva, a nalaze
se u voću i povrću (74, 75). Prisutnost galinske kiseline u sušenom voću i muesliju može biti
objašnjenje za njihovu dobrotvornu ulogu za nastanak protutijela Tg-At i/ili TPO-At.
Galinska kiselina je komponenta crvenog voća, ali se također nalazi i u kori jabuke te u grejpu
(75). Crveno voće se često konzumira sušeno, te je upravo sušeno crveno voće često sadržano
u muesliju. Kuppan i sur. su pokazali da kod ljudi tretiranje monocita galinskom kiselinom
reducira ekspresiju gena IL-6 (76). Smanjenje razine IL-6 u plazmi može suprimirati
diferencijaciju Th17 stanica uključenih u patogenezu AITD.
Novim saznanjima unaprijedile su se dosadašnje spoznaje o genetskim i okolišnim
faktorima koji reguliraju PTH, Tg-At i TPO-At, što će pomoći u razumijevanju temeljnih
bioloških putova povezanih s funkcijom doštitne i štitne žlijezde te će se pružiti dodatne
spoznaje relevantne za kliničku primjenu. Otkrivanje novih genetskih i okolišnih čimbenika
uključenih u regulaciju funkcije doštitne i štitne žlijezde može doprinijeti razvoju novih
prevencijskih, dijagnostičkih i terapijskih metoda.
32
3.5. ZAKLJUČCI OBJEDINJENIH RADOVA
U sklopu ove doktorske disertacije koja se temelji na tri objedinjena rada identificirani
su novi genetski i okolišni čimbenici koji reguliraju razine PTH, Tg-At i TPO-At.
Cjelogenomskom analizom povezanosti za razinu PTH identificiran je gen RASGEF1B u
generalnoj populaciji, te dodatno gen DPP10 na pod-uzorku žena. Ovim rezultatima su
dopunjene i unaprijeđene postojeće spoznaje o genetskoj regulaciji PTH te je također po prvi
put ukazano na postojanje spolnih razlika u genetskim odrednicama PTH. Nadalje, u pod-
uzorku žena identificiran je gen GRIN3A za povezanost s protutijelima Tg-At i TPO-At. Isti
gen dosegao je graničnu značajnost s razinom TPO-At kod žena. Također, identificiran je i
lokus u blizini gena DLL1 koji je pokazao graničnu povezanost s razinom Tg-At kod žena.
Ovim rezultatima smo upotpunili dosadašnje znanje o genetskim faktorima koji su povezani s
razinom TPO-At i po prvi puta definirali genetske varijante povezane s razinom TgAt te
potvrdili postojanje spolnih razlika u genetskoj regulaciji. U trećem radu je pokazano da je
česta konzumacija životinjskih masti i maslaca povezana s pozitivnim Tg-At i/ili TPO-At, dok
je česta konzumacija povrća te sušenog voća, oraha i orašastih proizvoda te mueslia povezana
s negativnim nalazima Tg-At i/ili TPO-At. Rezultati ove studije sugeriraju da je česta
konzumacija protu-upalne hrane (hrane bogate polinezasićenim omega-3 masnim kiselinama)
povezana s negativnim nalazima Tg-At i TPO-At.
33
3.6. KRATKI SAŽETAK NA HRVATSKOM JEZIKU
Uvod: Paratireoidni hormon (PTH) je najvažniji čimbenik u regulaciji izvanstanične
koncentracije kalcija. Tireoidna peroksidaza (TPO) i tireoglobulin (Tg) su glavne sastavnice
štitne žlijezde koje igraju ključnu ulogu u sintezi hormona štitne žlijezde. Povišena razina
protutijela protiv TPO (TPO-At) i/ili Tg (Tg-At) može predstavljati ranu fazu u patogenezi
autoimunih bolesti štitnjače. Razine PTH, TPO-At i Tg-At rezultat su interakcije između
multiplih gena i jednako važnih čimbenika okoliša. Cilj ovog istraživanja bio je identificirati
nove genetske čimbenike povezane s razinom PTH, Tg-At i TPO-At te ispitati povezanost
prehrambenih navika, kao okolišnog čimbenika, s pozitivnim Tg-AT i/ili TPO-AT.
Metode: Istraživanje se provelo na ispitanicima koji su uključeni u projekt „10 001
Dalmatinac – Hrvatska biobanka“. U genetičkom dijelu istraživanju sudjelovalo je 2 869
ispitanika s područja grada Splita te otoka Korčule i Visa. Cjelogenomske analize povezanosti
provedene su korištenjem linearnog mješovitog modela, s prilagodbom za dob, spol i srodstvo
ispitanika. U istraživanju povezanosti prehrambenih navika s pozitivnim Tg-At i/ili TPO-At
sudjelovalo je ukupno 1887 subjekata (462 ispitanika i 1 425 kontrola). Početni skup od 58
analiziranih namirnica reduciran je faktorskom analizom na 19 ključnih prehrambenih faktora.
Povezanost prehrambenih faktora s pozitivnim Tg-At i/ili TPO-At testirana je logističkom
regresijom.
Rezultati: Identificiran je lokus u blizini gena RASGEF1B, te je dodatno na pod-uzorku žena
identificiran i lokus unutar gena DPP10, za povezanost s razinom PTH. Nadalje,
bivarijantnom analizom na pod-uzorku žena identificiran je lokus u blizini gena GRIN3A za
povezanost s Tg-At i TPO-At. Isti lokus je pokazao graničnu povezanost s razinom TPO-At
na pod-uzorku žena, dok je lokus smješten pokraj gena DLL1 pokazao graničnu povezanost s
razinom Tg-At, također na pod-uzorku žena. U analizi povezanosti namirnica s pozitivnim
nalazom Tg-At i/ili TPO-At, pokazano je da je česta konzumacija životinjskih masti i maslaca
povezana s pozitivnim Tg-At i/ili TPO-At, dok je česta konzumacija povrća te sušenog voća,
oraha i orašastih proizvoda te mueslia povezana s negativnim nalazima Tg-At i/ili TPO-At.
Zaključak: Nova saznanja mogu pomoći u razumijevanju temeljnih bioloških putova
povezanih s funkcijom doštitne i štitne žlijezde te pružiti dodatne spoznaje relevantne za
kliničku primjenu.

34
3.7. KRATKI SAŽETAK NA ENGLESKOM JEZIKU (SUMMARY)
Introduction: Parathyroid hormone (PTH) is one of the principal regulators of calcium
homeostasis. Thyroglobulin (Tg) and thyroid peroxidise (TPO) are a major components of the
thyroid gland, both engaged in the production of thyroid hormones. The presence of
autoantibodies with specifity for Tg (TgAb) and TPO (TPOAb) might represent an early stage
in autoimmune thyroid diseases. PTH, TgAb and TPOAb levels are complex traits influenced
by a combination of genetic and environmental factors. The aim of this study was to identify
novel genetic loci associated with PTH, TgAb and TPOAb levels and evaluate the association
of dietary factors, as an environmental factor, with positive findings of TPOAb and/or TgAb.
Methods: The study was carried-out on samples obtained through the “10,001 Dalmatians”
project. The genetic analyses included 2 869 individuals originating from the city of Split and
the islands of Korčula and Vis. Genome-wide association analyses were performed using
linear mixed model, with adjustments for age, gender and relatedness among participants.
A total of 1887 subjects (462 cases and 1 425 controls) were enrolled to test the association
between dietary factors and positive findings of plasma TPOAb and TgAb. Principal
component analysis was used to reduce the initial list of 58 food items to 19 key dietary
groups (factors). We used logistic regression analysis to examine dietary factors associated
with positive TPOAb and/or TgAb.
Results: We identified a novel locus associated with plasma PTH level near RASGEF1B
gene. We also identified sex-specific association in females in DPP10 gene. Furthermore, the
bivariate analysis of TgAb and TPOAb in females revealed an association for the locus near
GRIN3A. The same locus showed borderline association with TPOAb levels in females. Also,
a novel locus near DLL1 gene showed borderline significance in association with TgAb levels
in females. Frequent consumption of animal fats and butter was associated with positive
plasma TPOAb and/or TgAb, while vegetables, dried fruit, nuts and muesli were associated
with negative findings of TPOAb and/or TgAb.
Conclusions: New findings can help in understanding the biological pathways involved in
thyroid and parathyroid function and provide the additional knowledge relevant for the
clinical practice.
35
3.8. LITERATURA
1. Khundmiri SJ, Murray RD, Lederer E. PTH and Vitamin D. Comprehensive
Physiology. 2016;6(2):561-601.
2. Michels TC, Kelly KM. Parathyroid Disorders. American family physician.
2013;88(4):249-57.
3. Peacock M. Calcium Metabolism in Health and Disease. Clin J Am Soc Nephro.
2010;5:S23-S30.
4. Silver J, Levi R. Regulation of PTH synthesis and secretion relevant to the
management of secondary hyperparathyroidism in chronic kidney disease. Kidney
international Supplement. 2005(95):S8-12. Epub 2005/05/11.
5. Kumar R, Thompson JR. The Regulation of Parathyroid Hormone Secretion and
Synthesis. J Am Soc Nephrol. 2011;22(2):216-24.
6. Kumar R, Cahan DH, Madias NE, Harrington JT, Kurtin P, Dawsonhughes BF.
Vitamin-D and Calcium-Transport. Kidney Int. 1991;40(6):1177-89.
7. Khundmiri SJ, Murray RD, Lederer E. PTH and Vitamin D. Compr Physiol.
2016;6(2):561-601.
8. Ruf J, Feldt-Rasmussen U, Hegedus L, Ferrand M, Carayon P. Bispecific
thyroglobulin and thyroperoxidase autoantibodies in patients with various thyroid and
autoimmune diseases. The Journal of clinical endocrinology and metabolism.
1994;79(5):1404-9. Epub 1994/11/01.
9. Malthiery Y, Marriq C, Bergelefranc JL, Franc JL, Henry M, Lejeune PJ, et al.
Thyroglobulin Structure and Function - Recent Advances. Biochimie. 1989;71(2):195-210.
10. Ruf J, Carayon P. Structural and functional aspects of thyroid peroxidase. Arch
Biochem Biophys. 2006;445(2):269-77.
11. Simmonds MJ, Gough SC. Unravelling the genetic complexity of autoimmune thyroid
disease: HLA, CTLA-4 and beyond. Clinical and experimental immunology. 2004;136(1):1-
10. Epub 2004/03/20.
12. Weetman AP. Determinants of autoimmune thyroid disease. Nature immunology.
2001;2(9):769-70. Epub 2001/08/30.
13. Hiromatsu Y, Satoh H, Amino N. Hashimoto's thyroiditis: history and future outlook.
Hormones (Athens). 2013;12(1):12-8. Epub 2012/01/01.
14. Menconi F, Marcocci C, Marino M. Diagnosis and classification of Graves' disease.
Autoimmunity reviews. 2014;13(4-5):398-402. Epub 2014/01/16.
15. Frohlich E, Wahl R. Thyroid Autoimmunity: Role of Anti-thyroid Antibodies in
Thyroid and Extra-Thyroidal Diseases. Frontiers in immunology. 2017;8:521. Epub
2017/05/26.
16. Hunter D, De Lange M, Snieder H, MacGregor AJ, Swaminathan R, Thakker RV, et
al. Genetic contribution to bone metabolism, calcium excretion, and vitamin D and
parathyroid hormone regulation. J Bone Miner Res. 2001;16(2):371-8.
17. Hansen PS, Brix TH, Iachine I, Kyvik KO, Hegedus L. The relative importance of
genetic and environmental effects for the early stages of thyroid autoimmunity: a study of
healthy Danish twins. Eur J Endocrinol. 2006;154(1):29-38.
18. Bush WS, Moore JH. Chapter 11: Genome-Wide Association Studies. Plos Comput
Biol. 2012;8(12).
19. Robinson-Cohen C, Lutsey PL, Kleber ME, Nielson CM, Mitchell BD, Bis JC, et al.
Genetic Variants Associated with Circulating Parathyroid Hormone. J Am Soc Nephrol.
2017;28(5):1553-65.
36
20. Medici M, Porcu E, Pistis G, Teumer A, Brown SJ, Jensen RA, et al. Identification of
Novel Genetic Loci Associated with Thyroid Peroxidase Antibodies and Clinical Thyroid
Disease. Plos Genet. 2014;10(2).
21. Kwak SH, Park YJ, Go MJ, Lee KE, Kim SJ, Choi HS, et al. A genome-wide
association study on thyroid function and anti-thyroid peroxidase antibodies in Koreans. Hum
Mol Genet. 2014;23(16):4433-42.
22. Schultheiss UT, Teumer A, Medici M, Li Y, Daya N, Chaker L, et al. A Genetic Risk
Score for Thyroid Peroxidase Antibodies Associates With Clinical Thyroid Disease in
Community-Based Populations. J Clin Endocr Metab. 2015;100(5):E799-E807.
23. Paik JM, Farwell WR, Taylor EN. Demographic, dietary, and serum factors and
parathyroid hormone in the National Health and Nutrition Examination Survey. Osteoporosis
Int. 2012;23(6):1727-36.
24. Gutierrez OM, Isakova T, Andress DL, Levin A, Wolf M. Prevalence and severity of
disordered mineral metabolism in Blacks with chronic kidney disease. Kidney Int.
2008;73(8):956-62.
25. Paik JM, Curhan GC, Forman JP, Taylor EN. Determinants of Plasma Parathyroid
Hormone Levels in Young Women. Calcified Tissue Int. 2010;87(3):211-7.
26. Chin KY, Nirwana SI, Ngah WZW. Significant association between parathyroid
hormone and uric acid level in men. Clin Interv Aging. 2015;10:1377-80.
27. Jorde R, Sundsfjord J, Haug E, Bonaa KH. Relation between low calcium intake,
parathyroid hormone, and blood pressure. Hypertension. 2000;35(5):1154-9.
28. Effraimidis G, Wiersinga WM. MECHANISMS IN ENDOCRINOLOGY
Autoimmune thyroid disease: old and new players. Eur J Endocrinol. 2014;170(6):R241-R52.
29. Gaberscek S, Zaletel K. Epidemiological trends of iodine-related thyroid disorders: an
example from Slovenia. Arh Hig Rada Toksiko. 2016;67(2):93-8.
30. Pedersen IB, Knudsen N, Carle A, Vejbjerg P, Jorgensen T, Perrild H, et al. A
cautious iodization programme bringing iodine intake to a low recommended level is
associated with an increase in the prevalence of thyroid autoantibodies in the population. Clin
Endocrinol. 2011;75(1):120-6.
31. Wiersinga WM. Clinical Relevance of Environmental Factors in the Pathogenesis of
Autoimmune Thyroid Disease. Endocrinol Metab-Enm. 2016;31(2):213-22.
32. Tonstad S, Nathan E, Oda K, Fraser G. Vegan Diets and Hypothyroidism. Nutrients.
2013;5(11):4642-52.
33. Tonstad S, Nathan E, Oda K, Fraser GE. Prevalence of hyperthyroidism according to
type of vegetarian diet. Public Health Nutr. 2015;18(8):1482-7.
34. Rudan I, Marusic A, Jankovic S, Rotim K, Boban M, Lauc G, et al. "10 001
Dalmatians:" Croatia Launches Its National Biobank. Croat Med J. 2009;50(1):4-6.
35. Marchini J, Howie B, Myers S, McVean G, Donnelly P. A new multipoint method for
genome-wide association studies by imputation of genotypes. Nat Genet. 2007;39(7):906-13.
36. Aulchenko YS, Ripke S, Isaacs A, Van Duijn CM. GenABEL: an R library for
genome-wide association analysis. Bioinformatics. 2007;23(10):1294-6.
37. Struchalin MV, Amin N, Eilers PHC, van Duijn CM, Aulchenko YS. An R package
"VariABEL" for genome-wide searching of potentially interacting loci by testing genotypic
variance heterogeneity. Bmc Genet. 2012;13.
38. Team RC. R: A Language and Environment for Statistical Computing. R Foundation
for Statistical Computing; 2013; Available from: http://www.R-project.org/.
39. Turner SD. qqman: an R package for visualizing GWAS results using Q-Q and
manhattan plots. bioRxiv. 2014.

37
40. Pruim RJ, Welch RP, Sanna S, Teslovich TM, Chines PS, Gliedt TP, et al.
LocusZoom: regional visualization of genome-wide association scan results. Bioinformatics.
2010;26(18):2336-7.
41. Shen X, Klaric L, Sharapov S, Mangino M, Ning Z, Wu D, et al. Multivariate
discovery and replication of five novel loci associated with Immunoglobulin G N-
glycosylation. Nature communications. 2017;8(1):447. Epub 2017/09/08.
42. Yaman E, Gasper R, Koerner C, Wittinghofer A, Tazebay UH. RasGEF1A and
RasGEF1B are guanine nucleotide exchange factors that discriminate between Rap GTP-
binding proteins and mediate Rap2-specific nucleotide exchange. Febs J. 2009;276(16):4607-
16.
43. He MA, Xu M, Zhang B, Liang J, Chen P, Lee JY, et al. Meta-analysis of genome-
wide association studies of adult height in East Asians identifies 17 novel loci. Hum Mol
Genet. 2015;24(6):1791-800.
44. Allen HL, Estrada K, Lettre G, Berndt SI, Weedon MN, Rivadeneira F, et al.
Hundreds of variants clustered in genomic loci and biological pathways affect human height.
Nature. 2010;467(7317):832-8.
45. Abrams SA, Griffin IJ, Hawthorne KM, Liang LL. Height and height Z-score are
related to calcium absorption in five- to fifteen-year-old girls. J Clin Endocr Metab.
2005;90(9):5077-81.
46. Kiel DP, Demissie S, Dupuis J, Lunetta KL, Murabito JM, Karasik D. Genome-wide
association with bone mass and geometry in the Framingham Heart Study. Bmc Med Genet.
2007;8.
47. Kottgen A, Pattaro C, Boger CA, Fuchsberger C, Olden M, Glazer NL, et al. New loci
associated with kidney function and chronic kidney disease. Nature Genetics. 2010;42(5):376-
U34.
48. Sneve M, Emaus N, Joakimsen RM, Jorde R. The association between serum
parathyroid hormone and bone mineral density, and the impact of smoking: the Tromso
Study. Eur J Endocrinol. 2008;158(3):401-9.
49. Park HS, Yeo HY, Chang HJ, Kim KH, Park JW, Kim BC, et al. Dipeptidyl Peptidase
10, a Novel Prognostic Marker in Colorectal Cancer. Yonsei Med J. 2013;54(6):1362-9.
50. Aigner E, Stadlmayr A, Huber-Schonauer U, Zwerina J, Husar-Memmer E, Niederseer
D, et al. Parathyroid Hormone is Related to Dysplasia and a Higher Rate of Distal Colorectal
Adenoma in Women but Not Men. Horm Cancer-Us. 2015;6(4):153-60.
51. Bezerra GA, Dobrovetsky E, Seitova A, Fedosyuk S, Dhe-Paganon S, Gruber K.
Structure of human dipeptidyl peptidase 10 (DPPY): a modulator of neuronal Kv4 channels.
Sci Rep-Uk. 2015;5.
52. Atlas THP. GRIN3A 2017 [cited 2017 16.10.]; GRIN3A gene]. Available from:
https://www.proteinatlas.org/ENSG00000198785-GRIN3A/tissue.
53. Rizos CV, Elisaf MS, Liberopoulos EN. Effects of thyroid dysfunction on lipid
profile. The open cardiovascular medicine journal. 2011;5:76-84. Epub 2011/06/11.
54. Eriksson N, Tung JY, Kiefer AK, Hinds DA, Francke U, Mountain JL, et al. Novel
associations for hypothyroidism include known autoimmune risk loci. Plos One.
2012;7(4):e34442. Epub 2012/04/12.
55. Shimizu K, Chiba S, Saito T, Kumano K, Hirai H. Physical interaction of Delta1,
Jagged1, and Jagged2 with Notch1 and Notch3 receptors. Biochemical and biophysical
research communications. 2000;276(1):385-9. Epub 2000/09/28.
56. Deftos ML, Huang E, Ojala EW, Forbush KA, Bevan MJ. Notch1 signaling promotes
the maturation of CD4 and CD8 SP thymocytes. Immunity. 2000;13(1):73-84. Epub
2000/08/10.

38
57. Bradfield JP, Qu HQ, Wang K, Zhang H, Sleiman PM, Kim CE, et al. A genome-wide
meta-analysis of six type 1 diabetes cohorts identifies multiple associated loci. Plos Genet.
2011;7(9):e1002293. Epub 2011/10/08.
58. Kariuki SN, Ghodke-Puranik Y, Dorschner JM, Chrabot BS, Kelly JA, Tsao BP, et al.
Genetic analysis of the pathogenic molecular sub-phenotype interferon-alpha identifies
multiple novel loci involved in systemic lupus erythematosus. Genes and immunity.
2015;16(1):15-23. Epub 2014/10/24.
59. Shun CB, Donaghue KC, Phelan H, Twigg SM, Craig ME. Thyroid autoimmunity in
Type 1 diabetes: systematic review and meta-analysis. Diabetic medicine : a journal of the
British Diabetic Association. 2014;31(2):126-35. Epub 2013/10/10.
60. Appenzeller S, Pallone AT, Natalin RA, Costallat LT. Prevalence of thyroid
dysfunction in systemic lupus erythematosus. Journal of clinical rheumatology : practical
reports on rheumatic & musculoskeletal diseases. 2009;15(3):117-9. Epub 2009/03/21.
61. Wyness L. The role of red meat in the diet: nutrition and health benefits. P Nutr Soc.
2016;75(3):227-32.
62. Brassard D, Tessier-Grenier M, Allaire J, Rajendiran E, She YB, Ramprasath V, et al.
Comparison of the impact of SFAs from cheese and butter on cardiometabolic risk factors: a
randomized controlled trial. Am J Clin Nutr. 2017;105(4):800-9.
63. Sobiecki JG, Appleby PN, Bradbury KE, Key TJ. High compliance with dietary
recommendations in a cohort of meat eaters, fish eaters, vegetarians, and vegans: results from
the European Prospective Investigation into Cancer and Nutrition-Oxford study. Nutr Res.
2016;36(5):464-77.
64. Woo SJ, Lim K, Park SY, Jung MY, Lim HS, Jeon MG, et al. Endogenous conversion
of n-6 to n-3 polyunsaturated fatty acids attenuates K/BxN serum-transfer arthritis in fat-1
mice. J Nutr Biochem. 2015;26(7):713-20.
65. Allen MJ, Fan YY, Monk JM, Hou TY, Barhoumi R, McMurray DN, et al. n-3 PUFAs
Reduce T-Helper 17 Cell Differentiation by Decreasing Responsiveness to Interleukin-6 in
Isolated Mouse Splenic CD4(+) T Cells. J Nutr. 2014;144(8):1306-13.
66. Shoda H, Yanai R, Yoshimura T, Nagai T, Kimura K, Sobrin L, et al. Dietary Omega-
3 Fatty Acids Suppress Experimental Autoimmune Uveitis in Association with Inhibition of
Th1 and Th17 Cell Function. Plos One. 2015;10(9).
67. Lorente-Cebrian S, Costa AGV, Navas-Carretero S, Zabala M, Laiglesia LM,
Martinez JA, et al. An update on the role of omega-3 fatty acids on inflammatory and
degenerative diseases. J Physiol Biochem. 2015;71(2):341-9.
68. Pestka JJ, Vines LL, Bates MA, He KY, Langohr I. Comparative Effects of n-3, n-6
and n-9 Unsaturated Fatty Acid-Rich Diet Consumption on Lupus Nephritis, Autoantibody
Production and CD4(+) T Cell-Related Gene Responses in the Autoimmune NZBWF1
Mouse. Plos One. 2014;9(6).
69. Bacher M, Metz CN, Calandra T, Mayer K, Chesney J, Lohoff M, et al. An essential
regulatory role for macrophage migration inhibitory factor in T-cell activation. P Natl Acad
Sci USA. 1996;93(15):7849-54.
70. Pyzik A, Grywalska E, Matyjaszek-Matuszek B, Rolinski J. Immune Disorders in
Hashimoto's Thyroiditis: What Do We Know So Far? J Immunol Res. 2015.
71. Peng D, Xu BC, Wang Y, Guo H, Jiang YF. A High Frequency of Circulating Th22
and Th17 Cells in Patients with New Onset Graves' Disease. Plos One. 2013;8(7).
72. Monograph. Plant sterols and sterolins. Alternative medicine review : a journal of
clinical therapeutic. 2001;6(2):203-6. Epub 2001/04/17.
73. Devaraj S, Jialal I, Rockwood J, Zak D. Effect of orange juice and beverage with
phytosterols on cytokines and PAI-1 activity. Clin Nutr. 2011;30(5):668-71. Epub
2011/04/12.

39
74. Xin J, Feinstein DL, Hejna MJ, Lorens SA, McGuire SO. Beneficial effects of
blueberries in experimental autoimmune encephalomyelitis. Journal of agricultural and food
chemistry. 2012;60(23):5743-8. Epub 2012/01/17.
75. Yoon CH, Chung SJ, Lee SW, Park YB, Lee SK, Park MC. Gallic acid, a natural
polyphenolic acid, induces apoptosis and inhibits proinflammatory gene expressions in
rheumatoid arthritis fibroblast-like synoviocytes. Joint, bone, spine : revue du rhumatisme.
2013;80(3):274-9. Epub 2012/10/13.
76. Kuppan G, Balasubramanyam J, Monickaraj F, Srinivasan G, Mohan V,
Balasubramanyam M. Transcriptional regulation of cytokines and oxidative stress by gallic
acid in human THP-1 monocytes. Cytokine. 2010;49(2):229-34.

40
4. ŽIVOTOPIS
Osobni podatci
Ime i prezime: Antonela Matana (djevojačko prezime Boljat)
Adresa: Žnjanska 2, 21000 Split, Hrvatska
Mobitel: +385 (0) 99416 0739
E-adresa: [email protected]
Datum i mjesto rođenja: 06. travnja 1989., Split, Hrvatska
Obrazovanje
Datum: 2015. - danas
Mjesto: Split
Ustanova: Medicinski fakultet, Sveučilište u Splitu, doktorski studij TRIBE
Zvanje: -
Datum: 2010. – 2012.
Mjesto: Zagreb
Ustanova: Prirodoslovno-matematički fakultet, Sveučilište u Zagrebu
smjer Financijska i poslovna matematika
Zvanje: Magistra matematike
Datum 2007. – 2010.
Mjesto Split
Ustanova Prirodoslovno-matematički fakultet, Sveučilište u Splitu
smjer Matematika i informatika
Zvanje Prvostupnica matematike i informatike
Radno iskustvo
Datumi (od-do): 2015. - danas
Ustanova zaposlenja: Sveučilište u Splitu, Medicinski fakultet, Katedra za medicinsku
biologiju
Naziv radnog mjesta: Asistent
Funkcija: Doktorand na HRZZ projektu
41
Datumi (od-do): 2012. - 2015.
Ustanova zaposlenja: Sveučilište u Splitu, Prirodoslovno-matematički fakultet
Naziv radnog mjesta: Stručni suradnik, Vanjski suradnik
Funkcija: Održavanje nastave
Datumi (od-do): 2014. – 2015.
Ustanova zaposlenja: Sveučilište u Splitu, Ekonomski fakultet
Naziv radnog mjesta: Vanjski suradnik
Funkcija: Održavanje nastave
Datumi (od-do): 2018. - danas
Ustanova zaposlenja: Sveučilište u Splitu, Kemijsko-tehnološki fakultet
Naziv radnog mjesta: Vanjski suradnik
Funkcija: Održavanje nastave
Nastavne aktivnosti
Matematika, Matematika I, Matematika II, Matematika IV, Uvod u matematiku, Programiranje I,
Statistika, Metodika nastave primijenjene matematike (PMF).
Matematika, Matematika u ekonomiji (EF)
Primijenjena matematika (KTF).
Usavršavanje/tečajevi
1. Radionica „Introduction to the statistical analysis of genome-wide association studies“,
Imperial College London, London, Engleska, 2017.
2. Radionica „Genetic analysis of thyroid and parathyroid function", Medicinski fakultet,
Sveučilište u Splitu, Split, Hrvatska, 2017.
3. Radionica “Active learning in STEM education”, Prirodoslovno-matematički fakultet,
Sveučilište u Splitu. Split, Hrvatska, 2017.
4. Ljetna škola „First International Summer School on Data Science“, FESB, Sveučilište u Splitu,
Split, Hrvatska, 2016.
5. Ljetna škola: „RSSSO2015: Research Summer School in Statistical Omics“, MEDILS, Split,
Hrvatska, 2015.
6. Radionica „Bioinformatics Methods in Genomics“, Institut Ruđera Boškovića, Zagreb,

42
Hrvatska, 2015.
Znanstveno istraživački projekti
2015 - 2018 doktorand na HRZZ projektu “Identification of new genetic loci implicated in
regulation of thyroid and parathyroid function”.
Znanstveni radovi
1. Matana A, Popović M, Boutin T, Torlak V, Brdar D, Gunjača I, et al. Genome-wide meta-
analysis identifies novel gender specific loci associated with thyroid antibodies level in Croatians.
Genomics. 2018
2. Matana A, Brdar D, Torlak V, Boutin T, Popović M, Gunjača I, et al. Genome-wide meta-
analysis identifies novel loci associated with parathyroid hormone level. Molecular Medicine.
2018;24(1):15.
3. Matana A, Torlak V, Brdar D, Popović M, Lozić B, Barbalić M, Perica VB, Punda A, Polašek
O, Hayward C, Zemunik T. Dietary Factors Associated with Plasma Thyroid Peroxidase and
Thyroglobulin Antibodies. Nutrients. 2017; 9(11):1186
4. Matana A, Popovic M, Torlak V, Punda A, Barbalic M, Zemunik T. Effects of genetic variants
on serum parathyroid hormone in hyperparathyroidism and end-stage renal disease patients: A
systematic review and meta-analysis. Medicine. 2018;97(21)
5. Boljat A, Gunjača I, Konstantinović I, Vidan N, Boraska Perica V, Pehlić M, Škrabić V,
Zemunik T. Environmental Risk Factors for Type 1 Diabetes Mellitus Development. Exp Clin
Endocrinol Diabetes. 2017 Sep;125(8):563-570. doi: 10.1055/s-0043-109000. Epub 2017 Jul 27.
6. Popović M, Matana A, Torlak Lovrić V, Brdar D, Gunjača I, Boraska Perica V, Barbalic M,
Kolčić I, Punda A, Polašek O, Hayward C, Zemunik T. The effect of multiple nutrients on plasma
parathyroid hormone level in healthy individuals. Int J Food Sci Nutr. 2018. doi:
10.1080/09637486.2018.1551335.
Kongresni sažeci
1. Antonela Matana, Marijana Popović, Vesela Torlak, Thibaud Boutin, Dubravka Brdar, Ivana
Gunjača, Nikolina Vidan, Dean Kaličanin, Ivana Kolčić, Vesna Boraska Perica, Ante Punda,
Ozren Polašek, Maja Barbalić, Caroline Hayward, Tatijana Zemunik. Genome-wide meta-
analysis identifies novel loci associated with free triiodothyronine and thyroid-stimulating
hormone. American Society of Human Genetics Annual Meeting, October 16-20 2018, San
Diego, California, USA.
43
2. Tatijana Zemunik, Antonela Matana, Marijana Popović, Thibaud Boutin, Vesela Torlak,
Dubravka Brdar, Ivana Gunjača, Ivana Kolčić, Vesna Boraska Perica, Ante Punda, Ozren
Polašek, Maja Barbalić, Caroline Hayward. Genetic variants in the ST6GAL1 gene are
associated with thyroglobulin plasma levels in healthy individuals. American Society of
Human Genetics Annual Meeting, October 16-20 2018, San Diego, California, USA.
3. Antonela Matana, Dubravka Brdar, Vesela Torlak, Marijana Popović, Ivana Gunjača, Ozren
Polašek, Vesna Boraska Perica, Maja Barbalić, Ante Punda, Caroline Hayward, Tatijana
Zemunik. Genome-wide Analysis Identifies Locus associated with Parathyroid Hormone
Levels. ICHG 2017: 19th International Conference on Human Genetics, December 18-19
2017, Bangkok, Thailand. (nagrada za najbolju prezentaciju)
4. Gunjača I., Matana A., Torlak V., Punda A., Boraska Perica V., Polašek O., Hayward C.,
Zemunik T., Barbalić M. Genome-wide meta-analysis of thyroid hormone T4 serum levels.
Second Adriatic Symposium on Biophysical Approaches in Biomedical Studies, September
24-28 2017, Split, Croatia.
5. Dubravka Brdar, Antonela Boljat, Vesela Torlak, Ante Punda, Vesna Boraska Perica, Ivana
Gunjača, Nikolina Vidan, Bernarda Lozić, Ozren Polašek, Caroline Hayward, Maja Barbalić,
Tatijana Zemunik. Identification of novel genetic loci associated with thyroid function.
European Congress of Endocrinology, ECE 2016, May 28-31, Munich, Germany.
6. Antonela Boljat, Ivana Gunjača, Nikolina Vidan, Vesela Torlak, Dubravka Brdar, Ante
Punda, Bernarda Lozić, Vesna Boraska Perica, Ozren Polašek, Caroline Hayward, Maja
Barbalić, Tatijana Zemunik. Identification of new genetic loci and environmental factors
associated with parathyroid hormone levels. European human genetics conference 2016, May
21-24 2016. Barcelona, Spain.
7. Gunjača I., Boljat A., Vidan N., Torlak V., Punda A., Boraska Perica V., Polašek O., Zemunik
T., Barbalić M. Identification of new genetic loci associated with serum level of the thyroid
hormone T4 in thyroid gland, Croatian congress of Human genetics with international
participation, November 5-7 2015, Split, Croatia.
8. Boljat A., Gunjača I., Vidan N., Torlak V., Brdar D., Punda A., Boraska Perica V., Polašek
O., Barbalić M., Zemunik T. Influence of selected environmental factors on thyroid function,
Croatian congress of Human genetics with international participation, November 5-7 2015,
Split, Croatia.
9. Zemunik T., Boljat A., Vidan N., Gunjača I., Torlak V., Brdar D., Punda A., Lozić B.,
Boraska Perica V., Polašek O., Barbalić M., Hayward C. Genetic loci implicated in regulation

44
of thyroid function, Croatian congress of Human genetics with international participation,
November 5-7 2015, Split, Croatia.
Nagrade
Best Presentation Award za najbolju prezentaciju na kongresu „ICHG 2017: 19th International
Conference on Human Genetics, December 18-19 2017''
45
5. PRESLIKE OBJEDINJENIH RADOVA
1. Matana A, Brdar D, Torlak V, Boutin T, Popović M, Gunjača I, Kolčić I, Boraska Perica V,
Punda A, Polašek O, Barbalić M, Hayward C, Zemunik T. Genome-wide meta-analysis
identifies novel loci associated with parathyroid hormone level. Mol Med. 2018: 24: 15.
2. Matana A, Popović M, Boutin T, Torlak V, Brdar D, Gunjača I, Kolčić I, Boraska Perica V,
Punda A, Polašek O, Hayward C, Barbalić M, Zemunik T. Genome-wide meta-analysis
identifies novel gender specific loci associated with thyroid antibodies level in Croatians.
3. Matana A, Torlak V, Brdar D, Popović M, Lozić B, Barbalić M, Perica VB, Punda A,
Polašek O, Hayward C, Zemunik T. Dietary Factors Associated with Plasma Thyroid
Peroxidase and Thyroglobulin Antibodies. Nutrients. 2017: 28;9(11).
RESEARCH ARTICLE Open Access
Genome-wide meta-analysis identifiesnovel loci associated with parathyroidhormone levelAntonela Matana1, Dubravka Brdar2, Vesela Torlak2, Thibaud Boutin3, Marijana Popović1, Ivana Gunjača1,Ivana Kolčić4, Vesna Boraska Perica1, Ante Punda2, Ozren Polašek4, Maja Barbalić1, Caroline Hayward3
and Tatijana Zemunik1*
Abstract
Background: Parathyroid hormone (PTH) is one of the principal regulators of calcium homeostasis. Although serumPTH level is mostly accounted by genetic factors, genetic background underlying PTH level is insufficiently known.Therefore, the aim of this study was to identify novel genetic variants associated with PTH levels.
Methods: We performed GWAS meta-analysis within two genetically isolated Croatian populations followed byreplication analysis in a Croatian mainland population and we also combined results across all three analyzedpopulations. The analyses included 2596 individuals. A total of 7,411,206 variants, imputed using the 1000 Genomesreference panel, were analysed for the association. In addition, a sex-specific GWAS meta-analyses were performed.
Results: Polymorphisms with the lowest P-values were located on chromosome 4 approximately 84 kb of the 5′ ofRASGEF1B gene. The most significant SNP was rs11099476 (P = 1.15 × 10⁻⁸). Sex-specific analysis identified genome-wide significant association of the variant rs77178854, located within DPP10 gene in females only (P = 2.21 × 10− 9).There were no genome-wide significant findings in the meta-analysis of males.
Conclusions: We identified two biologically plausible novel loci associated with PTH levels, providing us withfurther insights into the genetics of this complex trait.
Keywords: Parathyroid hormone, Genome-wide association analysis, Meta-analysis
BackgroundParathyroid hormone (PTH) plays a critical role in theregulation of bone mineral metabolism and calciumhomeostasis (DeLuca, 1986). PTH regulates serum cal-cium levels by stimulating osteoclast activity within bonein order to release calcium. Circulating PTH enhancesthe reabsorption of calcium in distal nephrons and in-duces the synthesis of the vitamin D active metabolite1,25-dihydroxyvitamin D (1,25(OH)2D3) within the kid-ney (Kumar & Thompson, 2011; Kumar et al., 1991;Khundmiri et al., 2016). The 1,25(OH)2D3 stimulates in-testinal calcium absorption and moreover, has a syner-
gistic effect with PTH in bone resorption by stimulatingproliferation of osteoclasts (Kumar & Thompson, 2011;Kumar et al., 1991; Khundmiri et al., 2016).Variations in PTH synthesis and secretion are regu-
lated by serum levels of calcium and phosphate, as wellas by 1,25(OH)2D3 (Kumar & Thompson, 2011; Gagoet al., 2005). Decreases in serum levels of calcium andincreases in serum levels of phosphate stimulate the se-cretion of PTH, while 1,25(OH)2D3 decreases PTH se-cretion (Silver & Levi, 2005). Regulation of PTHsecretion in response to variations in serum calcium ismediated by the calcium-sensing receptors on the mem-brane of parathyroid cells (Kumar & Thompson, 2011;Brent et al., 1988). 1,25(OH)2D3 associates with the vita-min D receptor and thus represses the transcription ofPTH. The secretion of PTH is also indirectly altered by
* Correspondence: [email protected] of Medical Biology, University of Split, School of Medicine,Šoltanska 2, Split, CroatiaFull list of author information is available at the end of the article
Molecular Medicine
© The Author(s). 2018 Open Access This article is distributed under the terms of the Creative Commons Attribution 4.0International License (http://creativecommons.org/licenses/by/4.0/), which permits unrestricted use, distribution, andreproduction in any medium, provided you give appropriate credit to the original author(s) and the source, provide a link tothe Creative Commons license, and indicate if changes were made. The Creative Commons Public Domain Dedication waiver(http://creativecommons.org/publicdomain/zero/1.0/) applies to the data made available in this article, unless otherwise stated.
Matana et al. Molecular Medicine (2018) 24:15 https://doi.org/10.1186/s10020-018-0018-5
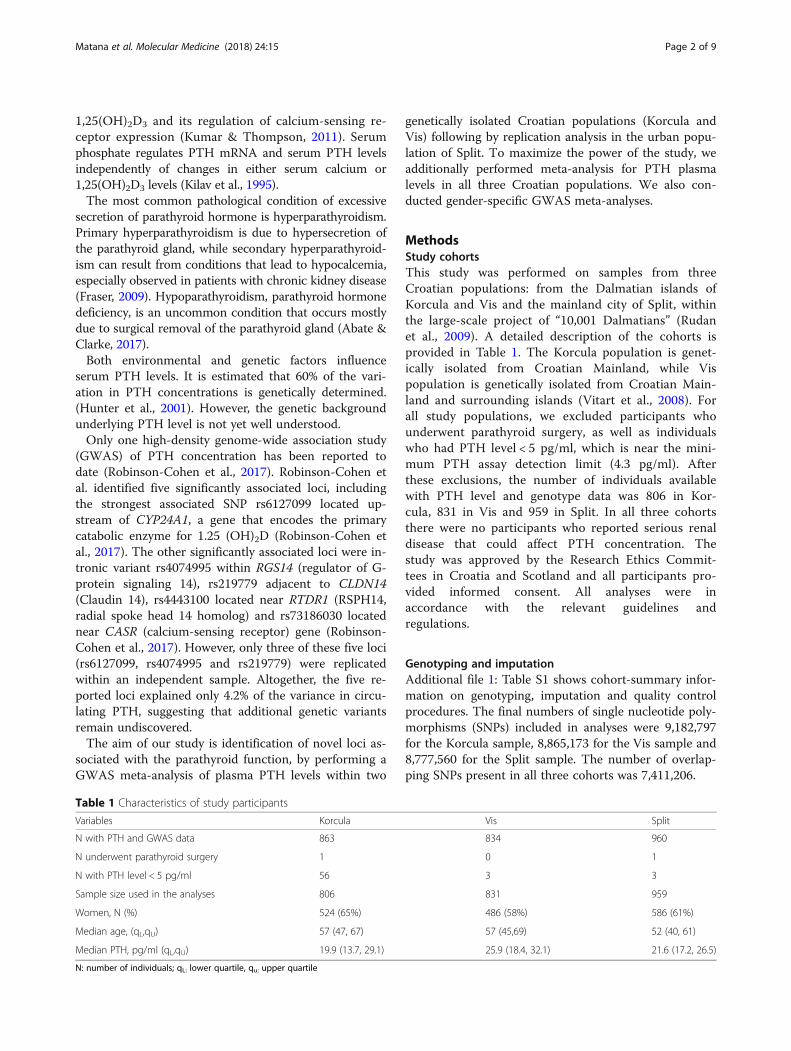
1,25(OH)2D3 and its regulation of calcium-sensing re-ceptor expression (Kumar & Thompson, 2011). Serumphosphate regulates PTH mRNA and serum PTH levelsindependently of changes in either serum calcium or1,25(OH)2D3 levels (Kilav et al., 1995).The most common pathological condition of excessive
secretion of parathyroid hormone is hyperparathyroidism.Primary hyperparathyroidism is due to hypersecretion ofthe parathyroid gland, while secondary hyperparathyroid-ism can result from conditions that lead to hypocalcemia,especially observed in patients with chronic kidney disease(Fraser, 2009). Hypoparathyroidism, parathyroid hormonedeficiency, is an uncommon condition that occurs mostlydue to surgical removal of the parathyroid gland (Abate &Clarke, 2017).Both environmental and genetic factors influence
serum PTH levels. It is estimated that 60% of the vari-ation in PTH concentrations is genetically determined.(Hunter et al., 2001). However, the genetic backgroundunderlying PTH level is not yet well understood.Only one high-density genome-wide association study
(GWAS) of PTH concentration has been reported todate (Robinson-Cohen et al., 2017). Robinson-Cohen etal. identified five significantly associated loci, includingthe strongest associated SNP rs6127099 located up-stream of CYP24A1, a gene that encodes the primarycatabolic enzyme for 1.25 (OH)2D (Robinson-Cohen etal., 2017). The other significantly associated loci were in-tronic variant rs4074995 within RGS14 (regulator of G-protein signaling 14), rs219779 adjacent to CLDN14(Claudin 14), rs4443100 located near RTDR1 (RSPH14,radial spoke head 14 homolog) and rs73186030 locatednear CASR (calcium-sensing receptor) gene (Robinson-Cohen et al., 2017). However, only three of these five loci(rs6127099, rs4074995 and rs219779) were replicatedwithin an independent sample. Altogether, the five re-ported loci explained only 4.2% of the variance in circu-lating PTH, suggesting that additional genetic variantsremain undiscovered.The aim of our study is identification of novel loci as-
sociated with the parathyroid function, by performing aGWAS meta-analysis of plasma PTH levels within two
genetically isolated Croatian populations (Korcula andVis) following by replication analysis in the urban popu-lation of Split. To maximize the power of the study, weadditionally performed meta-analysis for PTH plasmalevels in all three Croatian populations. We also con-ducted gender-specific GWAS meta-analyses.
MethodsStudy cohortsThis study was performed on samples from threeCroatian populations: from the Dalmatian islands ofKorcula and Vis and the mainland city of Split, withinthe large-scale project of “10,001 Dalmatians” (Rudanet al., 2009). A detailed description of the cohorts isprovided in Table 1. The Korcula population is genet-ically isolated from Croatian Mainland, while Vispopulation is genetically isolated from Croatian Main-land and surrounding islands (Vitart et al., 2008). Forall study populations, we excluded participants whounderwent parathyroid surgery, as well as individualswho had PTH level < 5 pg/ml, which is near the mini-mum PTH assay detection limit (4.3 pg/ml). Afterthese exclusions, the number of individuals availablewith PTH level and genotype data was 806 in Kor-cula, 831 in Vis and 959 in Split. In all three cohortsthere were no participants who reported serious renaldisease that could affect PTH concentration. Thestudy was approved by the Research Ethics Commit-tees in Croatia and Scotland and all participants pro-vided informed consent. All analyses were inaccordance with the relevant guidelines andregulations.
Genotyping and imputationAdditional file 1: Table S1 shows cohort-summary infor-mation on genotyping, imputation and quality controlprocedures. The final numbers of single nucleotide poly-morphisms (SNPs) included in analyses were 9,182,797for the Korcula sample, 8,865,173 for the Vis sample and8,777,560 for the Split sample. The number of overlap-ping SNPs present in all three cohorts was 7,411,206.
Table 1 Characteristics of study participants
Variables Korcula Vis Split
N with PTH and GWAS data 863 834 960
N underwent parathyroid surgery 1 0 1
N with PTH level < 5 pg/ml 56 3 3
Sample size used in the analyses 806 831 959
Women, N (%) 524 (65%) 486 (58%) 586 (61%)
Median age, (qL,qU) 57 (47, 67) 57 (45,69) 52 (40, 61)
Median PTH, pg/ml (qL,qU) 19.9 (13.7, 29.1) 25.9 (18.4, 32.1) 21.6 (17.2, 26.5)
N: number of individuals; qL: lower quartile, qu: upper quartile
Matana et al. Molecular Medicine (2018) 24:15 Page 2 of 9

Measurement of PTHPlasma PTH levels were determined by radio-immunoassay method (RIA) in the Laboratory of Bio-chemistry, Department of Nuclear Medicine, UniversityHospital Split. RIA ran on the Scintillation counter li-quid samples, Capintec, and 125I served as a marker.The concentrations of PTH in the plasma were deter-mined using commercial kits (DIAsource hPTH-120 min-IRMA Kit, DIAsource ImmunoAssays S.A,Belgium). The reference range of plasma PTH levels is12.26–35.50 pg/ml.
Statistical analysesWe performed genome-wide association analysis withineach data set and then conducted a meta-analysis of twogenetically isolated cohorts (Korcula and Vis) followedby replication analysis in the cohort of the mainland cityof Split. To maximize the study power, we also per-formed a further meta-analysis of all three cohorts.
Genome-wide association analysesAssociation analysis for the Split sample was carried outusing a combination of R-package GenABEL andSNPTEST software, while for the Korcula and Vissamples analyses were conducted using R-packagesGenABEL and VariABEL (Aulchenko et al., 2007;Marchini et al., 2007; Struchalin et al., 2012).PTH levels were adjusted for age and sex using linear
regression analysis and the calculated residuals wereinverse-Gaussian transformed to achieve a normal distri-bution. GWAS was performed on transformed residualsusing linear mixed model which accounts for populationstructure and relatedness. Association statistics for eachSNP, including effect size estimates (β-estimates), stand-ard errors and p-values were calculated under an addi-tive genetic model.Prior to performing the meta-analysis we calculated
genomic inflation factors (lambdas) in individual datasets. No adjustments were necessary (λKorcula = 1.026,λVis = 1.001, λSplit = 0.99).
Meta-analysisMeta-analysis was carried out using the R-packageMetABEL (R: A Language and Environment for Statis-tical Computing, 2018). Meta-analysis was conductedusing the inverse-variance fixed-effects method on over-lapping SNPs based on the β-estimates and standard er-rors from each study. Meta-analyses showed no significantevidence for inflated statistics (both λKorcula − Vis andλKorcula − Vis − Split were 1.01), thus no genomic correc-tion was applied. To visualize results of the meta-analysis, Manhattan and quantile-quantile (QQ) plotswere created using R-package qqman (Turner, 2014).Regional association plots for loci of interest
(±400 kb) were produced using Locus Zoom based onhg19 genome build and 1000 genomes EUR popula-tion as the linkage disequilibrium (LD) population(Pruim et al., 2010). Forest plots for the most associ-ated SNP were created using R-package MetABEL. Toconfirm the genotyping quality for the most associ-ated SNPs in the regions, cluster plots were visuallyinspected using the Illumina GenomeStudio softwarepackage. If the SNP of interest was not directly geno-typed, but imputed, then cluster plots were examinedfor directly genotyped SNPs in high LD with the SNPof interest (r2 > 0.8), located on the same chromosomeand less than 400 kb apart. A genome-wide significance ofassociation was defined as p − value ≤ 5 × 10⁻⁸. Powercalculations were performed using Quanto version 1.2.4for quantitative traits (WJ MJ, 2006).
Sex-specific analysesIn order to identify sex-specific effects we performedGWAS analyzing males and females separately in eachcohort. We used the same procedures as in the primaryanalyses with the exception of the gender covariate. As-sociation results were meta-analyzed using the inverse-variance fixed-effects method. The total sample sizeswere 1596 in women and 1000 in men.
ResultsMeta-analysesIn each population, a separate genome-wide associ-ation study of PTH levels was conducted. We meta-analyzed two genetically isolated cohorts, Korcula andVis (Additional file 1: Figure S1), and then replicatedresults in the Split population. A total of 1637 indi-viduals were included in the meta-analysis and 959 inthe replication analysis (Table 1). The most associatedSNP was rs4616742 (reference allele C, β = 0.18, SE =0.04, P = 4.42 × 10⁻⁷). The SNP is located near proteincoding gene RASGEF1B (RASGEF Domain FamilyMember 1B). All top SNPs, located on thechromosome 4 near RASGEF1B gene with P < 10−6
from meta-analysis of ‘genetically isolated populations’reached P < 0.05 in the Split population.To maximize the study power, we performed a meta-
analysis of all three cohorts. In total, 2596 individualswere included in the meta-analysis (Table 1). The resultsare shown in Fig. 1a. As seen from the quantile-quantileplot there was no early deviation from expected P values(Fig. 1b). Four SNPs, representing one locus, reachedgenome-wide significance. As in the meta-analysis oftwo genetically isolated cohorts, SNPs with the lowest P-values were located on chromosome 4 near RASGEF1B.The most associated SNP was rs11099476 (P = 1.15 ×10⁻⁸), which explained 1.14% of the variance in PTH.We found the T allele of the rs11099476 to be associated
Matana et al. Molecular Medicine (2018) 24:15 Page 3 of 9
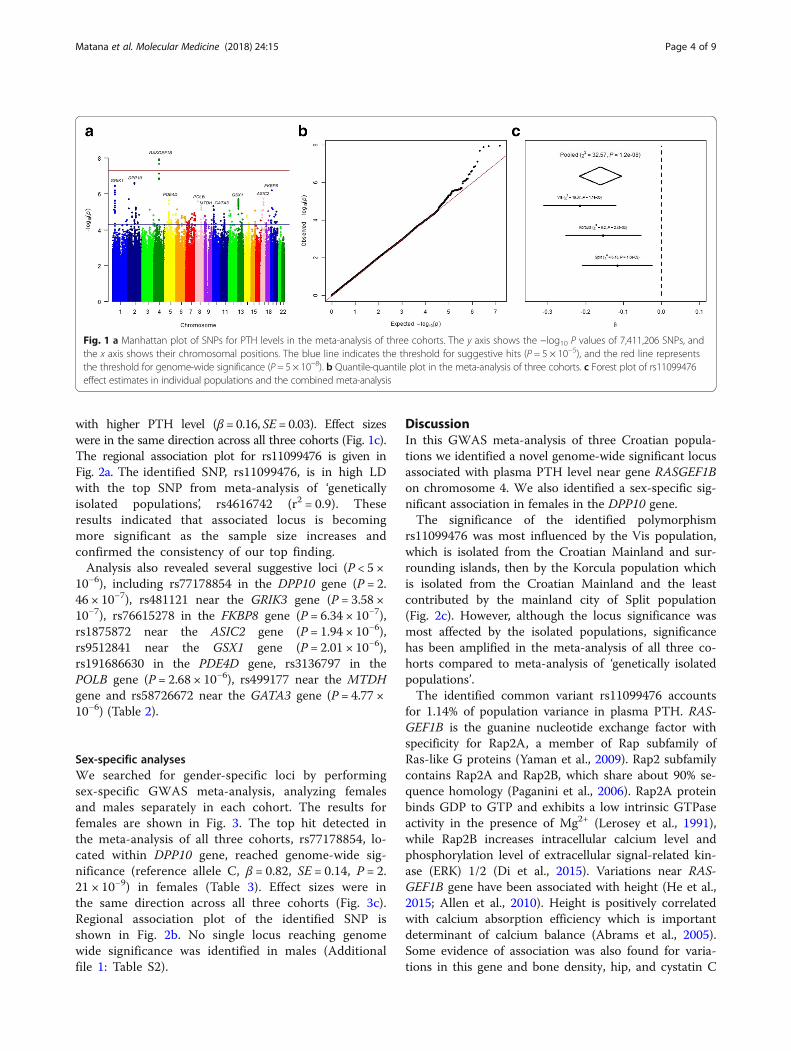
with higher PTH level (β = 0.16, SE = 0.03). Effect sizeswere in the same direction across all three cohorts (Fig. 1c).The regional association plot for rs11099476 is given inFig. 2a. The identified SNP, rs11099476, is in high LDwith the top SNP from meta-analysis of ‘geneticallyisolated populations’, rs4616742 (r2 = 0.9). Theseresults indicated that associated locus is becomingmore significant as the sample size increases andconfirmed the consistency of our top finding.Analysis also revealed several suggestive loci (P < 5 ×
10−6), including rs77178854 in the DPP10 gene (P = 2.46 × 10⁻⁷), rs481121 near the GRIK3 gene (P = 3.58 ×10⁻⁷), rs76615278 in the FKBP8 gene (P = 6.34 × 10⁻⁷),rs1875872 near the ASIC2 gene (P = 1.94 × 10⁻⁶),rs9512841 near the GSX1 gene (P = 2.01 × 10⁻⁶),rs191686630 in the PDE4D gene, rs3136797 in thePOLB gene (P = 2.68 × 10⁻⁶), rs499177 near the MTDHgene and rs58726672 near the GATA3 gene (P = 4.77 ×10⁻⁶) (Table 2).
Sex-specific analysesWe searched for gender-specific loci by performingsex-specific GWAS meta-analysis, analyzing femalesand males separately in each cohort. The results forfemales are shown in Fig. 3. The top hit detected inthe meta-analysis of all three cohorts, rs77178854, lo-cated within DPP10 gene, reached genome-wide sig-nificance (reference allele C, β = 0.82, SE = 0.14, P = 2.21 × 10⁻⁹) in females (Table 3). Effect sizes were inthe same direction across all three cohorts (Fig. 3c).Regional association plot of the identified SNP isshown in Fig. 2b. No single locus reaching genomewide significance was identified in males (Additionalfile 1: Table S2).
DiscussionIn this GWAS meta-analysis of three Croatian popula-tions we identified a novel genome-wide significant locusassociated with plasma PTH level near gene RASGEF1Bon chromosome 4. We also identified a sex-specific sig-nificant association in females in the DPP10 gene.The significance of the identified polymorphism
rs11099476 was most influenced by the Vis population,which is isolated from the Croatian Mainland and sur-rounding islands, then by the Korcula population whichis isolated from the Croatian Mainland and the leastcontributed by the mainland city of Split population(Fig. 2c). However, although the locus significance wasmost affected by the isolated populations, significancehas been amplified in the meta-analysis of all three co-horts compared to meta-analysis of ‘genetically isolatedpopulations’.The identified common variant rs11099476 accounts
for 1.14% of population variance in plasma PTH. RAS-GEF1B is the guanine nucleotide exchange factor withspecificity for Rap2A, a member of Rap subfamily ofRas-like G proteins (Yaman et al., 2009). Rap2 subfamilycontains Rap2A and Rap2B, which share about 90% se-quence homology (Paganini et al., 2006). Rap2A proteinbinds GDP to GTP and exhibits a low intrinsic GTPaseactivity in the presence of Mg2+ (Lerosey et al., 1991),while Rap2B increases intracellular calcium level andphosphorylation level of extracellular signal-related kin-ase (ERK) 1/2 (Di et al., 2015). Variations near RAS-GEF1B gene have been associated with height (He et al.,2015; Allen et al., 2010). Height is positively correlatedwith calcium absorption efficiency which is importantdeterminant of calcium balance (Abrams et al., 2005).Some evidence of association was also found for varia-tions in this gene and bone density, hip, and cystatin C
Fig. 1 a Manhattan plot of SNPs for PTH levels in the meta-analysis of three cohorts. The y axis shows the −log10 P values of 7,411,206 SNPs, andthe x axis shows their chromosomal positions. The blue line indicates the threshold for suggestive hits (P = 5 × 10⁻⁵), and the red line representsthe threshold for genome-wide significance (P = 5 × 10⁻⁸). b Quantile-quantile plot in the meta-analysis of three cohorts. c Forest plot of rs11099476effect estimates in individual populations and the combined meta-analysis
Matana et al. Molecular Medicine (2018) 24:15 Page 4 of 9
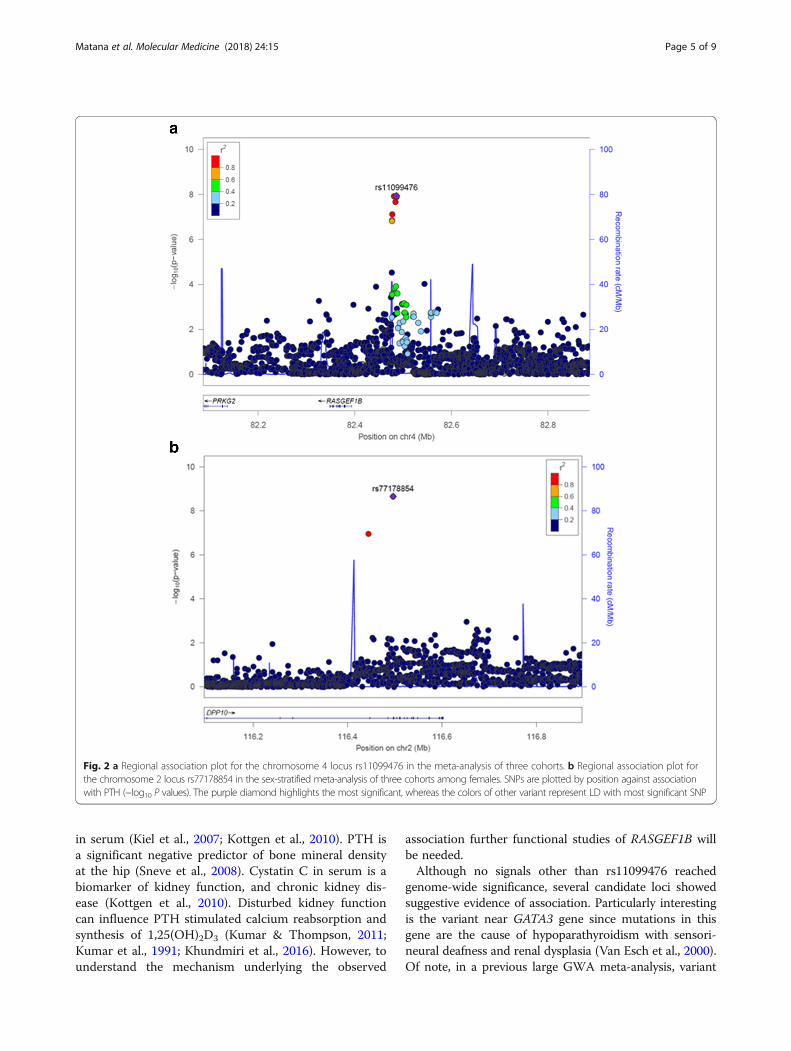
in serum (Kiel et al., 2007; Kottgen et al., 2010). PTH isa significant negative predictor of bone mineral densityat the hip (Sneve et al., 2008). Cystatin C in serum is abiomarker of kidney function, and chronic kidney dis-ease (Kottgen et al., 2010). Disturbed kidney functioncan influence PTH stimulated calcium reabsorption andsynthesis of 1,25(OH)2D3 (Kumar & Thompson, 2011;Kumar et al., 1991; Khundmiri et al., 2016). However, tounderstand the mechanism underlying the observed
association further functional studies of RASGEF1B willbe needed.Although no signals other than rs11099476 reached
genome-wide significance, several candidate loci showedsuggestive evidence of association. Particularly interestingis the variant near GATA3 gene since mutations in thisgene are the cause of hypoparathyroidism with sensori-neural deafness and renal dysplasia (Van Esch et al., 2000).Of note, in a previous large GWA meta-analysis, variant
Fig. 2 a Regional association plot for the chromosome 4 locus rs11099476 in the meta-analysis of three cohorts. b Regional association plot forthe chromosome 2 locus rs77178854 in the sex-stratified meta-analysis of three cohorts among females. SNPs are plotted by position against associationwith PTH (−log10 P values). The purple diamond highlights the most significant, whereas the colors of other variant represent LD with most significant SNP
Matana et al. Molecular Medicine (2018) 24:15 Page 5 of 9

near GATA3 gene was found to be associated with serumcalcium (O'Seaghdha et al., 2013).Given the reported differences in PTH level be-
tween males and females, we performed sex-specificanalyses (Wei et al., 2015; Serdar et al., 2017). Ourstudy supports the sex-specificity underlying PTHlevel. Sex-stratified analysis in women identified anovel locus associated with PTH. The identified locusis the intron variant rs77178854, located withinDPP10 gene. DPP10 encodes a membrane proteinthat is a member of the serine proteases family,which binds specific voltage-gated potassium channelsand alters their expression and biophysical properties.It is highly expressed in brain, pancreas, spinal cordand adrenal gland (Allen et al., 2003), and may serveas a prognostic marker in colorectal cancer (Park etal., 2013). It is interesting to note that Aigner et al.showed that high serum PTH concentrations were
associated with distal colorectal cancer in women butnot in men (Aigner et al., 2015). The existence ofDPP10 in endocrine cells indicate that the proteinmight also have an additional role in the regulationof hormone secretion (Bezerra et al., 2015), whichalso supports our finding. Further studies of DPP10will be needed to clarify this result.The only previously published high-density GWAS
for PTH levels did not identify RASGEF1B or DPP10at a genome-wide significant level, despite having asample size of over 29,155 participants (22, 653 indiscovery stage and 6502 in replication analysis)(Robinson-Cohen et al., 2017). The possible explan-ation could be an increased relative effect of theseloci in our populations due to the reduced geneticand environmental heterogeneity found in two out ofthree cohorts (i.e., Korcula and Vis) (Rudan et al., 2008)compared to the urban populations used in the
Table 2 Associations of top single nucleotide polymorphisms(P < 5 × 10⁻⁶) with PTH concentrations
SNP Chr Position Nearest Gene Effect Allele Other Allele EAF Korcula EAF Vis EAF Split GnomAD EAF β SE P value
rs11099476 4 82,486,056 RASGEF1B T A 0.57 0.55 0.54 0.59 0.16 0.03 1.15×10⁻⁸
rs77178854 2 116,496,539 DPP10 C G 0.97 0.98 0.99 0.98 0.58 0.11 2.46×10⁻⁷
rs481121 1 37,203,485 GRIK1 A G 0.56 0.56 0.58 0.49 0.14 0.03 3.58×10⁻⁷
rs76615278 19 18,654,588 FKBP8 G A 0.84 0.83 0.82 * 0.20 0.04 6.34×10⁻⁷
rs1875872 17 31,795,716 ASIC2 A G 0.62 0.65 0.65 0.65 0.14 0.03 1.94×10⁻⁶
rs9512841 13 28,309,646 GSX1 G A 0.51 0.52 0.53 0.58 0.13 0.03 2.01×10− 6
rs191686630 5 58,477,398 PDE4D A T 0.11 0.16 0.21 * 0.19 0.04 2.36×10⁻⁶
rs3136797 8 42,226,805 POLB C G 0.98 0.99 0.98 0.99 0.57 0.12 2.68×10⁻⁶
rs499177 8 98,472,201 MTDH T C 0.46 0.57 0.45 0.44 0.13 0.03 4.66×10⁻⁶
rs58726672 10 8,407,822 GATA3 C T 0.98 0.98 0.98 0.98 0.57 0.13 4.77×10⁻⁶
Top SNPs were defined as the SNP with lowest P value within a 500 kb windowChr: chromosome; EAF: effect allele frequency; GnomAD EAF: effect allele frequency from Genome Aggregation Database; β: effect size; SE: standard error*variants without frequency information in Genome Aggregation Database
Fig. 3 a Manhattan plot of SNPs for PTH levels in the sex-stratified meta-analysis of three cohorts among females. The y axis shows the −log10 Pvalues of 7,411,206 SNPs, and the x axis shows their chromosomal positions. The blue line indicates threshold for suggestive hits (P = 5 × 10⁻⁵),and red line represents the threshold for genome-wide significance (P = 5 × 10⁻⁸). b Quantile-quantile plot in the sex-stratified meta-analysis ofthree cohorts among females. c Forest plot of rs77178854 effect estimates in individual populations and the combined meta-analysis among females
Matana et al. Molecular Medicine (2018) 24:15 Page 6 of 9

analysis of Robinson-Cohen et al. (Robinson-Cohen etal., 2017). Previously reported CYP24A1, RGS14 andCLDN14 variants associated with PTH level (Robin-son-Cohen et al., 2017) had the same directions of ef-fect in our study as originally reported but did notshow significant associations, probably due to limitedsample size of our study or specificity of isolated pop-ulations (Additional file 1: Table S3).The greatest strengths of our study include a com-
prehensive set of genetic variants examined and eth-nically homogeneous sample. We had sufficient datato confidently detect an association for the identifiedRASGEF1B locus, since our meta-analysis had 92%power to detect associated SNP with an effect size of0.19 and minor allele frequency of 0.45 at thegenome-wide level of significance. Furthermore, meta-analysis performed in females only had 86% power todetect DPP10 locus with an effect size of 0.82 andminor allele frequency of 0.02 at the genome-widelevel of significance. Meta-analysis performed in malesonly had 84% power to detect SNPs with an effectsize of 0.35 and minor allele frequency of 0.3 at thegenome-wide level of significance. The main limita-tion of our study is the modest sample size used inthe analysis, reducing statistical power for detectingadditional associations with smaller effect sizes orminor allele frequencies. Nevertheless, we have identi-fied novel, previously unsuspected and biologicalplausible associations with PTH variation. Furtherreplication analysis would be required to confirm ourfindings and to discover additional genetic variantsunderlying PTH levels in order to explain more ofthe variability in PTH variations.
ConclusionsIn summary, in a GWA meta-analysis of PTH levels weidentified a novel significant locus rs11099476 locatednear a guanine nucleotide exchange factor RASGEF1B.The finding appears to be consistent based on analysesof meta-GWAS across all three analyzed cohorts andmeta-GWAS across two isolated populations followedby replication analysis in the mainland cohort. Our workalso includes the first gender-specific GWAS performedto date and revealed significant association for an intronvariant rs77178854 located within the DPP10 gene inwomen, indicating the possibility that sex-specificity isunderlying PTH level. To conclude, findings from thisstudy improve the current knowledge of the genetic fac-tors regulating PTH levels and their validation in inde-pendent populations would be beneficial.
Additional file
Additional file 1: Supporting Information. (XLSX 54 kb)
AbbreviationsGWAS: genome-wide association study; PTH: Parathyroid hormone;RIA: radio-immunoassay method; SNP: single nucleotide polymorphism
AcknowledgmentsWe would like to thank all participants of this study and acknowledgeinvaluable support of the local teams in Zagreb and Split, especially that ofthe Institute for Anthropological Research, Zagreb, Croatia.
FundingThe Croatian Science Foundation funded this work under the project“Identification of new genetic loci implicated in regulation of thyroid andparathyroid function” (grant no. 1498).The “10 001 Dalmatians” project was funded by grants from the MedicalResearch Council (UK), European Commission Framework 6 project
Table 3 Associations of top single nucleotide polymorphisms(P < 5 × 10⁻⁶) with PTH concentrations among females
SNP Chr Position Nearest Gene Effect Allele Other Allele EAF Korcula EAF Vis EAFSplit
GnomAD EAF β SE P value
rs77178854 2 116,496,539 DPP10 C G 0.98 0.97 0.99 0.98 0.82 0.14 2.21×10⁻⁹
rs1890709 14 49,101,833 LINC00648 A G 0.38 0.30 0.33 0.31 0.20 0.04 7.12×10⁻⁸
rs16981087 20 19,739,954 SLC24A3 G C 0.80 0.78 0.77 0.81 0.22 0.04 6.99×10⁻⁷
rs661171 11 110,016,519 ZC3H12C G T 0.74 0.70 0.71 0.70 0.20 0.04 8.94×10⁻⁷
rs74629672 20 39,105,870 MAFB T A 0.95 0.94 0.94 0.96 0.43 0.09 1.68×10⁻⁶
rs1349573 14 41,403,160 LOC644919 G A 0.05 0.05 0.06 0.03 0.45 0.10 1.94×10⁻⁶
rs3866634 16 86,567,929 MTHFSD G A 0.93 0.92 0.93 0.91 0.32 0.07 2.14×10⁻⁶
rs7997888 13 102,759,325 FGF14 A G 0.04 0.04 0.04 0.15 0.49 0.10 2.19×10⁻⁶
rs5024438 15 33,077,401 FMN1 G A 0.72 0.70 0.79 * 0.23 0.05 2.76×10⁻⁶
rs77796218 11 44,580,581 CD82 C T 0.97 0.96 0.97 0.98 0.49 0.10 2.84×10⁻⁶
rs13406545 2 201,792,123 ORC2 T A 0.15 0.19 0.18 0.23 0.21 0.05 4.54×10⁻⁶
rs2588129 8 17,462,468 PDGFRL A G 0.04 0.02 0.02 0.11 0.54 0.12 4.57×10⁻⁶
Top SNPs were defined as the SNP with lowest P value within a 500 kb windowChr: chromosome; EAF: effect allele frequency; GnomAD EAF: effect allele frequency from Genome Aggregation Database; β: effect size; SE: standard error*variants without frequency information in Genome Aggregation Database
Matana et al. Molecular Medicine (2018) 24:15 Page 7 of 9

EUROSPAN (Contract No.LSHG-CT-2006-018947), the Republic of CroatiaMinistry of Science, Education and Sports research grant (216–1080315-0302),the Croatian Science Foundation (grant 8875), CEKOM (Ministry of Economy,Entrepreneurship and Crafts) and the Research Centre of Excellence inPersonalized Medicine (Ministry of Science and Education).
Availability of data and materialsThe datasets generated during the current study are available from thecorresponding author on reasonable request.
Authors’ contributionsTZ conceived the study idea; OP, CH, TZ, VBP, IK and MB formed the biobank“10 001 Dalmatians”; VT, DB and AP performed the measurements ofparathyroid hormones and verified the relevance of the results; TBperformed imputation of the data; AM, MP, IG researched the data; AMperformed the statistical analysis and drafted the manuscript; TZ, CH, MB, MP,IG, VBP and OP contributed to the discussion, review and editing of themanuscript; all authors approved the final version of the manuscript.
Ethics approval and consent to participateThe study was approved by the Research Ethics Committees in Croatia andScotland and all participants provided informed consent.
Competing interestsThe authors declare that they have no competing interests.
Publisher’s NoteSpringer Nature remains neutral with regard to jurisdictional claims inpublished maps and institutional affiliations.
Author details1Department of Medical Biology, University of Split, School of Medicine,Šoltanska 2, Split, Croatia. 2Department of Nuclear Medicine, UniversityHospital Split, Spinciceva 1, Split, Croatia. 3MRC Human Genetics Unit,University of Edinburgh, Western General Hospital, Crewe Road, Edinburgh,UK. 4Department of Public Health, University of Split, School of MedicineSplit, Šoltanska 2, Split, Croatia.
Received: 22 February 2018 Accepted: 2 April 2018
ReferencesAbate EG, Clarke BL. Review of hypoparathyroidism. Front Endocrinol. 2017;7Abrams SA, Griffin IJ, Hawthorne KM, Liang LL. Height and height Z-score are
related to calcium absorption in five- to fifteen-year-old girls. Journal ofClinical Endocrinology & Metabolism. 2005;90:5077–81.
Aigner E, Stadlmayr A, Huber-Schonauer U, Zwerina J, Husar-Memmer E,Niederseer D, Eder SK, Stickel F, Pirich C, Schett G, et al. Parathyroid hormoneis related to dysplasia and a higher rate of distal colorectal adenoma inwomen but not men. Hormones & Cancer. 2015;6:153–60.
Allen HL, Estrada K, Lettre G, Berndt SI, Weedon MN, Rivadeneira F, Willer CJ,Jackson AU, Vedantam S, Raychaudhuri S, et al. Hundreds of variantsclustered in genomic loci and biological pathways affect human height.Nature. 2010;467:832–8.
Allen M, Heinzmann A, Noguchi E, Abecasis G, Broxholme J, Ponting CP,Bhattacharyya S, Tinsley J, Zhang YM, Holt R, et al. Positional cloning of anovel gene influencing asthma from chromosome 2q14. Nat Genet. 2003;35:258–63.
Aulchenko YS, Ripke S, Isaacs A, Van Duijn CM. GenABEL: an R library forgenome-wide association analysis. Bioinformatics. 2007;23:1294–6.
Bezerra GA, Dobrovetsky E, Seitova A, Fedosyuk S, Dhe-Paganon S, Gruber K.Structure of human dipeptidyl peptidase 10 (DPPY): a modulator of neuronalKv4 channels. Sci Rep. 2015;5
Brent GA, Leboff MS, Seely EW, Conlin PR, Brown EM. Relationship between theconcentration and rate of change of calcium and serum intact parathyroid-hormone levels in normal humans. Journal of Clinical Endocrinology &Metabolism. 1988;67:944–50.
DeLuca HF. The metabolism and functions of vitamin D. Adv Exp Med Biol. 1986;196:361–75.
Di JH, Huang H, Qu DB, Tang JJ, Cao WJ, Lu Z, Cheng Q, Yang J, Bai J, Zhang YP,Zheng JN. Rap2B promotes proliferation, migration, and invasion of human
breast cancer through calcium-related ERK1/2 signaling pathway. Sci Rep.2015;5
Fraser WD. Hyperparathyroidism. Lancet. 2009;374:145–58.Gago EV, Cadarso-Suarez C, Perez-Fernandez R, Burgos RR, Mugica JD, Iglesias CS.
Association between vitamin D receptor Fokl polymorphism and serumparathyroid hormone level in patients with chronic renal failure. J EndocrinolInvestig. 2005;28:117–21.
He MA, Xu M, Zhang B, Liang J, Chen P, Lee JY, Johnson TA, Li HX, Yang XB, DaiJC, et al. Meta-analysis of genome-wide association studies of adult height ineast Asians identifies 17 novel loci. Hum Mol Genet. 2015;24:1791–800.
Hunter D, De Lange M, Snieder H, MacGregor AJ, Swaminathan R, Thakker RV,Spector TD. Genetic contribution to bone metabolism, calcium excretion,and vitamin D and parathyroid hormone regulation. J Bone Miner Res. 2001;16:371–8.
Khundmiri SJ, Murray RD, Lederer E. PTH and vitamin D. ComprehensivePhysiology. 2016;6:561–601.
Kiel DP, Demissie S, Dupuis J, Lunetta KL, Murabito JM, Karasik D. Genome-wideassociation with bone mass and geometry in the Framingham heart study.Bmc Medical Genetics. 2007;8
Kilav R, Silver J, Navehmany T. Parathyroid-hormone gene-expression inHypophosphatemic rats. J Clin Investig. 1995;96:327–33.
Kottgen A, Pattaro C, Boger CA, Fuchsberger C, Olden M, Glazer NL, Parsa A, GaoXY, Yang Q, Smith AV, et al. New loci associated with kidney function andchronic kidney disease. Nat Genet. 2010;42:376–U334.
Kumar R, Cahan DH, Madias NE, Harrington JT, Kurtin P, Dawsonhughes BF.Vitamin-D and calcium-transport. Kidney Int. 1991;40:1177–89.
Kumar R, Thompson JR. The regulation of parathyroid hormone secretion andsynthesis. J Am Soc Nephrol. 2011;22:216–24.
Lerosey I, Chardin P, Degunzburg J, Tavitian A. The product of the Rap2 gene,member of the Ras superfamily - biochemical-characterization and site-directed mutagenesis. J Biol Chem. 1991;266:4315–21.
Marchini J, Howie B, Myers S, McVean G, Donnelly P. A new multipoint methodfor genome-wide association studies by imputation of genotypes. Nat Genet.2007;39:906–13.
O'Seaghdha CM, Wu HS, Yang Q, Kapur K, Guessous I, Zuber AM, Kottgen A,Stoudmann C, Teumer A, Kutalik Z, et al. Meta-analysis of genome-wideassociation studies identifies six new loci for serum calcium concentrations.PLoS Genet. 2013;9
Paganini S, Guidetti GF, Catricala S, Trionfini P, Panelli S, Balduini C, Torti M.Identification and biochemical characterization of Rap2C, a new member ofthe rap family of small GTP-binding proteins. Biochimie. 2006;88:285–95.
Park HS, Yeo HY, Chang HJ, Kim KH, Park JW, Kim BC, Baek JY, Kim SY, Kim DY.Dipeptidyl peptidase 10, a novel prognostic marker in colorectal Cancer.Yonsei Med J. 2013;54:1362–9.
Pruim RJ, Welch RP, Sanna S, Teslovich TM, Chines PS, Gliedt TP, Boehnke M,Abecasis GR, Willer CJ. LocusZoom: regional visualization of genome-wideassociation scan results. Bioinformatics. 2010;26:2336–7.
R: A Language and Environment for Statistical Computing 2018 [http://www.R-project.org/].
Robinson-Cohen C, Lutsey PL, Kleber ME, Nielson CM, Mitchell BD, Bis JC, Eny KM,Portas L, Eriksson J, Lorentzon M, et al. Genetic variants associated withcirculating parathyroid hormone. J Am Soc Nephrol. 2017;28:1553–65.
Rudan I, Carothers AD, Polasek O, Hayward C, Vitart V, Biloglav Z, Kolcic I, Zgaga L,Ivankovic D, Vorko-Jovic A, et al. Quantifying the increase in average humanheterozygosity due to urbanisation. Eur J Hum Genet. 2008;16:1097–102.
Rudan I, Marusic A, Jankovic S, Rotim K, Boban M, Lauc G, Grkovic I, Dogas Z,Zemunik T, Vatavuk Z, et al. "10 001 Dalmatians:" Croatia launches itsNational Biobank. Croatian Medical Journal. 2009;50:4–6.
Serdar MA, Can BB, Kilercik M, Durer ZA, Aksungar FB, Serteser M, Coskun A,Ozpinar A, Unsal I. Analysis of changes in parathyroid hormone and 25 (oh)vitamin D levels with respect to age, gender and season: a data miningstudy. Journal of Medical Biochemistry. 2017;36:73–83.
Silver J, Levi R. Regulation of PTH synthesis and secretion relevant to themanagement of secondary hyperparathyroidism in chronic kidney disease.Kidney Int. 2005;67:S8–S12.
Sneve M, Emaus N, Joakimsen RM, Jorde R. The association between serumparathyroid hormone and bone mineral density, and the impact of smoking:the Tromso study. Eur J Endocrinol. 2008;158:401–9.
Struchalin MV, Amin N, Eilers PHC, van Duijn CM, Aulchenko YS. An R package"VariABEL" for genome-wide searching of potentially interacting loci bytesting genotypic variance heterogeneity. BMC Genet. 2012;13
Matana et al. Molecular Medicine (2018) 24:15 Page 8 of 9

Turner SD: qqman: an R package for visualizing GWAS results using Q-Q andmanhattan plots. biorXiv DOI: 101101/005165 2014.
Van Esch H, Groenen P, Nesbit MA, Schuffenhauer S, Lichtner P, Vanderlinden G,Harding B, Beetz R, Bilous RW, Holdaway I, et al. GATA3 haplo-insufficiencycauses human HDR syndrome. Nature. 2000;406:419–22.
Vitart V, Rudan I, Hayward C, Gray NK, Floyd J, Palmer CN, Knott SA, Kolcic I,Polasek O, Graessler J, et al. SLC2A9 is a newly identified urate transporterinfluencing serum urate concentration, urate excretion and gout. Nat Genet.2008;40:437–42.
Wei QS, Chen ZQ, Tan X, Su HR, Chen XX, He W, Deng WM. Relation of age, sexand bone mineral density to serum 25-Hydroxyvitamin D levels in Chinesewomen and men. Orthop Surg. 2015;7:343–9.
Gauderman WJ MJ: QUANTO 1.1: a computer program for power and samplesize calculations for genetic-epidemiology studies.: University of SouthernCalifornia; 2006.
Yaman E, Gasper R, Koerner C, Wittinghofer A, Tazebay UH. RasGEF1A andRasGEF1B are guanine nucleotide exchange factors that discriminatebetween rap GTP-binding proteins and mediate Rap2-specific nucleotideexchange. FEBS J. 2009;276:4607–16.
Matana et al. Molecular Medicine (2018) 24:15 Page 9 of 9
Contents lists available at ScienceDirect
Genomics
journal homepage: www.elsevier.com/locate/ygeno
Genome-wide meta-analysis identifies novel gender specific loci associatedwith thyroid antibodies level in Croatians
Antonela Matanaa,1, Marijana Popovića,1, Thibaud Boutinb, Vesela Torlakc, Dubravka Brdarc,Ivana Gunjačaa, Ivana Kolčićd, Vesna Boraska Pericaa, Ante Pundac, Ozren Polašekd,Caroline Haywardb, Maja Barbalića, Tatijana Zemunika,⁎
a Department of Medical Biology, University of Split, School of Medicine, Šoltanska 2, Split, CroatiabMRC Human Genetics Unit, University of Edinburgh, Western General Hospital, Crewe Road, Edinburgh, United Kingdomc Department of Nuclear Medicine, University Hospital Split, Spinciceva 1, Split, Croatiad Department of Public Health, University of Split, School of Medicine Split, Šoltanska 2, Split, Croatia
A R T I C L E I N F O
Keywords:Genome-wide association studyMeta-analysisThyroid antibodyThyroglobulinThyroid peroxidaseSingle nucleotide polymorphism
A B S T R A C T
Autoimmune thyroid diseases (AITD) are multifactorial endocrine diseases most frequently accompanied by Tgand TPO autoantibodies. Both antibodies have a higher prevalence in females and act under a strong geneticinfluence.
To identify novel variants underlying thyroid antibody levels, we performed GWAS meta-analysis on theplasma levels of TgAb and TPOAb in three Croatian cohorts, as well as gender specific GWAS and a bivariateanalysis.
No significant association was detected with the level of TgAb and TPOAb in the meta-analysis of GWAS orbivariate results for all individuals. The bivariate analysis in females only revealed a genome-wide significantassociation for the locus near GRIN3A (rs4457391, P=7.76× 10⁻⁹). The same locus had borderline associationwith TPOAb levels in females (rs1935377, P=8.58× 10⁻⁸).
In conclusion, we identified a novel gender specific locus associated with TgAb and TPOAb levels. Ourfindings provide a novel insight into genetic and gender differences associated with thyroid antibodies.
1. Introduction
Thyroglobulin (Tg) and thyroid peroxidase (TPO) are major com-ponents of the thyroid gland, both engaged in the production of thethyroid hormones [1]. Autoimmune thyroid diseases (AITD) are one ofthe most common autoimmune diseases, affecting 2–5% of the generalpopulation [2]. The presence of circulating autoantibodies with speci-ficity for Tg and TPO, might represent an early stage in the pathogen-esis of AITD [3]. Hashimoto thyroiditis (HT) and Graves' disease (GD)are autoimmune diseases in which the immune system turns against thethyroid gland. HT is characterised by destruction of thyroid gland andunderproduction of thyroid hormones (hypothyroidism), whereas an-tibody stimulation of thyroid gland in GD results in overproduction ofthyroid hormones (hyperthyroidism) [4,5]. The prevalence of TgAb andTPOAb positivity in the total and disease-free population is greater infemales and increases with age, especially among females [6,7]. Theprevalence of TgAb positivity is 60–80% in patients with HT and
30–60% in patients with GD. Positivity of TPOAb is detected in 90–95%patients with HT and 80% patients with GD [8].
Many genetic loci seem to be associated with multiple traits inhuman complex diseases and have the direct biological influence onmore than one phenotypic trait [9]. HT and GD have some unique loci,as well as some common to both diseases, indicating that there is ashared genetic susceptibility to HT and GD [10]. Since various auto-immune diseases often cluster within the same patient, identifying thebasis for this shared pathogenesis could be important not only for thefundamental understanding of AITD mechanisms but also in the un-derstanding of other associated diseases [11,12].
Thyroid antibodies are under the strong genetic influence.Autoimmune prevalence and clinical differences in thyroid function areknown to be gender-related [6,7,13,14]. According to a twin study, theestimate of genetic influence on serum TgAb concentrations is 39% inmales and 75% in females [15]. For serum TPOAb concentrations, theestimates are 61% in males and 72% in females [15].
https://doi.org/10.1016/j.ygeno.2018.04.012Received 24 November 2017; Received in revised form 28 February 2018; Accepted 16 April 2018
⁎ Corresponding author at: University of Split, School of Medicine, Šoltanska 2, Split, Croatia.
1 Authors equally contributed to the paper.E-mail address: [email protected] (T. Zemunik).
Genomics xxx (xxxx) xxx–xxx
0888-7543/ © 2018 Elsevier Inc. All rights reserved.
Please cite this article as: Matana, A., Genomics (2018), https://doi.org/10.1016/j.ygeno.2018.04.012
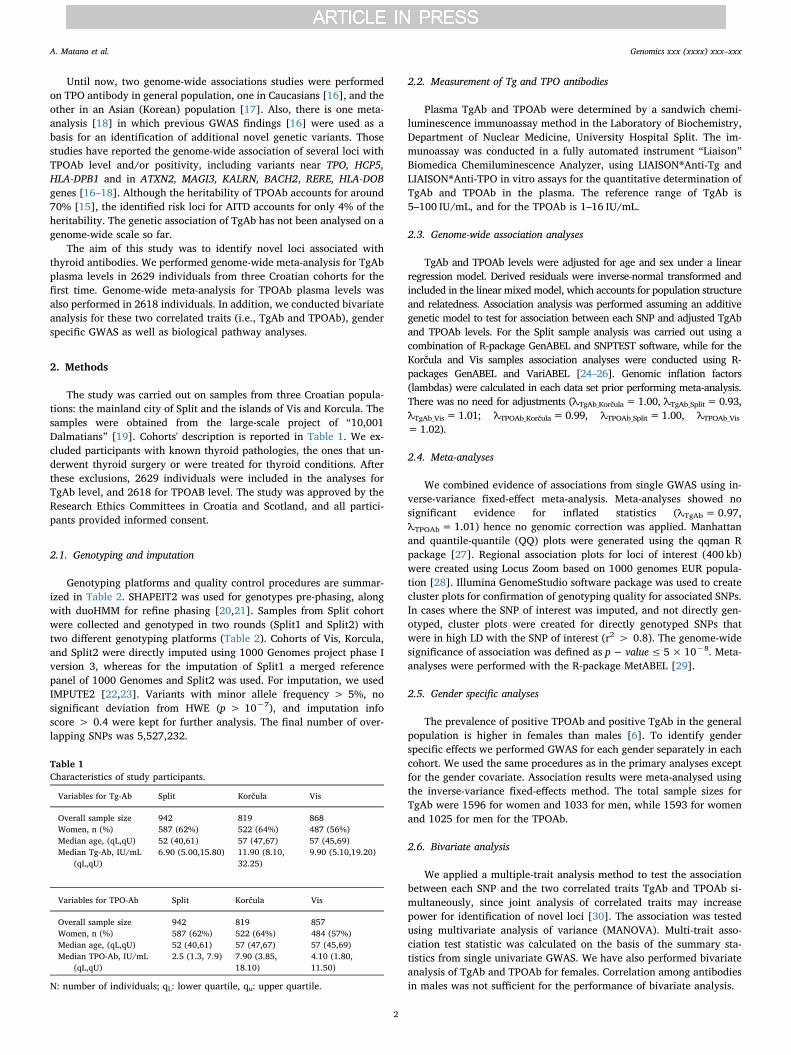
Until now, two genome-wide associations studies were performedon TPO antibody in general population, one in Caucasians [16], and theother in an Asian (Korean) population [17]. Also, there is one meta-analysis [18] in which previous GWAS findings [16] were used as abasis for an identification of additional novel genetic variants. Thosestudies have reported the genome-wide association of several loci withTPOAb level and/or positivity, including variants near TPO, HCP5,HLA-DPB1 and in ATXN2, MAGI3, KALRN, BACH2, RERE, HLA-DOBgenes [16–18]. Although the heritability of TPOAb accounts for around70% [15], the identified risk loci for AITD accounts for only 4% of theheritability. The genetic association of TgAb has not been analysed on agenome-wide scale so far.
The aim of this study was to identify novel loci associated withthyroid antibodies. We performed genome-wide meta-analysis for TgAbplasma levels in 2629 individuals from three Croatian cohorts for thefirst time. Genome-wide meta-analysis for TPOAb plasma levels wasalso performed in 2618 individuals. In addition, we conducted bivariateanalysis for these two correlated traits (i.e., TgAb and TPOAb), genderspecific GWAS as well as biological pathway analyses.
2. Methods
The study was carried out on samples from three Croatian popula-tions: the mainland city of Split and the islands of Vis and Korcula. Thesamples were obtained from the large-scale project of “10,001Dalmatians” [19]. Cohorts' description is reported in Table 1. We ex-cluded participants with known thyroid pathologies, the ones that un-derwent thyroid surgery or were treated for thyroid conditions. Afterthese exclusions, 2629 individuals were included in the analyses forTgAb level, and 2618 for TPOAB level. The study was approved by theResearch Ethics Committees in Croatia and Scotland, and all partici-pants provided informed consent.
2.1. Genotyping and imputation
Genotyping platforms and quality control procedures are summar-ized in Table 2. SHAPEIT2 was used for genotypes pre-phasing, alongwith duoHMM for refine phasing [20,21]. Samples from Split cohortwere collected and genotyped in two rounds (Split1 and Split2) withtwo different genotyping platforms (Table 2). Cohorts of Vis, Korcula,and Split2 were directly imputed using 1000 Genomes project phase Iversion 3, whereas for the imputation of Split1 a merged referencepanel of 1000 Genomes and Split2 was used. For imputation, we usedIMPUTE2 [22,23]. Variants with minor allele frequency > 5%, nosignificant deviation from HWE (p > 10−7), and imputation infoscore > 0.4 were kept for further analysis. The final number of over-lapping SNPs was 5,527,232.
2.2. Measurement of Tg and TPO antibodies
Plasma TgAb and TPOAb were determined by a sandwich chemi-luminescence immunoassay method in the Laboratory of Biochemistry,Department of Nuclear Medicine, University Hospital Split. The im-munoassay was conducted in a fully automated instrument “Liaison”Biomedica Chemiluminescence Analyzer, using LIAISON®Anti-Tg andLIAISON®Anti-TPO in vitro assays for the quantitative determination ofTgAb and TPOAb in the plasma. The reference range of TgAb is5–100 IU/mL, and for the TPOAb is 1–16 IU/mL.
2.3. Genome-wide association analyses
TgAb and TPOAb levels were adjusted for age and sex under a linearregression model. Derived residuals were inverse-normal transformed andincluded in the linear mixed model, which accounts for population structureand relatedness. Association analysis was performed assuming an additivegenetic model to test for association between each SNP and adjusted TgAband TPOAb levels. For the Split sample analysis was carried out using acombination of R-package GenABEL and SNPTEST software, while for theKorčula and Vis samples association analyses were conducted using R-packages GenABEL and VariABEL [24–26]. Genomic inflation factors(lambdas) were calculated in each data set prior performing meta-analysis.There was no need for adjustments (λTgAb_Korčula=1.00, λTgAb_Split=0.93,λTgAb_Vis=1.01; λTPOAb_Korčula=0.99, λTPOAb_Split=1.00, λTPOAb_Vis
=1.02).
2.4. Meta-analyses
We combined evidence of associations from single GWAS using in-verse-variance fixed-effect meta-analysis. Meta-analyses showed nosignificant evidence for inflated statistics (λTgAb= 0.97,λTPOAb= 1.01) hence no genomic correction was applied. Manhattanand quantile-quantile (QQ) plots were generated using the qqman Rpackage [27]. Regional association plots for loci of interest (400 kb)were created using Locus Zoom based on 1000 genomes EUR popula-tion [28]. Illumina GenomeStudio software package was used to createcluster plots for confirmation of genotyping quality for associated SNPs.In cases where the SNP of interest was imputed, and not directly gen-otyped, cluster plots were created for directly genotyped SNPs thatwere in high LD with the SNP of interest (r2 > 0.8). The genome-widesignificance of association was defined as p− value≤ 5×10⁻⁸. Meta-analyses were performed with the R-package MetABEL [29].
2.5. Gender specific analyses
The prevalence of positive TPOAb and positive TgAb in the generalpopulation is higher in females than males [6]. To identify genderspecific effects we performed GWAS for each gender separately in eachcohort. We used the same procedures as in the primary analyses exceptfor the gender covariate. Association results were meta-analysed usingthe inverse-variance fixed-effects method. The total sample sizes forTgAb were 1596 for women and 1033 for men, while 1593 for womenand 1025 for men for the TPOAb.
2.6. Bivariate analysis
We applied a multiple-trait analysis method to test the associationbetween each SNP and the two correlated traits TgAb and TPOAb si-multaneously, since joint analysis of correlated traits may increasepower for identification of novel loci [30]. The association was testedusing multivariate analysis of variance (MANOVA). Multi-trait asso-ciation test statistic was calculated on the basis of the summary sta-tistics from single univariate GWAS. We have also performed bivariateanalysis of TgAb and TPOAb for females. Correlation among antibodiesin males was not sufficient for the performance of bivariate analysis.
Table 1Characteristics of study participants.
Variables for Tg-Ab Split Korčula Vis
Overall sample size 942 819 868Women, n (%) 587 (62%) 522 (64%) 487 (56%)Median age, (qL,qU) 52 (40,61) 57 (47,67) 57 (45,69)Median Tg-Ab, IU/mL
(qL,qU)6.90 (5.00,15.80) 11.90 (8.10,
32.25)9.90 (5.10,19.20)
Variables for TPO-Ab Split Korčula Vis
Overall sample size 942 819 857Women, n (%) 587 (62%) 522 (64%) 484 (57%)Median age, (qL,qU) 52 (40,61) 57 (47,67) 57 (45,69)Median TPO-Ab, IU/mL
(qL,qU)2.5 (1.3, 7.9) 7.90 (3.85,
18.10)4.10 (1.80,11.50)
N: number of individuals; qL: lower quartile, qu: upper quartile.
A. Matana et al. Genomics xxx (xxxx) xxx–xxx
2

2.7. Pathway analysis
Pathway analysis was performed with ConsensusPathDB (http://cpdb.molgen.mpg.de) [31,32]. For each of the loci with P < 5x10⁻⁶,downstream genes in± 500 kb window were extracted and used as theinput for analysis. The significance of results was defined as aP < 0.01. The same analysis was performed separately for males andfemales.
3. Results
3.1. Meta-analyses
Suggestive associations from genome-wide meta-analyses of TgAband TPOAb levels are shown in Supplementary Tables 1 and 2. We didnot find any significant association in the meta-analysis for TgAb orTPOAb level. The Manhattan and Quantile-quantile plots for both traitsare shown in Supplementary Figs. 1 and 2.
Genome-wide meta-analysis of TgAb levels in females revealed aborderline significant association with rs4710782 genetic variant. SNPis located near protein coding gene DLL1 (Table 3, Figs. 1 and 2).
The rs1935377 locus had borderline significance in females for as-sociation with TPOAb (reference allele C, P=8.58×10⁻⁸) (Table 3,Figs. 1 and 2). The SNP is located near protein coding gene GRIN3A.
Top findings from bivariate genome-wide meta-analyses are shownin Supplementary Fig. 3 and Supplementary Table 3. The bivariateanalysis in females revealed a genome-wide significant rs4457391 locusnear GRIN3A gene (reference allele G, P=7.76× 10⁻⁹) (Table 3,Figs. 1 and 2).
3.2. Pathway analysis
No enrichment was obtained in general population for neither TgAbnor TPOAb. Results of pathway analyses performed for each gender
separately are shown in the Supplementary Tables 4 and 5.For females, there were ten significantly enriched pathways at the
P < 0.01 for TgAb level, while only one pathway was enriched for thelevel of TPOAb. For males, the enrichment for TgAb level was obtainedfor twenty-nine significant pathways at the P < 0.01, while twopathways were enriched for the level of TPOAb (Supplementary Tables4 and 5).
3.3. Replication of previous GWA findings
We investigated variants that were previously associated with thelevel or/and positivity of TPOAb [16,18]. Nine loci were reported inprevious studies (TPO, ATXN2, MAGI3, KALRN, BACH2, RERE, HCP5,HLA-DOB, HLA-DPB1), however locus HLA-DOB could not be testedsince the SNPs or any surrogate (r2 > 0.5) were not available in ourdata. From eight reported variants that were available for the analysisin our data set, two were nominally replicated with P < 0.05, SNPrs11675434 for TPO gene (P=0.009) and SNP rs653178 in ATXN2gene (P=0.035). All other variants with available data for effect sizeswere similar in size and direction as in our study (SupplementaryTable 6).
4. Discussion
Our study confirms the gender specificity of genetic influences onserum thyroid antibody level. In females, a novel significantly asso-ciated locus near GRIN3A gene was identified in the bivariate analysisof TgAb and TPOAb, and the same locus showed borderline significancein association with TPOAb levels. Furthermore, we detected marginallysignificant locus associated with variation in TgAb levels in females(DLL1). Genetic variants affecting the TgAb level at a genome-widescale are analysed for the first time in this study.
The levels of TPOAb and TgAb are correlated and participate in theonset and diagnosis of AITD [33]. In our study, an intermediate
Table 2Genotyping methods and quality control procedures.
Cohorts Split1 (first 531 individualsfrom Split sample)
Split2 (other 481 individuals fromSplit sample)
Korcula Vis
Genome-wide genotyping N individuals 531 481 897 960Genotyping platformand SNP panel
Illumina HumanHap370CNV QUAD Phase 1
Illumina HumanOmniExpressExome8v1-2_A
Illumina HumanHap370CNV DUO Phase 1
Illumina HumanHap300v1 BeadChip
N SNPs 351514 969919 346034 317509Genotype-callingalgorithm
Illumina BeadStudio V3 Illumina BeadStudio V3 Illumina BeadStudio V3 Illumina BeadStudio V3
SNP QC (prior toimputation)
Call rate ≥98% per SNP ≥98% per SNP ≥98% per SNP ≥98% per SNPMAF ≥1% ≥1% ≥1% ≥1%HWE p < 10−7 p < 10−7 p < 10−7 p < 10−7
Sample QC (prior toimputation)
Call rate ≥97% ≥97% >97% >95%
MAF: minor allele frequency; HWE: Hardy-Weinberg equilibrium.
Table 3Associations between genetic variants and TgAb and TPOAb level.
SNP Chr. Position GRCh37.p13 Gene Region of the gene Minor allele MAF β SE P value
Bivariate analysisFemale
rs4457391 9 104760468 GRIN3A 260 kb downstream T 0.4 −0.027 0.005 7,76× 10⁻⁹
Tg-Ab levelsFemale
rs4710782 6 170582064 DLL1 9 kb upstream C 0.32 0.210 0.039 6,16× 10⁻⁸
TPO-Ab levelsFemale
rs1935377 9 104742291 GRIN3A 241 kb downstream T 0.37 −0.200 0.037 8,58× 10⁻⁸
SNP - single nucleotide polymorphism.Chr. - chromosome.MAF - minor allele frequency.β - effect size.SE - standard error.
A. Matana et al. Genomics xxx (xxxx) xxx–xxx
3
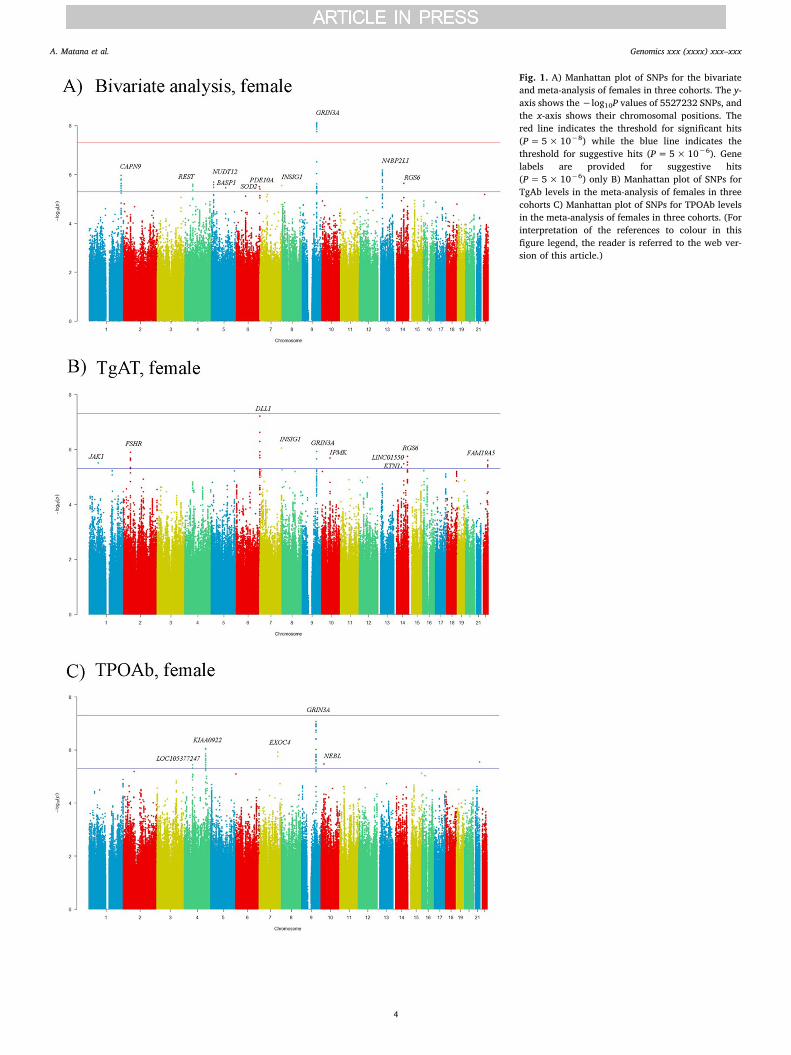
Fig. 1. A) Manhattan plot of SNPs for the bivariateand meta-analysis of females in three cohorts. The y-axis shows the−log10P values of 5527232 SNPs, andthe x-axis shows their chromosomal positions. Thered line indicates the threshold for significant hits(P=5×10⁻⁸) while the blue line indicates thethreshold for suggestive hits (P=5×10⁻⁶). Genelabels are provided for suggestive hits(P=5×10⁻⁶) only B) Manhattan plot of SNPs forTgAb levels in the meta-analysis of females in threecohorts C) Manhattan plot of SNPs for TPOAb levelsin the meta-analysis of females in three cohorts. (Forinterpretation of the references to colour in thisfigure legend, the reader is referred to the web ver-sion of this article.)
A. Matana et al. Genomics xxx (xxxx) xxx–xxx
4
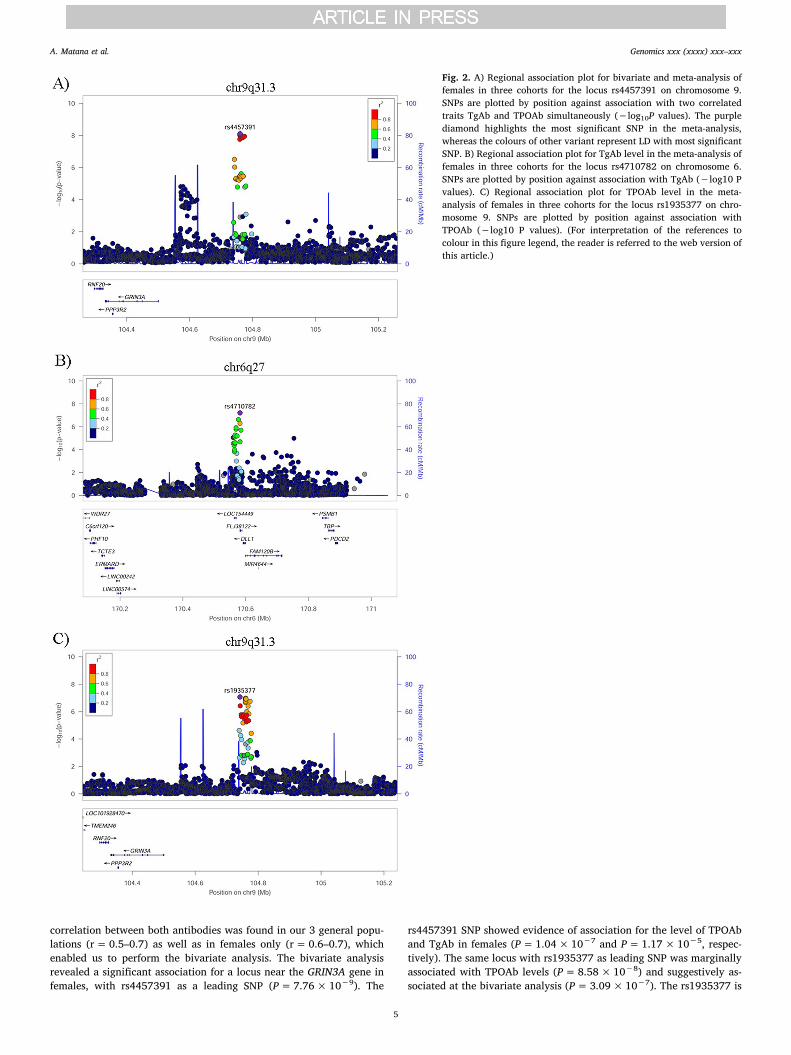
correlation between both antibodies was found in our 3 general popu-lations (r= 0.5–0.7) as well as in females only (r= 0.6–0.7), whichenabled us to perform the bivariate analysis. The bivariate analysisrevealed a significant association for a locus near the GRIN3A gene infemales, with rs4457391 as a leading SNP (P=7.76× 10⁻⁹). The
rs4457391 SNP showed evidence of association for the level of TPOAband TgAb in females (P=1.04×10⁻⁷ and P=1.17× 10⁻⁵, respec-tively). The same locus with rs1935377 as leading SNP was marginallyassociated with TPOAb levels (P=8.58×10⁻⁸) and suggestively as-sociated at the bivariate analysis (P=3.09×10⁻⁷). The rs1935377 is
Fig. 2. A) Regional association plot for bivariate and meta-analysis offemales in three cohorts for the locus rs4457391 on chromosome 9.SNPs are plotted by position against association with two correlatedtraits TgAb and TPOAb simultaneously (−log10P values). The purplediamond highlights the most significant SNP in the meta-analysis,whereas the colours of other variant represent LD with most significantSNP. B) Regional association plot for TgAb level in the meta-analysis offemales in three cohorts for the locus rs4710782 on chromosome 6.SNPs are plotted by position against association with TgAb (−log10 Pvalues). C) Regional association plot for TPOAb level in the meta-analysis of females in three cohorts for the locus rs1935377 on chro-mosome 9. SNPs are plotted by position against association withTPOAb (−log10 P values). (For interpretation of the references tocolour in this figure legend, the reader is referred to the web version ofthis article.)
A. Matana et al. Genomics xxx (xxxx) xxx–xxx
5
in moderate LD with rs4457391 (r2= 0.72, 1000Genomes phase3).Both these polymorphisms showed no association in men with p va-lues < 0.05, however effect sizes were in the same direction as in fe-males.
GRIN3A gene encodes a subunit of the N-methyl-D-aspartate(NMDA) receptors, which belongs to the superfamily of glutamate-regulated ion channels. GRIN3A gene is expressed in several tissues,mostly in brain, bone marrow, immune system, female and male tissue[34]. The GRIN3A gene is associated with the high-density lipoprotein(HDL) cholesterol levels and suggestively associated with the low-density lipoprotein (LDL) cholesterol and triglyceride levels [35]. De-creased levels of thyroid hormones in the liver have an effect on thebreakdown of circulating cholesterol, consequently, the higher level oftriglycerides, total and LDL cholesterol and lower level of HDL cho-lesterol are associated with hypothyroidism [36]. It is important toemphasize that Eriksson et al. found evidence of association of intronicvariant (rs9792648, 2.7× 10⁻⁵) in GRIN3A gene with the hypothyr-oidism [37]. A recent study by Joehanes et al. showed that SNPs as-sociated with GRIN3A have the trans-eQTL effect, thus may act onphenotypes by affecting the expression of distant genes [38]. For distantaffected genes (ZNF782, LCE2B, TEKT5 and MORF4L2) from the study[38], polymorphisms with evidence of association with the level ofhypothyroidism, LDL, HDL and total cholesterol, as well as with adi-ponectin level were found [37,39–42]. For polymorphisms in ZNF782gene evidence of genome-wide association with hypothyroidism(P=10−5), as well as with LDL and total cholesterol level(P=10−2–10−3) were detected.
Genes underlying AITD can be divided into thyroid-specific genesand immunoregulatory genes [14]. GD and HT, although clinicallyantithetical, share number of immunological features including thyroidlymphocytic infiltration and autoreactivity against the key thyroid au-toantigens [43]. Different genes and mechanisms seem to be implicatedin autoimmune prevalence in men and woman [13,14].
Gender specific GWAS meta-analysis identified a novel locus asso-ciated with TgAb levels in females. Identified variant rs4710782(P=6×10⁻⁸) is located on chromosome 6, 9 kb upstream of theprotein coding gene DLL1. DLL1 is a human homolog of the Notch Deltaligand and a member of the delta/serrate/jagged family [44]. It plays arole in mediating cell fate decisions during lymphopoiesis. Notch ligandDelta-1 inhibits the differentiation of human hematopoietic progenitorsinto the B cell lineage, while promotes the emergence of cells with aphenotype of T cell/natural killer (NK) precursor [45]. Notch1 sig-naling plays a role in promoting maturation into both the CD4 and CD8T cell lineages [46]. CD4 T cells induce B cells in antibody productionboth in HD and GD, while CD8 T cells cause the death of thyrocytes inHT [8]. Variations near DLL1 gene are associated with type 1 diabetes(T1D) [47] and suggestively associated with systemic lupus er-ythematosus (SLE) [48]. T1D, as well as SLE, frequently occur withAITD within the same individuals [49,50].
In general population, bivariate analysis revealed some interesting,suggestive associations with PDE10A gene (rs611909,P=2.37×10⁻⁶), which was previously associated with thyroid sti-mulating hormone (TSH) levels, as well as with the hypothyroidism[43]. Likewise, NFIA gene (rs17121639, P=2.97×10⁻⁶), previouslyassociated with the level of TSH [43], had the suggestive association inthe general population. These findings imply on the possibility ofshared genetic susceptibility for thyroid function and autoimmunity.
While there were no functionally enrichment pathways for generalpopulations, interesting findings were obtained for both antibodies ingender specific manner. Most of the enrichments were related withdifferent immune and inflammatory responses. The most interestingpathways enriched for TgAb levels in females were ProteasomeDegradation (Wikipathways), Notch, Hedgehog and GPCR signaling-Galpha i (INOH). For TPOAb levels in females, the pathway forNeutrophil degranulation (Reactome) was enriched. The most inter-esting pathway enriched for TgAb levels in males were Alpha9 beta1
integrin signaling events (PID) and Vitamin D Receptor Pathway(Wikipathways), while for the TPOAb Inflammatory mediator regula-tion of TRP channels (KEGG) and Vitamin D Receptor Pathway(Wikipathways).
Our study has helped in additional clarification of genetic variantsassociated with the TgAb and the TPOAb level. Thyroid autoimmunityis a consequence of the complex interaction of multiple genes andpathways, and possibly has different ethology depending on the gender.More GWA studies will be needed in the further enlightenment of thiscomplex trait.
There are several limitations in our study. We had a modest numberof participants for genome-wide association analyses, a larger studyshould be performed in order to replicate our findings and discovernovel associated loci. Also, our analysis was restricted to participants ofEuropean ancestry, thus further GWAS on populations of different an-cestry will be required. We did not perform additional functional stu-dies for identified variants to clarify biological mechanism behind ourfindings.
5. Conclusion
We identified gender specific genetic factors associated with thyroidautoimmunity. We detected significantly associated locus (GRIN3A) infemales with bivariate analysis, and likewise, the same locus wasmarginally associated in females with variation in TPOAb levels.Furthermore, we found a novel locus (DLL1) marginally associated withTgAb levels in females. Overall, our findings add to the knowledge ofshared genetic susceptibility affecting thyroid antibodies, as well as ofgenetic factors that differently affect thyroid autoimmunity in malesand females.
Acknowledgements
This work has been supported by Croatian Science Foundationunder the project 1498. The “10001 Dalmatians” project was funded bygrants from the Medical Research Council (UK), European CommissionFramework 6 project EUROSPAN (Contract No.LSHG-CT-2006-018947), the Republic of Croatia Ministry of Science, Education andSports research grant (216-1080315-0302), the Croatian ScienceFoundation (grant 8875), CEKOM (Ministry of Economy,Entrepreneurship and Crafts) and the Research Centre of Excellence inPersonalized Medicine (Ministry of Science and Education). We wouldlike to thank all participants of this study and acknowledge invaluablesupport of the local teams in Zagreb and Split, especially that of theInstitute for Anthropological Research, Zagreb, Croatia.
Conflict of interest
The authors declare no conflict of interest.
Appendix A. Supplementary data
Supplementary data to this article can be found online at https://doi.org/10.1016/j.ygeno.2018.04.012.
References
[1] J. Ruf, U. Feldt-Rasmussen, L. Hegedus, M. Ferrand, P. Carayon, Bispecific thyr-oglobulin and thyroperoxidase autoantibodies in patients with various thyroid andautoimmune diseases, J. Clin. Endocrinol. Metab. 79 (5) (1994) 1404–1409 (Epub1994/11/01).
[2] M.J. Simmonds, S.C. Gough, Unravelling the genetic complexity of autoimmunethyroid disease: HLA, CTLA-4 and beyond, Clin. Exp. Immunol. 136 (1) (2004) 1–10(Epub 2004/03/20).
[3] A.P. Weetman, Determinants of autoimmune thyroid disease, Nat. Immunol. 2 (9)(2001 Sep) 769–770.
[4] Y. Hiromatsu, H. Satoh, N. Amino, Hashimoto's thyroiditis: history and futureoutlook, Hormones (Athens, Greece) 12 (1) (2013) 12–18 (Epub 2012/01/01).
A. Matana et al. Genomics xxx (xxxx) xxx–xxx
6

[5] F. Menconi, C. Marcocci, M. Marinò, Diagnosis and classification of Graves' disease,Autoimmun. Rev. 13 (4) (2014) 398–402.
[6] J.G. Hollowell, N.W. Staehling, W.D. Flanders, W.H. Hannon, E.W. Gunter,C.A. Spencer, et al., Serum TSH, T(4), and thyroid antibodies in the United Statespopulation (1988 to 1994): National Health and Nutrition Examination Survey(NHANES III), J. Clin. Endocrinol. Metab. 87 (2) (2002) 489–499 (Epub 2002/02/12).
[7] A. McGrogan, H.E. Seaman, J.W. Wright, C.S. de Vries, The incidence of auto-immune thyroid disease: a systematic review of the literature, Clin. Endocrinol. 69(5) (2008) 687–696 (Epub 2008/08/05).
[8] E. Fröhlich, R. Wahl, Thyroid autoimmunity: role of anti-thyroid antibodies inthyroid and extra-thyroidal diseases, Front. Immunol. 8 (2017) 521.
[9] N. Solovieff, C. Cotsapas, P.H. Lee, S.M. Purcell, J.W. Smoller, Pleiotropy in com-plex traits: challenges and strategies, Nat. Rev. Genet. 14 (7) (2013) 483–495 (Epub2013/06/12).
[10] Y. Tomer, T.F. Davies, Searching for the autoimmune thyroid disease susceptibilitygenes: from gene mapping to gene function, Endocr. Rev. 24 (5) (2003) 694–717(Epub 2003/10/23).
[11] A.P. Weetman, Diseases associated with thyroid autoimmunity: explanations for theexpanding spectrum, Clin. Endocrinol. 74 (4) (2011) 411–418 (Epub 2010/08/20).
[12] E. Biro, Z. Szekanecz, L. Czirjak, K. Danko, E. Kiss, N.A. Szabo, et al., Association ofsystemic and thyroid autoimmune diseases, Clin. Rheumatol. 25 (2) (2006)240–245 (Epub 2005/10/26).
[13] S.T. Ngo, F.J. Steyn, P.A. McCombe, Gender differences in autoimmune disease,Front. Neuroendocrinol. 35 (3) (2014) 347–369.
[14] G. Effraimidis, W.M. Wiersinga, Mechanisms in endocrinology: autoimmunethyroid disease: old and new players, Eur. J. Endocrinol. 170 (6) (2014) R241–52(Epub 2014/03/13).
[15] P.S. Hansen, T.H. Brix, I. Iachine, K.O. Kyvik, L. Hegedus, The relative importanceof genetic and environmental effects for the early stages of thyroid autoimmunity: astudy of healthy Danish twins, Eur. J. Endocrinol. 154 (1) (2006) 29–38 (Epub2005/12/31).
[16] M. Medici, E. Porcu, G. Pistis, A. Teumer, S.J. Brown, R.A. Jensen, et al.,Identification of novel genetic loci associated with thyroid peroxidase antibodiesand clinical thyroid disease, PLoS Genet. 10 (2) (2014) e1004123(Epub 2014/03/04).
[17] S.H. Kwak, Y.J. Park, M.J. Go, K.E. Lee, S.J. Kim, H.S. Choi, et al., A genome-wideassociation study on thyroid function and anti-thyroid peroxidase antibodies inKoreans, Hum. Mol. Genet. 23 (16) (2014) 4433–4442 (Epub 2014/04/12).
[18] U.T. Schultheiss, A. Teumer, M. Medici, Y. Li, N. Daya, L. Chaker, et al., A geneticrisk score for thyroid peroxidase antibodies associates with clinical thyroid diseasein community-based populations, J. Clin. Endocrinol. Metab. 100 (5) (2015)E799–807 (Epub 2015/02/27).
[19] I. Rudan, A. Marušić, S. Janković, K. Rotim, M. Boban, G. Lauc, et al., “10001Dalmatians:” Croatia launches its National Biobank, Croat. Med. J. 50 (1)(2009) 4–6.
[20] O. Delaneau, J.-F. Zagury, J. Marchini, Improved whole-chromosome phasing fordisease and population genetic studies, Nat. Methods 10 (1) (2013) 5–6.
[21] J. O'Connell, D. Gurdasani, O. Delaneau, N. Pirastu, S. Ulivi, M. Cocca, et al., Ageneral approach for haplotype phasing across the full spectrum of relatedness,PLoS Genet. 10 (4) (2014) e1004234.
[22] C. Genomes Project, A. Auton, L.D. Brooks, R.M. Durbin, E.P. Garrison, H.M. Kang,et al., A global reference for human genetic variation, Nature 526 (7571) (2015)68–74 (Epub 2015/10/04).
[23] B. Howie, C. Fuchsberger, M. Stephens, J. Marchini, G.R. Abecasis, Fast and accu-rate genotype imputation in genome-wide association studies through pre-phasing,Nat. Genet. 44 (8) (2012) 955–959.
[24] M.V. Struchalin, N. Amin, P.H. Eilers, C.M. van Duijn, Y.S. Aulchenko, An Rpackage "VariABEL" for genome-wide searching of potentially interacting loci bytesting genotypic variance heterogeneity, BMC Genet. 13 (2012) 4 (Epub 2012/01/26).
[25] Y.S. Aulchenko, S. Ripke, A. Isaacs, C.M. van Duijn, GenABEL: an R library forgenome-wide association analysis, Bioinformatics (Oxford, England) 23 (10) (2007)1294–1296 (Epub 2007/03/27).
[26] J. Marchini, B. Howie, S. Myers, G. McVean, P. Donnelly, A new multipoint methodfor genome-wide association studies by imputation of genotypes, Nat. Genet. 39 (7)(2007) 906–913.
[27] S.D. Turner, qqman: an R package for visualizing GWAS results using Q-Q andmanhattan plots, BiorXiv (2014) (DOI:101101/005165).
[28] R.J. Pruim, R.P. Welch, S. Sanna, T.M. Teslovich, P.S. Chines, T.P. Gliedt, et al.,LocusZoom: regional visualization of genome-wide association scan results,Bioinformatics (Oxford, England) 26 (18) (2010) 2336–2337.
[29] RC T, R: A Language and Environment for Statistical Computing, R Foundation forStatistical Computing, 2013 Available from: http://www.R-project.org/.
[30] X. Shen, L. Klaric, S. Sharapov, M. Mangino, Z. Ning, D. Wu, et al., Multivariatediscovery and replication of five novel loci associated with Immunoglobulin G N-glycosylation, Nat. Commun. 8 (1) (2017) 017–00453.
[31] A. Kamburov, C. Wierling, H. Lehrach, R. Herwig, ConsensusPathDB—a databasefor integrating human functional interaction networks, Nucleic Acids Res. 37(Database issue) (2009) D623–8 (Epub 2008/10/23).
[32] R. Herwig, C. Hardt, M. Lienhard, A. Kamburov, Analyzing and interpreting genomedata at the network level with ConsensusPathDB, Nat. Protoc. 11 (10) (2016)1889–1907 (Epub 2016/09/09).
[33] M.W. Al-Rabia, Correlation of thyroid antibodies with TSH, T3 and T4 hormones inpatients diagnosed with autoimmune thyroid disorders, Pak. J. Pharm. Sci. 30(Suppl. 2) (2017) 607–612 (Epub 2017/06/27).
[34] Atlas THP, GRIN3A 2017 [Cited 2017 16.10.]; GRIN3A gene, Available from:https://www.proteinatlas.org/ENSG00000198785-GRIN3A/tissue.
[35] C.J. Willer, S. Sanna, A.U. Jackson, A. Scuteri, L.L. Bonnycastle, R. Clarke, et al.,Newly identified loci that influence lipid concentrations and risk of coronary arterydisease, Nat. Genet. 40 (2) (2008) 161–169.
[36] C.V. Rizos, M.S. Elisaf, E.N. Liberopoulos, Effects of thyroid dysfunction on lipidprofile, Open Cardiovasc. Med. J. 5 (2011) 76–84.
[37] N. Eriksson, J.Y. Tung, A.K. Kiefer, D.A. Hinds, U. Francke, J.L. Mountain, et al.,Novel associations for hypothyroidism include known autoimmune risk loci, PLoSOne 7 (4) (2012) 6.
[38] R. Joehanes, X. Zhang, T. Huan, C. Yao, S.-X. Ying, Q.T. Nguyen, et al., Integratedgenome-wide analysis of expression quantitative trait loci aids interpretation ofgenomic association studies, Genome Biol. 18 (2017) 16.
[39] M.J. Barber, L.M. Mangravite, C.L. Hyde, D.I. Chasman, J.D. Smith, C.A. McCarty,et al., Genome-wide association of lipid-lowering response to statins in combinedstudy populations, PLoS One 5 (3) (2010) e9763(Epub 2010/03/27).
[40] Diabetes Genetics Initiative of Broad Institute of H, Mit LU, Novartis Institutes ofBioMedical R, R. Saxena, B.F. Voight, V. Lyssenko, et al., Genome-wide associationanalysis identifies loci for type 2 diabetes and triglyceride levels, Science (NewYork, N.Y.) 316 (5829) (2007) 1331–1336 (Epub 2007/04/28).
[41] Z. Dastani, M.F. Hivert, N. Timpson, J.R. Perry, X. Yuan, R.A. Scott, et al., Novel locifor adiponectin levels and their influence on type 2 diabetes and metabolic traits: amulti-ethnic meta-analysis of 45,891 individuals, PLoS Genet. 8 (3) (2012)e1002607(Epub 2012/04/06).
[42] T.M. Teslovich, K. Musunuru, A.V. Smith, A.C. Edmondson, I.M. Stylianou,M. Koseki, et al., Biological, clinical and population relevance of 95 loci for bloodlipids, Nature 466 (7307) (2010) 707–713 (Epub 2010/08/06).
[43] O.J. Brand, J.C. Barrett, M.J. Simmonds, P.R. Newby, C.J. McCabe, C.K. Bruce,et al., Association of the thyroid stimulating hormone receptor gene (TSHR) withGraves' disease, Hum. Mol. Genet. 18 (9) (2009) 1704–1713 (Epub 2009/02/27).
[44] K. Shimizu, S. Chiba, T. Saito, K. Kumano, H. Hirai, Physical interaction of delta1,jagged1, and jagged2 with notch1 and notch3 receptors, Biochem. Biophys. Res.Commun. 276 (1) (2000) 385–389 (Epub 2000/09/28).
[45] A.C. Jaleco, H. Neves, E. Hooijberg, P. Gameiro, N. Clode, M. Haury, et al.,Differential effects of notch ligands Delta-1 and Jagged-1 in human lymphoid dif-ferentiation, J. Exp. Med. 194 (7) (2001) 991–1002 (Epub 2001/10/03).
[46] M.L. Deftos, E. Huang, E.W. Ojala, K.A. Forbush, M.J. Bevan, Notch1 signalingpromotes the maturation of CD4 and CD8 SP thymocytes, Immunity 13 (1) (2000)73–84.
[47] J.P. Bradfield, H.Q. Qu, K. Wang, H. Zhang, P.M. Sleiman, C.E. Kim, et al., Agenome-wide meta-analysis of six type 1 diabetes cohorts identifies multiple asso-ciated loci, PLoS Genet. 7 (9) (2011) e1002293(Epub 2011/10/08).
[48] S.N. Kariuki, Y. Ghodke-Puranik, J.M. Dorschner, B.S. Chrabot, J.A. Kelly,B.P. Tsao, et al., Genetic analysis of the pathogenic molecular sub-phenotype in-terferon alpha identifies multiple novel loci involved in systemic lupus er-ythematosus, Genes Immun. 16 (1) (2015) 15–23.
[49] C.B. Shun, K.C. Donaghue, H. Phelan, S.M. Twigg, M.E. Craig, Thyroid auto-immunity in type 1 diabetes: systematic review and meta-analysis, Diabet. Med. 31(2) (2014) 126–135 (Epub 2013/10/10).
[50] S. Appenzeller, A.T. Pallone, R.A. Natalin, L.T. Costallat, Prevalence of thyroiddysfunction in systemic lupus erythematosus, J. Clin. Rheumatol. 15 (3) (2009)117–119 (Epub 2009/03/21).
A. Matana et al. Genomics xxx (xxxx) xxx–xxx
7

Nutrients 2017, 9, 1186; doi:10.3390/nu9111186 www.mdpi.com/journal/nutrients
Article
Dietary Factors Associated with Plasma Thyroid Peroxidase and Thyroglobulin Antibodies Antonela Matana 1, Vesela Torlak 2, Dubravka Brdar 2, Marijana Popović 1, Bernarda Lozić 3, Maja Barbalić 1, Vesna Boraska Perica 1, Ante Punda 2, Ozren Polašek 4, Caroline Hayward 5 and Tatijana Zemunik 1,*
1 Department of Medical Biology, School of Medicine Split, University of Split, Šoltanska 2, 21000 Split, Croatia; [email protected] (A.M.); [email protected] (M.P.); [email protected] (M.B.); [email protected] (V.B.P.)
2 Department of Nuclear Medicine, University Hospital Split, Spinciceva 1, 21000 Split, Croatia; [email protected] (V.T.); [email protected] (D.B.); [email protected] (A.P.)
3 Department of Pediatrics, University Hospital Split, Spinciceva 1, 21000 Split, Croatia; [email protected] 4 Department of Public Health, School of Medicine Split, University of Split, Šoltanska 2 , 21000 Split, Croatia;
[email protected] 5 MRC Human Genetics Unit, University of Edinburgh, Western General Hospital, Crewe Road, EH4 2XU
Edinburgh, UK; [email protected] * Correspondence: [email protected]; Tel.: +385-21-557-888
Received: 12 October 2017; Accepted: 25 October 2017; Published: 28 October 2017
Abstract: The knowledge about dietary habits and their influence in the development of autoimmune thyroid disease is insufficient. The aim of this study was to analyse the association of dietary factors and plasma thyroid peroxidase antibodies (TPO-Ab) and/or thyroglobulin antibodies (Tg-Ab). The study enrolled 1887 participants originating from the South Croatia. Participants with elevated plasma TPO-Ab and/or Tg-Ab were defined as cases (n = 462) and those with TPO-Ab and/or Tg-Ab within referent values were defined as controls (n = 1425). Dietary intake was evaluated according to a food frequency questionnaire containing 58 food items. Principal component analysis was used to group food items into dietary groups. We used logistic regression analysis to examine dietary groups associated with positive plasma TPO-Ab and/or Tg-Ab. The results indicate that the dietary group with frequent consumption of animal fats and butter is associated with positive plasma TPO-Ab and/or Tg-Ab (p = 0.01). The dietary group with frequent consumption of vegetables as well as the dietary group with high consumption of dried fruit, nuts, and muesli are associated with negative findings of TPO-Ab and/or Tg-Ab (p = 0.048 and p = 0.02, respectively). We showed that the anti-inflammatory dietary groups are associated with the negative findings of plasma TPO-Ab and/or Tg-Ab.
Keywords: autoimmune thyroid diseases; thyroid peroxidase antibodies; thyroglobulin antibodies; dietary habits
1. Introduction
Thyroid disorders are, beside diabetes mellitus, the most frequent disorders affecting endocrine systems. Autoimmune thyroid diseases (AITD) such as Hashimoto disease and Graves disease are characterised by an autoimmune reaction against thyroid autoantigens [1]. One of the first findings of AITD is positive serum thyroid peroxidase antibody (TPO-Ab) [2]. Genetic background significantly contributes to the development of autoimmune thyroid diseases (70 to 80%), but their occurrences are also associated with different environmental factors (20 to 30%) [1].
It has been shown that increased occurrence of thyroid autoantibodies is the result of iodine sufficiency or excessive iodine intake [3–5].
Nutrients 2017, 9, 1186 2 of 8
Among other environmental factors, smoking was associated with increased risk for Graves disease (GD) but not with Hashimoto thyroiditis (HT), while moderate alcohol consumption had a protective role in the development of GD and HT [1,3]. Low selenium intake and low serum vitamin D levels were shown to be associated with higher risk of AITD, but the data is still inconclusive [1,3]. Stress could be a risk factor for GD, but has not been studied enough for HT [1,3]. A lower incidence of GD was linked to estrogen intake [1]. Infection with Yersinia enterocolitica was shown to be associated with GD, while enterovirus infection was associated with HT [1,3]. Molecular mimicry is a possible mechanism for pathogen association with infections and immune response. Recent studies based on bioinformatics data support the triggering role of several bacterial and viruses in the onset of AITD [6]. The intake of different drugs was related with GD and HT [1,3].
However, there are no comprehensive studies investigating dietary habits and their influence on AITD to date. Only two studies analysed the prevalence of self-reported hypothyroidism and hyperthyroidism in relation to dietary habits, and found a protective effect of vegan diet from hypothyroidism, and both vegan and vegetarian diets from hyperthyroidism [7,8].
In the current study, we evaluated the association of dietary factors and plasma thyroid antibodies. The goal of the study was to identify groups of food items that are associated with positive or negative findings of plasma TPO-Ab and/or Tg-Ab.
2. Materials and Methods
This case-control study was performed using the data collected through the “10,001 Dalmatians” project [9,10]. The project provided comprehensive data about the dietary habits of participants, as well as stored plasma samples that were used for biochemical measurements in this study. We included 1887 participants originating from the Dalmatian region of South Croatia (921 from the island of Korcula and 966 from the city of Split). The participants were adult volunteers from the general population (over 18 years of age). A written informed consent was obtained from participants and the study protocol was approved by the Ethical board of the University of Split, School of Medicine (No: 2181-198-03-04-14-0031).
Participants were allocated in either group based on thyroid antibodies status; subjects were considered as cases if their level of TPO-Ab and/or TgAb were higher than referent values (TPO-Ab > 16 IU/mL and Tg-Ab > 100 IU/mL), while those with negative findings (within referent values) of TPO-Ab and Tg-Ab were determined as controls. Controls who were taking thyroid medication (n = 27) or who had undergone thyroid surgery (n = 10) were excluded from the analysis. Finally, a total of 462 cases and 1388 controls were included in the study. Out of 462 cases, five had other autoimmune diseases: four had psoriasis, and one had psoriatic arthritis. In the control group, one out of 1388 participants had systemic lupus erythematosus.
Plasma TPO-Ab and Tg-Ab were determined by the sandwich chemiluminescence immunoassay method in the Laboratory of Biochemistry, Department of Nuclear Medicine, University Hospital Split (Split, Croatia). The immunoassay was conducted in a fully automated instrument “Liaison” Biomedica Chemiluminescence Analyser (DiaSorin, Saluggia, Italy) using in vitro assays for the quantitative determination of TPO-Ab and Tg-Ab in the plasma.
Dietary intake was assessed with a food frequency questionnaire (FFQ) that consisted of 54 foods and beverages. The frequency of food intake was measured using five categories: every day, 2–3 times a week, once a week, occasionally, and never. Additionally, there were four questions regarding the frequency of fat consumption with three possible answers (always, sometimes, never). For analysis, frequency categories for each food item were converted into an equivalent weekly intake as follows: every day (converted to 7 times a week), 2–3 times a week (2.5), once a week (1), occasionally (0.5—once in two weeks), and never (0). Responses on the frequency of fat consumption were also converted to an equivalent weekly intake as follows: always (7 times a week), sometimes (2.5 times a week), and never (0 times a week).
The data are presented as the mean ± standard deviation (SD) for continuous variables and as frequencies (percentages) for categorical variables in Table 1. The χ2 test was used to assess the differences between groups for categorical variables, and the t-test was used for numerical variables.

Nutrients 2017, 9, 1186 3 of 8
Principal Component Analysis (PCA) was used to identify underlying patterns of food consumption to reduce the list of 58 food items to key dietary groups (factors), such that the foods in each dietary group tend to be consumed equally often. The factors were rotated by orthogonal transformation (varimax rotation) to obtain a more interpretable structure. Propriety of using factor analysis was tested by the Kaiser-Meyer-Olkin measure of sampling adequacy and Bartlett’s test of sphericity. Factors with an eigenvalue greater than 1.0 were retained. A food item was considered to load on a given factor if the absolute factor loading value was >0.3 for that factor and ≤0.3 for all other factors. The factor loading of a food item increases as the contribution to the corresponding dietary group increases. Each factor contains a distinct set of food items. Factor-specific scores were calculated using the regression method and assigned to each participant. Odds ratio (OR) and 95% confidence intervals (CI) were calculated by multiple logistic regression to examine factors associated with positive plasma TPO-Ab and/or Tg-Ab, i.e., between cases and controls. The logistic regression model included gender and dietary factors. p-values of less than 0.05 were considered as statistically significant. Statistical analysis was conducted using Statistical Package Software for Social Science, version 16 (SPSS Inc., Chicago, IL, USA).
3. Results
A total of 462 cases and 1388 healthy individuals were enrolled in this study. The characteristics of study participants are shown in Table 1. A significantly higher number of women had positive TPO-Ab and/or Tg-Ab, while there was no statistically significant difference in age and body mass index (BMI) between cases and controls (Table 1).
Table 1. Differences between cases and controls in sociodemographic characteristics.
Variable Cases Controls p Value Gender <0.001 a
Males 119 (25.8%) 584 (42%) Females 343 (74.2%) 804 (58%)
Age (year) 53.66 ± 13.65 52.72 ± 14.93 0.45 b
BMI 27.78 ± 7.29 27.95 ± 7.79 0.67 b
BMI: Body mass index. a χ2 test, b t-test.
Suitability of the respondent data for factor analysis was supported by the Kaiser-Meyer-Olkin measure of sampling adequacy (0.77) and Bartlett’s test of sphericity (p < 0.001). Factor analysis revealed 19 dietary factors, which explained 54.76% of the total variance in food intake. The factors were generally in accordance with conventional dietary groups. Loading values for factors are presented in Table 2.
Logistic regression analysis revealed that the dietary group with high loadings for root vegetables, flower vegetables, leafy vegetables, fruity vegetables, and legumes was negatively associated with the plasma TPO-Ab and/or Tg-Ab (OR = 0.88, 95% CI 0.78–0.99, p = 0.048). The dietary group with high loadings for dried fruit, nuts, and muesli was also negatively associated (OR = 0.86, 95% CI 0.76–0.98, p = 0.02), while the dietary group with high loadings for butter and animal fats was positively associated with plasma TPO-Ab and/or Tg-Ab (OR = 1.16, 95% CI 1.03–1.30, p = 0.01). Other dietary groups showed no association with plasma TPO-Ab and/or Tg-Ab. Results from the logistic regression analysis are shown in Figure 1.
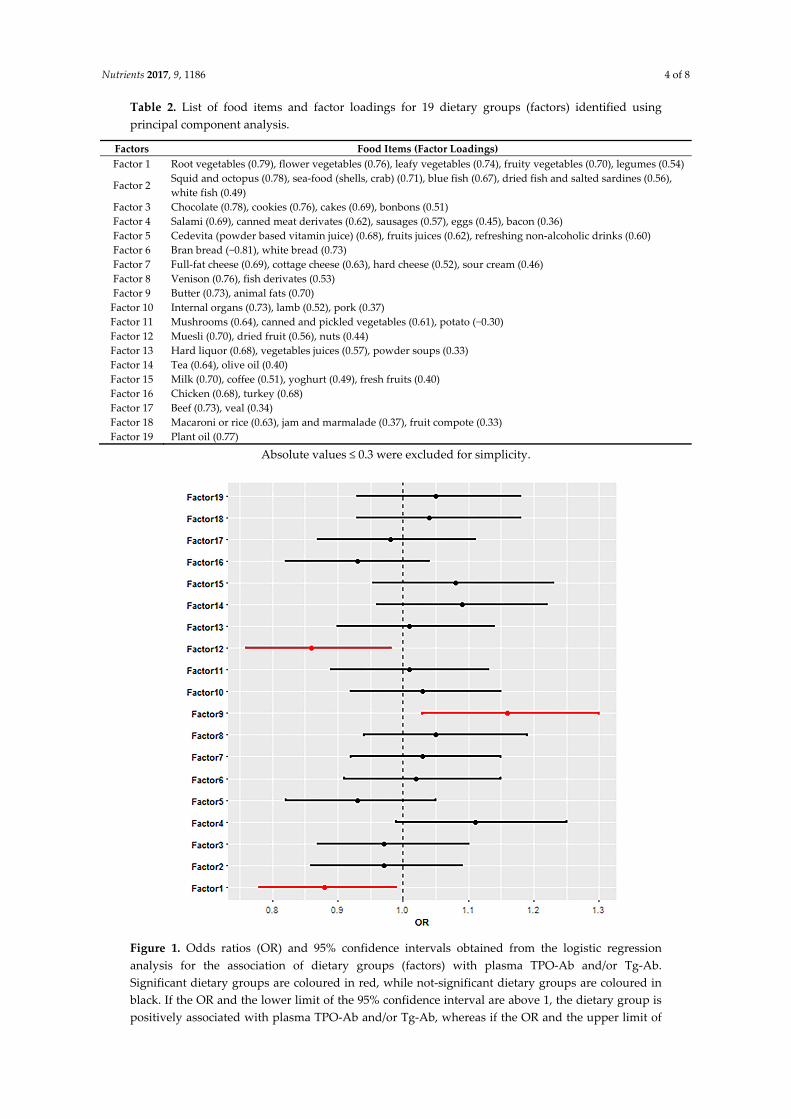
Nutrients 2017, 9, 1186 4 of 8
Table 2. List of food items and factor loadings for 19 dietary groups (factors) identified using principal component analysis.
Factors Food Items (Factor Loadings)Factor 1 Root vegetables (0.79), flower vegetables (0.76), leafy vegetables (0.74), fruity vegetables (0.70), legumes (0.54)
Factor 2 Squid and octopus (0.78), sea-food (shells, crab) (0.71), blue fish (0.67), dried fish and salted sardines (0.56), white fish (0.49)
Factor 3 Chocolate (0.78), cookies (0.76), cakes (0.69), bonbons (0.51) Factor 4 Salami (0.69), canned meat derivates (0.62), sausages (0.57), eggs (0.45), bacon (0.36) Factor 5 Cedevita (powder based vitamin juice) (0.68), fruits juices (0.62), refreshing non-alcoholic drinks (0.60) Factor 6 Bran bread (−0.81), white bread (0.73) Factor 7 Full-fat cheese (0.69), cottage cheese (0.63), hard cheese (0.52), sour cream (0.46) Factor 8 Venison (0.76), fish derivates (0.53) Factor 9 Butter (0.73), animal fats (0.70)
Factor 10 Internal organs (0.73), lamb (0.52), pork (0.37) Factor 11 Mushrooms (0.64), canned and pickled vegetables (0.61), potato (−0.30) Factor 12 Muesli (0.70), dried fruit (0.56), nuts (0.44) Factor 13 Hard liquor (0.68), vegetables juices (0.57), powder soups (0.33) Factor 14 Tea (0.64), olive oil (0.40) Factor 15 Milk (0.70), coffee (0.51), yoghurt (0.49), fresh fruits (0.40) Factor 16 Chicken (0.68), turkey (0.68) Factor 17 Beef (0.73), veal (0.34) Factor 18 Macaroni or rice (0.63), jam and marmalade (0.37), fruit compote (0.33) Factor 19 Plant oil (0.77)
Absolute values ≤ 0.3 were excluded for simplicity.
Figure 1. Odds ratios (OR) and 95% confidence intervals obtained from the logistic regression analysis for the association of dietary groups (factors) with plasma TPO-Ab and/or Tg-Ab. Significant dietary groups are coloured in red, while not-significant dietary groups are coloured in black. If the OR and the lower limit of the 95% confidence interval are above 1, the dietary group is positively associated with plasma TPO-Ab and/or Tg-Ab, whereas if the OR and the upper limit of
Nutrients 2017, 9, 1186 5 of 8
the 95% confidence interval are below 1, the dietary group is negatively associated with plasma TPO-Ab and/or Tg-Ab.
4. Discussion
This study has shown that the dietary group (factor 9) with frequent consumption of animal fats and butter was associated with positive plasma TPO-Ab and/or Tg-Ab, while the dietary groups (factors 1 and 12) with frequent consumption of different sorts of vegetables, dried fruit, nuts, and muesli were associated with negative findings of TPO-Ab and/or Tg-Ab.
Furthermore, the study showed that a higher number of women had positive TPO-Ab and/or Tg-Ab, which is in accordance with previously published studies [1,3,11]. Age and body mass index did not show association with positive TPO-Ab and/or Tg-Ab. The influence of body mass index is controversial in the literature, while the prevalence of positive thyroid antibodies increases with age [11–13].
Butter and animal fats are rich in saturated fatty acids (SFA) [14,15]. Vegetables, nuts, and cereals are rich in polyunsaturated fatty acids (PUFA) [16]. All the food items from dietary groups 1 and 12 of this study are rich in n-6 and n-3 PUFAs. Dietary n-6 and n-3 PUFAs are imbedded into the cell plasma membranes, where they serve as precursors in the synthesis of eicosanoids. These two types of PUFAs have opposite effects on inflammatory responses, whereas n-6 PUFAs serve as the precursors of inflammatory eicosanoids while n-3 generates anti-inflammatory eicosanoids [17]. The rate of n-6 conversion into n-3 in humans is below 5% and, consequently, the levels of anti-inflammatory eicosanoids are almost completely linked to the amount of dietary n-3 consumption [14]. Eicosanoids such as eicosapentaenoic acid (EPA) and docosahexaenoic acid (DHA) are involved in the regulation of pro-inflammatory cytokines and act as anti-inflammatory mediators, and therefore have benefits in autoimmune diseases such as rheumatoid arthritis [17].
Studies performed in experimental animals showed that a diet enriched with n-3 fatty acids suppresses the inflammation that accompanies autoimmune reactions [18–21]. The results indicate that n-3 PUFAs reduce the differentiation of Th17 cells from naive CD4+ T cells by modifying the lipid rafts regions in their plasma membrane and decreasing the formation of IL-6 receptors [18]. It is known that Th17 cells positively correlate with serum TPO-Ab and Tg-Ab [22]. Recently published studies showed that Th17 cells play the main role in the pathogenesis of AITD [23,24].
Food items included in dietary groups 1 and 12 are rich in n-3 fatty acids and seem to suppress the production of plasma TPO-Ab and Tg-Ab. On the contrary, saturated fatty acids of animal origin (dietary group 9) seem to have harmful influence on TPO-Ab and/or Tg-Ab production. Frequent consumption of animal fats and butter could result in a low ratio of n-3 fatty acids (anti-inflammatory)/n-6 fatty acids (inflammatory) in the diet and thus a lack of suppression of Th17 T cells differentiation, resulting in the promote TPO-Ab and/or Tg-Ab production [18,22].
Phytosterols are present in moderate and small amounts in nuts and vegetables, respectively, and have shown immunomodulatory and anti-inflammatory properties [25,26]. They are contained in dietary groups 1 and 12, and are associated with negative findings of plasma TPO-Ab and/or Tg-Ab. One of the proposed ways of their immunomodulation activity is the reduction of IL-6 plasma levels [25,26]. Since IL-6 is the main stimulator in Th17 cells differentiation, the reduction of IL-6 could be the reason behind the protective effect of phytosterols in the pathogenesis of AITD.
Polyphenols, abundant micronutrients in the diet, are components of fruits and vegetables. They are known for their anti-inflammatory, immunomodulatory, and antioxidative effect in the body [27,28]. Gallic acid could have a major role in the explanation of the beneficial effect of dried fruit and muesli (dietary group 12) on positive plasma TPO-Ab and/or Tg-Ab observed in this study. Gallic acid is a component of red fruit, but it can also be found in apple peels and grapes [28]. Red fruits are often consumed as dried fruit, and some of them are common components of muesli. Kuppan et al. found that treatment of human monocytes with gallic acid reduces the expression of IL-6 gene [29]. Hence, the reduction of IL-6 plasma levels could have a suppression effect in differentiation of Th17 cells involved in the pathogenesis of AITD.
Nutrients 2017, 9, 1186 6 of 8
To date, two studies have been published regarding diet and hypothyroidism/hyperthyroidism. The authors reported an association of vegan diet and lower risk of hypothyroidism [7]. The same group of authors also showed that vegan and vegetarian diets are associated with lower risk of hyperthyroidism [8]. The authors suggest a possible protective effect of polyphenols (such as flavonoids) against autoimmune processes, but a detailed explanation on the molecular level is not provided. They also discuss the possible effect of environmental toxins from food on the microbiome and their possible stimulation of autoimmune disease [7,8].
Benvenga et al. showed an association of lower serum thyroid autoantibodies and oily fish consumption and hypothesised about the protective effect of n-3 fatty acids [30]. In our study, dietary group 2, composed of different seafoods, did not reach significance in the association. The possible reason for this could be the presence of squids, octopus, shells, crabs, and white fish in that group, which are not as rich in n-3 fatty acids as blue (oily) fish [31]. Milerova et al. showed a positive correlation of phytoestrogen genistein with TgAb level in the sera of school children screened for iodine deficiency. However, relatively low iodine intake might be related with this finding [32].
Saturated fatty acids of animal origin, mostly presented in pro-inflammatory Western diets, showed a negative effect, while anti-inflammatory vegetarian and especially vegan diets showed a beneficial effect in the pathogenesis of other autoimmune diseases such as rheumatoid arthritis, multiple sclerosis, and systemic lupus erythematosus [33–36].
The present study has several limitations. This is a cross-sectional study and therefore only associations, and not causations, were inferred. Furthermore, all variables regarding food consumption were self-reported. Food frequency questionnaire had limitations for quantitative assessment of food intake; however, it provided relevant dietary information. Although we controlled for sociodemographic variables, unmeasured confounding factors could be present, including inflammatory parameters that may influence associations.
5. Conclusions
In summary, the present study demonstrated the association of animal fats and butter consumption with the positive plasma TPO-Ab and/or Tg-Ab. Vegetables, dried fruit, nuts, and muesli consumption was associated with the negative findings of TPO-Ab and/or Tg-Ab. In light of recently published studies, we discussed the possible protective effect of n-3 fatty acids from vegetables and nuts on the IL-6 receptors of the CD4+ T cells plasma membranes, and the suppression of their differentiation in Th17 T cells involved in the pathogenesis of AITD. Likewise, we discussed the suppressive effect of phytosterols and polyphenols found in vegetables, nuts, dried fruit, and muesli on IL-6 secretion. It seems that the frequent consumption of anti-inflammatory food items (vegetables, nuts, dried fruit, and muesli, as presented in dietary groups 1 and 12) is associated with the negative findings of plasma TPO-Ab and/or Tg-Ab.
Acknowledgments: The study was supported by the Croatian Science Foundation under the project “Identification of new genetic loci implicated in regulation of thyroid and parathyroid function” (No. 1498). The “10,001 Dalmatians” project was founded by the Medical Research Council UK, The Croatian Ministry of Science, Education and Sports (grant 216-1080315-0302), the European Union framework program 6 EUROSPAN project (contract No. LSHG-CT-2006-018947).
Author Contributions: T.Z. conceived the study idea; O.P., C.H., T.Z., and V.B.P. formed the biobank “10,001 Dalmatians”; V.T., D.B., and A.P. performed the measurements of thyroid antibodies and verified the relevance of the results; A.M. performed the statistical analysis, A.M., M.P., and T.Z. drafted the manuscript; B.L., M.B., V.B.P., and C.H. reviewed the manuscript; all authors approved the final version of the manuscript.
Conflicts of Interest: The authors declare no conflict of interest.
References
1. Wiersinga, W.M. Clinical relevance of environmental factors in the pathogenesis of autoimmune thyroid disease. Endocrinol. Metab. 2016, 31, 213–222.

Nutrients 2017, 9, 1186 7 of 8
2. Effraimidis, G.; Tijssen, J.G.; Wiersinga, W.M. Discontinuation of smoking increases the risk for developing thyroid peroxidase antibodies and/or thyroglobulin antibodies: A prospective study. J. Clin. Endocrinol. Metab. 2009, 94, 1324–1328.
3. Effraimidis, G.; Wiersinga, W.M. Mechanisms in endocrinology autoimmune thyroid disease: Old and new players. Eur. J. Endocrinol. 2014, 170, R241–R252.
4. Gaberscek, S.; Zaletel, K. Epidemiological trends of iodine-related thyroid disorders: An example from slovenia. Arch. Hig. Rada Toksikol. 2016, 67, 93–98.
5. Pedersen, I.B.; Knudsen, N.; Carle, A.; Vejbjerg, P.; Jorgensen, T.; Perrild, H.; Ovesen, L.; Rasmussen, L.B.; Laurberg, P. A cautious iodization programme bringing iodine intake to a low recommended level is associated with an increase in the prevalence of thyroid autoantibodies in the population. Clin. Endocrinol. 2011, 75, 120–126.
6. Benvenga, S.; Guarneri, F. Molecular mimicry and autoimmune thyroid disease. Rev. Endocr. Metab. Disord. 2016, 17, 485–498.
7. Tonstad, S.; Nathan, E.; Oda, K.; Fraser, G. Vegan diets and hypothyroidism. Nutrients 2013, 5, 4642–4652. 8. Tonstad, S.; Nathan, E.; Oda, K.; Fraser, G.E. Prevalence of hyperthyroidism according to type of
vegetarian diet. Public Health Nutr. 2015, 18, 1482–1487. 9. Rudan, I.; Marusic, A.; Jankovic, S.; Rotim, K.; Boban, M.; Lauc, G.; Grkovic, I.; Dogas, Z.; Zemunik, T.;
Vatavuk, Z.; et al. “10 001 dalmatians”: Croatia launches its national biobank. Croat. Med. J. 2009, 50, 4–6. 10. Polasek, O. Future of biobanks—Bigger, longer, and more dimensional. Croat. Med. J. 2013, 54, 496–500. 11. Hollowell, J.G.; Staehling, N.W.; Flanders, W.D.; Hannon, W.H.; Gunter, E.W.; Spencer, C.A.; Braverman,
L.E. Serum TSH, T(4), and thyroid antibodies in the united states population (1988 to 1994): National health and nutrition examination survey (NHANES III). J. Clin. Endocrinol. Metab. 2002, 87, 489–499.
12. Kawicka, A.; Regulska-Ilow, B. Metabolic disorders and nutritional status in autoimmune thyroid diseases. Postepy Hig. Med. Dosw. 2015, 69, 80–90.
13. Santini, F.; Marzullo, P.; Rotondi, M.; Ceccarini, G.; Pagano, L.; Ippolito, S.; Chiovato, L.; Biondi, B. Mechanisms in endocrinology: The crosstalk between thyroid gland and adipose tissue: Signal integration in health and disease. Eur. J. Endocrinol. 2014, 171, R137–R152.
14. Wyness, L. The role of red meat in the diet: Nutrition and health benefits. Proc. Nutr. Soc. 2016, 75, 227–232.
15. Brassard, D.; Tessier-Grenier, M.; Allaire, J.; Rajendiran, E.; She, Y.; Ramprasath, V.; Gigleux, I.; Talbot, D.; Levy, E.; Tremblay, A.; et al. Comparison of the impact of SFAs from cheese and butter on cardiometabolic risk factors: A randomized controlled trial. Am. J. Clin. Nutr. 2017, 105, 800–809.
16. Sobiecki, J.G.; Appleby, P.N.; Bradbury, K.E.; Key, T.J. High compliance with dietary recommendations in a cohort of meat eaters, fish eaters, vegetarians, and vegans: Results from the European prospective investigation into cancer and nutrition-oxford study. Nutr. Res. 2016, 36, 464–477.
17. Woo, S.J.; Lim, K.; Park, S.Y.; Jung, M.Y.; Lim, H.S.; Jeon, M.G.; Lee, S.I.; Park, B.H. Endogenous conversion of n-6 to n-3 polyunsaturated fatty acids attenuates K/BxN serum-transfer arthritis in fat-1 mice. J. Nutr. Biochem. 2015, 26, 713–720.
18. Allen, M.J.; Fan, Y.Y.; Monk, J.M.; Hou, T.Y.; Barhoumi, R.; McMurray, D.N.; Chapkin, R.S. n-3 PUFAs reduce T-helper 17 cell differentiation by decreasing responsiveness to interleukin-6 in isolated mouse splenic CD4(+) T cells. J. Nutr. 2014, 144, 1306–1313.
19. Shoda, H.; Yanai, R.; Yoshimura, T.; Nagai, T.; Kimura, K.; Sobrin, L.; Connor, K.M.; Sakoda, Y.; Tamada, K.; Ikeda, T.; et al. Dietary omega-3 fatty acids suppress experimental autoimmune uveitis in association with inhibition of Th1 and Th17 cell function. PLoS ONE 2015, 10, doi:10.1371/journal.pone.0138241.
20. Lorente-Cebrian, S.; Costa, A.G.; Navas-Carretero, S.; Zabala, M.; Laiglesia, L.M.; Martinez, J.A.; Moreno-Aliaga, M.J. An update on the role of omega-3 fatty acids on inflammatory and degenerative diseases. J. Physiol. Biochem. 2015, 71, 341–349.
21. Pestka, J.J.; Vines, L.L.; Bates, M.A.; He, K.; Langohr, I. Comparative effects of n-3, n-6 and n-9 unsaturated fatty acid-rich diet consumption on lupus nephritis, autoantibody production and CD4+ T cell-related gene responses in the autoimmune NZBWF1 mouse. PLoS ONE 2014, 9, e0100255.
22. Bacher, M.; Metz, C.N.; Calandra, T.; Mayer, K.; Chesney, J.; Lohoff, M.; Gemsa, D.; Donnelly, T.; Bucala, R. An essential regulatory role for macrophage migration inhibitory factor in T-cell activation. Proc. Natl. Acad. Sci. USA 1996, 93, 7849–7854.
Nutrients 2017, 9, 1186 8 of 8
23. Pyzik, A.; Grywalska, E.; Matyjaszek-Matuszek, B.; Rolinski, J. Immune disorders in hashimoto’s thyroiditis: What do we know so far? J. Immunol. Res. 2015, 2015, doi:10.1155/2015/979167.
24. Peng, D.; Xu, B.C.; Wang, Y.; Guo, H.; Jiang, Y.F. A high frequency of circulating Th22 and Th17 cells in patients with new onset graves’ disease. PLoS ONE 2013, 8, doi:10.1371/journal.pone.0068446.
25. Anonymous. Monograph. Plant sterols and sterolins. Altern. Med. Rev. 2001, 6, 203–206. 26. Devaraj, S.; Jialal, I.; Rockwood, J.; Zak, D. Effect of orange juice and beverage with phytosterols on
cytokines and PAI-1 activity. Clin. Nutr. 2011, 30, 668–671. 27. Xin, J.; Feinstein, D.L.; Hejna, M.J.; Lorens, S.A.; McGuire, S.O. Beneficial effects of blueberries in
experimental autoimmune encephalomyelitis. J. Agric. Food Chem. 2012, 60, 5743–5748. 28. Yoon, C.H.; Chung, S.J.; Lee, S.W.; Park, Y.B.; Lee, S.K.; Park, M.C. Gallic acid, a natural polyphenolic
acid, induces apoptosis and inhibits proinflammatory gene expressions in rheumatoid arthritis fibroblast-like synoviocytes. Jt. Bone Spine Revue Rhum. 2013, 80, 274–279.
29. Kuppan, G.; Balasubramanyam, J.; Monickaraj, F.; Srinivasan, G.; Mohan, V.; Balasubramanyam, M. Transcriptional regulation of cytokines and oxidative stress by gallic acid in human thp-1 monocytes. Cytokine 2010, 49, 229–234.
30. Benvenga, S.; Vigo, M.T.; Metro, D.; Granese, R.; Vita, R.; Le Donne, M. Type of fish consumed and thyroid autoimmunity in pregnancy and postpartum. Endocrine 2016, 52, 120–129.
31. Soltan, S.S.; Gibson, R.A. Levels of omega 3 fatty acids in australian seafood. Asia Pac. J. Clin. Nutr. 2008, 17, 385–390.
32. Milerova, J.; Cerovska, J.; Zamrazil, V.; Bilek, R.; Lapcik, O.; Hampl, R. Actual levels of soy phytoestrogens in children correlate with thyroid laboratory parameters. Clin. Chem. Lab. Med. 2006, 44, 171–174.
33. Riccio, P.; Rossano, R. Nutrition facts in multiple sclerosis. ASN Neuro. 2015, 7, doi:10.1177/1759091414568185.
34. Brown, A.C. Lupus erythematosus and nutrition: A review of the literature. J. Ren. Nutr. 2000, 10, 170–183.
35. Skoldstam, L.; Brudin, L.; Hagfors, L.; Johansson, G. Weight reduction is not a major reason for improvement in rheumatoid arthritis from lacto-vegetarian, vegan or mediterranean diets. Nutr. J. 2005, 4, doi:10.1186/1475-2891-4-15.
36. McCarty, M.F. Upregulation of lymphocyte apoptosis as a strategy for preventing and treating autoimmune disorders: A role for whole-food vegan diets, fish oil and dopamine agonists. Med. Hypotheses 2001, 57, 258–275.
© 2017 by the authors. Licensee MDPI, Basel, Switzerland. This article is an open access article distributed under the terms and conditions of the Creative Commons Attribution (CC BY) license (http://creativecommons.org/licenses/by/4.0/).