meg 実験 陽電子スペクトロメータの 性能と今後の展望 yuki fujii on behalf of the...
Post on 22-Dec-2015
222 views
TRANSCRIPT
MEG実験陽電子スペクトロメータの性能と今後の展望
Yuki FujiiOn behalf of the MEG collaborationJPS meeting @ Hirosaki University
17th Sep. 2011
2011/9/17日本物理学会@弘前大学 1
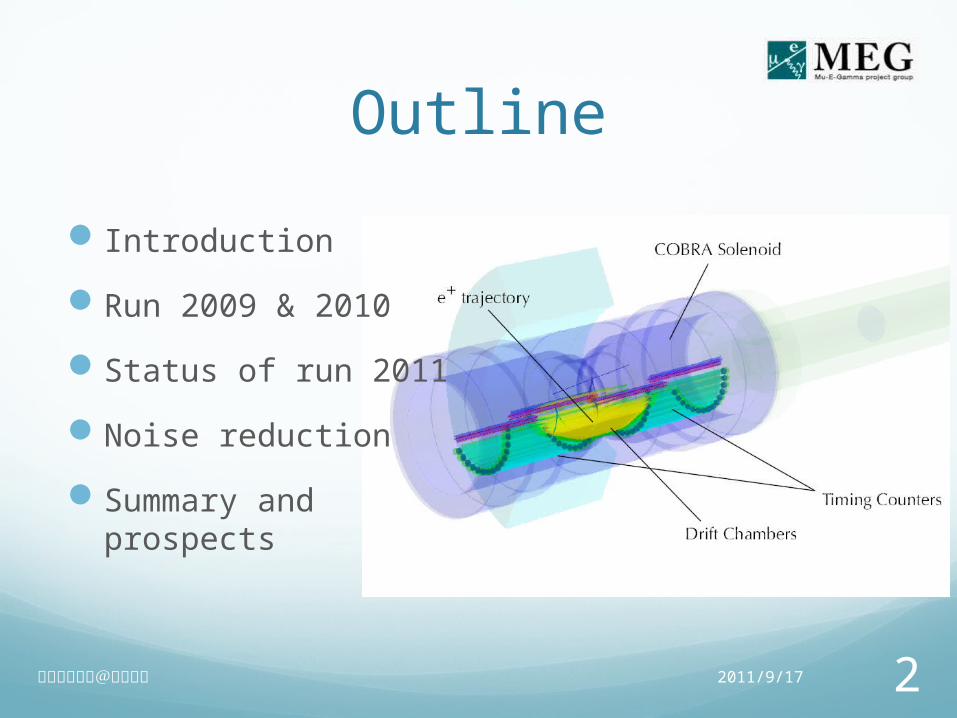
Outline
Introduction
Run 2009 & 2010
Status of run 2011
Noise reduction
Summary and prospects
2011/9/17日本物理学会@弘前大学 2
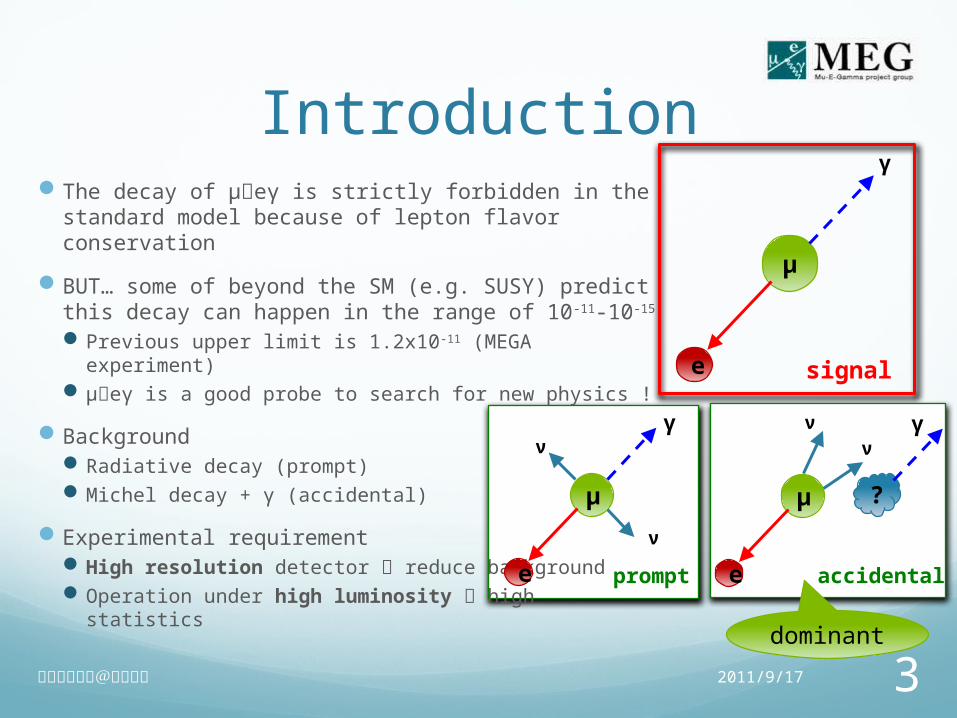
Introduction The decay of μeγ is strictly forbidden in the
standard model because of lepton flavor conservation
BUT… some of beyond the SM (e.g. SUSY) predict this decay can happen in the range of 10-11-10-15
Previous upper limit is 1.2x10⁻¹¹ (MEGA experiment) μeγ is a good probe to search for new physics !
Background Radiative decay (prompt) Michel decay + γ (accidental)
Experimental requirement High resolution detector reduce background Operation under high luminosity high statistics
μ
e
γ
signal
μ
e
γν
ν
prompt
?μ
e
γνν
accidental
dominant
2011/9/17日本物理学会@弘前大学 3

Introduction The MEG experiment started to search for μeγ in 2008
World’s most intense DC μ+ beam @ PSI 900 litter large Xenon calorimeter (白 :17pSE2, 金子 :17pSE3) The COBRA (COnstant Bending RAdius) spectrometer main topic
Result 2009 & 2010 : Br(μeγ) < 2.4x10⁻¹² (90 % C.L.) 5 times lower than previous one
(大谷 :18aSJ4, 岩本 :19aSD7, 澤田 :19aSD8)
Our sensitivity goal is a few × 10-13
Performance improvement is essential !
2011/9/17日本物理学会@弘前大学 4

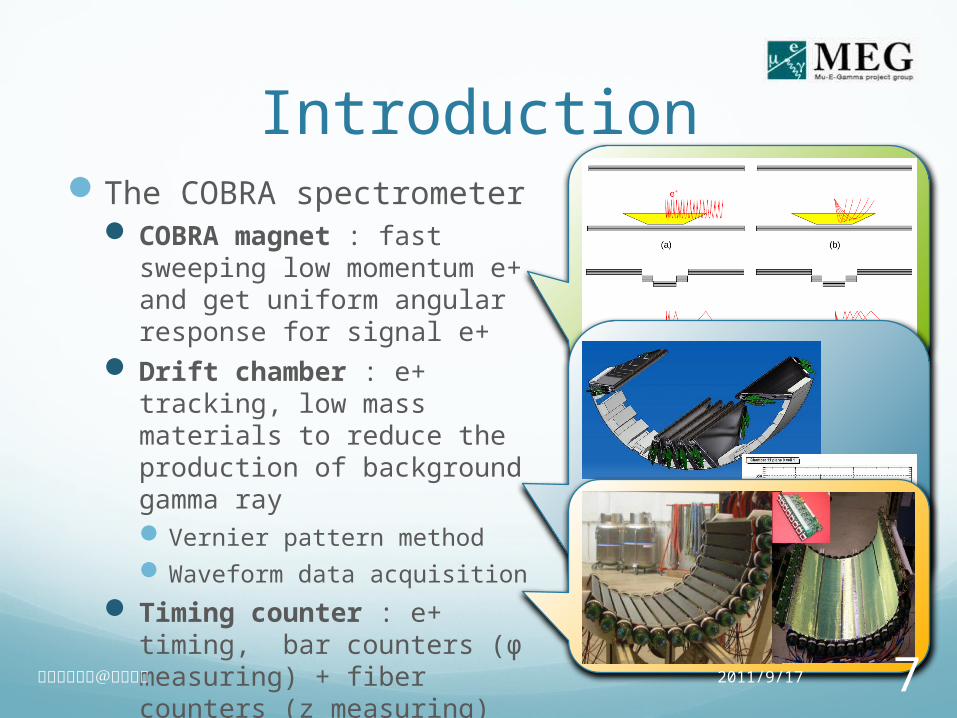
IntroductionThe COBRA spectrometer
COBRA magnet : fast sweeping low momentum e+ and get uniform angular response for signal e+
Drift chamber : e+ tracking, low mass materials to reduce the production of background gamma rayVernier pattern methodWaveform data acquisition
Timing counter : e+ timing, bar counters (φ measuring) + fiber counters (z measuring)
2011/9/17日本物理学会@弘前大学 5

IntroductionThe COBRA spectrometer
COBRA magnet : fast sweeping low momentum e+ and get uniform angular response for signal e+
Drift chamber : e+ tracking, low mass materials to reduce the production of background gamma rayVernier pattern methodWaveform data acquisition
Timing counter : e+ timing, bar counters (φ measuring) + fiber counters (z measuring)
2011/9/17日本物理学会@弘前大学 6
IntroductionThe COBRA spectrometer
COBRA magnet : fast sweeping low momentum e+ and get uniform angular response for signal e+
Drift chamber : e+ tracking, low mass materials to reduce the production of background gamma rayVernier pattern methodWaveform data acquisition
Timing counter : e+ timing, bar counters (φ measuring) + fiber counters (z measuring)
2011/9/17日本物理学会@弘前大学 7

IntroductionPositron measurement
Coordinate system Hit reconstruction
R time reading edgeZ charge division w/ Vernier pad
Track reconstructionKalman filter
e+
θ◉
e+
z(Beam axis)
z xφ
y
R
2011/9/17日本物理学会@弘前大学 8

Run 2009 & 2010 Run and analysis summary of 2009 and 2010
Drift chamber alignment Millipede using cosmic rays
COBRA Magnetic field reconstructed field
Bφ and Br are corrected a possible misalignment of hole probe to conserve the Maxwell’s equations from measured Bz
All APDs off because of noise problem
Drift chamber waveform in 2010 was a little noisier than in 2009 (σ of pedestal : ~1.8 mV ~2.0 mV)
2011/9/17日本物理学会@弘前大学 9

Run 2009 & 2010Performance estimation
Momentum resolution : Michel edge fitting and double turn events
Angular & vertex resolutions : Double turn events
Efficiency : count #of MD
Correlations : sideband data
Here
2011/9/17
μ
e
νν
Michel
日本物理学会@弘前大学 10

Run 2009 & 2010All performance of the e+ spectrometer are
estimated by data itself (radiative decay events, Michel decay events, and so on)
2009 2010
Ee 330 keV (core 82 %) 330 keV (core 79 %)
φ (at φ=0) 6.7 mrad 7.2 mrad
θ 9.4 mrad 11.0 mrad
Z 0.15 cm 0.20 cm
Y 0.11 cm (core 87 %) 0.11 cm (core 85 %)
Teγ (RMD) 150 psec 130 psec
εMichel 40 % 34 %
2011/9/17日本物理学会@弘前大学 11

Run 2009 & 2010All performance of the e+ spectrometer are
estimated by data itself (radiative decay events, Michel decay events, and so on)
2009 2010
Ee 330 keV (core 82 %) 330 keV (core 79 %)
φ (at φ=0) 6.7 mrad 7.2 mrad
θ 9.4 mrad 11.0 mrad
Z 0.15 cm 0.20 cm
Y 0.11 cm (core 87 %) 0.11 cm (core 85 %)
Teγ (RMD) 150 psec 130 psec
εMichel 40 % 34 %
Noise+
increased dead channels
Increased dead channelsBetter DRS clock
2011/9/17日本物理学会@弘前大学 12

Status of 2011
7 drift chamber modules were replaced because of increased remaining current or frequent trip
Physics data taking started at the end of June
In 2009 and 2010, only 14 MHz noise is dominant
reduced by adjusting charge integration time other noise components appeared (>30 MHz from APD fiber counters)
Working of hardware noise reduction was done in the middle of July Change HV module for drift chambers and turn off noisy APD channels
2011/9/17日本物理学会@弘前大学 13
April May June July Aug. Sep.
Detector installation CalibrationDetector check
Physics run CEX
14 MHz

Status of 2011At the beginning of 2011 run,
noise situation was the worst…
But
2011/9/17日本物理学会@弘前大学 14

Status of 2011At the beginning of 2011 run,
noise situation was the worst…
After hardware modifications, the lowest noise condition realized !
The APD fiber counters are partially operational now (not all) Data quality to be checked
2011/9/17日本物理学会@弘前大学 15
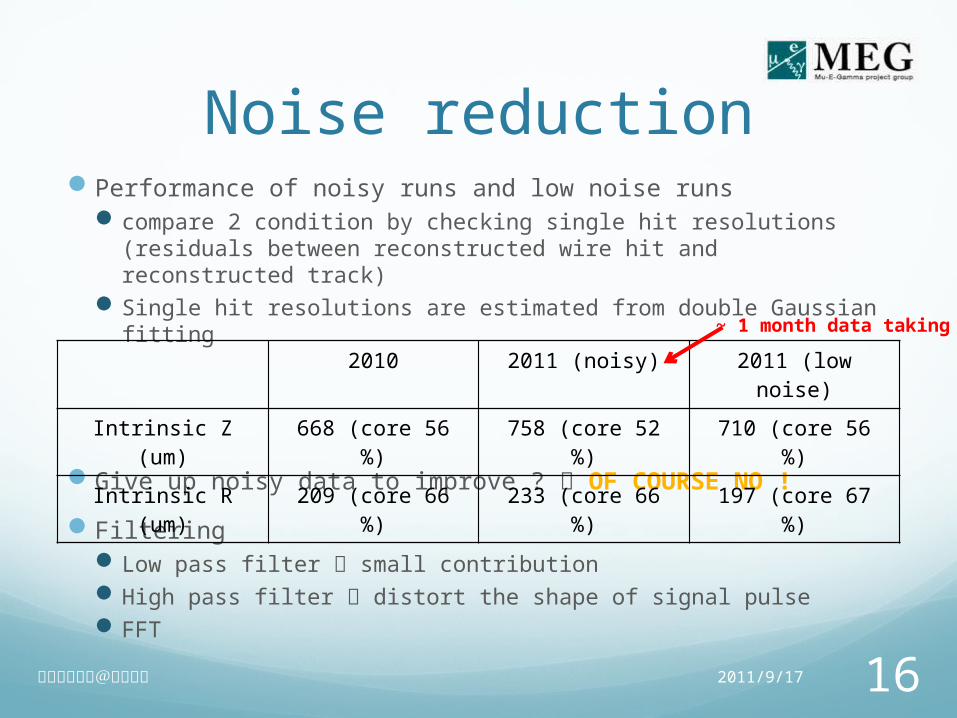
Noise reduction Performance of noisy runs and low noise runs
compare 2 condition by checking single hit resolutions (residuals between reconstructed wire hit and reconstructed track)
Single hit resolutions are estimated from double Gaussian fitting
Give up noisy data to improve ? OF COURSE NO !
Filtering Low pass filter small contribution High pass filter distort the shape of signal pulse FFT
2010 2011 (noisy) 2011 (low noise)
Intrinsic Z (um) 668 (core 56 %) 758 (core 52 %) 710 (core 56 %)
Intrinsic R (um) 209 (core 66 %) 233 (core 66 %) 197 (core 67 %)
~ 1 month data taking
2011/9/17日本物理学会@弘前大学 16

Noise reductionLarge periodical noises are eliminated in FFT power
spectrum from DCH waveform
After that, filtered spectrum is transformed inverse to the waveform Charge integration done for filtered waveform
FFT
2011/9/17日本物理学会@弘前大学 17

Noise reduction
inverse
Large periodical noises are eliminated in FFT power spectrum from DCH waveform
After that, filtered spectrum is transformed inverse to the waveform Charge integration done for filtered waveform
2011/9/17日本物理学会@弘前大学 18

Noise reduction Thanks to offline noise filtering, twice better σ of pedestal
realized (2.4 mV1.2 mV)
2011/9/17日本物理学会@弘前大学 19

Noise reduction Thanks to offline noise filtering, twice better σ of pedestal
realized (2.4 mV1.2 mV)
Single hit Z resolution improved !! 758 664 um, #of hits increased
2011/9/17日本物理学会@弘前大学 20
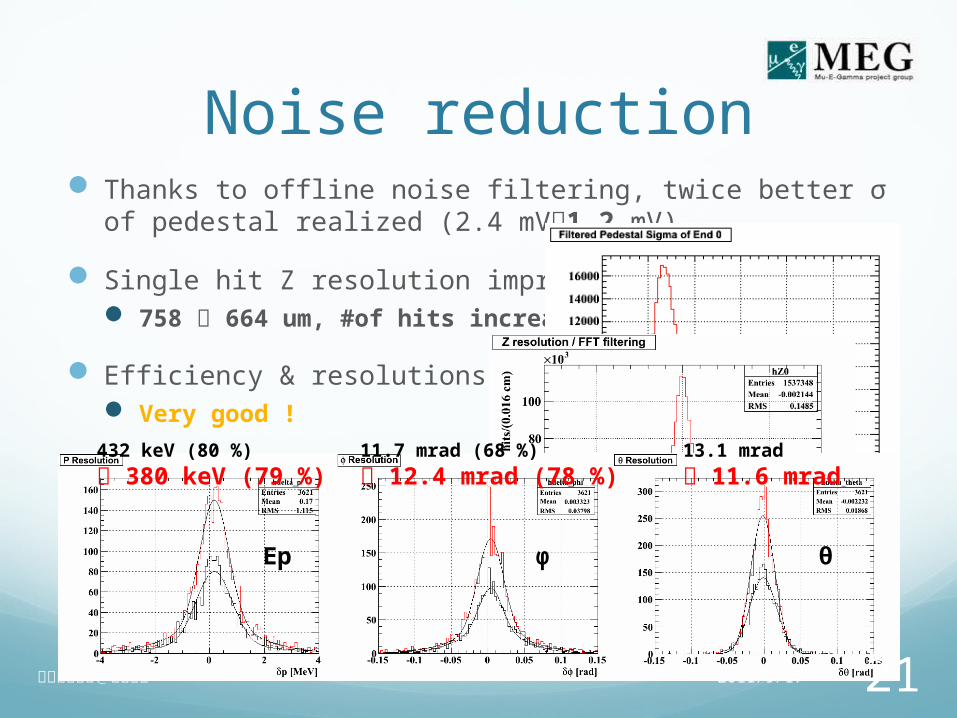
Noise reduction Thanks to offline noise filtering, twice better σ of pedestal
realized (2.4 mV1.2 mV)
Single hit Z resolution improved !! 758 664 um, #of hits increased
Efficiency & resolutions Very good !
Ep φ θ
432 keV (80 %)
380 keV (79 %)11.7 mrad (68 %)
12.4 mrad (78 %)13.1 mrad
11.6 mrad
2011/9/17日本物理学会@弘前大学 21

Noise reductionFiltering for waveform in low noise condition
What happen if FFT filtering used in low noise condition ?
Single hit Z resolutionOnly a few % better (710 697 um)#of hits increased
Efficiency and resolutions improved, too14.4 mrad (84 %)
11.4 mrad (76 %)12.0 mrad
11.7 mrad
2011/9/17日本物理学会@弘前大学 22
390 keV (82 %)
321 keV (75 %)
Ep φ θ
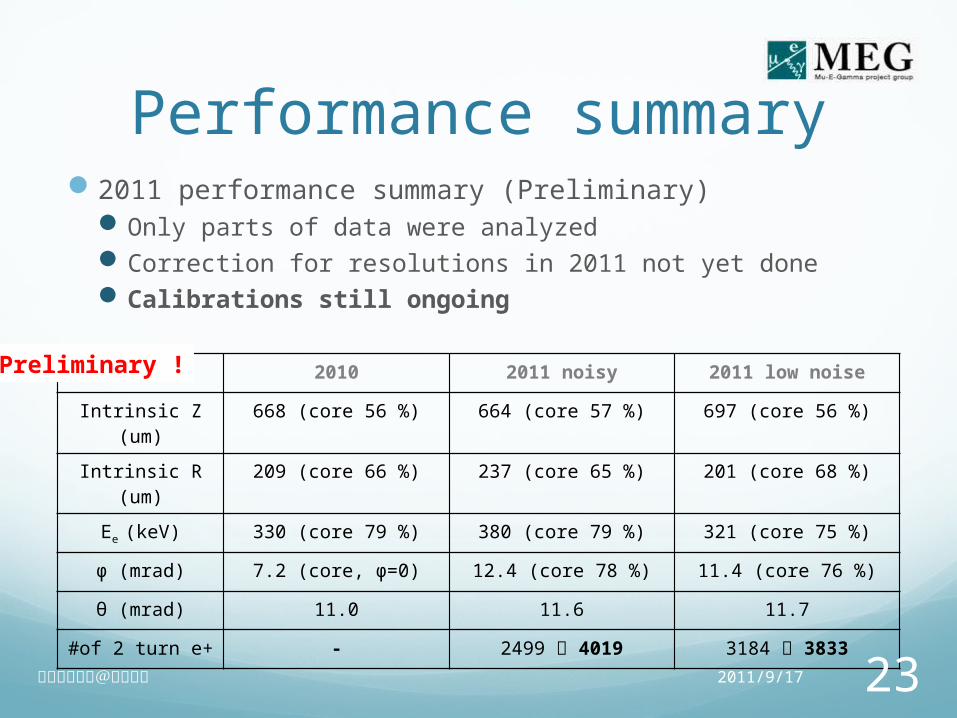
Performance summary2011 performance summary (Preliminary)
Only parts of data were analyzed Correction for resolutions in 2011 not yet done Calibrations still ongoing
2010 2011 noisy 2011 low noise
Intrinsic Z (um) 668 (core 56 %) 664 (core 57 %) 697 (core 56 %)
Intrinsic R (um) 209 (core 66 %) 237 (core 65 %) 201 (core 68 %)
Ee (keV) 330 (core 79 %) 380 (core 79 %) 321 (core 75 %)
φ (mrad) 7.2 (core, φ=0) 12.4 (core 78 %) 11.4 (core 76 %)
θ (mrad) 11.0 11.6 11.7
#of 2 turn e+ - 2499 4019 3184 3833
Preliminary !
2011/9/17日本物理学会@弘前大学 23

Summary Thanks to FFT noise filtering, data quality of noisy runs
achieved to the level of low noise situation ! Further check needed
Transformation accuracy Check with more data Single hit R resolution
Prospects Calibrations for the spectrometer in preparation now
Better resolutions and efficiency expected Monochromatic calibration source for the spectrometer
Mott scattering with e+ beam (energy tunable)
Hardware improvement for εe (≒ reduce materials between DC and TC) Readout cable exchange to thinner one (40 % 50 + x %) According to changing cables, the support structure system for drift
chambers will be updated
Summary and prospects
2011/9/17日本物理学会@弘前大学 24
current
Future candidate
backup
2011/9/17日本物理学会@弘前大学 25
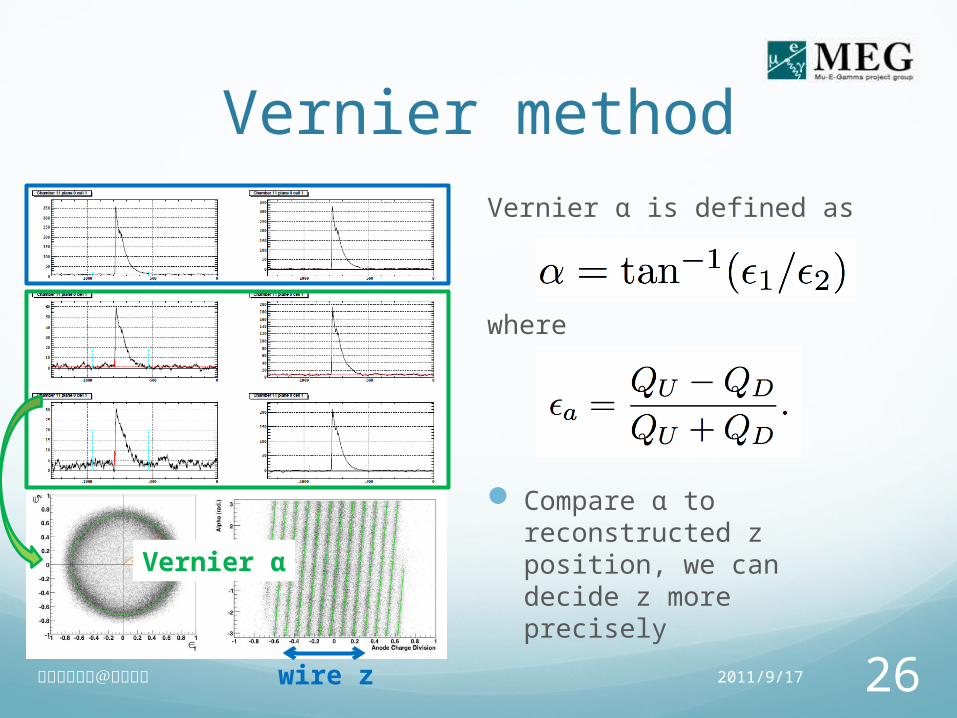
Vernier methodVernier α is defined as
where
Compare α to reconstructed z position, we can decide z more precisely
wire z
Vern
ier
α
2011/9/17日本物理学会@弘前大学 26
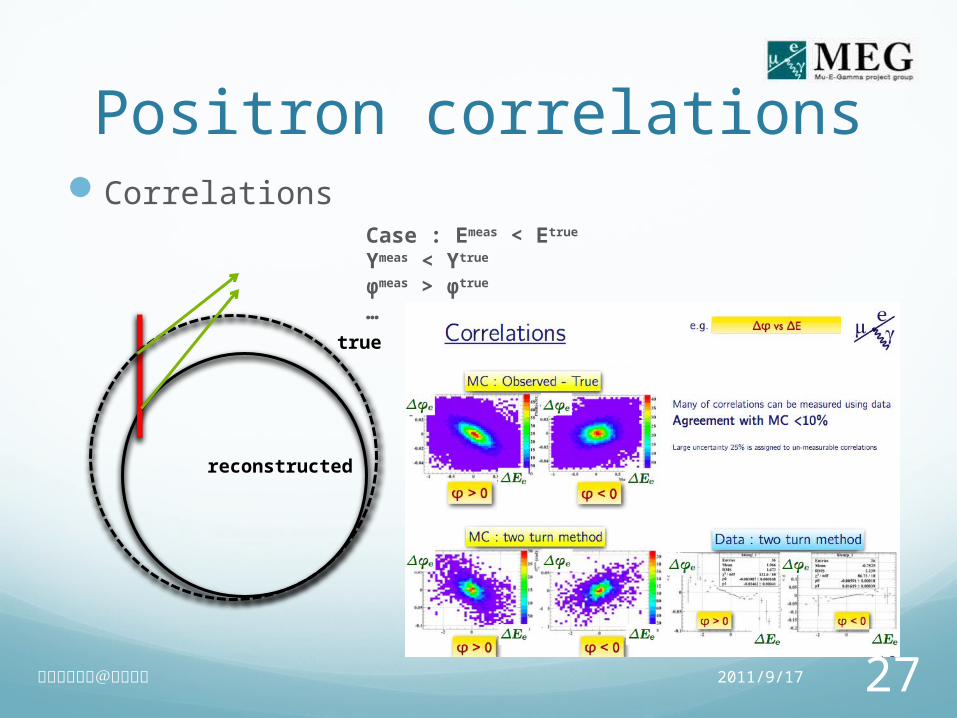
Positron correlationsCorrelations
2011/9/17日本物理学会@弘前大学 27
true
reconstructed
Case : Emeas < Etrue
Ymeas < Ytrue
φmeas > φtrue
…
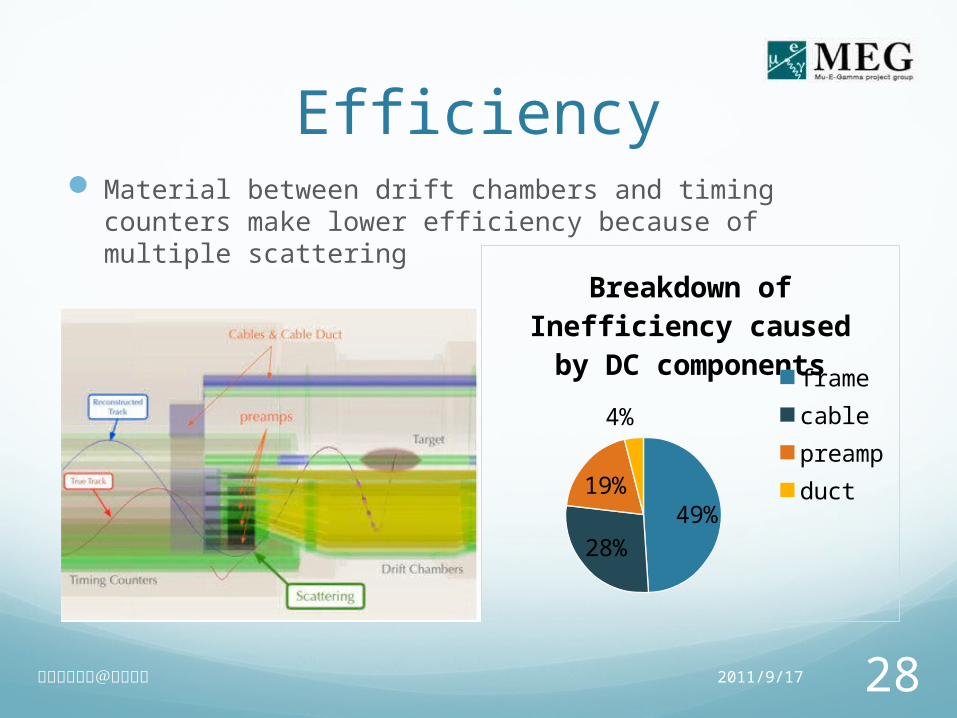
Efficiency Material between drift chambers and timing counters
make lower efficiency because of multiple scattering
2011/9/17日本物理学会@弘前大学 28
49%
28%
19%
4%
Breakdown of Inef-ficiency caused by
DC componentsframecablepreampduct

Check for APD dataQuality check for APD outputs
First step Matching between hit z at fiber and e+ track at timing
counter bars Only downstream of APDs are working now
ze+
MC
2011/9/17日本物理学会@弘前大学 29

Check for APD dataQuality check for APD outputs
First step Matching between hit z at fiber and e+ track at timing
counter bars peak position is same, but large tail found Only downstream of APDs are working now
ze+
MCDataー DSー US
Multiple scattering ?
2011/9/17日本物理学会@弘前大学 30