nationwide survey of 60co teletherapy dosimetry · 'supported in part uy the radioactive...
TRANSCRIPT
JO U RNAL OF RESEARCH of the Nat iona l Bu reau of Sta n da rds-A. Phys ics and Chemistry Vol. 80A, No.4, July- August 1975
Nationwide Survey of 60CO Teletherapy Dosimetry*
Margarete Ehrlich and Gary L. Welter**
Institute for Basic Standards, National Bureau of Standards, Washington, D.C. 20234
(S eptember 10, 1975)
The National Bureau of Standards is performing a study of the abilit~· of radiationtherapy departments to deliver prescribed absorbed doses of 60CO gamma radiation to a water phantom. Batches of thermoluminescence dosimeters arc mailed to participating therapy departments for irradiation under prescribed conditions. Upon return of the dosimeters, the participants' computations are checked and the absorbed dose is evaluated from dosimeter response. The rugged dosimetry system was assembled mainly from commercial components adapted to the present requirements of relatively high flex ibility of readout parameters and data-handling techniques, and of relatively high accuracy. The uncertainty in the dose interpretation inherent in the system is estimated to be about 4 percent.
In order to illustrate the type of information that can be obtained from such a study, results of the first four mailings involving tests on 114 60CO gamma-ray beams arc discussed. They show about 75 percent of the dose interpretations to be within I) percent of the prescribed absorbed dose, and about 20 percent to be within 5 to 10 percent of this dose. Four dose interpretations showed discrepancies larger than 20 percent. Differences in the computations larger than 1 percent were observed in over one-half of the cases.
Key words: Absorbed dose; cobalt-60 gamma radiation; computation check; dose interpretation; mailings; results; therapy departments; thermoluminescence dosimeters; uncertainty; water phantom.
1 . Introduction
As part of the endeavor to determine the impact of the calibration activities of the National Bureau of Standards (NBS) on radiation measurements throughout the United States and to pinpoint areas in need of improvement, a study is being performed of the ability of radiation-therapy departments to deliver a prescribed absorbed dose of 60CO gamma rays to a water phantom. 60CO gamma-ray teletherapy has been widespread throughout the United States for some time, with around 1000 beams presently in active use, most of them in conjunction with radiation-measurement equipment whose calibration is traceable to NBS. Therefore, 60CO teletherapy beams appeared to be a good ta.rget for starting a radiation measurement-assurance study of this nature. The study is open to all interested users and is to run for a total of about two-and-one-half years. By the end of this period, it is planned to have one single test completed on abou t two-thirds of all 60CO teletherapy beams in the United States.
NBS mails sets of thermoluminescence (TL) dosimeters to participating radiotherapy departments for irradiation under prescribed conditions. Upon return of the dosimeters, NBS interprets their re-
'Supported in part uy the Radioactive Materials Branch, Bureau of Radiologicaillealth, Rockville, Md. 20852.
"Present address: Department of Astronomy, University of Wisconsin, ~ladi· son, WI. 53706.
sponse in terms of absorbed dose to water and informs the participants of the test results. It is the purpose of this paper to review the mn,in features of the procedures involved in the study and of the dosimetry methods. Also, in order to illustrate the type of informn,tion that can be obtained from a study of this nature, a discussion is given of the results for the first four mailings.
2. Administrative Procedure
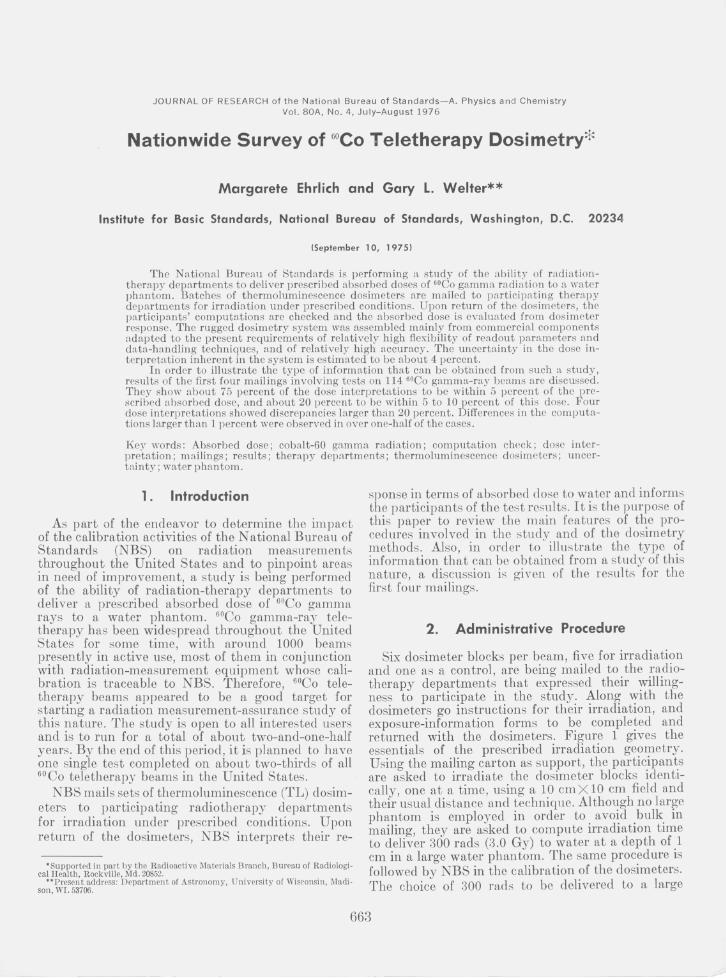
Six dosimeter blocks per beam, five for irradiation and one as a control, are being mailed to the radiotherapy departments that expressed their willingness to par ticipate in the study. Along with the dosimeters go instructions for their irradiation, and exposure-information forms to be completed and returned with the dosimeters. Figure 1 gives the essentials of the prescribed irradiation geometry. Using the mailing carton as support, the participants are asked to irradiate the dosimeter blocks identically, one at a time, using a 10 cmX 10 cm field and their usual distance and technique. Although no large phantom is employed in order to . avo~d .bulk. in mailing, they are asked to compute IrradIatIOn tIme to deliver 300 rads (3.0 Gy) to water at a depth of.1 cm in a large water phantom. The same procedure IS followed by NBS in the calibration of the dosimeters. The choice of 300 rads to be de1ivered to a In,rge
663

DOSIMETER BLOCK
SSD TECHNIQUE
SSD
i>--_ ----- -L
SAD TECHNIQUE
SAD
300 rods ....... ...v---I __ ___ I em --- r _----L-
MAILING CARTON
FIG URE 1. Prescribed irradiation geometry.
Participant is to employ his usual di stance and technique (either source-tosurface, SSD, or source-to-axis. SAD).
water phantom was made to approximate realistic t~erapy conditions. The depth of 1 cm was chosen sImply for convenience. It is expected that the dose at t~1is depth (wh~ch is just beyond the depth of maXImum dose delIvered) may be derived to within 1 percent from that of the customary 5-cm depth by means of available depth-dose data [1].1
The main exposure-information form which r~adily can be completed by a technician, 'requests ~Ime and date of irradiation, distance, field size Irradiation time, and identification of the operato{' and. the person supplying the information. An optl~nal for~, to be filled out by the physicist, asks for mformatlOn regarding source calibration for u~e b~- ~BS in an effort to assist the participa~ts in pmpomtmg the cause for any significant deviations of the NBS dose interpretation from 300 rads.
Upon completion of dosimeter evaluation in ~erms of. abso::bed dose to water, the participants mcluded m a glVen mailing are informed of their own results or;l.y and of their s~anding among their peers. ~or partIClpants completmg the optional inform atlOn form regarding source calibration NBS further furnishes a value for the absorbed d~se computed from the calibration information. P erformance of all participants is known only to NBS and is treated as confidential information.
3. Description of Dosimetry System and Method of Dose Evaluation
Choice oj Dosimetry System. TL systems have prove~ thelr valu~. m several past survey studies mvolvmg the mallmg of dosimeters [2]. For the
I Figures in brackets indicate literature references at the end of this papcr .
present repetitive operation, the main considerations guiding the s~lection of a. TL system are ruggedness, ease of handhng and mamtenance, and a relatively small dependence of TL response on irradiation and th<:;rrl!-al histories. C~msid~rations of fading characterIstlCs are of mmor Importance since fading corrections can be applied readily. So are considerations of dependence of response on photon energy. For most source geometries encountered in medical BOCO gamma irradiators the fraction of scattered photons with energies below 100 keY to which the high-atomic number CaF2 :Mn detector would show a relatively high response, is expected to be negligibly small compared with the total scatter [3] . At the core of the dosimetry system are commercial quartz ,bulbs, each con.taining two pieces of pressed crystallme CaF2 :Mn m contact with a metallic heater strip, and a commercial assembly consisting of a bulb-~e~ting unit and an electronically cooled photomultipher. The rest of the system consists of part.s assembled in t~e l~boratory specifically for use m the present apphcatlOn.
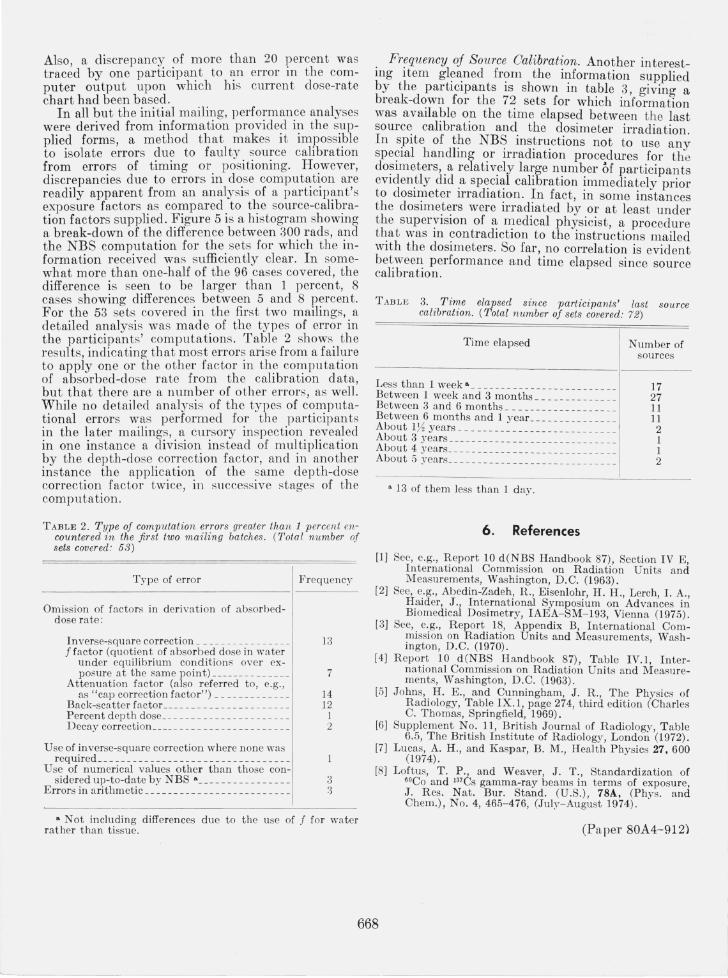
During shipment and irradiation the TL bulbs are cradled in black polystyrene bldcks (see fig. 2). The blocks provide shielding from prolonged influence of visible light, to which CaF2 :Mn is not ~ntirely insensitive, and maximum electron buildup m polystyrene at the bulb surface in a BOCO gammaray field. One of the bulb pins is seen to be bent. This fixes the orientation of the bulb during irradiation and readout, which was found to be mandatory for good reproducibility, particularly in radiation fields containing an appreciable low-energy component. For the present study, the pins were bent m such a way that, during irradiation, neither of the two CaF 2 :Mn pieces is shielded from the direct photon beam by the central heater strip. For flexibility in th.e selection of readout parameters and da ta handlmg not provided in the commercial bulb reader, a current integrator is used that permits either direct printout of the data or interfacing with a teletypewriter and paper-tape printer. The assembly IS controlled by an electronic timer in a circuit designed to permit independent variation of total heating and current-integration times.
Dosimeter Calibration. Prior to each mailinoeach dosimeter is individually calibrated in b~ two-stage procedure. In the first s tage, the relative response of the individ ual dosimeters is deter?1ined at low exposure levels (3-5 R) , with the time mter.va~s between irradiation and readout adjusted to ehmmate the need for fading corrections. The ten relative calibration sequences administered prior to the start of the program demonstrated relative standard deviations for the reproducibility of repeated individual dosimeter readings ranging from about 0.1 to 2 percent, with an average of 0.8 percent. Additional relative calibration sequences administered to each dosimeter between any two mailings were found to be necessary since response of some dosimeters decreases with use, while others it remains relatively constant.
664

r I~ I
FIGURl·: 2. The chosen thermoluminescence dosimeter.
The dosimeter bulb is placed in to one of the halves of a black polystyrene block, each half havin g the dimensions 7.6 em X 5.0 cm X 1.0 em . The halves arc screwed together with Nylon screws. A tight fit of the bulbs is assured by tape over the cutout for the bent pin in one of t he block halves. During irradiation, the block surface b~aring the recessed screw heads faces the radiation source.
The second stage consists ill an absolute calibration with 60CO gamma rays, covering an absorbeddose range from a bout 100 to 600 rads in water in a geometry identical to that used by the participants. Absorbed dose at a 1-cm depth in water is computed from exposure using accepted methods and parameters [4 , 5, 6]. The calibration dosimeters are read out along with the dosimeters returned by the participants, and with shipping and laboratory controls. The slightly supra-linear function of dosimeter response-versus-exposure, obtained by least-squares fit, forms the basis for the dose in terpretation from the dosimeter response of the unknown samples.
Correction jor Residtwls. In experiments carried out in the course of the preparations for the present survey, we found indications that, at a given time after initial irradiation and readout, there exists a residual level that is characteristic for the particular exposure. When the exposure level is changed, the residual level characteristic for the new exposure establishes itsell' gradually upon repeated irradiation and readout. Because of these findings and in view of the results of Lucas and Kaspar [7] regarding a possible delayed transfer to shallower (accessible) traps of electrons initially in traps that are inaccessible to a particular TL readout, cletel'minations of resid uals were carried out for the level and the time sequ ence actually employed in the present study. The results confirm ed the need for small corrections to the 3-R readouts employed in the determination of relative dosimeter response after readouts of high exposures, the residual response after the readout of a 400- R exposure being between 0.5 and 1.5 percent of the response to a 3-R exposure. No correction for resid uals is req uired for reado u ts 0 f exposures above "'-'100 R.
Correction for Increase in Photomultiplier Sensitivity During Extended Readoltt Periods. The two types of photomultipliers tested (one a relatively insensitive copper-beryllium dynode tube, the other a sensitive bialkali-dynode tube) both exhibit gain changes with repeated use. For the present study, the sensitive bialkali-dynode tube is employed, at a voltage leading to current signals of about lO}lA for the TL
response to 300 R. Under these operating conditions, the photomultiplier gain increases monotonically by almost 4 percent, probably due to insufficient cooling at high signal levels, during the roughly 3 h required for the readout of about 270 dosimeters of which about 200 received "'-'300 R. A suitabl~ correction for this increase is obtained with the aid of readings taken at regular intervals during the readout sequence of the constant light source built into the reader.
Choice oj Readout Technique. Since the TL dosimetry system employed relies on annealing of the CaF2 :Mn material solely during the readout cycle a readout technique was chosen that enables one t~ mix irradiations and readouts over the entire contemplated range without appreciable interference from incandescence or from release of residu al trapped electrons. Yet, to prolong the life of the dosimeters, heating power is kept at a minimum. An annealing time of 21 s is used throughout. For readou t of dosimeters mailed to the participants, and of all associated calibration dosimeters receiving exposures of 100 R or more, the heater current is 6 A, producing close to maximum thermal load. For readout of the low-level (3-5 R) exposures given in the co urse of the determination of relative dosimeter response, a heater current of 5.5A is sufficien t. Signal-integration times of 14 sand 16 s for the 6- A and 5.5-A readouts, respectively, are used since they have been found to produce maximum discrimination against incandescence, while including most of the glow peaks.
Corrections Jor Fading. The reduction in the TL signal was found to be about 4 percent over the decade between 20 and 200 h, while it was only about 2.5 percent over the subsequent 500 h. Consequently, the correction for fading applied to the readings of the dosimeters exposed by the participants varies between abou t 4 and 6 percent, for the usually encountered l70-to 700-h delay between irradiation and readout.
4. Analysis of Uncertainties in the Dose Interpretation from TL Response
A valid assessment by NBS of the participants' ability to deliver a prescribed absorbed dose necessitates a knowledge of the uncertainty inherent in the NBS procedure for determining absorbed dose from dosimeter response. In table 1, averages derived from two or more of the past four mailings are given for estimated upper bounds for the uncertainties due to the systematic and random errors inherent in the NBS procedure for determining absorbed dose. The uncertainties due to the systematic errors in the location of the response and fading curves were obtained from the statistical information for the least-squares fits of these curves as three times the standard deviations of the predicted values in the ranges of interest. The uncertainty due to all systematic errors then was taken to be the sum of the
665

TABLE 1. Uncertainty in determination of absorbed dose from T L response
Sources of error
Systematic
NBS exposure calibration of 60CO gamma-ray source 8
Location of TL rcsponse-versus-absorbed dose curve Location of fading curve Positioning of dosimeters during calibration
Total
Random
Evaluation from single dosimeter response from average response of five dosimeters
Resul ting uncertain ties 1--------------
0.7% .7
1.0 . 1
3.0 %
2.5 %
Total uncertainty in dose interpretation from average response of five dosimeters
1. 3
~4%
individual uncertainties listed. The hard-to-assess uncertainties associated with the generally accepted values of the parameters and constants used in the computation of absorbed dose from exposure were not included.
In the evaluation of the uncertainties due to the random errors, the argument was used that the sources for the random errors in the absorbed-dose determination from the response of the dosimeters irradiated by the participants are essentially the same as for the evaluation of the calibration and fading data. Using this argument, the uncertainty due to the random errors shown in table 1 for the dose evaluation from the response of a single dosimeter was computed by combining 3 times the standard deviations associated with the least-squares fits of the calibration and fading curves in quadrature, after suitably weighting by the degrees of freedom for
each curve fit. The corresponding uncertainty of the results from readings on five dosimeters then was obtained by division by ~5, finally leading to an estimate of about 4 percent (or ± 12 rads, at the 300-rad level) for the algebraic sum of the uncertainties due to the total systematic and random errors. This is the total uncertainty of the NBS dose interpretation from the average response of five dosimeters.
5. Discussion of Results of the First Four Test Series
NBS Dose Interpretation from Response of Dosimeters Irradiated by the Participants. Figure 3 gives the dose interpretation for the individual dosimeters submitted for irradiation by the participants in
400r--'I---'I---'I---'I---'-I--'-I --'-I -'I--60-0~1-4-3-5~1---'I---'-I --'-I--'-1--'-1-'1---'
380-
- 360-Z o
~ 340-~ w a:: ~ 320 r- ~ ~ 0 § ; ~ g 0
b !
&> B
o o H
-
-
-
-
o Z B co 0 6 a 8 '19 -300~~~-~r-~~---~0--~0---k---~~~e~00~-----~~'-------~~~-~~cooro~~~ w ,., 0 0 0';;' ~ 0 0 § ({) 0 en 'i5'B (X) 60 0 00 00 o Boa 00 9' Cl 280 r- 0 a IE 'i5' I Q 0
Cl W
~ 260fo
o o ij
-
-
~ ,J, ~ ~240~~I ___ 11~·5 __ ~I __ ~1~~j __ ~~I ~I __ ~~l z~E~Ro~I __ ~~I ~I __ ~~I ~I __ ~~I~I __ ~~I ~
o 4 8 12 16 20 24 28 30 SERIAL NUMBER
FIGURE 3. NBS dose interpretations from individual dosimeter response for a typical mailing batch.
666

one of the past mailing batches. In VieW of the analysis given above for the uncertainties in the dosimetry method, differences of ± 5 percent in the average dose interpretation must be considered significant. Of the 33 sets for which results are shown, ten are outside the ±5-pel'cent limit (one of these, number 17, probably because one of the dosimeters was irradiated twice by mistake, while another presumably irradiated dosimeter remained blank). It is of interest to note that, in most instances, the readings on the individual dosimeters are within the ± 3 percent uncertainty due to the random error of the NBS dose interpretation from individual dosimeter readings, the most pronounced exceptions being observed in sets number 4 and 19.
The results for the first four mailing batches arc shown in figure 4 in the form of a histogram giving the difference, in percent, between 300 rads and the average NBS dose interpretation. Of a total of 114 sets, 85 (or about 75%) show results differing from 300 rads by less than 5 percent; another 22 (or about 20%) show differences of between 5 llnd 10 percent; there are 4 with differences over 20 percent.
Sources of Erl'or ,in Delivered Dose. Only through laboratory visits is it possible to isolate all sources of error in actual dose delivery. The NBS study cloes not involve any laboratory visits. In fact, only during the initial pilot mailing comprising the facilities of the U.S. Veterans Administration and the U.S. Public Health Service was it. possible to obtain information on some of the sources of error either by direct or indirect personal interchange. What was learned through this interchange was, e.g., that timer
malfunction had been observed previously by the participants in two out of the three cases in which a spread in individual readings large compared to NBS uncertainty due to random error had been observed on presumably identically irradiated dosimeters.
30r-,----,----,----,,---,-----,_---,----,----,-,
en f-
Z ::J
>- 20 a. « 0: w J: fW -.J W f- 10
lJ.. o 0: W (IJ
::!' ::J Z
FIGUHI'; 4. Survey, results oj fir~t jour muilillg~.
Shown is the percent difference between the dose presumably delivered and the N DS dose interpretation from the average response of the five dosimeters in each set. The percentage intervals are closed at the upper bounds. In the cases in which ono dosimeter gave a Significantly different dose interpretation (rom the other four, the interpretation from this dosimeter is omitted from the average . The results from the one set for which two of the fiye dosimeters gave Significantly different dose interpretations are omitted altogether. The two discrepancies of around 60 percent prolJably are due to a misunderstanding by the partiCipants regarding the absorbed dose to be delivered.
16.r----,----,-~ '-,----,----_r----,_--_,----_,----,_----,_--_,----,_----
14
~ 12
z ::J
>- 10 n. <t 0:: W I 8 I-W -.J
~ 6
~ o 0:: 4 w (l)
::. :;:)
z 2
0~--~--~~4~~~~--~--~~~~----~--~----~~~--~~~~ -70 -10 0
DIFFERENCE, PERCENT
FIGURI; 5. Check on participants' computations.
Shown is the difference between the participants' computation and the NBS computation check, made with the aid of the information supplied IJy the participants. The percentage intervals are closed at the upper bounds. Differences of 1 percent or less are not considered significant.
667
Also, a discrepancy: .of more than 20 1)ercent was traced by one partlclpa~ t to ~n error m the computer output upon whlCh hIS current dose-rate chart had been based.
In all but the initial mailing, performance analyses were derived from inform ation provided in the supplied forms, a method that makes it impossi)Jle to isolate errors due to faulty source cahbratlOn from errors of timing or positioning. However, discrepancies due to errors in d~se comput3;ti.on a~e readily apparent from an analYSIS of a partICIpant s exposure factors as cOI?pared. to tl~e source-calib.ration factors supplied. FIgure 5 IS a hIstogram showmg a break-down of the difference between 300 rads, and the NBS computation for the sets for which the information received was sufficiently clear . In somewhat more than one-half of the 96 cases covered , the difference is seen to be larger than 1 percent, 8 cases showing differences between 5 and 8 percent. For the 53 se ts covered in the first two mailings, a detailed analysis was made of the types of error in the participants' computations. Ta"?le 2 shows. the resul ts indicating that mos t errors an se from a faLlure to apply one or the other factor in the computation of absorbed-dose rate from the calibration data , but that there are a number of other errors, as well. While no detail ed analysis of the types of computational errors was performed for the participants in the later mailings, a cursory inspection revealed in one instance a division instead of multiplication by the depth-dose corr ection factor , and in another instance the application of the sam e depth-dose correction factor twice, in sll ccessive stages of the computation .
TABLE 2. T ype of computation errors greatel' than 1 percent encountered in the first two mailing batches. (T otal number of sets covered: 53)
T ype of error
Omission of factors in deri vat ion of absorbeddose rate:
Frequency
Inverse-square correction _ _ _ _ _ _ _ _ _ _ _ _ _ _ _ _ 13 f factor (quotient of absor bed dose in water
under equilibrium conditions over ex-posure at the same point)_ _______ ______ 7
Attenuation factor (also r eferred to, e.g., as "cap correction factor") _ _ ___________ 14
Back-scatter factoL ____________ _________ 12 P ercent depth dose_ _ _ _ _ _ _ _ _ _ _ _ _ _ _ _ _ _ _ _ _ _ I Decay correction_ ____ _ __ _ __ _ _ _ _ __ _ _ _ _ _ _ _ 2
Usc of inverse-square correction where none was required ________________________________ _
U se of numerical values other than those con-sidered up-to-date by NBS a________________ 3
Errors in arithmetic _ _ _ _ _ _ _ _ _ _ _ _ _ _ _ _ _ _ _ _ _ _ _ _ _ 3
a Not including differences due to the use of f for water rather than tissue.
Frequency of Source Calibration. Another interesting item gl~3:ned fr?m the it;lformation supplied by the partiCIpants IS shown In table 3, giving a break-down for the 72 sets for which information was available on the t ime elapsed between the last source calibration and the dosimeter irradiation. In spite of the NBS instructions not to lise any special handling or irradiation procedures for the dosimeters, a relatively large number Of participants eviden.tly did .a sp~ci~l calibration immediately prior to dOSImeter IrradIatIOn . In fact, in some instances the dosimeters were irradiated by or at least under the supervision of a medical physicist, a procedure that was in contradiction to the instructions mailed with the dosimeters . So far, no correlation is evident between performance and time elapsed since source calibration.
TABLE 3. T ime elapsed since participants' last source calibration. (Total number of sets covered: 72)
Time elapsed Number of sources
Less than 1 week a _ _ _ _ _ _ _ _ _ _ _ _ _ _ _ _ _ _ _ _ _ _ _ _ _ 17 Between 1 week and 3 months _ _ _ _ _ _ _ _ _ _ _ _ _ _ 27 Between 3 and 6 m on thL _ _ _ _ _ _ _ _ _ _ _ _ _ _ _ _ _ _ 11 Between 6 mon ths and 1 yeaL _ _ _ _ _ _ _ _ _ _ _ _ _ _ 11 Abo u t 17~ years _ _ _ _ _ _ _ _ _ _ _ _ _ _ _ _ _ _ _ _ _ _ _ _ _ _ _ 2 About 3 years__ ____ _______________________ 1 About 4 years_____________________________ 1 About 5 years_ _ _ _ _ _ _ _ _ _ _ _ _ _ _ _ _ _ _ _ _ _ _ _ _ _ _ _ _ 2
• 13 of them less than 1 day.
6. References
[1] See, e.g., Report 10 d (N BS Handbook 87), Section IV E, International Commission on Radiation Units and Measurements, Washington, D . C. (1963).
[2] See, e.g., Abedin-Zadeh, R. , Eisenlohr, I-I. H., Lerch, I. A., H aider, J ., Internat ional Symposium on Advances in Biomedical Dosimetry , IAEA-SM- 193, Vienna (1975).
[3] See, e. g., Report 18, Appendix B, International Commission on Radiation Units and Measure ments, Washington, D.C. (1970).
[4] Report 10 d (NBS H andbook 87) , T able IV.I, International Commission on Radi ation Units and Measurements, Washington, D.C. (1963).
[.5] J ohns, H. E., and Cunningham, J. R. , The Physics of Radiology, Table IX.l, page 274, third edi t ion (Charles C. Thomas, Springfield, 1969).
[6] Supplement No. 11, British J ournal of Radiology, Table 6.5, The British Institute of R adiology, London (1\l72).
[7] Lucas, A. H. , and Kasp ar, B. M., Health Physics 27, 600 (1974) .
[8] Loftus, T. P., and Weaver, J. T. , Standardization of 60CO and mcs gamma-ray beams in terms of exposure, J. R es. Nat. Bur. Stand. (U.S.), 78A, (Phys . and Chem .) , No.4, 465- 476, (Jul~'-August 1974).
(Paper 80A4-(12)
668