nestle junny
TRANSCRIPT

8/3/2019 Nestle Junny
http://slidepdf.com/reader/full/nestle-junny 1/32

8/3/2019 Nestle Junny
http://slidepdf.com/reader/full/nestle-junny 2/32
History 1866-1905
In the 1860s Henri Nestlé, a pharmacist, developed a food for babies who wereunable to breastfeed. His first success was a premature infant who could nottolerate his mother's milk or any of the usual substitutes. sold in much of Europe.
1905-1918
In 1905 Nestlé merged with the Anglo-Swiss Condensed Milk Company. By the early1900s, the company was operating factories in the United States, Britain, Germanyand Spain.
1918-1938
After the war Government contracts dried up and consumers switched back to freshmilk. However, Nestlé's management responded quickly, streamlining operationsand reducing debt. The 1920s saw Nestlé's first expansion into new products, withchocolate the Company's second most important activity
1938-1944
Nestlé felt the effects of World War II immediately. Profits dropped from $20 millionin 1938 to $6 million in 1939. Factories were established in developing countries,particularly Latin America. Ironically, the war helped with the introduction of theCompany's newest product, Nescafé, which was a staple drink of the US military.Nestlé's production and sales rose in the wartime economy.

8/3/2019 Nestle Junny
http://slidepdf.com/reader/full/nestle-junny 3/32
1944-1981
Nestlé's growth in the developing world partially offset a slowdown in the Company'straditional markets. Nestlé made its second venture outside the food industry by acquiringAlcon Laboratories Inc..
1981-1995
Nestlé divested a number of businesses1980 / 1984. In 1984, Nestlé's improved bottomline allowed the Company to launch a new round of acquisitions, the most importantbeing American food giant Carnation.
1996-2002
The first half of the 1990s proved to be favorable for Nestlé: trade barriers crumbled andworld markets developed into more or less integrated trading areas. Since 1996 therehave been acquisitions including San Pellegrino (1997), Spillers Petfoods (1998) andRalston Purina (2002). There were two major acquisitions in North America, both in 2002:in July, Nestlé merged its U.S. ice cream business into Dreyer's, and in August, a USD 2.6bnacquisition was announced of Chef America, Inc.
2003 + The year 2003 started well with the acquisition of Mövenpick Ice Cream,
enhancing Nestlé's position as one of the world market leaders in this productcategory. In 2006, Jenny Craig and Uncle Toby's were added to the Nestlé portfolio and2007 saw Novartis Medical Nutrition, Gerber and Henniez join the Company.
8/3/2019 Nestle Junny
http://slidepdf.com/reader/full/nestle-junny 4/32
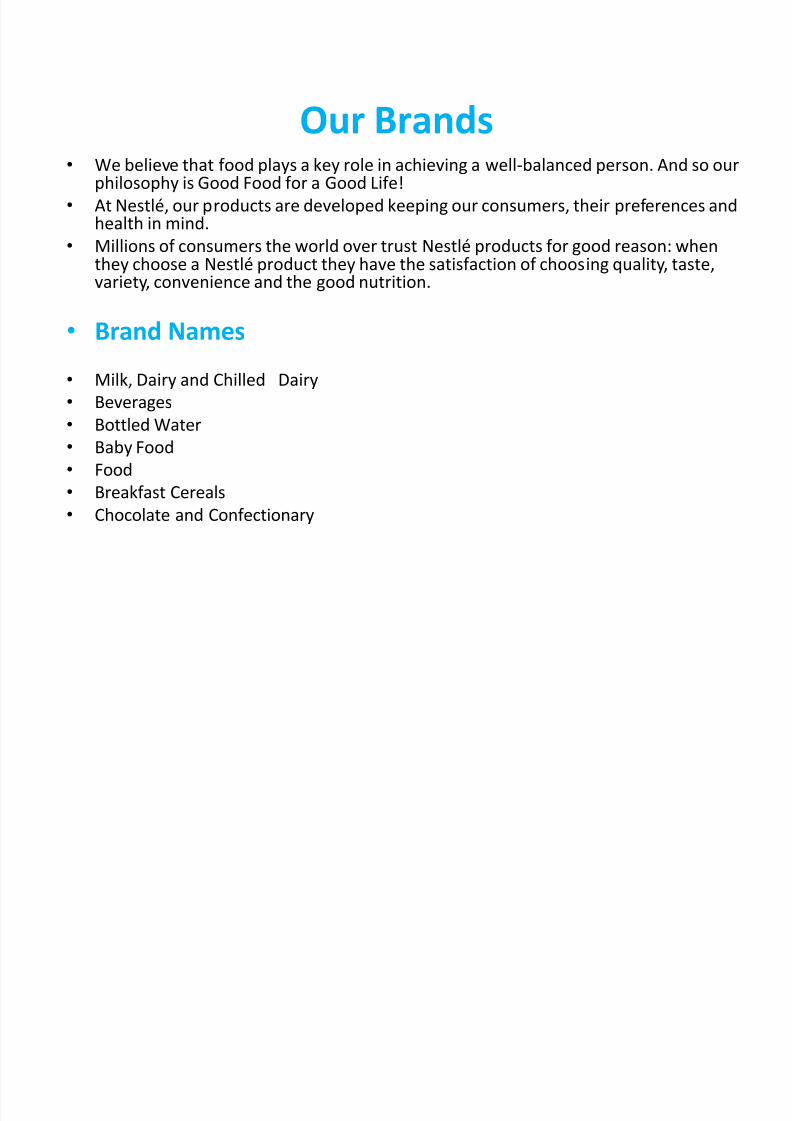
Our Brands We believe that food plays a key role in achieving a well-balanced person. And so our
philosophy is Good Food for a Good Life!
At Nestlé, our products are developed keeping our consumers, their preferences andhealth in mind.
Millions of consumers the world over trust Nestlé products for good reason: whenthey choose a Nestlé product they have the satisfaction of choosing quality, taste,variety, convenience and the good nutrition.
Brand Names
Milk, Dairy and Chilled Dairy
Beverages
Bottled Water
Baby Food
Food
Breakfast Cereals
Chocolate and Confectionary

8/3/2019 Nestle Junny
http://slidepdf.com/reader/full/nestle-junny 5/32
Vision
The Nestlé global vision is to be the leading health,wellness, and Nutrition Company in the world
8/3/2019 Nestle Junny
http://slidepdf.com/reader/full/nestle-junny 6/32
Mission Statement
Good Food is the primary source of Good Health throughout life. We strive
to bring consumers foods that are safe, of high quality and provide
optimal nutrition to meet physiological needs. In addition to Nutrition,
Health and Wellness, Nestlé products bring consumers the vital
ingredients of taste and pleasure

8/3/2019 Nestle Junny
http://slidepdf.com/reader/full/nestle-junny 7/32
M
anagement

8/3/2019 Nestle Junny
http://slidepdf.com/reader/full/nestle-junny 8/32
IFE Internal Factor Evaluation MatrixKey Internal Factors Weight Rating Weighted Score
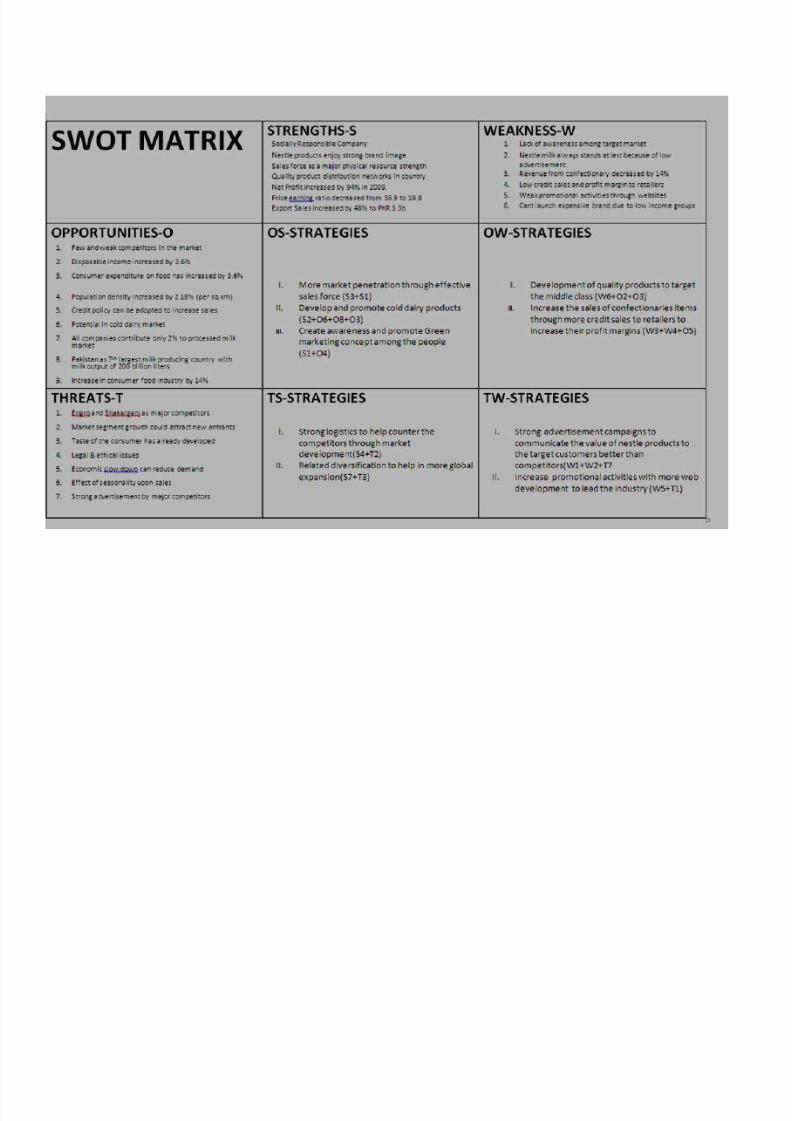
Strengths
Socially Responsible Company 0.03 3 0.09
Nestle products enjoy strong brand image 0.07 3 0.21
Sales force as a major physical resource strength 0.05 3 0.15
Quality product distribution networks in country 0.08 2 0.16
Net Profit increased by 94% in 2009. 0.20 4 0.80
Price earning ratio decreased from 38.9 to 18.8 0.05 3 0.15
Export Sales increased by 48% to PKR 3.3 billion 0.18 4 0.72
Weaknesses
Lack of awareness among target market 0.04 2 0.08
Nestle milk always stands at last because of lowadvertisement.
0.09 2 0.18
Revenue from confectionary decreased by 14% 0.08 2 0.16
Low credit sales and profit margin to retailers 0.05 2 0.10
Weak promotional activities through websites 0.05 3 0.15
Cant launch expensive brand due to low income groups 0.03 1 0.03
Total 1.00 2.99

8/3/2019 Nestle Junny
http://slidepdf.com/reader/full/nestle-junny 9/32
EFE External Factor Evaluation MatrixKey External Factors Weight Rating Weighted Score
Opportunities
Few and weak competitors in the market 0.12 2 0.24
Disposable income increased by 3.6% 0.07 3 0.21
Consumer expenditure on food has increased by 3.6% 0.09 4 0.36
Population density increased by 2.18% (per sq.km) 0.05 3 0.15
Credit policy can be adopted to increase sales 0.03 3 0.09
Potential in cold dairy market 0.02 3 0.06
All companies contribute only 2% to processed milk market 0.12 4 0.48
Pakistan as 7th largest milk producing country with milk output of 200 billion liters 0.12 3 0.36
Increase in consumer food industry by 14% 0.05 4 0.20
Threats
Engro and Shakarganj as major competitors 0.14 3 0.42Market segment growth could attract new entrants 0.04 2 0.08
Taste of the consumer has already developed 0.02 2 0.04
Legal & ethical issues 0.01 2 0.02
Economic slow down can reduce demand 0.01 2 0.02
Effect of seasonality upon sales 0.05 3 0.15
Strong advertisement by major competitors 0.08 3 0.24
Total 1.00 3.02
8/3/2019 Nestle Junny
http://slidepdf.com/reader/full/nestle-junny 10/32
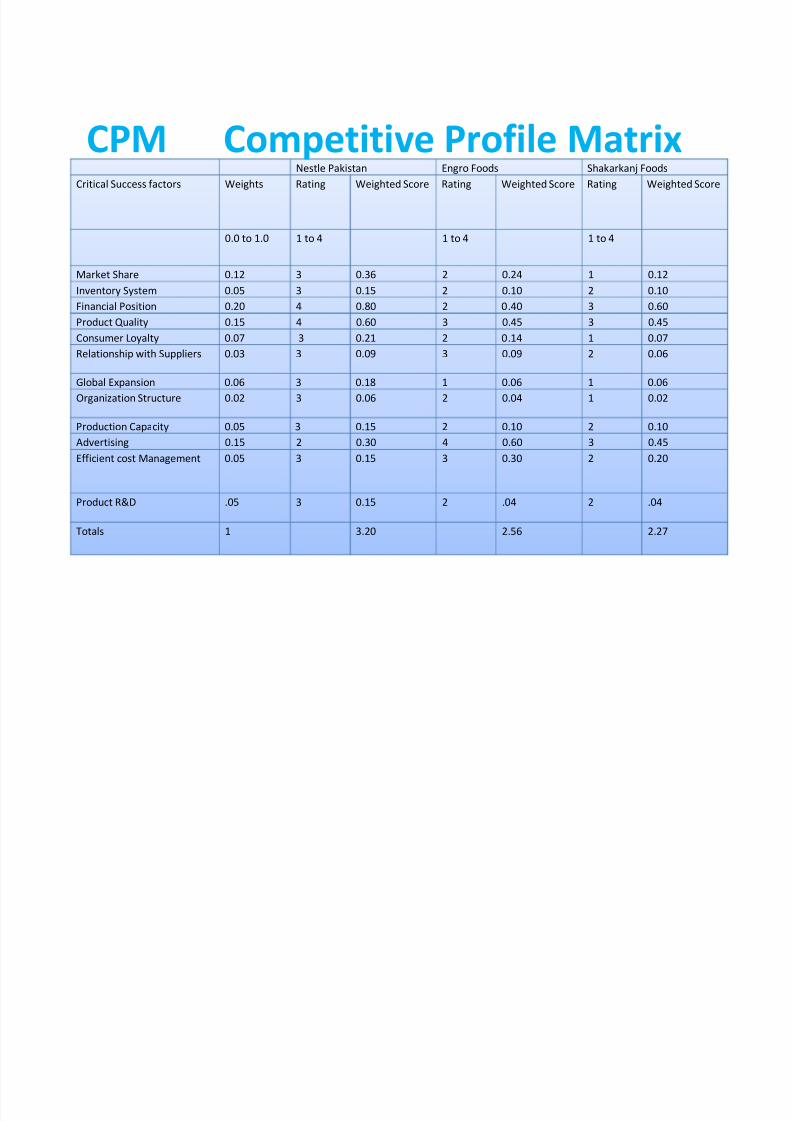
CPM Competitive Profile MatrixNestle Pakistan Engro Foods Shakarkanj Foods
Critical Success factors Weights Rating Weighted Score Rating Weighted Score Rating Weighted Score
0.0 to 1.0 1 to 4 1 to 4 1 to 4
Market Share 0.12 3 0.36 2 0.24 1 0.12Inventory System 0.05 3 0.15 2 0.10 2 0.10
Financial Position 0.20 4 0.80 2 0.40 3 0.60
Product Quality 0.15 4 0.60 3 0.45 3 0.45
Consumer Loyalty 0.07 3 0.21 2 0.14 1 0.07
Relationship with Suppliers 0.03 3 0.09 3 0.09 2 0.06
Global Expansion 0.06 3 0.18 1 0.06 1 0.06
Organization Structure 0.02 3 0.06 2 0.04 1 0.02
Production Capacity 0.05 3 0.15 2 0.10 2 0.10
Advertising 0.15 2 0.30 4 0.60 3 0.45
Efficient cost Management 0.05 3 0.15 3 0.30 2 0.20
Product R&D .05 3 0.15 2 .04 2 .04
Totals 1 3.20 2.56 2.27
8/3/2019 Nestle Junny
http://slidepdf.com/reader/full/nestle-junny 11/32

8/3/2019 Nestle Junny
http://slidepdf.com/reader/full/nestle-junny 12/32
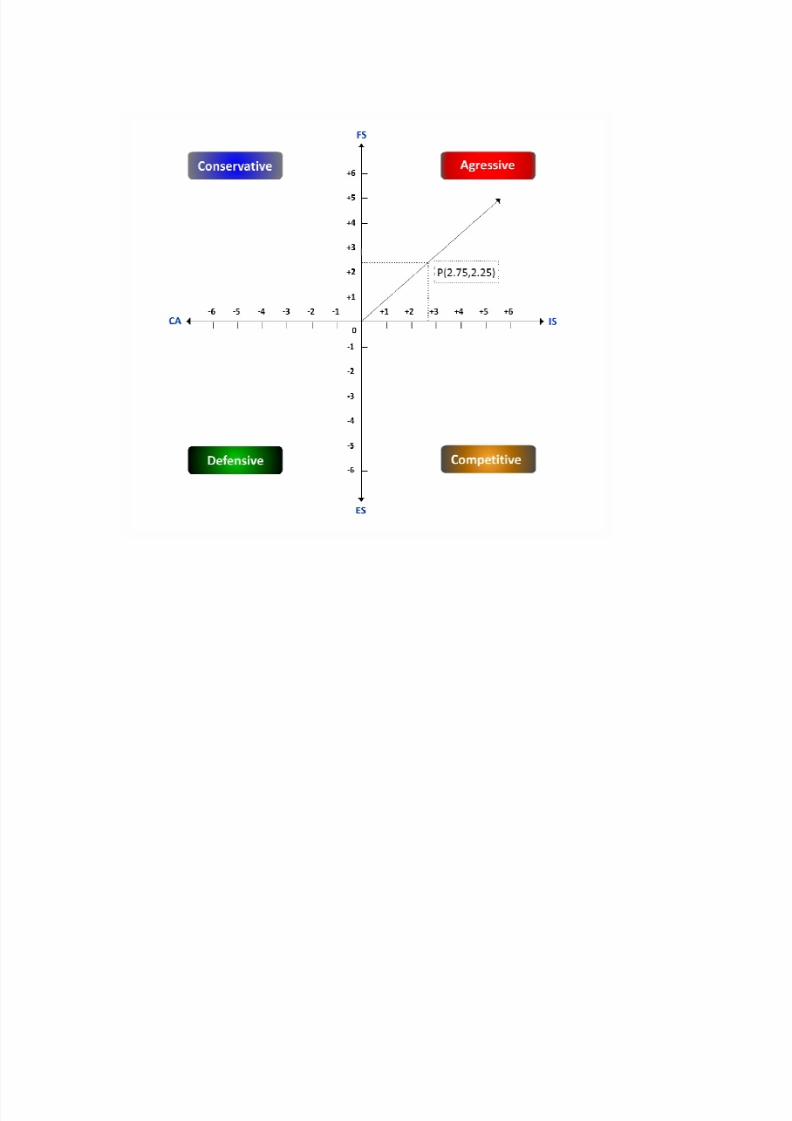
FINANCIAL STRENGTH
Nestles net sales increased by 20% in 2009 as compared to 2008 3
Net profit increased by 94% in 2009 as compared to 2008 5
Debt equity ratio changes from 63:37 to 66:34 3
Price earnings ratio in 2009 was 18.8 as compared to 2008 38.9 5
Return on capital employed increases by 40% 4
Average financial strength 4
8/3/2019 Nestle Junny
http://slidepdf.com/reader/full/nestle-junny 13/32
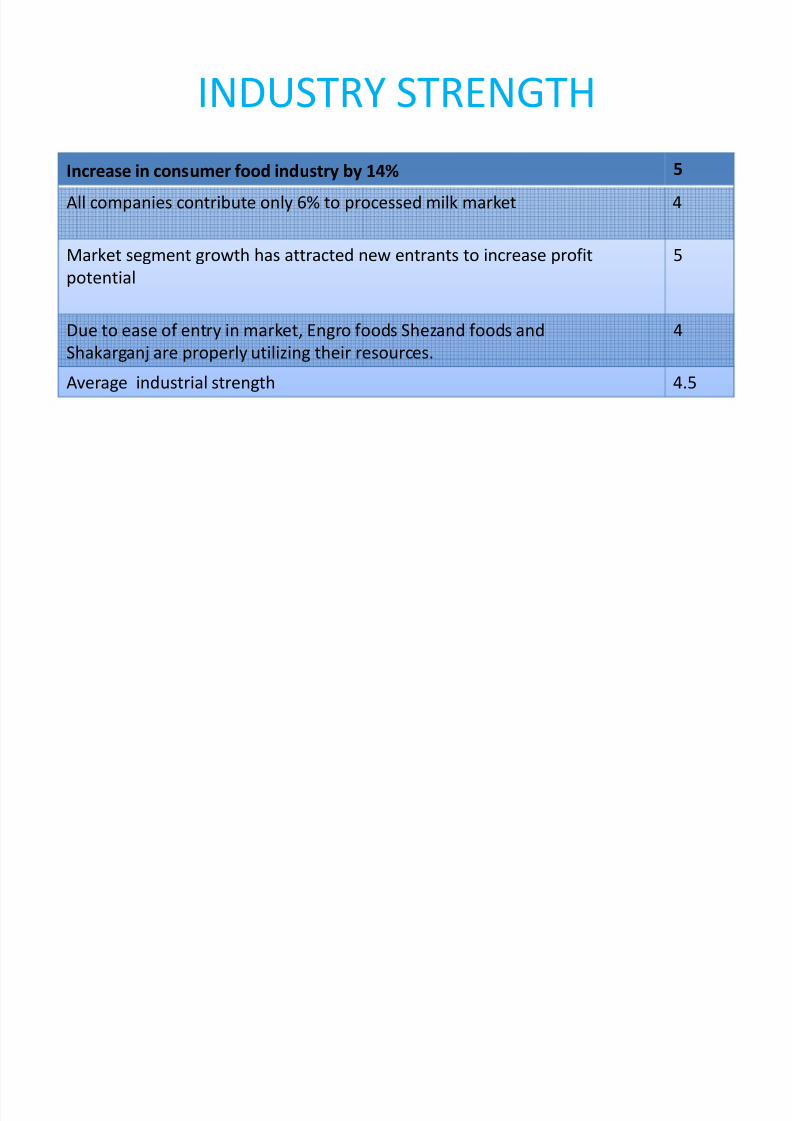
INDUSTRY STRENGTH
Increase in consumer food industry by 14% 5
All companies contribute only 6% to processed milk market 4
Market segment growth has attracted new entrants to increase profit
potential
5
Due to ease of entry in market, Engro foods Shezand foods and
Shakarganj are properly utilizing their resources.
4
Average industrial strength 4.5
8/3/2019 Nestle Junny
http://slidepdf.com/reader/full/nestle-junny 14/32
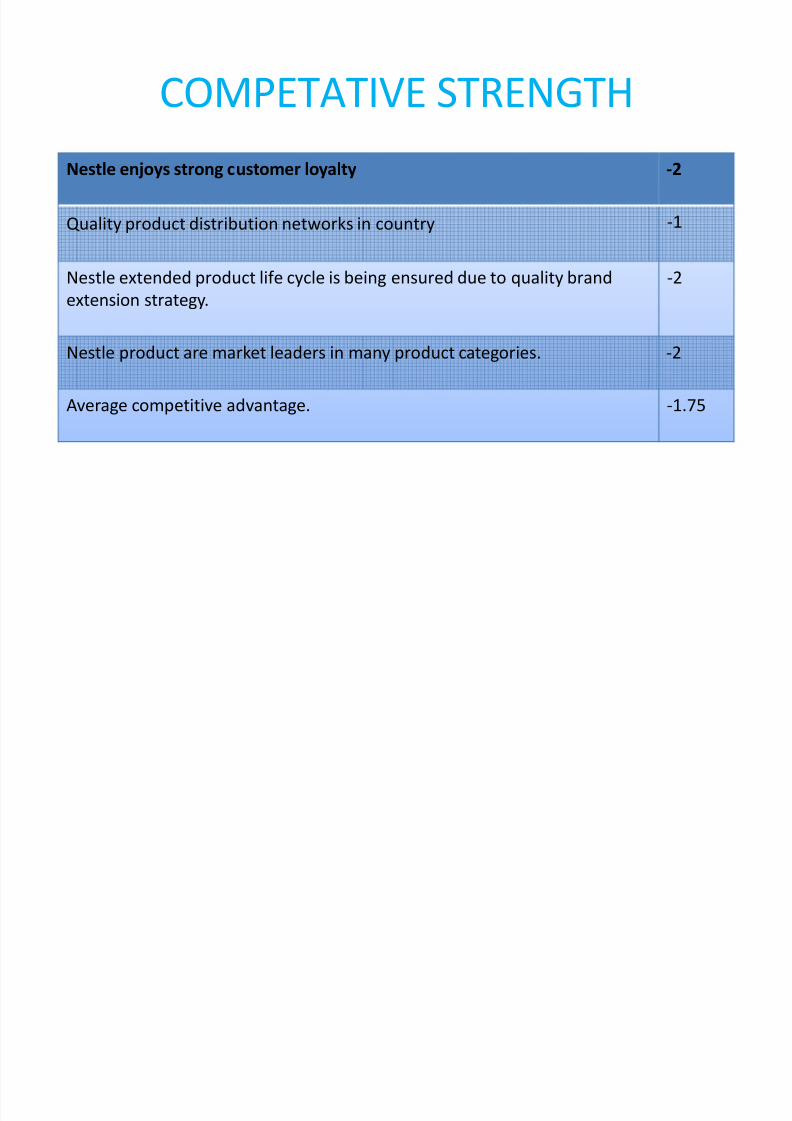
COMPETATIVE STRENGTH
Nestle enjoys strong customer loyalty -2
Quality product distribution networks in country -1
Nestle extended product life cycle is being ensured due to quality brandextension strategy.
-2
Nestle product are market leaders in many product categories. -2
Average competitive advantage. -1.75
8/3/2019 Nestle Junny
http://slidepdf.com/reader/full/nestle-junny 15/32
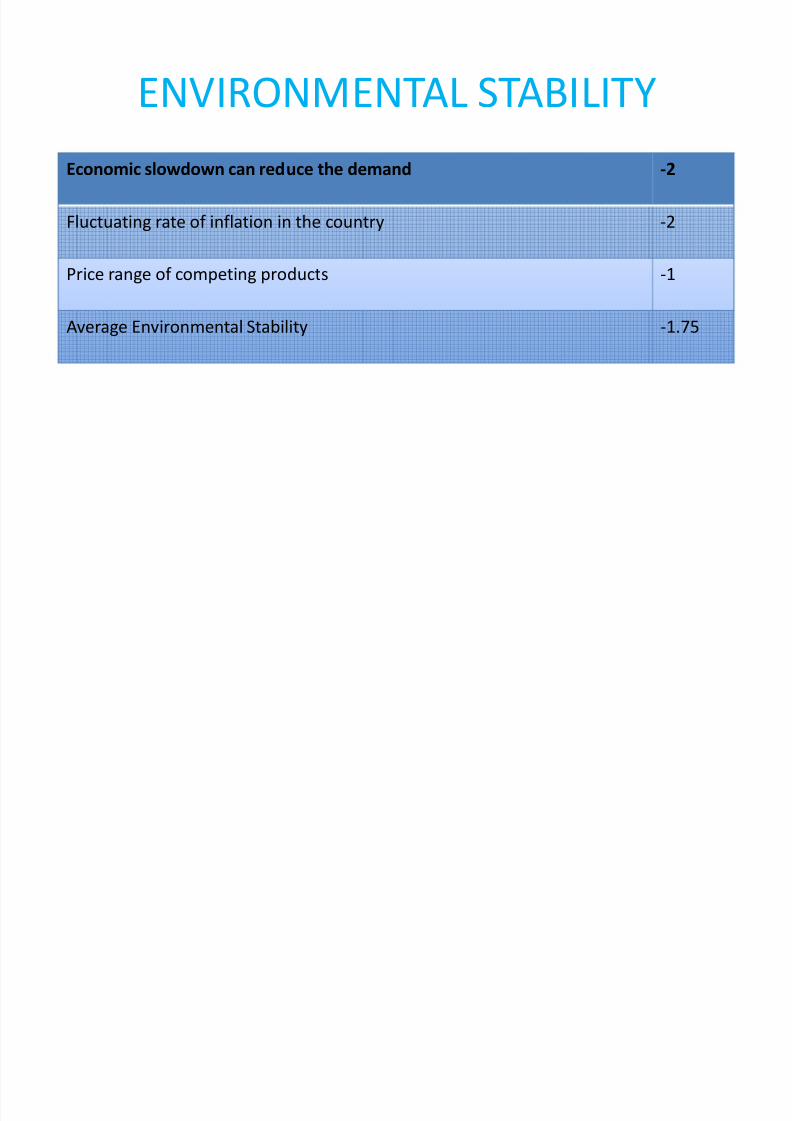
ENVIRONMENTAL STABILITY
Economic slowdown can reduce the demand -2
Fluctuating rate of inflation in the country -2
Price range of competing products -1
Average Environmental Stability -1.75
8/3/2019 Nestle Junny
http://slidepdf.com/reader/full/nestle-junny 16/32
8/3/2019 Nestle Junny
http://slidepdf.com/reader/full/nestle-junny 17/32
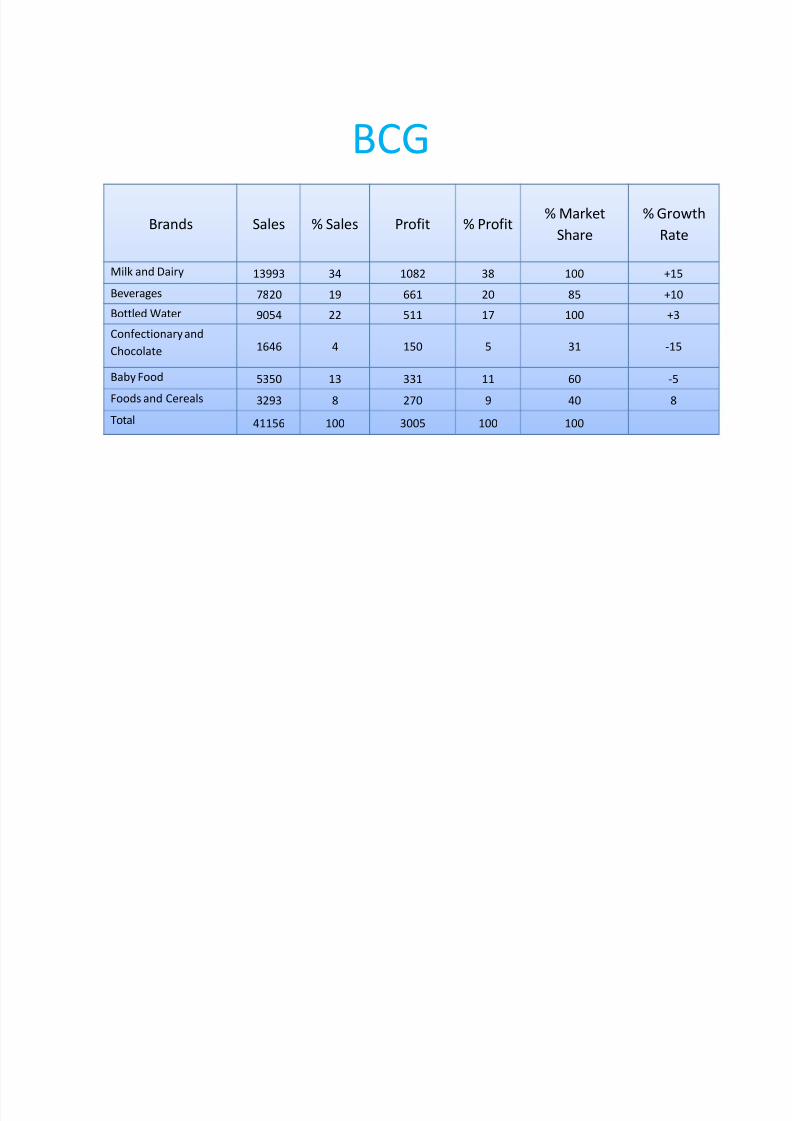
BCG
Brands Sales % Sales Profit % Profit% Market
Share
% Growth
Rate
Milk and Dairy13993 34 1082 38 100 +15
Beverages 7820 19 661 20 85 +10
Bottled Water 9054 22 511 17 100 +3
Confectionary and
Chocolate 1646 4 150 5 31 -15
Baby Food 5350 13 331 11 60 -5
Foods and Cereals 3293 8 270 9 40 8
Total 41156 100 3005 100 100

8/3/2019 Nestle Junny
http://slidepdf.com/reader/full/nestle-junny 18/32
GSMQUADRANT 1 QUADRANT 2
QUADRANT 3 QUADRANT 4

8/3/2019 Nestle Junny
http://slidepdf.com/reader/full/nestle-junny 19/32
QSPM
AcquisitionsShangrilla &
Youngs food
No Aquisitions
Key factors Weights AS TAS AS TAS
OPPERTUNITIES
Few and weak competitors in the market 0.12 4 0.48 2 0.24
Disposable income increased by 3.6% 0.07 - -
Consumer expenditure on food has increased by 3.6% 0.09 3 0.27 1 0.09
Population density increased by 2.18% (per sq.km) 0.05 3 0.15 2 0.10
Credit policy can be adopted to increase sales 0.03 - -
Potential in cold dairy market 0.02 - -
All companies contribute only 2% to processed milk market 0.12 - -
Pakistan as 7th largest milk producing country with milk output of 200 billion l iters0.12 - -
Increase in consumer food industry by 14% 0.05 4 0.20 2 0.10
THREATS
Engro and Shakarganj as major competitors 0.14
Market segment growth could attract new entrants 0.04 3 0.12 4 0.48
Taste of the consumer has already developed 0.02 1 0.02 4 .08
Legal & ethical issues 0.01 - -
Economic slowdown can reduce demand 0.01 2 0.02 3 .03
Effect of seasonality upon sales 0.05 - -
Strong advertisement by major competitors 0.08
1.00
8/3/2019 Nestle Junny
http://slidepdf.com/reader/full/nestle-junny 20/32
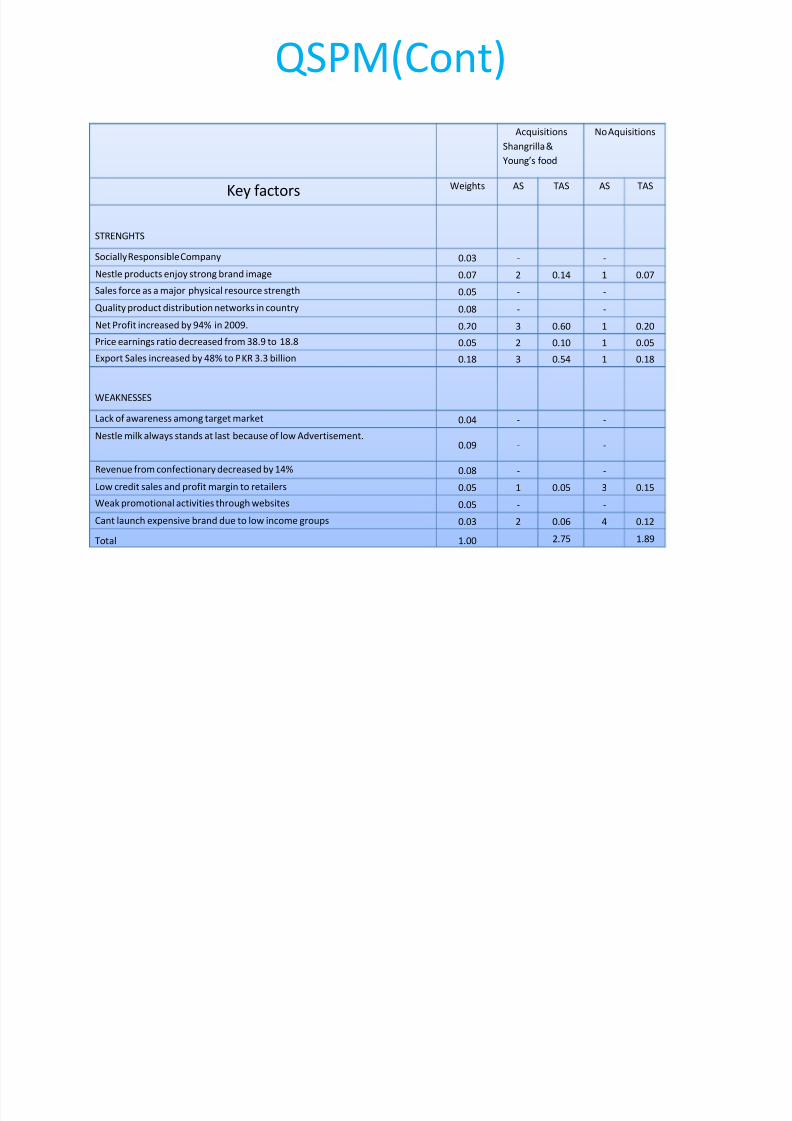
QSPM(Cont)
Acquisitions
Shangrilla &
Youngs food
No Aquisitions
Key factors Weights AS TAS AS TAS
STRENGHTS
Socially Responsible Company 0.03 - -
Nestle products enjoy strong brand image 0.07 2 0.14 1 0.07Sales force as a major physical resource strength 0.05 - -
Quality product distribution networks in country 0.08 - -
Net Profit increased by 94% in 2009. 0.20 3 0.60 1 0.20
Price earnings ratio decreased from 38.9 to 18.8 0.05 2 0.10 1 0.05
Export Sales increased by 48% to PKR 3.3 billion 0.18 3 0.54 1 0.18
WEAKNESSES
Lack of awareness among target market 0.04 - -
Nestle milk always stands at last because of low Advertisement.0.09 - -
Revenue from confectionary decreased by 14% 0.08 - -
Low credit sales and profit margin to retailers 0.05 1 0.05 3 0.15
Weak promotional activities through websites 0.05 - -
Cant launch expensive brand due to low income groups 0.03 2 0.06 4 0.12
Total 1.00 2.75 1.89
8/3/2019 Nestle Junny
http://slidepdf.com/reader/full/nestle-junny 21/32
Annual Objectives of Nestle
Marketing objectives are compatible with the overall corporate objectives of nestle.Companys objective is to be the worlds largest and best branded foodmanufacturer while insuring that nestle name is synonymous with the products of the highest quality.
Its chief objectives are:
To achieve compatibility with international voluntary standards onenvironmental management systems. To build mutual trust with consumers, governmental authorities and businesspartners. To ensure continuous improvement of nestles environmental performance. Conservation of natural resources and minimization of waste. Total compliance with the laws.
To establish the benchmark for good business practice. Employing new technologies and processing. By committing to resources, both human and financial. Measuring the cost and benefits to business of its activities
8/3/2019 Nestle Junny
http://slidepdf.com/reader/full/nestle-junny 22/32
Nestle policies
Nestle basic foundation is unchanged.
The time of origin of our company, and reflects the basic ideas of fairness, honesty and general concern for people.
Nestlé is committed to the following business policies in all countries, taking into account local legislation, cultural and
religious practices.
Nestlé¶s business objective is to manufacture and market the company¶s product in such away as to create value that can
be sustained over the long term for shareholders, employees,consumers, and business partners.
Nestlé¶s does not favor short-term profit at the expense of successful long-term businessdevelopment.
Nestlé¶s recognize that its consumers have a sincere and legitimate interest in the behavior, beliefs and actions of the
company behind brands in which they place their trust, and that without itsconsumers of the company would not exist.
Nestlé¶s believes that, as a general rule, legislation is the most effective safeguard of responsible conduct, although in
certain areas, additional guidance to staff in the form of voluntary business policies is beneficial in order to ensure that the
highest standards are met throughout theorganization.
Nestlé¶s is conscious of the fact that the success of a corporation is a reflection of the professionalism, conduct and the
responsible attitude of its managements and employees.
Therefore recruitment of the right people and ongoing training and development are crucial nestlé¶s continues to maintain
its commitment to follow and respect all applicable local lawsin each of its markets. The policies formed by the Nestlé are for every employee of Nestlé around the world.
The Nestlé brands follow these above mentioned policies and does not make there own policies.
Members of Nestlé are strongly committed to the company, its development, its culture and its policies.
Apart from professional skills and insight, the capacity and willingness to apply these policiesare the main criteria for
progressing in the organization, regardless of origin, nationality, religion,race, gender or age.
8/3/2019 Nestle Junny
http://slidepdf.com/reader/full/nestle-junny 23/32
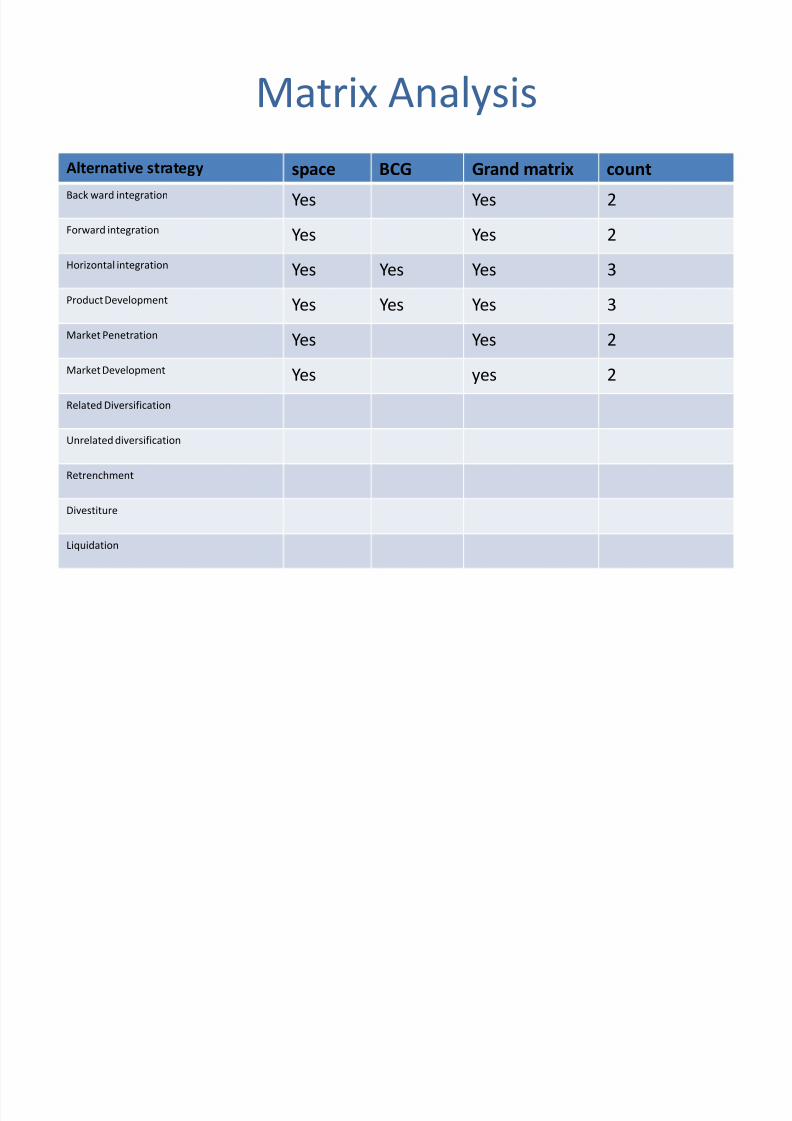
Matrix Analysis
Alternative strategy space BCG Grand matrix count
Back ward integration Yes Yes 2
Forward integration Yes Yes 2
Horizontal integration Yes Yes Yes 3
Product Development Yes Yes Yes 3
Market Penetration Yes Yes 2
Market Development Yes yes 2
Related Diversification
Unrelated diversification
Retrenchment
Divestiture
Liquidation
8/3/2019 Nestle Junny
http://slidepdf.com/reader/full/nestle-junny 24/32
Nestle organizational structure
Moving from Localization strategy to Transnational strategy
Includes first mover advantage, local economies, global web,economies of scale
Strong local responsiveness, but production, training, and R&D
becoming centralized Management practices spread knowledge, create learning effects,
and transfer core competencies
Glocal philosophy and creating value
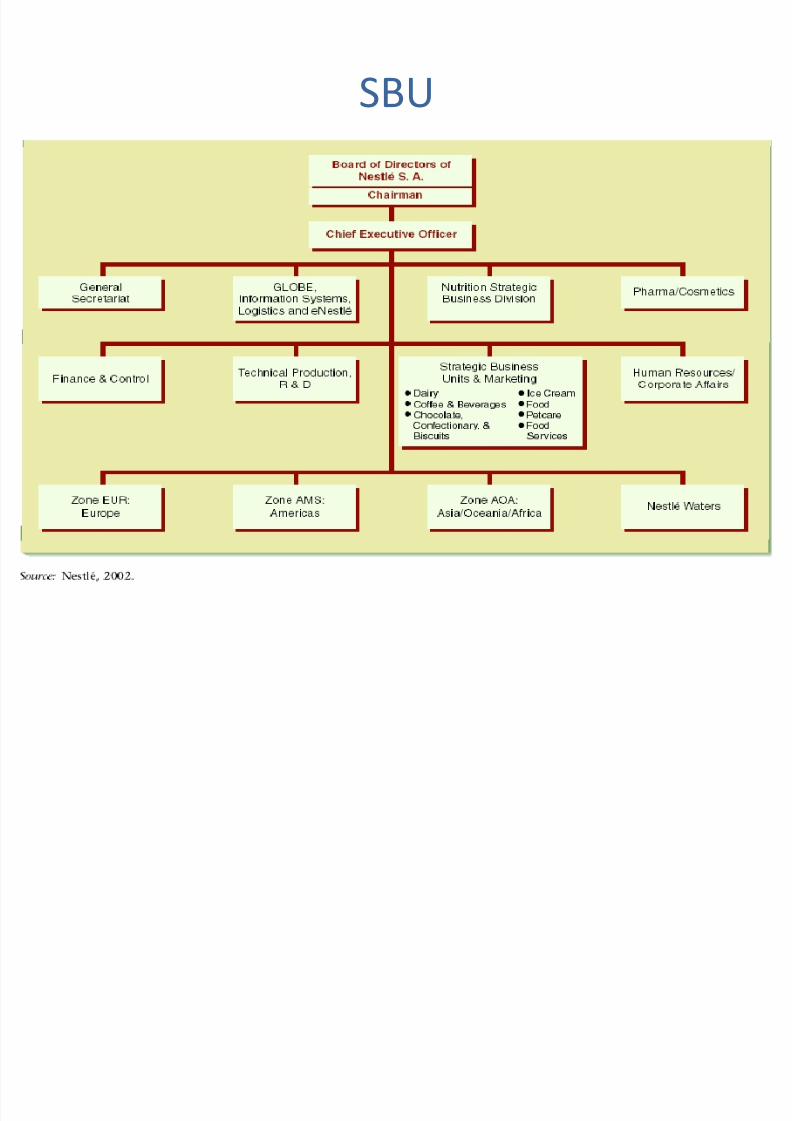
Seven global strategic business units classified by food type (worldwide
production divisional structure) Five regional units by geography (worldwide area structure)
Has created a global matrix structure
Example of a global matrix structure:

8/3/2019 Nestle Junny
http://slidepdf.com/reader/full/nestle-junny 25/32
Functional structure
8/3/2019 Nestle Junny
http://slidepdf.com/reader/full/nestle-junny 26/32
Advanatages and Disadvantages
Advantages :
Ability to react quickly to market structure;
Nestle quickly reintroduce old formula for maggi noodles.
Ability to tailor product;
Nestle product are certified halal in middleast countries.
Standardization of product&practices;Nestle management and leadership principles documents are issued by Head offices.
Disadvantages :
High administrative cost;
Nestle is tryind to cut off 250 job by 2009 in two of their french plants due to high administrative
cost.
Potential conflict of interest due to role ambiguity;
Nestle have mangers dealing with samething in zones,head quarters.

8/3/2019 Nestle Junny
http://slidepdf.com/reader/full/nestle-junny 27/32
Divisional structure
8/3/2019 Nestle Junny
http://slidepdf.com/reader/full/nestle-junny 28/32
Advanatages and Disadvantages
Advantages : Increased accountability and result oriented.
More flexible to market condition.
Easily analysis performance
Disadvantages: Lack of unity creates unhealthy interdivisional competition.
Product standardization is difficult to achieve.
Loss of resources & efficiency due to lack of coordination.
8/3/2019 Nestle Junny
http://slidepdf.com/reader/full/nestle-junny 29/32
SBU

8/3/2019 Nestle Junny
http://slidepdf.com/reader/full/nestle-junny 30/32
Matrix structure
8/3/2019 Nestle Junny
http://slidepdf.com/reader/full/nestle-junny 31/32
Advantages and Disadvantages
Advantages:
Quality of decision making where interests conflict.
Increases managerial motivation.
Development of managers through increased involvement in decisions.
Disadvantages:
Unclear cost and profit responsibilities .
High degrees of conflict.
Dilution of priorities.
'Creeping bureaucracyµ.

8/3/2019 Nestle Junny
http://slidepdf.com/reader/full/nestle-junny 32/32
Horizontal Matrix
Nestle SA expands globally either through its own brand or the acquisitions of
National brands, considering this fact it seems a critical time for Nestle SA to
expand through a National brand.