nomura robot companies 70qr.nomura.co.jp/jp/nrobot/docs/nrobot_report_20180614_e.pdf · fig. 6:...
TRANSCRIPT

Research analysts
Japan quantitative research
Satoshi Yamanaka - NSC [email protected] +81 3 6703 1728
Yuko Onishi - NSC [email protected] +81 3 6703 3915
Nomura Robot Companies 70
EQUITY QUANTITATIVE RESEARCH
Equally weighted index of robot-related stocks
Investing in companies bringing about the robot revolution Index overview and concept The Nomura Robot Companies 70 is an equally weighted index made up of 70 stocks representative of companies that engage in robot-related business.
Stocks are selected using quantitative evaluation indicators based on article search results, from among Japanese listed companies (excluding financials) that have been covered in the media in connection with their robot-related businesses, as determined by scanning big data comprising articles and reports from online and TV news, newspapers, magazines, and the like. "Robot" and several related keywords selected with the use of AI are employed in the search for articles.
With robots as its investment theme, the index invests not only in companies that manufacture robots but also in companies that are actively using robots to pursue new businesses. The index mainly comprises companies in the electric appliances & precision instruments and IT & services, others sectors.
The Japanese government developed the New Robot Strategy and has been promoting technological development related to industrial and service robots and growth in these markets. Robots are viewed as a potential driver of growth as they play a key role in both AI (artificial intelligence) and the IoT (internet of things). The aim of the Nomura Robot Companies 70 is to facilitate investment in companies with robot-related businesses.
Fig. 1: Nomura Robot Companies 70: index performance
Note: 30 November 2001 = 100. We did not take transaction costs into account. Analysis is based on historical share prices and does not guarantee future performance.
Source: Nomura
0
50
100
150
200
250
300
350
400
450
2001/11 2003/11 2005/11 2007/11 2009/11 2011/11 2013/11 2015/11 2017/11
(yyyy/mm)
Nomura Robot Companies 70
TOPIX
Global Markets Research 14 June 2018
Japanese version published on June 14, 2018
See Appendix A-1 for analyst certification, important disclosures and the status of non-US analysts.
Production Complete: 2018-06-19 07:45 UTC

Nomura | Nomura Robot Companies 70 14 June 2018
2
1. Growth in robot-related business
Production of industrial robots has reached an all-time high
Demand for industrial robots used for factory automation and to save labor, by doing humans' jobs for them, has been growing around the world.
According to the Japan Robot Association (JARA), the value of both orders for and production of industrial robots at Japanese companies reached respective record highs in 2017. The reason for this growth is the rapid increase in Japanese exports of industrial robots to Asia, including China, where the Chinese government has been aggressively promoting automation as part of its state-sponsored "Made in China 2025 strategy". JARA expects the value of robot production by Japanese companies to reach ¥1trn in 2018.
In addition, according to the International Federation of Robotics (IFR), global supply of industrial robots has grown for four straight years, with particularly strong growth in demand for robots in connection with electrical and electronic products. It also estimates average annual growth of 15% through 2020. More than 70% of industrial robots produced in Japan are exported, and these robots account for more than half of global industrial robot supply, by volume. We therefore expect the Japanese industrial robot production market to continue to grow.
Fig. 2: Japanese robot shipment value/volume and 2018 production forecast
Note: 2018 production forecast is based on Japan Robot Association data.
Source: Nomura, based on Japan Robot Association and Nikkei Sangyo Shimbun data
0
50
100
150
200
250
0
200
400
600
800
1,000
('000 units)(¥bn)
(CY)
Productionforecast
Exports
Domesticshipments
Total shipmentvolume (rhs)

Nomura | Nomura Robot Companies 70 14 June 2018
3
Fig. 3: Global industrial robot supply forecasts
Source: IFR World Robotics 2017
Government measures aimed at promoting the robot revolution
The Japanese government created the New Robot Strategy in 2015, and has been putting in place measures aimed at realizing a "robot revolution" that will generate new value added, improve convenience, and create wealth, through the use of robots in a wide range of areas from the factory floor to everyday life. The government has also been implementing measures aimed at a promoting the fourth industrial revolution1 since 2016, and measures aimed at the realization of Society 5.02 since 2017. Because robots play an important role in both of these sets of measures, they have accounted for a large part of their respective budgets.
In order to realize the “robot revolution”, as well as working to boost Japan's ability to create robots, government departments have also set specific strategic targets (key performance indicators) in the five areas of (a) manufacturing, (b) services, (c) long-term care and medical treatment, (d) infrastructure, disaster response, and construction, and (e) agriculture, forestry, fisheries, and food, with the aim of increasing the use of robots.
In manufacturing industries, most of the robots used are industrial robots. In this area, the government’s main priority is to encourage the introduction of robots to increase automation in the assembly, processing, and preparation of components, and companies are also training up systems integrators to assist with this. In service industries, the government is encouraging the introduction of robots in the areas of logistics, wholesaling and retailing, and restaurants/hotels, and service robots that provide cleaning, security, and reception desk services, for example, are becoming an increasingly common sight.
In the area of long-term care, the government is promoting the use of robots to help people to walk (personal mobility suits) and to support body movements (power assist suits), while in the area of medical treatment it is encouraging the introduction of robots to assist with surgery. In infrastructure, disaster response, and construction, it is encouraging the use of robots mainly to increase efficiency by moving to unmanned or automated processes, while in agriculture, forestry, and fisheries, robots are increasingly being used to operate tractors automatically, and in the food industry they are being used to improve product quality, for example.
1 The fourth industrial revolution is the fourth industrial revolution resulting from new technologies such as artificial intelligence (AI), the Internet of Things (IoT), and big data. 2 Society 5.0 is a new kind of economy/society, following on from hunter-gatherer societies, agricultural societies, industrial societies, and information-based societies.
0
100
200
300
400
500
600
2008 2009 2010 2011 2012 2013 2014 2015 2016 2017E 2018E 2019E 2020E
('000 units)
(CY)

Nomura | Nomura Robot Companies 70 14 June 2018
4
Fig. 4: Steps taken in five key areas under the New Robot Strategy
Note: Text highlighted in red indicates robot-related keywords (see later), while text in brackets has been added by the authors of this report.
Source: Nomura, based on Robot Revolution Realization Council’s "New Robot Strategy", etc
Increase in robot-related businesses and breakdown of growth
Based on its estimates of domestic production volumes through 2035, METI and Japan’s New Energy and Industrial Technology Development Organization (NEDO) forecast that the Japanese industrial robot market as a whole, including both industrial and service robots, will grow to ¥2.9trn in 2020 and ¥9.7trn in 2035 (Figure 5). It expects particularly rapid growth in services.
Figure 6 shows the average of the breakdowns of forecasts for different years for five areas in which the government is encouraging the introduction of robots, as discussed above. Industrial robots and robots related to automobiles and electrical machinery account for nearly half of the forecast market, but market growth is expected from the use of robots in the areas of consumer electronics/housing facilities/maintenance-related and logistics-related services, and long-term care/medical treatment and the agriculture/forestry/fisheries industries too.
When considering investment in robot-related businesses, it might be possible to invest in companies that are likely to achieve growth as a result of expansion of the robot market by considering the allocation of funds not just to manufacturing industries but also to other industries that use robots.
Manufacturing
• Introduction of robots in labor-intensive areas such as component assembly and processing
• Introduction of robots in preparation processes, etc (manipulators, electric actuators, etc)
• Training of systems integrators to act as a link between users and manufacturers
• Moving towards standardization of robot modules and creation of shared infrastructure (realization of ubiquitous networks)
Services
• Introduction of robots in areas such as logistics, wholesaling and retailing, and restaurants/hotels, etc
• Solving problem of labor shortages and improving productivity in service industries
• Use of next-generation parts and technologies to automate reception desk services (use of humanoid-type robots, etc)
Long-term care/
medical treatment
• Helping people to move from their beds (using power assistsuits and muscle suits)
• Helping people to walk (using personal mobility suits)
• Toilet (excretion) support
• Keeping an eye on people suffering from dementia
• Bathing support
• Increasing uptake of medical equipment such as surgical support robots
• Faster assessment of new medical equipment
Infrastructure/disaster response/construction
• Dealing with labor shortages by using robots to save labor and automate processes on construction sites
• Using robots to inspect infrastructure and improve the efficiency and sophistication of maintenance/ management services
• Use of disaster survey robots to speed up the damage assessment process
• Full automation of work on landslide sites
Agriculture/forestry/fisheries industries and
food industry
• Achieving large-scale low-cost production through use of GPS autonomous driving systems, for example, in agricultural machinery such as tractors
• Mechanization/ automation of heavy labor through use of assist suits and weeding robots, for example
• Saving labor and achieving high-quality production through high-spec environmental control systems and damage detection robots, for example, and big data analysis

Nomura | Nomura Robot Companies 70 14 June 2018
5
Fig. 5: Robot industry market size forecasts through 2035
Source: Nomura, based on METI/New Energy and Industrial Technology Development Organization (NEDO) 2010 data
Fig. 6: Breakdown of robot industry market forecasts, by area
Note: Shows average breakdown, by area, of robot industry forecasts for 2015, 2020, 2025, and 2035.
Source: Nomura, based on METI/New Energy and Industrial Technology Development Organization (NEDO) 2010 data
1.6
2.9
5.3
9.7
0
2
4
6
8
10
2015 2020 2025 2035
(¥trn)
(CY)
Services
Agriculture/forestry/fisheries
Robotec (RT) products
Manufacturing
31.9
9.2 4.7
15.5 12.4
3.5 2.9 3.4 5.5
2.3 1.5 4.1 3.2
0
10
20
30
40
Indu
stria
l rob
ots
Auto
mob
ile-re
late
d
Elec
trica
l mac
hine
ry
Con
sum
er e
lect
roni
cs/
hous
ing
faci
litie
s/m
aint
enan
ce-re
late
d
Logi
stic
s-re
late
d
Ente
rtain
men
t/le
isur
e-re
late
d
Mov
emen
t/hou
sew
ork
supp
ort-r
elat
ed
Med
ical
trea
tmen
t/lo
ng-te
rm c
are/
wel
fare
Hea
lth m
anag
emen
t
Ship
ping
/railw
ays/
cons
truct
ion
mac
hine
ry
Educ
atio
n/re
scue
-rela
ted
Agric
ultu
re/fo
rest
ry/
fishe
ries
indu
stry
Food
indu
stry
(%)Manufacturing Services Long-term care/
medical treatmentInfrastructure/
disaster response/construction
Agriculture/forestry/fisheries industries and food industry
Nomura | Nomura Robot Companies 70 14 June 2018
6
2. Nomura Robot Companies 70 stock selection
Quantitatively selected based on results of searches of online and TV news, newspapers, magazines, and other media
The Nomura Robot Companies 70 is an equally weighted index made up of 70 stocks of companies covered by the media in connection with business related to robots. Financial sectors3 are excluded from the index, however. It is a theme-specific index enabling focused investment in companies associated with robots, uptake of which has been proceeding apace in the manufacturing and service industries.
The stock selection process uses the results of searches for articles in online and TV news, newspapers, magazines, and other media. "Robot" and several related keywords selected with the use of AI are employed to search for articles.
Related keywords are selected using AI
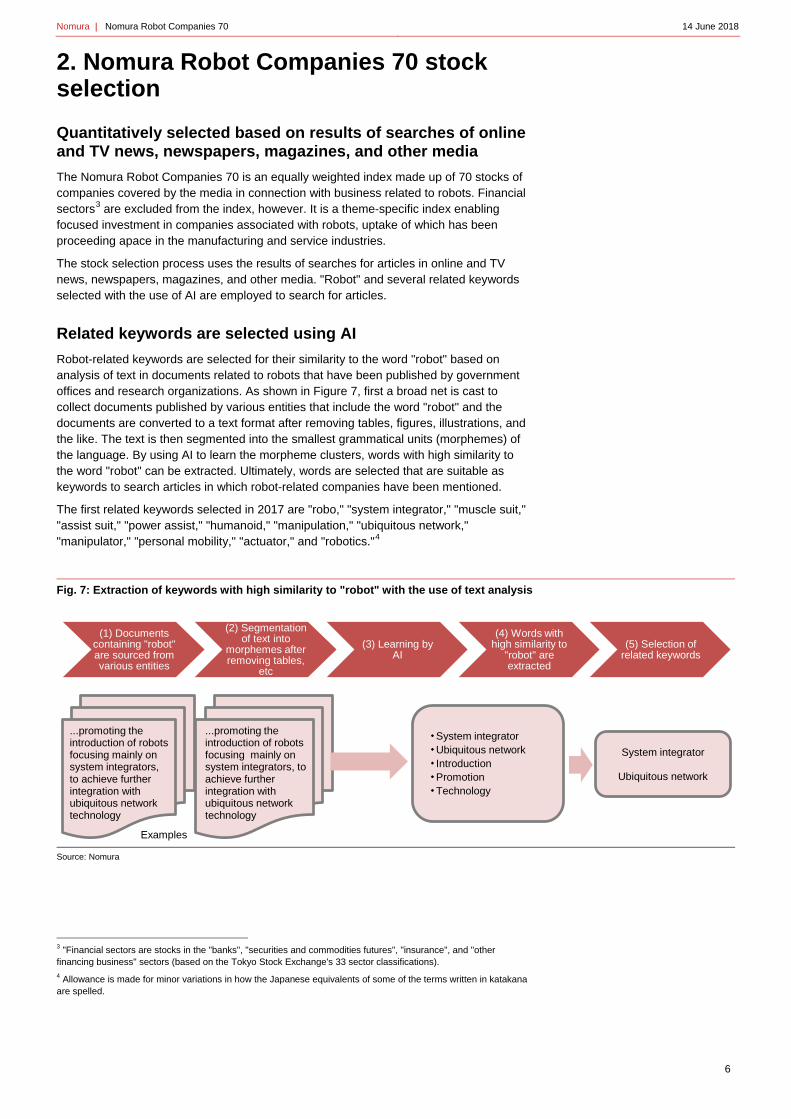
Robot-related keywords are selected for their similarity to the word "robot" based on analysis of text in documents related to robots that have been published by government offices and research organizations. As shown in Figure 7, first a broad net is cast to collect documents published by various entities that include the word "robot" and the documents are converted to a text format after removing tables, figures, illustrations, and the like. The text is then segmented into the smallest grammatical units (morphemes) of the language. By using AI to learn the morpheme clusters, words with high similarity to the word "robot" can be extracted. Ultimately, words are selected that are suitable as keywords to search articles in which robot-related companies have been mentioned.
The first related keywords selected in 2017 are "robo," "system integrator," "muscle suit," "assist suit," "power assist," "humanoid," "manipulation," "ubiquitous network," "manipulator," "personal mobility," "actuator," and "robotics."4
Fig. 7: Extraction of keywords with high similarity to "robot" with the use of text analysis
Source: Nomura
3 "Financial sectors are stocks in the "banks", "securities and commodities futures", "insurance", and "other financing business" sectors (based on the Tokyo Stock Exchange's 33 sector classifications). 4 Allowance is made for minor variations in how the Japanese equivalents of some of the terms written in katakana are spelled.
・ System integrator・ Ubiquitous network・ Introduction・ Promotion・ Technology
(1) Documents containing "robot" are sourced from various entities
(2) Segmentation of text into
morphemes after removing tables,
etc
(3) Learning by AI
(4) Words with high similarity to
"robot" are extracted
(5) Selection of related keywords
...promoting the introduction of robots focusing mainly on system integrators, to achieve further integration with ubiquitous network technology
...promoting the introduction of robots focusing mainly on system integrators, to achieve further integration with ubiquitous network technology
System integrator
Ubiquitous network
Examples

Nomura | Nomura Robot Companies 70 14 June 2018
7
Fig. 8: Quantitative indicators for related keywords
Note: Shows data for April 2012 through December 2017.
Source: Nomura, based on government and think tank data
The similarity of each term is shown in the top portion of Figure 8. Similarity shows how close a word is to "robot"; the closer to 1, the greater the similarity. The word "robot" is in widespread use, and compared with more specialized terms, related keywords tend to show lower levels of similarity.
The lower part of Figure 8 breaks down the number of times the keywords were mentioned in documents containing "robot." "Robotics" and "robo" appeared most frequently, followed by "actuator" and "manipulator."
“Actuators” are devices that convert energy or electric signals into mechanical or physical motion. “Manipulators” are devices used to perform actions similar to those carried out by the human hand, and are also known as robotic arms. Both are used mainly in the manufacturing domain. “Humanoid” is used to describe an external appearance or movements similar to those of humans, and the term is used particularly frequently in the context of service robots. Although they occurred less frequently, the terms "muscle suit," "assist suit," and "power assist" have been in the spotlight in the logistics and long-term care fields, and there is a wide expectation that related devices will lessen the physical toll associated with, for example, lifting and lowering freight items, or helping a care receiver get out of bed.
0.25
0.30
0.35
0.40
0.45 Similarity to "robot"
0
10
20
30
40
50
(%) Frequency of appearance

Nomura | Nomura Robot Companies 70 14 June 2018
8
Stock selection using Nomura AI Thematic Stock Search (NAITS)
Figure 9 shows the flow of steps involved in selecting stocks. Here we give a simplified overview of the rules. Please refer to the Nomura Robot Companies 70 index rulebook for a more detailed description of the stock selection process.
Stocks for inclusion are selected from the score calculation universe of common stocks (excluding the financials sector) listed on exchanges in Japan that are in the top 98% in terms of market cap and in the top 90% in terms of average market turnover. In the interest of investability, stocks with extremely low market caps or low liquidity are not included.
Online and TV news, newspapers, magazines, and other media are searched for the mention of stocks in the score calculation universe. "Robot" and several related keywords selected with the use of AI are employed to search for articles.
First, the robot ranking score is calculated for every stock. The number of articles in the past two years containing both the stock's ticker code and the term "robot" is calculated for every stock once a year, and the total robot article score is obtained by doubling the figure for the most recent year. Each stock's ranking in terms of total article score is its robot ranking score, with rankings in ascending order starting with the stock with the highest number of articles.
Next, the number of articles containing the stock's ticker code and related keywords but not the term "robot" is calculated in the same way as for the robot ranking score. Each stock's ranking in terms of total related keyword article score is its keyword ranking score, with rankings in ascending order starting with the stock with the highest number of articles.
Finally, the top 10 stocks in terms of robot ranking score and the top 60 stocks in terms of the average of robot ranking score and keyword ranking score, ranked in ascending order, are selected as the constituent stocks of the Nomura Robot Companies 70.
Fig. 9: Nomura Robot Companies 70 stock selection flow diagram
Source: Nomura
*Excludes financial sectors *Priority given to existing selections
Stock selection universe
Score calculation universe
Screening for liquidity, etc
Calculation of robot ranking
score
Calculation of related keyword ranking score
Robot Companies 70
constituent stocks
Articles search
Selection of related
keywords using AI
Reflects private-sector articles "big data"
Reflects industrial policy of government agencies
Top 10 stocks by robot ranking
score +Selection of top
stocks by average

Nomura | Nomura Robot Companies 70 14 June 2018
9
Fig. 10: Flow chart showing article search and stock selection for the Nomura Robot Companies 70 Index (2018)
Source: Nomura
The 70 stocks in the index are weighted equally on the periodic reconfiguration date. By making it an equally weighted index, a flat rate of investment is made in not only large cap but also small and midcap robot-related stocks. Robot-related keywords are reviewed annually and published in August. The periodic reconfiguration is carried out on the first business day of December.
We call this stock selection methodology the Nomura AI Thematic Stock Search (NAITS). By using private sector article big data, while also reflecting government agencies' industrial policies, it is possible to select as investment targets companies that are attracting attention on many fronts.
Although "robot" is the investment theme in this report, thematic stock search can be used for other investment themes as well by searching articles with related keywords selected using AI. Yamanaka/Onishi (2017a, 2017b) describe stock selection carried out using AI and Abenomics as the investment themes. In Matsuura/Motomura/Fujita/Yamanaka/Onishi (2017a, 2017b, 2017c) stock selection was based on the investment themes of working practice reforms, healthy life expectancy, human resource investment, and education, and in Suimon/Yamanaka/Onishi (2017), stock selection was based on the investment theme of the fourth industrial revolution. For working practice reforms, a large proportion of stocks were in the electrical machinery and construction sectors, while for fourth industrial revolution, a large proportion of stocks selected came from the electrical machinery and information & communication sectors. Another advantage of this methodology is that it makes it possible to ascertain quantitatively and over time which companies and sectors see spillover effects of macro policy or important keywords.
Each stock is given a score
based on number of articles
2017 article score
2018 article score
×1
×2
+
2018
Robot ranking score
Robot
Each stock is given a score
based on number of articles
×1
×2
2018
Related keyword ranking score
Robo System integrator Muscle suit
Assist suitPower
assistHumanoid
Manipulation Ubiquitous network Manipulator
Personal mobility Actuator Robotics
2017 article score
2018 article score
+
Top 10 stocks based on
robot ranking score+
Top 60 stocks based on averag of
both ranking scores
*Priority given to existing
selections
2018
Nomura Robot
Companies 70
constituent stocks
Nomura | Nomura Robot Companies 70 14 June 2018
10
3. Nomura Robot Companies 70 performance and industry/style mix characteristics
Outperforming TOPIX
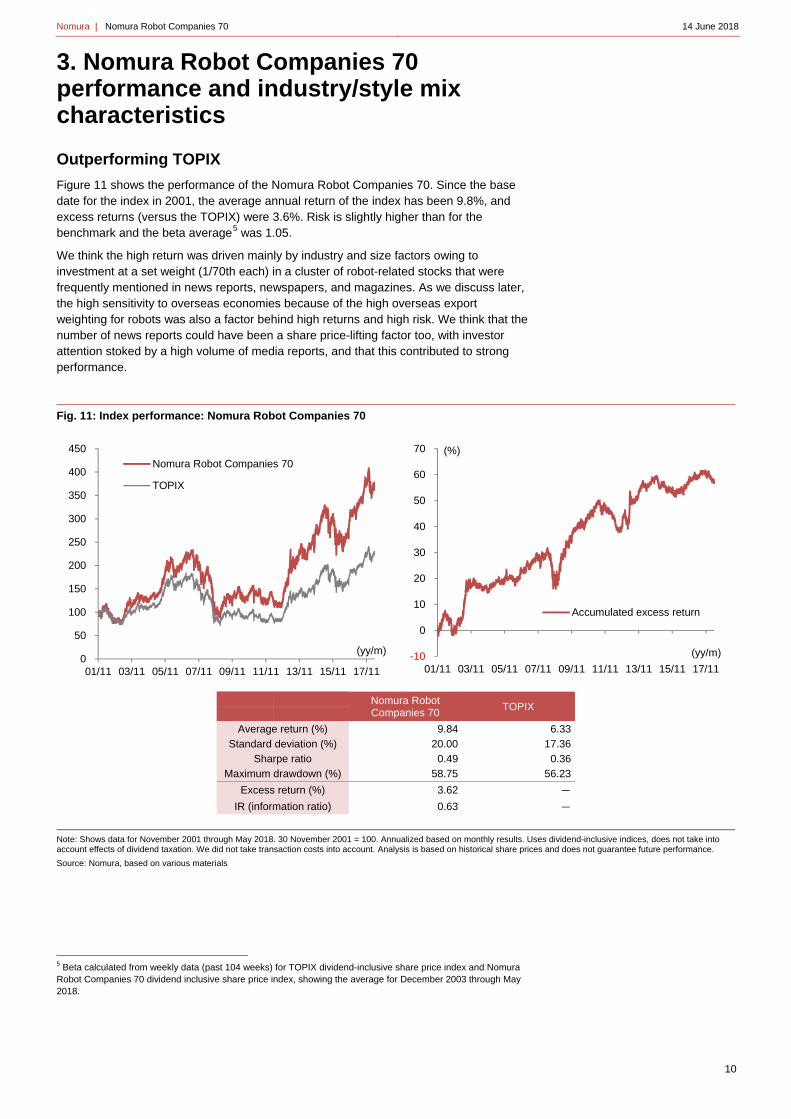
Figure 11 shows the performance of the Nomura Robot Companies 70. Since the base date for the index in 2001, the average annual return of the index has been 9.8%, and excess returns (versus the TOPIX) were 3.6%. Risk is slightly higher than for the benchmark and the beta average5 was 1.05.
We think the high return was driven mainly by industry and size factors owing to investment at a set weight (1/70th each) in a cluster of robot-related stocks that were frequently mentioned in news reports, newspapers, and magazines. As we discuss later, the high sensitivity to overseas economies because of the high overseas export weighting for robots was also a factor behind high returns and high risk. We think that the number of news reports could have been a share price-lifting factor too, with investor attention stoked by a high volume of media reports, and that this contributed to strong performance.
Fig. 11: Index performance: Nomura Robot Companies 70
Nomura Robot Companies 70
TOPIX
Average return (%) 9.84 6.33
Standard deviation (%) 20.00 17.36
Sharpe ratio 0.49 0.36
Maximum drawdown (%) 58.75 56.23
Excess return (%) 3.62 -
IR (information ratio) 0.63 -
Note: Shows data for November 2001 through May 2018. 30 November 2001 = 100. Annualized based on monthly results. Uses dividend-inclusive indices, does not take into account effects of dividend taxation. We did not take transaction costs into account. Analysis is based on historical share prices and does not guarantee future performance.
Source: Nomura, based on various materials
5 Beta calculated from weekly data (past 104 weeks) for TOPIX dividend-inclusive share price index and Nomura Robot Companies 70 dividend inclusive share price index, showing the average for December 2003 through May 2018.
0
50
100
150
200
250
300
350
400
450
01/11 03/11 05/11 07/11 09/11 11/11 13/11 15/11 17/11
Nomura Robot Companies 70
TOPIX
(yy/m) -10
0
10
20
30
40
50
60
70
01/11 03/11 05/11 07/11 09/11 11/11 13/11 15/11 17/11
Accumulated excess return
(%)
(yy/m)

Nomura | Nomura Robot Companies 70 14 June 2018
11
Index centered around electric appliances & precision instruments and IT & services sectors
Figure 12 shows the average sector composition of the Nomura Robot Companies 70. The top chart shows average sector weights at the time of the periodic reconfigurations carried out from 2001 through 2017, based on TOPIX-17 Series sectors. The bottom chart shows the average excess weight for each sector in the index calculated by subtracting the industry weight for each year from its weight in the TOPIX.
As we are talking about robot-related stocks, the (excess) weighting of electric appliances & precision instruments, IT & services, others, automobiles & transportation equipment and machinery was quite large during this period, but the weighting of commercial & wholesale trade, where robots are mainly used in the services field, also exceeded that in the TOPIX. There were no constituent stocks in the pharmaceuticals and energy resources sectors in the past, and financial-related sectors were excluded based on the rules6, so these sectors were therefore underweight.
Fig. 12: Average sector composition of Nomura Robot Companies 70
Note: Shows average sector weights as of the periodic reconfiguration date (the first business day of December) each year from 2001 through 2017. Sectors based on TOPIX-17 sectors.
Source: Nomura, based on various sources
6 With "robots" as the investment theme, even if financial sectors were not excluded based on the rules, the sector would have been underweight in the past as only a small proportion of financial sector stocks were selected for the theme by nature.
32.5
17.8 15.0
10.1 7.0
4.3 3.3 2.7 2.6 1.7 1.5 1.5
0
10
20
30
40
Ele
ctric
app
lianc
es
& p
reci
sion
inst
rum
ents
IT &
ser
vice
s, o
ther
s
Au
tom
obile
s &
tran
spor
tatio
neq
uipm
ent
Mac
hine
ry
Com
mer
cial
&w
hole
sale
tra
de
Ele
ctric
pow
er &
gas
Con
stru
ctio
n &
mat
eria
ls
Ste
el &
non
ferr
ous
met
als
Ret
ail t
rade
Tra
nsp
orta
tion
&lo
gist
ics
Raw
ma
teria
ls &
che
mic
als
Oth
er
(%)Average sector weighting
17.4
6.3 5.6 4.2 2.7 0.6
-0.3 -0.8 -1.1 -1.7 -1.7 -2.6 -3.3 -4.6 -5.5 -5.6
-9.6
-20
-10
0
10
20
Ele
ctric
app
lianc
es
& p
reci
sion
inst
rum
ents
IT &
ser
vice
s,ot
hers
Mac
hine
ry
Au
tom
obile
s &
tran
spor
tatio
n eq
uip
men
t
Com
mer
cial
&w
hole
sale
tra
de
Ele
ctric
pow
er&
gas
Ste
el &
non
ferr
ous
met
als
Con
stru
ctio
n &
mat
eria
ls
En
ergy
res
our
ces
Rea
l est
ate
Ret
ail t
rade
Foo
ds
Tra
nsp
orta
tion
&lo
gist
ics
Ph
arm
aceu
tical
Raw
ma
teria
ls &
che
mic
als
Fin
anci
als
(ex
bank
s)
Ba
nks
(%)Average sector excess weighting (vs TOPIX)

Nomura | Nomura Robot Companies 70 14 June 2018
12
Gradual increase in weighting of services-related sectors
Figure 13 shows the sector breakdown of the Nomura Robot Companies 70 index. The four types of red or pink shading indicate manufacturing-related sectors while the four types of black or grey shading mainly indicate services-related sectors. In the past, manufacturing-related sectors used to account for around 60% of robot-related sectors, but in recent years the percentage of services-related companies in the index has increased gradually, rising above 40% in 2017. The market forecasts issued by METI and NEDO that we referred to earlier indicate expectations for market growth in services-related areas, and we see this as a natural reflection of business expansion.
Recently, there has been a particularly sharp increase in the retail trade sector's weighting in the index. Retailers have been improving efficiency by using robots to manage their products and introducing unmanned outlets, for example, and they have also been introducing cleaning robots and humanoid-type reception robots. Companies operating service robot-related businesses have been attracting attention.
Fig. 13: Sector composition of Nomura Robot Companies 70
Note: Shows average sector weighting on periodic reconfiguration date (the first business day of December) every year. Sectors based on TOPIX-17 sectors. ”Manufacturing, others” comprises the construction & materials, steel & nonferrous metals, and raw materials & chemicals sectors. “Services, others” comprises the transportation & logistics, electric power & gas, foods, and real estate sectors.
Source: Nomura
Index is weighted towards small- and mid-cap stocks
We then looked at the average composition of the Nomura Robot Companies 70 index in terms of style from 2001 through 2017 in order to investigate the style of the stocks making up the index.
As Figure 14 shows, compared to the TOPIX, the Nomura Robot Companies 70 index is weighted towards small-cap and mid-cap stocks. Over the period of our analysis, the average percentage of the Nomura Robot Companies 70 index accounted for by small-cap and mid-cap stocks was around 8ppt higher than the equivalent percentage in the TOPIX and around 5ppt higher than the equivalent percentage in the Nikkei 225.
Meanwhile, when we looked at the composition of the index in terms of value and growth, we found that, over the period of our analysis, the percentage of the Nomura Robot
61 62 63 61 63
71 74
64 68 69 67 68
63 68 67
62
56
0
10
20
30
40
50
60
70
80
90
100
2001 2002 2003 2004 2005 2006 2007 2008 2009 2010 2011 2012 2013 2014 2015 2016 2017
IT & services, others
Commercial & wholesale trade
Retail trade
Services, others
Manufacturing, others
Machinery
Automobiles & transportationequipment
Electric appliances & precisioninstruments
Total manufacturing
(%)

Nomura | Nomura Robot Companies 70 14 June 2018
13
Companies 70 index accounted for by growth stocks was on average around 2ppt higher than the equivalent percentage in the TOPIX, but this is not a large difference.
Fig. 14: Composition of Nomura Robot Companies 70 by style
Note: Analysis covers period from November 2001 through May 2018. We classified stocks of each index in terms of styles by Russell/Nomura Japan Equity Indexes and then calculating the total weighing for each style with use of each index composition. We then calculated the average of the monthly figures, for each style.
Source: Nomura
High exposure to earnings quality, sensitivity to overseas economy
In order to identify the source of returns (risk factors) for the Nomura Robot Companies 70, we looked at average excess factor exposure (versus TOPIX) in the period from 2001 through 2017.
With exposure to earnings quality and sensitivity to the overseas economy particularly high, we can see that a large proportion of investment was into companies where cash income accounted for a large proportion of profits and companies with a high weighting of overseas sales and high forex sensitivity. As we noted at the beginning of this report, the overseas export ratio is generally high for Japan's industrial robots, and we need to be aware of the relatively large overseas economy-related risk for these companies that are constituent stocks of the Nomura Robot Companies 70, but we also think that they were the source of high returns when economic conditions were good in the past.
Size nonlinearity excess exposure is positive, consistent with mid caps accounting for a large proportion of stock holdings, but the impact was small compared to other risk factors.
41.3 49.4 46.0
47.5 35.6 48.9
11.2 15.0 5.1
0
20
40
60
80
100
Nomura RobotCompanies 70
TOPIX Nikkei 225
Small Cap
Mid Cap
Top Cap
(%) Breakdown by size
51.7 49.8 62.2
48.3 50.2 37.8
0
20
40
60
80
100
Nomura Robot Companies 70 TOPIX Nikkei 225
Value
Growth
(%) Breakdown by value/growth

Nomura | Nomura Robot Companies 70 14 June 2018
14
Fig. 15: Nomura Robot Companies 70 excess factor exposure (vs TOPIX)
Note: Sample period is 2001-17. Shows average exposure on periodic reconfiguration date (the first business day of December) every year.
Source: Nomura, based on MSCI Barra
0.380.34
0.310.26
0.190.14
0.11 0.100.07 0.06 0.05
0.01 0.00
-0.00 -0.02 -0.02 -0.02-0.06 -0.08 -0.10
-0.2
-0.1
0.0
0.1
0.2
0.3
0.4
0.5E
arn
ings
qua
lity
For
eign
sen
sitiv
ity
Fin
anci
al le
vera
ge
Liqu
idity
Res
idu
al v
olat
ility
Be
ta
Mac
ro s
ensi
tivity
Non
linea
r si
ze
Mem
bers
hip
in N
K22
5
Long
-ter
m r
ever
sal
Ea
rnin
gs y
ield
Indu
stry
mom
entu
m
Sh
ort-
term
rev
ersa
l
Va
lue
Siz
e
Gro
wth
Se
ntim
ent
Pro
spec
t
Man
agem
ent
Mom
entu
m
Nomura | Nomura Robot Companies 70 14 June 2018
15
Reference materials
Nomura Robot Companies 70 index rulebook, Nomura Equity Quantitative Research (Index) report, 14 June 2018
Suimon, Y., S. Yamanaka and Y. Onishi (2017), Screening for fourth industrial revolution stocks using AI, Nomura Equity Quantitative Research report, 26 May 2017
Matsuura, H., M. Motomura, K. Fujita, S. Yamanaka, and Y. Onishi (2017a), Screening for relevant stocks with AI (1), Nomura Japan Strategy report, 16 May 2017
Matsuura, H., M. Motomura, K. Fujita, S. Yamanaka, and Y. Onishi (2017b) Screening for relevant stocks with AI (2), Nomura Japan Strategy report, 31 May 2017
Matsuura, H., M. Motomura, K. Fujita, S. Yamanaka, and Y. Onishi (2017c) Screening for relevant stocks with AI (3), Nomura Japan Strategy report, 14 June 2017
Yamanaka, S. and Y. Onishi (2017a), Nomura AI Companies 70, Nomura Equity Quantitative Research report, 25 January 2017
Yamanaka, S. and Y. Onishi (2017b), AI gijyutsu no shin chouryuu to toushi teima meigara sentei e no ouyou (New trends in AI technology and applications for investment theme stock selection), Zaikei Kansoku vol 80 (2), pp 22-41 (Only in Japanese)
Index disclaimer The Nomura Robot Companies 70 is released by Nomura Securities Co., Ltd. ("Nomura") and its intellectual and all other rights belong to Nomura. Nomura does not guarantee the accuracy, completeness, reliability, usefulness, marketability, merchantability or fitness of the index, and does not take any responsibility for business activities or services that any index user and/or its affiliates undertakes with the use of the index.
A license agreement with Nomura Securities is required to use the index and access detailed data.
In the case of an unavoidable event such as computer breakdown or natural disaster, calculation of the index may be delayed or suspended.
While every effort is made to ensure that the information used in this report and all published information is based on reliable data, it should be noted that data may be changed or amended when necessary.
The index is not related to Nikkei Inc. and is not endorsed or guaranteed by Nikkei Inc.
Nomura | Nomura Robot Companies 70 14 June 2018
16
Appendix A-1
Analyst Certification
We, Satoshi Yamanaka and Yuko Onishi, hereby certify (1) that the views expressed in this Research report accurately reflect our personal views about any or all of the subject securities or issuers referred to in this Research report, (2) no part of our compensation was, is or will be directly or indirectly related to the specific recommendations or views expressed in this Research report and (3) no part of our compensation is tied to any specific investment banking transactions performed by Nomura Securities International, Inc., Nomura International plc or any other Nomura Group company.
Important Disclosures The lists of issuers that are affiliates or subsidiaries of Nomura Holdings Inc., the parent company of Nomura Securities Co., Ltd., issuers that have officers who concurrently serve as officers of Nomura Securities Co., Ltd., issuers in which the Nomura Group holds 1% or more of any class of common equity securities and issuers for which Nomura Securities Co., Ltd. has lead managed a public offering of equity or equity linked securities in the past 12 months are available at http://www.nomuraholdings.com/report/. Please contact the Research Product Management Dept. of Nomura Securities Co., Ltd. for additional information. Online availability of research and conflict-of-interest disclosures Nomura Group research is available on www.nomuranow.com/research, Bloomberg, Capital IQ, Factset, Reuters and ThomsonOne. Important disclosures may be read at http://go.nomuranow.com/research/globalresearchportal/pages/disclosures/disclosures.aspx or requested from Nomura Securities International, Inc., or Instinet, LLC on 1-877-865-5752. If you have any difficulties with the website, please email [email protected] for help. The analysts responsible for preparing this report have received compensation based upon various factors including the firm's total revenues, a portion of which is generated by Investment Banking activities. Unless otherwise noted, the non-US analysts listed at the front of this report are not registered/qualified as research analysts under FINRA rules, may not be associated persons of NSI or ILLC, and may not be subject to FINRA Rule 2241 restrictions on communications with covered companies, public appearances, and trading securities held by a research analyst account. Nomura Global Financial Products Inc. (“NGFP”) Nomura Derivative Products Inc. (“NDPI”) and Nomura International plc. (“NIplc”) are registered with the Commodities Futures Trading Commission and the National Futures Association (NFA) as swap dealers. NGFP, NDPI, and NIplc are generally engaged in the trading of swaps and other derivative products, any of which may be the subject of this report. Distribution of ratings (Nomura Group) The distribution of all ratings published by Nomura Group Global Equity Research is as follows: 51% have been assigned a Buy rating which, for purposes of mandatory disclosures, are classified as a Buy rating; 42% of companies with this rating are investment banking clients of the Nomura Group*. 0% of companies (which are admitted to trading on a regulated market in the EEA) with this rating were supplied material services** by the Nomura Group. 43% have been assigned a Neutral rating which, for purposes of mandatory disclosures, is classified as a Hold rating; 51% of companies with this rating are investment banking clients of the Nomura Group*. 0% of companies (which are admitted to trading on a regulated market in the EEA) with this rating were supplied material services by the Nomura Group 6% have been assigned a Reduce rating which, for purposes of mandatory disclosures, are classified as a Sell rating; 6% of companies with this rating are investment banking clients of the Nomura Group*. 0% of companies (which are admitted to trading on a regulated market in the EEA) with this rating were supplied material services by the Nomura Group. As at 31 March 2018. *The Nomura Group as defined in the Disclaimer section at the end of this report. ** As defined by the EU Market Abuse Regulation Distribution of ratings (Instinet, LLC) The distribution of all ratings published by Instinet, LLC Equity Research is as follows: 61% have been assigned a Buy rating which, for purposes of mandatory disclosures, are classified as a Buy rating; Instinet LLC has provided investment banking services to 0% of companies with this rating within the previous 12 months. 35% have been assigned a Neutral rating which, for purposes of mandatory disclosures, is classified as a Hold rating; Instinet LLC has provided investment banking services to 0% of companies with this rating within the previous 12 months. 4% have been assigned a Reduce rating which, for purposes of mandatory disclosures, are classified as a Sell rating; Instinet LLC has provided investment banking services to 0% of companies with this rating within the previous 12 months. Definition of Nomura Group's equity research rating system and sectors The rating system is a relative system, indicating expected performance against a specific benchmark identified for each individual stock, subject to limited management discretion. An analyst’s target price is an assessment of the current intrinsic fair value of the stock based on an appropriate valuation methodology determined by the analyst. Valuation methodologies include, but are not limited to, discounted cash flow analysis, expected return on equity and multiple analysis. Analysts may also indicate expected absolute upside/downside relative to the stated target price, defined as (target price - current price)/current price. STOCKS A rating of 'Buy', indicates that the analyst expects the stock to outperform the Benchmark over the next 12 months. A rating of 'Neutral', indicates that the analyst expects the stock to perform in line with the Benchmark over the next 12 months. A rating of 'Reduce', indicates that the analyst expects the stock to underperform the Benchmark over the next 12 months. A rating of 'Suspended', indicates that the rating, target price and estimates have been suspended temporarily to comply with applicable regulations and/or firm policies. Securities and/or companies that are labelled as 'Not rated' or shown as 'No rating' are not in regular research coverage. Investors should not expect continuing or

Nomura | Nomura Robot Companies 70 14 June 2018
17
additional information from Nomura relating to such securities and/or companies. Benchmarks are as follows: United States/Europe/Asia ex-Japan: please see valuation methodologies for explanations of relevant benchmarks for stocks, which can be accessed at: http://go.nomuranow.com/research/globalresearchportal/pages/disclosures/disclosures.aspx; Global Emerging Markets (ex-Asia): MSCI Emerging Markets ex-Asia, unless otherwise stated in the valuation methodology; Japan: Russell/Nomura Large Cap. SECTORS A 'Bullish' stance, indicates that the analyst expects the sector to outperform the Benchmark during the next 12 months. A 'Neutral' stance, indicates that the analyst expects the sector to perform in line with the Benchmark during the next 12 months. A 'Bearish' stance, indicates that the analyst expects the sector to underperform the Benchmark during the next 12 months. Sectors that are labelled as 'Not rated' or shown as 'N/A' are not assigned ratings. Benchmarks are as follows: United States: S&P 500; Europe: Dow Jones STOXX 600; Global Emerging Markets (ex-Asia): MSCI Emerging Markets ex-Asia. Japan/Asia ex-Japan: Sector ratings are not assigned. Target Price A Target Price, if discussed, indicates the analyst’s forecast for the share price with a 12-month time horizon, reflecting in part the analyst's estimates for the company's earnings. The achievement of any target price may be impeded by general market and macroeconomic trends, and by other risks related to the company or the market, and may not occur if the company's earnings differ from estimates. Disclaimers This publication contains material that has been prepared by the Nomura Group entity identified on page 1 and, if applicable, with the contributions of one or more Nomura Group entities whose employees and their respective affiliations are specified on page 1 or identified elsewhere in the publication. The term "Nomura Group" used herein refers to Nomura Holdings, Inc. and its affiliates and subsidiaries including: Nomura Securities Co., Ltd. ('NSC') Tokyo, Japan; Nomura International plc ('NIplc'), UK; Nomura Securities International, Inc. ('NSI'), New York, US; Instinet, LLC ('ILLC'); Nomura International (Hong Kong) Ltd. (‘NIHK’), Hong Kong; Nomura Financial Investment (Korea) Co., Ltd. (‘NFIK’), Korea (Information on Nomura analysts registered with the Korea Financial Investment Association ('KOFIA') can be found on the KOFIA Intranet at http://dis.kofia.or.kr); Nomura Singapore Ltd. (‘NSL’), Singapore (Registration number 197201440E, regulated by the Monetary Authority of Singapore); Nomura Australia Ltd. (‘NAL’), Australia (ABN 48 003 032 513), regulated by the Australian Securities and Investment Commission ('ASIC') and holder of an Australian financial services licence number 246412; PT Nomura Sekuritas Indonesia (‘PTNSI’); Nomura Securities Malaysia Sdn. Bhd. (‘NSM’), Malaysia; NIHK, Taipei Branch (‘NITB’), Taiwan; Nomura Financial Advisory and Securities (India) Private Limited (‘NFASL’), Mumbai, India (Registered Address: Ceejay House, Level 11, Plot F, Shivsagar Estate, Dr. Annie Besant Road, Worli, Mumbai- 400 018, India; Tel: +91 22 4037 4037, Fax: +91 22 4037 4111; CIN No: U74140MH2007PTC169116, SEBI Registration No. for Stock Broking activities : BSE INB011299030, NSE INB231299034, INF231299034, INE 231299034, MCX: INE261299034; SEBI Registration No. for Merchant Banking : INM000011419; SEBI Registration No. for Research: INH000001014 and NIplc, Madrid Branch (‘NIplc, Madrid’). ‘CNS Thailand’ next to an analyst’s name on the front page of a research report indicates that the analyst is employed by Capital Nomura Securities Public Company Limited (‘CNS’) to provide research assistance services to NSL under an agreement between CNS and NSL. ‘NSFSPL’ next to an employee’s name on the front page of a research report indicates that the individual is employed by Nomura Structured Finance Services Private Limited to provide assistance to certain Nomura entities under inter-company agreements. The "BDO-NS" (which stands for "BDO Nomura Securities, Inc.") placed next to an analyst’s name on the front page of a research report indicates that the analyst is employed by BDO Unibank Inc. ("BDO Unibank") who has been seconded to BDO-NS, to provide research assistance services to NSL under an agreement between BDO Unibank, NSL and BDO-NS. BDO-NS is a Philippines securities dealer, which is a joint venture between BDO Unibank and the Nomura Group. THIS MATERIAL IS: (I) FOR YOUR PRIVATE INFORMATION, AND WE ARE NOT SOLICITING ANY ACTION BASED UPON IT; (II) NOT TO BE CONSTRUED AS AN OFFER TO SELL OR A SOLICITATION OF AN OFFER TO BUY ANY SECURITY IN ANY JURISDICTION WHERE SUCH OFFER OR SOLICITATION WOULD BE ILLEGAL; AND (III) OTHER THAN DISCLOSURES RELATING TO THE NOMURA GROUP, BASED UPON INFORMATION FROM SOURCES THAT WE CONSIDER RELIABLE, BUT HAS NOT BEEN INDEPENDENTLY VERIFIED BY NOMURA GROUP. Other than disclosures relating to the Nomura Group, the Nomura Group does not warrant or represent that the document is accurate, complete, reliable, fit for any particular purpose or merchantable and does not accept liability for any act (or decision not to act) resulting from use of this document and related data. To the maximum extent permissible all warranties and other assurances by the Nomura Group are hereby excluded and the Nomura Group shall have no liability for the use, misuse, or distribution of this information. Opinions or estimates expressed are current opinions as of the original publication date appearing on this material and the information, including the opinions and estimates contained herein, are subject to change without notice. The Nomura Group is under no duty to update this document. Any comments or statements made herein are those of the author(s) and may differ from views held by other parties within Nomura Group. Clients should consider whether any advice or recommendation in this report is suitable for their particular circumstances and, if appropriate, seek professional advice, including tax advice. The Nomura Group does not provide tax advice. The Nomura Group, and/or its officers, directors and employees, may, to the extent permitted by applicable law and/or regulation, deal as principal, agent, or otherwise, or have long or short positions in, or buy or sell, the securities, commodities or instruments, or options or other derivative instruments based thereon, of issuers or securities mentioned herein. The Nomura Group companies may also act as market maker or liquidity provider (within the meaning of applicable regulations in the UK) in the financial instruments of the issuer. Where the activity of market maker is carried out in accordance with the definition given to it by specific laws and regulations of the US or other jurisdictions, this will be separately disclosed within the specific issuer disclosures. This document may contain information obtained from third parties, including ratings from credit ratings agencies such as Standard & Poor’s. Reproduction and distribution of third-party content in any form is prohibited except with the prior written permission of the related third-party. Third-party content providers do not guarantee the accuracy, completeness, timeliness or availability of any information, including ratings, and are not responsible for any errors or omissions (negligent or otherwise), regardless of the cause, or for the results obtained from the use of such content. Third-party content providers give no express or implied warranties, including, but not limited to, any warranties of merchantability or fitness for a particular purpose or use. Third-party content providers shall not be liable for any direct, indirect, incidental, exemplary, compensatory, punitive, special or consequential damages, costs, expenses, legal fees, or losses (including lost income or profits and opportunity costs) in connection with any use of their content, including ratings. Credit ratings are statements of opinions and are not statements of fact or recommendations to purchase hold or sell securities. They do not address the suitability of securities or the suitability of securities for investment purposes, and should not be relied on as investment advice. Any MSCI sourced information in this document is the exclusive property of MSCI Inc. (‘MSCI’). Without prior written permission of MSCI, this information and any other MSCI intellectual property may not be reproduced, re-disseminated or used to create any financial products, including any indices. This information is provided on an "as is" basis. The user assumes the entire risk of any use made of this information. MSCI, its affiliates and any third party involved in, or related to, computing or compiling the information hereby expressly disclaim all warranties of

Nomura | Nomura Robot Companies 70 14 June 2018
18
originality, accuracy, completeness, merchantability or fitness for a particular purpose with respect to any of this information. Without limiting any of the foregoing, in no event shall MSCI, any of its affiliates or any third party involved in, or related to, computing or compiling the information have any liability for any damages of any kind. MSCI and the MSCI indexes are services marks of MSCI and its affiliates. The intellectual property rights and any other rights, in Russell/Nomura Japan Equity Index belong to Nomura Securities Co., Ltd. ("Nomura") and Frank Russell Company ("Russell"). Nomura and Russell do not guarantee accuracy, completeness, reliability, usefulness, marketability, merchantability or fitness of the Index, and do not account for business activities or services that any index user and/or its affiliates undertakes with the use of the Index. Investors should consider this document as only a single factor in making their investment decision and, as such, the report should not be viewed as identifying or suggesting all risks, direct or indirect, that may be associated with any investment decision. Nomura Group produces a number of different types of research product including, among others, fundamental analysis and quantitative analysis; recommendations contained in one type of research product may differ from recommendations contained in other types of research product, whether as a result of differing time horizons, methodologies or otherwise. The Nomura Group publishes research product in a number of different ways including the posting of product on the Nomura Group portals and/or distribution directly to clients. Different groups of clients may receive different products and services from the research department depending on their individual requirements. Figures presented herein may refer to past performance or simulations based on past performance which are not reliable indicators of future performance. Where the information contains an indication of future performance, such forecasts may not be a reliable indicator of future performance. Moreover, simulations are based on models and simplifying assumptions which may oversimplify and not reflect the future distribution of returns. Any figure, strategy or index created and published for illustrative purposes within this document is not intended for “use” as a “benchmark” as defined by the European Benchmark Regulation. Certain securities are subject to fluctuations in exchange rates that could have an adverse effect on the value or price of, or income derived from, the investment. With respect to Fixed Income Research: Recommendations fall into two categories: tactical, which typically last up to three months; or strategic, which typically last from 6-12 months. However, trade recommendations may be reviewed at any time as circumstances change. ‘Stop loss’ levels for trades are also provided; which, if hit, closes the trade recommendation automatically. Prices and yields shown in recommendations are taken at the time of submission for publication and are based on either indicative Bloomberg, Reuters or Nomura prices and yields at that time. The prices and yields shown are not necessarily those at which the trade recommendation can be implemented. The securities described herein may not have been registered under the US Securities Act of 1933 (the ‘1933 Act’), and, in such case, may not be offered or sold in the US or to US persons unless they have been registered under the 1933 Act, or except in compliance with an exemption from the registration requirements of the 1933 Act. Unless governing law permits otherwise, any transaction should be executed via a Nomura entity in your home jurisdiction. This document has been approved for distribution in the UK and European Economic Area as investment research by NIplc. NIplc is authorised by the Prudential Regulation Authority and regulated by the Financial Conduct Authority and the Prudential Regulation Authority. NIplc is a member of the London Stock Exchange. This document does not constitute a personal recommendation within the meaning of applicable regulations in the UK, or take into account the particular investment objectives, financial situations, or needs of individual investors. This document is intended only for investors who are 'eligible counterparties' or 'professional clients' for the purposes of applicable regulations in the UK, and may not, therefore, be redistributed to persons who are 'retail clients' for such purposes. This document has been approved by NIHK, which is regulated by the Hong Kong Securities and Futures Commission, for distribution in Hong Kong by NIHK. This document has been approved for distribution in Australia by NAL, which is authorized and regulated in Australia by the ASIC. This document has also been approved for distribution in Malaysia by NSM. In Singapore, this document has been distributed by NSL. NSL accepts legal responsibility for the content of this document, where it concerns securities, futures and foreign exchange, issued by their foreign affiliates in respect of recipients who are not accredited, expert or institutional investors as defined by the Securities and Futures Act (Chapter 289). Recipients of this document in Singapore should contact NSL in respect of matters arising from, or in connection with, this document. Unless prohibited by the provisions of Regulation S of the 1933 Act, this material is distributed in the US, by NSI, a US-registered broker-dealer, which accepts responsibility for its contents in accordance with the provisions of Rule 15a-6, under the US Securities Exchange Act of 1934. The entity that prepared this document permits its separately operated affiliates within the Nomura Group to make copies of such documents available to their clients. This document has not been approved for distribution to persons other than ‘Authorised Persons’, ‘Exempt Persons’ or ‘Institutions’ (as defined by the Capital Markets Authority) in the Kingdom of Saudi Arabia (‘Saudi Arabia’) or 'professional clients' (as defined by the Dubai Financial Services Authority) in the United Arab Emirates (‘UAE’) or a ‘Market Counterparty’ or ‘Business Customers’ (as defined by the Qatar Financial Centre Regulatory Authority) in the State of Qatar (‘Qatar’) by Nomura Saudi Arabia, NIplc or any other member of the Nomura Group, as the case may be. Neither this document nor any copy thereof may be taken or transmitted or distributed, directly or indirectly, by any person other than those authorised to do so into Saudi Arabia or in the UAE or in Qatar or to any person other than ‘Authorised Persons’, ‘Exempt Persons’ or ‘Institutions’ located in Saudi Arabia or 'professional clients' in the UAE or a ‘Market Counterparty’ or ‘Business Customers’ in Qatar . By accepting to receive this document, you represent that you are not located in Saudi Arabia or that you are an ‘Authorised Person’, an ‘Exempt Person’ or an ‘Institution’ in Saudi Arabia or that you are a 'professional client' in the UAE or a ‘Market Counterparty’ or ‘Business Customers’ in Qatar and agree to comply with these restrictions. Any failure to comply with these restrictions may constitute a violation of the laws of the UAE or Saudi Arabia or Qatar. Notice to Canadian Investors: This research report is not a personal recommendation and does not take into account the investment objectives, financial situation or particular needs of any particular individual or account. It is made available to you in reliance on NI 31-103, section 8.25. For report with reference of TAIWAN public companies or authored by Taiwan based research analyst: THIS DOCUMENT IS SOLELY FOR REFERENCE ONLY. You should independently evaluate the investment risks and are solely responsible for your investment decisions. NO PORTION OF THE REPORT MAY BE REPRODUCED OR QUOTED BY THE PRESS OR ANY OTHER PERSON WITHOUT WRITTEN AUTHORIZATION FROM NOMURA GROUP. Pursuant to Operational Regulations Governing Securities Firms Recommending Trades in Securities to Customers and/or other applicable laws or regulations in Taiwan, you are prohibited to provide the reports to others (including but not limited to related parties, affiliated companies and any other third parties) or engage in any activities in connection with the reports which may involve conflicts of interests. INFORMATION ON SECURITIES / INSTRUMENTS NOT EXECUTABLE BY NOMURA INTERNATIONAL (HONG KONG) LTD., TAIPEI BRANCH IS FOR INFORMATIONAL PURPOSES ONLY AND IS NOT BE CONSTRUED AS A RECOMMENDATION OR A SOLICITATION TO TRADE IN SUCH SECURITIES / INSTRUMENTS. NO PART OF THIS MATERIAL MAY BE (I) COPIED, PHOTOCOPIED, OR DUPLICATED IN ANY FORM, BY ANY MEANS; OR (II) REDISTRIBUTED WITHOUT THE PRIOR WRITTEN CONSENT OF A MEMBER OF THE NOMURA GROUP. If this document has been distributed by electronic transmission, such as e-mail, then such transmission cannot be guaranteed to be secure or error-free as information could be intercepted, corrupted, lost, destroyed, arrive late or incomplete, or contain viruses. The sender therefore does not accept liability for any errors or omissions in the contents of this document, which may arise as a result of electronic transmission. If verification is required, please request a hard-copy version. ------ Disclaimers required in Japan

Nomura | Nomura Robot Companies 70 14 June 2018
19
Credit ratings in the text that are marked with an asterisk (*) are issued by a rating agency not registered under Japan’s Financial Instruments and Exchange Act (“Unregistered Ratings”). For details on Unregistered Ratings, please contact the Research Product Management Dept. of Nomura Securities Co., Ltd. Investors in the financial products offered by Nomura Securities may incur fees and commissions specific to those products (for example, transactions involving Japanese equities are subject to a sales commission (all figures on a tax-inclusive basis) of up to 1.404% of the transaction amount or a commission of ¥2,808 for transactions of ¥200,000 or less, while transactions involving investment trusts are subject to various fees, such as commissions at the time of purchase and asset management fees (trust fees), specific to each investment trust). In addition, all products carry the risk of losses owing to price fluctuations or other factors. Fees and risks vary by product. Please thoroughly read the written materials provided, such as documents delivered before making a contract, listed securities documents, or prospectuses. ------ Transactions involving Japanese equities (including Japanese REITs, Japanese ETFs, and Japanese ETNs) are subject to a sales commission of up to 1.404% of the transaction amount (or a commission of ¥2,808 for transactions of ¥200,000 or less). When Japanese equities are purchased via OTC transactions (including offerings), only the purchase price shall be paid, with no sales commission charged. However, Nomura Securities may charge a separate fee for OTC transactions, as agreed with the customer. Japanese equities carry the risk of losses owing to price fluctuations. Japanese REITs carry the risk of losses owing to fluctuations in price and/or earnings of underlying real estate. Japanese ETFs carry the risk of losses owing to fluctuations in the underlying indexes or other benchmarks. Transactions involving foreign equities are subject to a domestic sales commission of up to 1.026% of the transaction amount (which equals the local transaction amount plus local fees and taxes in the case of a purchase or the local transaction amount minus local fees and taxes in the case of a sale) (for transaction amounts of ¥750,000 and below, maximum domestic sales commission is ¥7,668). Local fees and taxes in foreign financial instruments markets vary by country/territory. When foreign equities are purchased via OTC transactions (including offerings), only the purchase price shall be paid, with no sales commission charged. However, Nomura Securities may charge a separate fee for OTC transactions, as agreed with the customer. Foreign equities carry the risk of losses owing to factors such as price fluctuations and foreign exchange rate fluctuations. Margin transactions are subject to a sales commission of up to 1.404% of the transaction amount (or a commission of ¥2,808 for transactions of ¥200,000 or less), as well as management fees and rights handling fees. In addition, long margin transactions are subject to interest on the purchase amount, while short margin transactions are subject to fees for the lending of the shares borrowed. A margin equal to at least 30% of the transaction amount (at least 33% for online transactions) and at least ¥300,000 is required. With margin transactions, an amount up to roughly 3.3x the margin (roughly 3x for online transactions) may be traded. Margin transactions therefore carry the risk of losses in excess of the margin owing to share price fluctuations. For details, please thoroughly read the written materials provided, such as listed securities documents or documents delivered before making a contract. Transactions involving convertible bonds are subject to a sales commission of up to 1.08% of the transaction amount (or a commission of ¥4,320 if this would be less than ¥4,320). When convertible bonds are purchased via OTC transactions (including offerings), only the purchase price shall be paid, with no sales commission charged. However, Nomura Securities may charge a separate fee for OTC transactions, as agreed with the customer. Convertible bonds carry the risk of losses owing to factors such as interest rate fluctuations and price fluctuations in the underlying stock. In addition, convertible bonds denominated in foreign currencies also carry the risk of losses owing to factors such as foreign exchange rate fluctuations. When bonds are purchased via public offerings, secondary distributions, or other OTC transactions with Nomura Securities, only the purchase price shall be paid, with no sales commission charged. Bonds carry the risk of losses, as prices fluctuate in line with changes in market interest rates. Bond prices may also fall below the invested principal as a result of such factors as changes in the management and financial circumstances of the issuer, or changes in third-party valuations of the bond in question. In addition, foreign currency-denominated bonds also carry the risk of losses owing to factors such as foreign exchange rate fluctuations. When Japanese government bonds (JGBs) for individual investors are purchased via public offerings, only the purchase price shall be paid, with no sales commission charged. As a rule, JGBs for individual investors may not be sold in the first 12 months after issuance. When JGBs for individual investors are sold before maturity, an amount calculated via the following formula will be subtracted from the par value of the bond plus accrued interest: (1) for 10-year variable rate bonds, an amount equal to the two preceding coupon payments (before tax) x 0.79685 will be used, (2) for 5-year and 3-year fixed rate bonds, an amount equal to the two preceding coupon payments (before tax) x 0.79685 will be used. When inflation-indexed JGBs are purchased via public offerings, secondary distributions (uridashi deals), or other OTC transactions with Nomura Securities, only the purchase price shall be paid, with no sales commission charged. Inflation-indexed JGBs carry the risk of losses, as prices fluctuate in line with changes in market interest rates and fluctuations in the nationwide consumer price index.The notional principal of inflation-indexed JGBs changes in line with the rate of change in nationwide CPI inflation from the time of its issuance. The amount of the coupon payment is calculated by multiplying the coupon rate by the notional principal at the time of payment. The maturity value is the amount of the notional principal when the issue becomes due. For JI17 and subsequent issues, the maturity value shall not undercut the face amount. Purchases of investment trusts (and sales of some investment trusts) are subject to a purchase or sales fee of up to 5.4% of the transaction amount. Also, a direct cost that may be incurred when selling investment trusts is a fee of up to 2.0% of the unit price at the time of redemption. Indirect costs that may be incurred during the course of holding investment trusts include, for domestic investment trusts, an asset management fee (trust fee) of up to 5.4% (annualized basis) of the net assets in trust, as well as fees based on investment performance. Other indirect costs may also be incurred. For foreign investment trusts, indirect fees may be incurred during the course of holding such as investment company compensation. Investment trusts invest mainly in securities such as Japanese and foreign equities and bonds, whose prices fluctuate. Investment trust unit prices fluctuate owing to price fluctuations in the underlying assets and to foreign exchange rate fluctuations. As such, investment trusts carry the risk of losses. Fees and risks vary by investment trust. Maximum applicable fees are subject to change; please thoroughly read the written materials provided, such as prospectuses or documents delivered before making a contract. In interest rate swap transactions and USD/JPY basis swap transactions (“interest rate swap transactions, etc.”), only the agreed transaction payments shall be made on the settlement dates. Some interest rate swap transactions, etc. may require pledging of margin collateral. In some of these cases, transaction payments may exceed the amount of collateral. There shall be no advance notification of required collateral value or collateral ratios as they vary depending on the transaction. Interest rate swap transactions, etc. carry the risk of losses owing to fluctuations in market prices in the interest rate, currency and other markets, as well as reference indices. Losses incurred as such may exceed the value of margin collateral, in which case margin calls may be triggered. In the event that both parties agree to enter a replacement (or termination) transaction, the interest rates received (paid) under the new arrangement may differ from those in the original arrangement, even if terms other than the interest rates are identical to those in the original transaction. Risks vary by transaction. Please thoroughly read the written materials provided, such as documents delivered before making a contract and disclosure statements. In OTC transactions of credit default swaps (CDS), no sales commission will be charged. When entering into CDS transactions, the protection buyer will be required to pledge or entrust an agreed amount of margin collateral. In some of these cases, the transaction payments may exceed the amount of margin collateral. There shall be no advance notification of required collateral value or collateral ratios as they vary depending on the financial position of the protection buyer. CDS transactions carry the risk of losses owing to changes in the credit position of some or all of the referenced entities, and/or fluctuations of the interest rate market. The amount the protection buyer receives in the event that the CDS is triggered by a credit event may undercut the total amount of premiums that he/she has paid in the course of the transaction. Similarly, the

Nomura | Nomura Robot Companies 70 14 June 2018
20
amount the protection seller pays in the event of a credit event may exceed the total amount of premiums that he/she has received in the transaction. All other conditions being equal, the amount of premiums that the protection buyer pays and that received by the protection seller shall differ. In principle, CDS transactions will be limited to financial instruments business operators and qualified institutional investors. No account fee will be charged for marketable securities or monies deposited. Transfers of equities to another securities company via the Japan Securities Depository Center are subject to a transfer fee of up to ¥10,800 per issue transferred depending on volume. Nomura Securities Co., Ltd. Financial instruments firm registered with the Kanto Local Finance Bureau (registration No. 142) Member associations: Japan Securities Dealers Association; Japan Investment Advisers Association; The Financial Futures Association of Japan; and Type II Financial Instruments Firms Association. The Nomura Group manages conflicts with respect to the production of research through its compliance policies and procedures (including, but not limited to, Conflicts of Interest, Chinese Wall and Confidentiality policies) as well as through the maintenance of Chinese Walls and employee training. Additional information regarding the methodologies or models used in the production of any investment recommendations contained within this document is available upon request by contacting the Research Analysts listed on the front page. Disclosures information is available upon request and disclosure information is available at the Nomura Disclosure web page: http://go.nomuranow.com/research/globalresearchportal/pages/disclosures/disclosures.aspx Copyright © 2018 Nomura Securities Co., Ltd. All rights reserved.