ns201a exam 2013b key - neuroscience graduate...
TRANSCRIPT

Page | 1
Neuroscience 201A Exam, 28 October 2013
This is a four hour exam (9:10 AM – 1:10 PM).
You can take the exam electronically, on paper, or by a combination of the two. If you take any part of the exam electronically, please confirm that I have received your electronic file by the end of the exam.
With the exception of the first question, you are to do your own work.
This is an open-‐book exam. Any materials that you have on your laptop or “in the cloud” that you have used in preparation for this exam, or that are available through the NS 201A web site, are available for you to use. You may not use other resources, e.g., PubMed, Wikipedia, etc. To finish the exam on time, you will need to use the “structure of understanding” about this material that you had built as of 9 AM today.
Question #1: 20 minutes (8 pts)
With increasing frequency, you will be learning from one another. Indeed, it’s already happening in this course. To recognize and celebrate this transition, the first question in this exam is to be resolved by you communally. Talk through this problem as a group. Consider how best to respond to the questions. Hear everyone out (as a cerebral engine, you will most effective if you consider the most diverse set of inputs). Use the board. Once you are agreed how to respond, erase what you have on the board and write your responses individually without communicating with one another. Once you start writing, come get me and I will give you the rest of the exam. You are responsible for managing your time. This shouldn’t take you more than about 25 minutes.
Question #1 starts on page 2

Page | 2
The figure above was obtained from a paper on calcium channels expressed by dentate granule cells. The whole-‐cell Ca2+ currents in (A) were measured in response to voltage steps from a holding potential of –60 mV to test potentials of –10, 0 , and + 10 mV. The external solution contained normal saline (2 mM Ca2+) plus tetrodotoxin to block Na+ channels, and the internal solution in the patch electrode contained 150 mM KCl. The lines through the current traces are the fit to a single exponential function with time constants of 40-‐50 ms. The activation curve is shown in B. Part C shows the voltage dependence of the time constant of current decay (top) and the current-‐voltage relation for the peak current (bottom).
Design an experiment using only voltage clamp steps that would reveal whether the decline in the amplitude of the whole cell current during the test pulse is due to (a) inactivation of the calcium current or (b) activation of a calcium-‐dependent potassium current superimposed on a non-‐activating calcium current. Draw the current records that you would expect for the two possibilities.
Note that the in was missing from “non-‐inactivating” two lines above. I don’t think that this created any misunderstanding . Sorry about this.
The best way to proceed is to consider what would happen as a function of time during the depolarizing step if you were to step the potential to ECa or to EK. Granted, you don’t necessarily know where these are, but you can make educated guesses about them. If the shape of the current trace is due to an inactivating calcium current (with activating potassium

Page | 3
current), then if you step the potential to ECa there will be no current tail. If the shape of the current is due to a slowly activating potassium current superimposed on a non-‐inactivating calcium current, then by stepping to ECa later and later, you will reveal an increasing outward tail current that is due to potassium current. What if we were to step from ~0 mV to EK instead of ECa? If the current shape is explained entirely by an inactivating calcium current, you should see inward current that decreases in amplitude as a function of time. If the current trace is explained by a slowly activating potassium current superimposed upon a non-‐inactivating calcium current, you should see an inward current tail that is unchanged as a function of time. Thus, we have a 2x2 grid of outcomes that should yield a unique solution for each of the two scenarios
Inactivating calcium current Activating potassium current
Step to ECa No tail currents Tail currents are outward and increase with time
Step to EK Tail currents are inward and decrease with time
Tail currents are inward and do not change with time
The cleanest single experiment is to step to ECa. There is a dramatic difference in what you expect to see, given the two possible explanations. No one proposed this. Instead, you proposed an experiment to look at the contribution of iK in which you stepped back to EK and to either side of EK. You proposed calculating the amount of iCa that would contribute to the expected tails to subtract it out. Anything left would presumably be due to potassium. This might work, but since the contribution of iK will be small given the small amount of driving force, you may have a signal-‐to-‐noise (S/N) problem; you will be subtracting two traces from one another (one measured, one calculated) that may be much larger than the expected difference. The cleanest way to view the potassium currents is to look at total current at ECa. It’s the “partner” of the experiment that you did think of.
You scored 6.5-‐7.5 on this 8 point question. I’d like feedback on whether to continue to have “group questions” in these exams, and how much they should count. Thanks.

Page | 4
Question #2: 12 minutes (5 points)
The image to the left is taken from the Wikipedia site on “Membrane Potential.” The legend to this figure (below the figure) does not have any significant errors. However, the graphic has a couple of items that are at least misleading.
First, most of the charged molecules on either side of the membrane are drawn as salts (where ions of opposite polarity are associated). This is not correct. Most of the ions will be free and hydrated at ~0.15M.
Second, the density of charge on either side of the membrane is not physiological. For illustration purposes, neuroscientists often place many excess charges on each side of the membrane. Let’s explore how many is too many.
a) For the figure here, assume that the membrane in question is separating seven monovalent charges and that the area of membrane that does this represents a slab of 25 nm (high) by 4 nm (deep). Calculate the voltage difference across the membrane, given this degree of charge separation. Assume a standard capacitance for biological membranes. (2 points)
b) There is one potassium channel drawn into this figure. Calculate the specific membrane resistance if there is one such channel per 25 x 4 nm area of membrane, if the conductance of one channel is 40 pS, and if the resistance of the rest of the membrane (with no channels) is 107 ohm cm2. (1.5 points)
c) What would be the input resistance of a typical cell (diameter: 20 µm) with the specific membrane resistance you calculate for part c? (assume that the cell is spherical) (1.5 points)
a) Many of you knew how to solve this problem (V=Q/C) but made a variety of careless errors, including errors in converting from nm to cm.
b) Most of you first proceeded to calculate the resistance of the patch of membrane, taking into account its two parallel bits, the bit with the channel and bit with the pure lipid bilayer. You could have safely skipped doing this. Why? You will recall that the resistance of channel-‐less membrane is so high that it can be ignored, and that the resistance of the patch will be equal to
Page | 5
the resistance of its single channel. Put another way, the addition of channels increases the conductance greatly and decreases the resistance greatly; the resistance of the rest of the membrane is insignificant. Another problem some of you had was with units. The units of specific membrane resistance are ohm*cm2. Thus, to convert to this value from the resistance of a specific piece of membrane, you multiply by the surface are of that piece of membrane. The correct answer: 2000 ohms, is many orders of magnitude smaller than the input resistance of a typical cell. Why is this? It’s because real membranes do not have anything like one leak channel per every 100 nm x 25 nm piece of membrane. In fact, if we take 200 Mohms as a “typical” input resistance, then the density of leak channels in the membrane in the Wikipedia cartoon is off by a factor of 100,000. Thus, there will be a leak channel per every 100,000th piece of membrane like that in the drawing.
The following page has the calculations for question #2.

Page | 6
Question #3: 15 minutes (7 points)
The figure above was taken from a paper that concluded that very few calcium channels are required to trigger transmitter release at a GABAergic synapse. The key evidence in support of the conclusion is found in this figure.
In b (top) is shown 30 superimposed traces in response to an action potential in the presynaptic cell. In b (bottom) is shown the results of calcium transients for boutons near the recorded granule cell. These records are for the same 30 responses shown in the top part of b, but consist of three traces, each of which is averaged from 10 individual responses.
a) What are the two most important sources of trial-‐to-‐trial variability in the current responses in b? (1.5 points) These are (1) variability in the quantal content and (2) variability in quantal size. There is a “late” event (probably a mEPSC) in b. If all quantal responses were this size, then you would be able to see aggregates of EPSCs at 2x and 3x etc. of this amplitude Instead, there are no aggregates of reponses.
b) The decay time constant of the currents in b is considerably slower than the decay of AMPA-‐mediated synaptic currents and yet faster than the decay of NMDA-‐mediated

Page | 7
currents. What accounts for these differences? (1 point) The fact that different transmitters have different affinities for their receptors, leading to very different open times. The deactivation of an ionotropic receptor is driven by dissociation of agonist. Since the time course of current is usually a property of channel closing, and not transmitter availability, longer openings will be associated with a slower rate of dissociation of agonist (this is the numerator in of Kd.
c) In part c is shown the effects of reducing the extracellular calcium concentration on both the calcium signal and the peak current responses. In e is shown the “classic” higher power relationship between calcium and response (a proxy for release). What is the molecular basis for this higher power relationship? (1 point) A rate limiting step in exocytosis requires the simultaneous binding of ~4 calcium ions. This is thought to be synaptotagmin.
d) When the calcium signal is reduced by blocking calcium channels with a high-‐affinity antagonists (agatoxin, part d), the relationship between current and signal is changed: it is less cooperative or more linear (compare e and f; the variable m would have been 1.0 had the relationship been linear). Why do differences between the findings in e and f support the principal conclusion of the paper? [As a hint, consider the extreme scenario where the authors found a linear relationship in f; consider why the relationship is exponential (depending on the ~4th power) in d and linear in f.] (3.5 points) When you vary the availability of calcium to the sensor synaptotagmin by varying [Ca2+]o, you can grade [Ca2+]i continuously and hopefully locate the concentration range where the relationship between [Ca2+]i and release is non-‐linear. The same will be true when calcium that is sensed by synaptotagmin arises from the opening of many calcium channels and where you regulate [Ca2+]i with submaximal levels of an antagonist like agatoxin. However, if there is one, or very few, calcium channels associated with a release site (aka, a nanodomain), it is no longer possible to vary the calcium continuously. In the extreme limit of one channel per site, there ill be only one non-‐zero level of [Ca2+]I, that which occurs when “the” channel opens. Under these conditions, reducing the calcium availability with agatoxin knocks out sites in an all-‐or-‐none fashion but does not vary [Ca2+]i anywhere within the terminal where it matters.
Some of you suggested that the agatoxin might be operating somehow over the linear part of the relationship between release and intracellular calcium, while the other method (varying extracellular calcium) was operating over the supralinear range. If so, then we would expect the two perturbations to produce different variations is DF/F. They do not. This was a tough question: no one got a perfect score on this part. Here is a link to the paper: http://www.ncbi.nlm.nih.gov/pubmed/22183436.

Page | 8
Question #4: 10 minutes (4 points)
The figure above is taken from H&H1952c. This record shows potassium current in response to a step depolarization of 25 mV from rest. The two traces show current (above) and conductance (below).
a) How did H&H eliminate sodium current in this experiment? (0.5 points) They replaced sodium in the external solution with choline. (TTX was discovered only later.)
b) How did H&H determine conductance? (0.5 points) Ohm’s law. They measured current, they knew (and held) voltage; g=I/V.
c) What is the cause of the large discontinuity in the current trace at the end of the voltage step? (1.5 points) The current is reduced several fold by the sudden loss of driving force produced by stepping the voltage back from 25 mV depolarized from rest to rest. Several of you

Page | 9
said that the discontinuity was caused by the charging (discharging) of the membrane; this is right, sort of, but it’s not an artifact – it’s real. This is a classic “tail” current that allows you to study what sort of channels are open at any point in time during a step depolarization, just as you did for question #1.
d) Calculate EK. Assume that the potential at rest is -‐70 mV. (1.5 points) Nearly all of you found elegant ways to approach this problem: cleaner than my seat-‐of-‐the-‐pants approach, and I thank you for the inspiration. This can be done using Ohm’s law and by looking at the time either before the step back to rest (when current ~ 0.3, conductance ~ 7, and DF = -‐45 + EK mV), the time immediately after the step back to rest (when current ~ 0.07, conductance ~ 5, and DF = -‐70 + EK mV), or the difference in current brought about as a change in driving force (when Δ current ~ 0.3, Δ conductance theoretically 0, and Δ DF = 25 mV + (-‐70 -‐ EK mV).

Page | 10
Question #5: 20 minutes (8.5 points)
In the figure below, reproduced from a recent J. Neurosci. paper, a fluorescence signal from a synthetic chloride indicator dye (SuperChlomeleon) expressed in a neuron is shown to vary with the internal concentration of chloride. Note that the “FRET ratio” changes by about 1 unit when the internal chloride is changed from 0 to 5 mM [Cl-‐]i. (you are going to need this underlined tidbit later!)
In a second figure (below), the authors show that they can measure a change in FRET ratio at a fast time scale, thus illustrating that SuperChlomeleon might be useful as a optical indicator of inhibition (ignore the left side of part B, which shows results with a less sensitive variant of the dye).

Page | 11
Assume the following:
1. The threshold for detecting a change in FRET signal is 0.02 units when[Cl-‐]i is at physiological levels.
2. that in the range of [Cl-‐]i of 0-‐10 mM, there is a linear relationship between FRET ratio and [Cl-‐]i 3. that only one afferent in the slice that terminates on the target cell, and you can stimulate it
reliably. 4. that the afferent (above) branches repeatedly before reaching the target cell and ends in many
boutons, having many active zones. 5. that release at this synapse is univesicular.
Part A: calculate the change in [Cl-‐]i represented by the minimally detectable level for FRET signal (0.02 units). (1.5 points) You know that the FRET signal is linear over [Cl-‐]I in the physiological range and that 1 unit of change in the signal corresponds to 5 mM of change in [Cl-‐]I; this means that 0.02 units corresponds to 0.02*5 mM, or 0.1 mM.
Part B: How many quanta will have to be released at the synapse in order to produce a just detectable change in [Cl-‐]i? (5 points)
Assume the following:
1. Vm at rest is -‐60 mV. ECl is -‐45 mV. 2. Fifty GABAA receptors open per released quantum of transmitter. The GABAA receptor channels
open for an average of 50 ms, and each has an open channel conductance of 50 pS. 3. The volume of the cell is 4 x 10-‐12 liters.
See the next page of calculations. To do this, you will have to calculate the expected increase in [Cl-‐]I per quantum, which will require that you determine the charge transfer per quantum and then convert from charge to concentration, using the coulomb and information about the volume of the cell. Part C: In an instance where chloride is passively distributed across the membrane of a neuron and where you are clamping the membrane at resting potential, this fluorescence technique will fail to produce a change in signal, regardless of how much transmitter is released. Why? What might you alter in such instances to produce a signal? (2 points) This technique will not produce a signal unless chloride carries current, and it will not carry current without a driving force. The easiest way to create a driving force on chloride is to polarize the cell, if you happen to be recording from it. However, the true promise of this technique won’t be realized unless you can monitor inhibition in an array of cells, using optical methods only. You might alter [Cl-‐]o so that chloride is not at equilibrium, but if chloride is not pumped, then, alas, it will move across the membrane in response to the newly generated driving force until it has returned to equilibrium. You might also consider expressing a chloride transporter in the cell that would alter the chloride concentration gradient such that chloride were no longer at equilibrium, but this would presumably change the resting potential of the cell and its electrical behavior.

Page | 12
I don’t’ have a better idea. Do you? If so, then write to George Augustine, the senior author of the paper, at Duke. Here is the link to the paper: http://www.jneurosci.org/content/33/41/16297
Part D: (Extra credit) The time course of the fluorescence signal (B, upper right) is slow relative to the time course of the synaptic current. The signal fails to follow faithfully the responses recorded in response to a train of presynaptic stimuli. Would you expect a chloride indicator dye like SuperChlomeleon to follow faithfully the current trace? Why or why not? (1 point bonus)
No, you would not expect a read-‐out of [Cl-‐]I to look like the current trace. If anything, it might look like the integral of the current trace. The records from this figure are due to chloride moving into the cell (ECl is -‐45 mV, the cell is too negative for chloride, which will leave if given the chance). It will return to outside through whatever transporters are available (there are at least two different ones), and the time course with which these operate would not be expected to correlate with current traces; they would be much slower.
Page | 13
Kirichok Section
Question #6 : (15 minutes, 6.75 points)
Why do ions not permeate through the lipid bilayer without special transport proteins? What is the main principle by which ion channels make such permeation possible?
Question #7 : (15 minutes, 6.75 points)
The voltage-‐sensor domain (VSD) of voltage-‐gated ion channels consists of 4 transmembrane helixes (S1-‐S4). Positively charged S4 helix moves within the lipid bilayer in response to changes in the transmembrane voltage and via the S4-‐S5 linker makes the pore to close and open. Do you think it would be possible to construct a simpler VSD that would consist of S4 domain only? Please explain your answer.

Page | 14
Edwards Section
Question #8 : (15 minutes, 6.75 points)
A knockout mouse shows increased synaptic depression with high frequency stimulation. Using a combination of postsynaptic recording and optical imaging, how can you determine whether this reflects a change in release probability or a defect in recycling?
Question #9 : (15 minutes, 6.75 points)
You have just found that heterologous expression of an orphan polytopic membrane protein confers currents in response to the addition of a novel neurotransmitter. How can you distinguish between the mechanism for this charge movement as either a channel (i.e., channel for other ions but gated by the transmitter) or as a transporter? Do not simply look for other assays that would support channel versus transporter activity since the protein may in fact have multiple functions—rather, use the currents themselves to address the mechanism that underlies them.
Page | 15
Bender Section
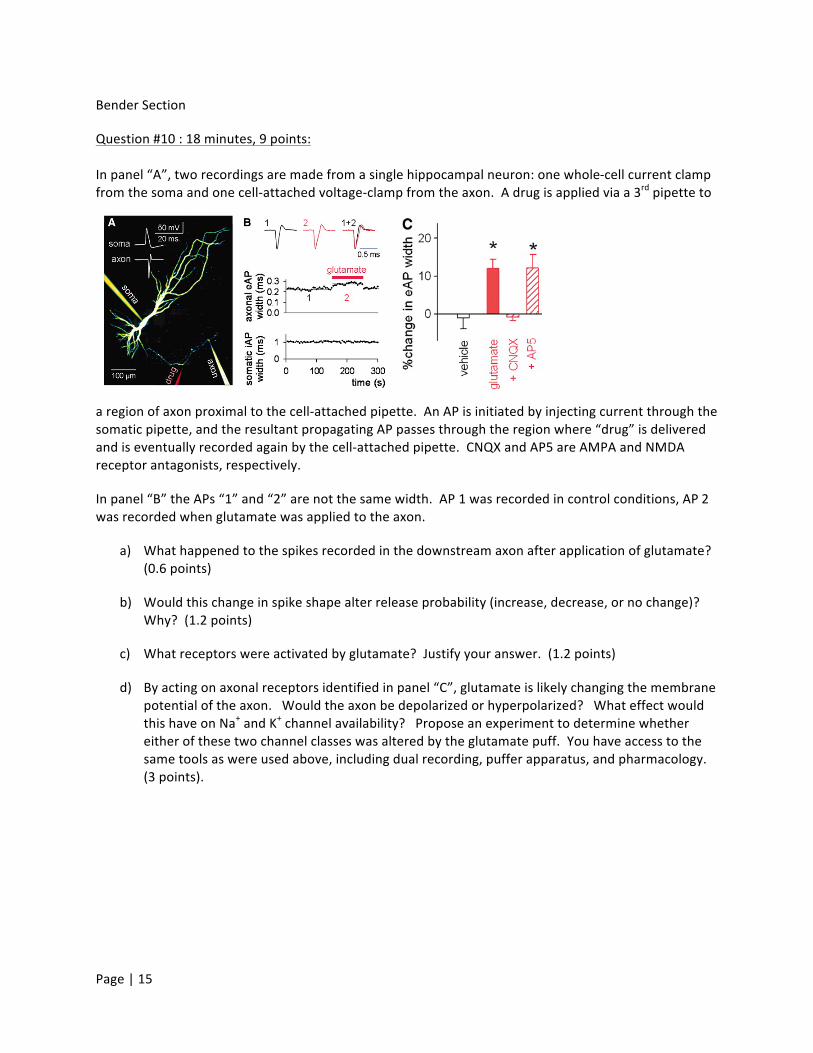
Question #10 : 18 minutes, 9 points: In panel “A”, two recordings are made from a single hippocampal neuron: one whole-‐cell current clamp from the soma and one cell-‐attached voltage-‐clamp from the axon. A drug is applied via a 3rd pipette to
a region of axon proximal to the cell-‐attached pipette. An AP is initiated by injecting current through the somatic pipette, and the resultant propagating AP passes through the region where “drug” is delivered and is eventually recorded again by the cell-‐attached pipette. CNQX and AP5 are AMPA and NMDA receptor antagonists, respectively.
In panel “B” the APs “1” and “2” are not the same width. AP 1 was recorded in control conditions, AP 2 was recorded when glutamate was applied to the axon.
a) What happened to the spikes recorded in the downstream axon after application of glutamate? (0.6 points)
b) Would this change in spike shape alter release probability (increase, decrease, or no change)? Why? (1.2 points)
c) What receptors were activated by glutamate? Justify your answer. (1.2 points)
d) By acting on axonal receptors identified in panel “C”, glutamate is likely changing the membrane potential of the axon. Would the axon be depolarized or hyperpolarized? What effect would this have on Na+ and K+ channel availability? Propose an experiment to determine whether either of these two channel classes was altered by the glutamate puff. You have access to the same tools as were used above, including dual recording, puffer apparatus, and pharmacology. (3 points).

Page | 16
e) Above, serial cell-‐attached recordings were made at various distances upstream and downstream of the glutamate puff. AP width was broader downstream, but not upstream, of the glutamate puff. Why was upstream AP width unaltered? (0.6 points)
f) The broadening of AP width has a length constant in the downstream direction. Redraw panel A showing both this baseline effect and draw a new length constant if the cell lacked myelin. Just draw the exponential fits in both cases. (1.2 points)
g) same as question “f”, but instead of demyelinating the axon, draw the fits if a GABAA hotspot were located 200 microns downstream of the glutamate puff. Assume that GABA is shunting and tonically active. (1.2 points)
Question #11 : 12 minutes, 4.5 points:
Suppose you’ve made a single whole-‐cell, current-‐clamp recording from the apical dendrite of a neocortical layer 5 pyramidal cell in an “active” slice preparation. In this slice preparation, the local network of pyramidal cells can be spontaneously active (i.e., both the cell from which you are recording and neighboring cells may be firing spikes). You observe electrical events from your dendritic recording site that look like EPSPs, but you now know that back propagating action potentials can be filtered as they back propagate from the soma to your recording site, and can start to look more like EPSPs than APs when recording in the dendrite.
Propose a set of experiments to establish convincingly whether these events are generated by local tuft synapses or by back propagating APs. Explain how your experiment will alter the frequency and/or amplitude of these events if they were mediated by EPSPs or bAPs. If you can envision pitfalls to your approach, discuss them.
If you so choose, you may apply pharmacological agents to the entire slice. Unfortunately, you spilled beer on your second manipulator, so you can’t patch the cell with a second electrode. Nor can you apply drugs to just one small region of the cell. Further, there’s beer in your laser, so you can’t image the neuron. You really need to get a spill proof mug.
Bonus half point: How, in one sentence, you’re going to explain the beer incident to your PI.

Page | 17
Whistler Section
Question #13 : 4 minutes, 1.75 points
Extended True or false: you have two neutral antagonists at the same target with the same affinities. Both drugs have the same potency. If true, why. If false, why not.
True. Neutral antagonists by definition have no efficacy, so affinity determines potency.
Question #14 : 11 minutes, 5 points
In the striatum, cocaine causes an increase in dopamine tone by blocking the dopamine transporter. D2 dopamine receptors, which are Gi coupled, are located on the presynaptic terminals of the dopamine neurons, where they serve as autoreceptors inhibiting transmitter release when activated. Both D2 and D1 (Gs coupled) receptors are located postsynaptically. After endocytosis in response to dopamine, D2Rs are downregulated while D1Rs are not.
a) How would tonic dopamine release in the striatum be altered in cocaine treated animals assuming that the cocaine pretreatment caused no change in D2 receptor affinity for dopamine? There would be an increase in dopamine release. Cocaine pre-‐treatment would cause downregulation of D2Rs. A loss of autoreceptors, which inhibit release would lead to an increased tonic release of dopamine.
b) What would be the predicted effect of cocaine pretreatment on tonic dopamine release assuming that cocaine pretreatment shifted more D2 receptors into the G protein coupled state? Receptors in the G protein coupled state will have higher affinity for dopamine. Therefore these receptors would be better able to block release. However, downregulation of receptor will have also occurred, which would lead to increased release. This net effect would, therefore be dependent on the receptor reserve.
Question #15 : 11 minutes, 5 points
You are screening for antagonists of Your Favorite Receptor YFR using a functional assay in which YFR is expressed in heterologous cells. You identify two molecules, A and B, both of which block activation of YFR in response to your selective agonist compound for YFR with the same potency. Neither has any effect on receptor activity on its own. You then use competition binding with a radioligand antagonist to determine the affinity of A and B. A has high affinity. However B has very low affinity.
What property of B allows it to be so potent despite its low affinity?
It must be an allosteric modulator that binds at a site other than that of the radioligand.

Page | 18
Note, they are both neutral antagonists (have no effect on their own) so they have no intrinsic efficacy so “efficacy” cannot explain the difference.
Question #16 : 4 minutes, 1.75 points
Extended True or false: you have two agonists at the same target with the same potencies. Both drugs must have the same affinity. If true, why. If false, why not.
False. Potency is a function of both affinity and intrinsic efficacy.
For example, a low affinity, full agonist (where you need a higher concentration of ligand to get 50% occupancy) could have the same potency as a high affinity partial agonist (where you need more than 50% occupancy to get 50% of the maximal effect).
Nicoll section
Question #17 : 30 minutes, 13.5 points.
The recent discovery that exogenously expressed kainate receptors can undergo NMDA-‐dependent LTP is most provocative because these receptors are quite distinct from AMPA receptors. This finding has resurrected the presynaptic mechanism for LTP whereby the increase in glutamate release could account for the enhanced kainate receptor mediated responses. Is this finding sufficient grounds for returning to a presynaptic expression mechanism for NMDA-‐dependent LTP? Please discuss.