optimal imaging parameters for readout-segmented epi of
TRANSCRIPT
Optimal Imaging Parameters for Readout-segmented EPI of the Temporal Bone
Toshiya AZUMA1*, Takao KODAMA2, Takanori YANO2, Masahiro ENZAKI1,
Masato NAKAMURA1, and Katsutoshi MURATA3
1Department of Radiological Technology, Miyazaki University School of Medicine2Department of Radiology, Miyazaki University School of Medicine
5200 Kihara, Kiyotake, Miyazaki 889–1692, Japan3Siemens Japan K. K., Imaging and Therapy System Division, Department of Research and Collaboration
(Received April 18, 2014; Accepted July 16, 2014; published online December 15, 2014)
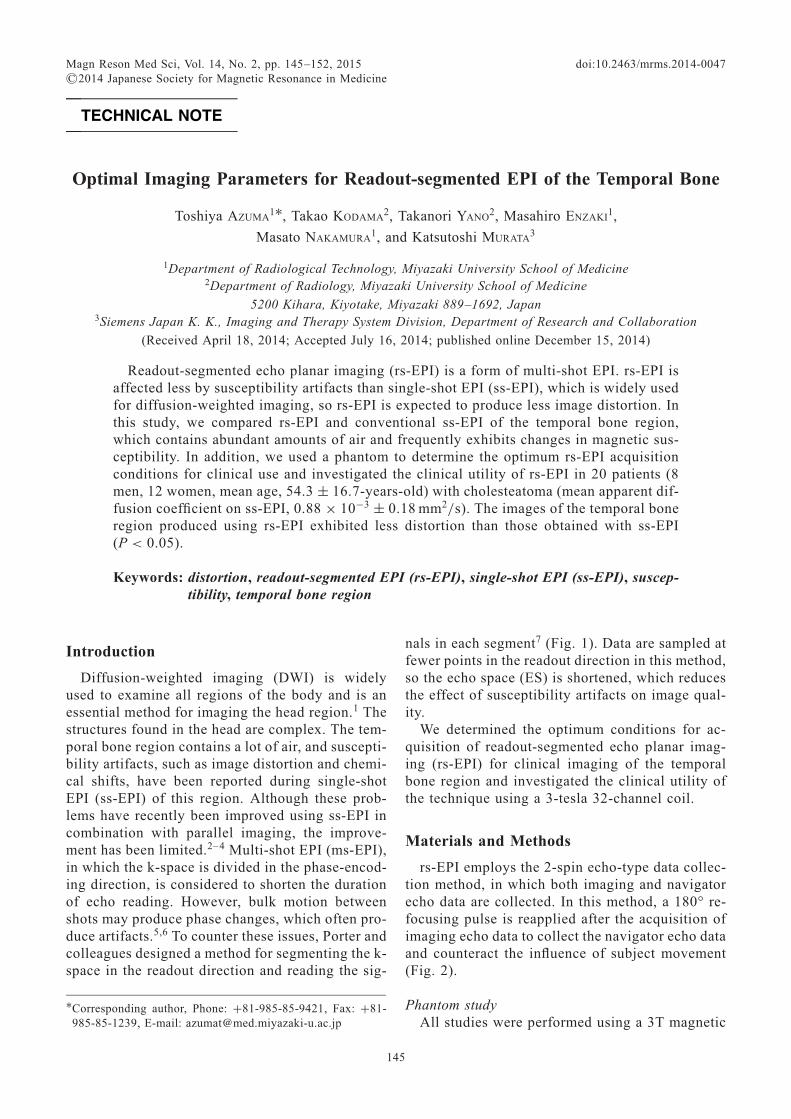
Readout-segmented echo planar imaging (rs-EPI) is a form of multi-shot EPI. rs-EPI isaffected less by susceptibility artifacts than single-shot EPI (ss-EPI), which is widely usedfor diffusion-weighted imaging, so rs-EPI is expected to produce less image distortion. Inthis study, we compared rs-EPI and conventional ss-EPI of the temporal bone region,which contains abundant amounts of air and frequently exhibits changes in magnetic sus-ceptibility. In addition, we used a phantom to determine the optimum rs-EPI acquisitionconditions for clinical use and investigated the clinical utility of rs-EPI in 20 patients (8men, 12 women, mean age, 54.3 « 16.7-years-old) with cholesteatoma (mean apparent dif-fusion coefficient on ss-EPI, 0.88 © 10¹3 « 0.18 mm2/s). The images of the temporal boneregion produced using rs-EPI exhibited less distortion than those obtained with ss-EPI(P < 0.05).
Keywords: distortion, readout-segmented EPI (rs-EPI), single-shot EPI (ss-EPI), suscep-tibility, temporal bone region
Introduction
Diffusion-weighted imaging (DWI) is widelyused to examine all regions of the body and is anessential method for imaging the head region.1 Thestructures found in the head are complex. The tem-poral bone region contains a lot of air, and suscepti-bility artifacts, such as image distortion and chemi-cal shifts, have been reported during single-shotEPI (ss-EPI) of this region. Although these prob-lems have recently been improved using ss-EPI incombination with parallel imaging, the improve-ment has been limited.2–4 Multi-shot EPI (ms-EPI),in which the k-space is divided in the phase-encod-ing direction, is considered to shorten the durationof echo reading. However, bulk motion betweenshots may produce phase changes, which often pro-duce artifacts.5,6 To counter these issues, Porter andcolleagues designed a method for segmenting the k-space in the readout direction and reading the sig-
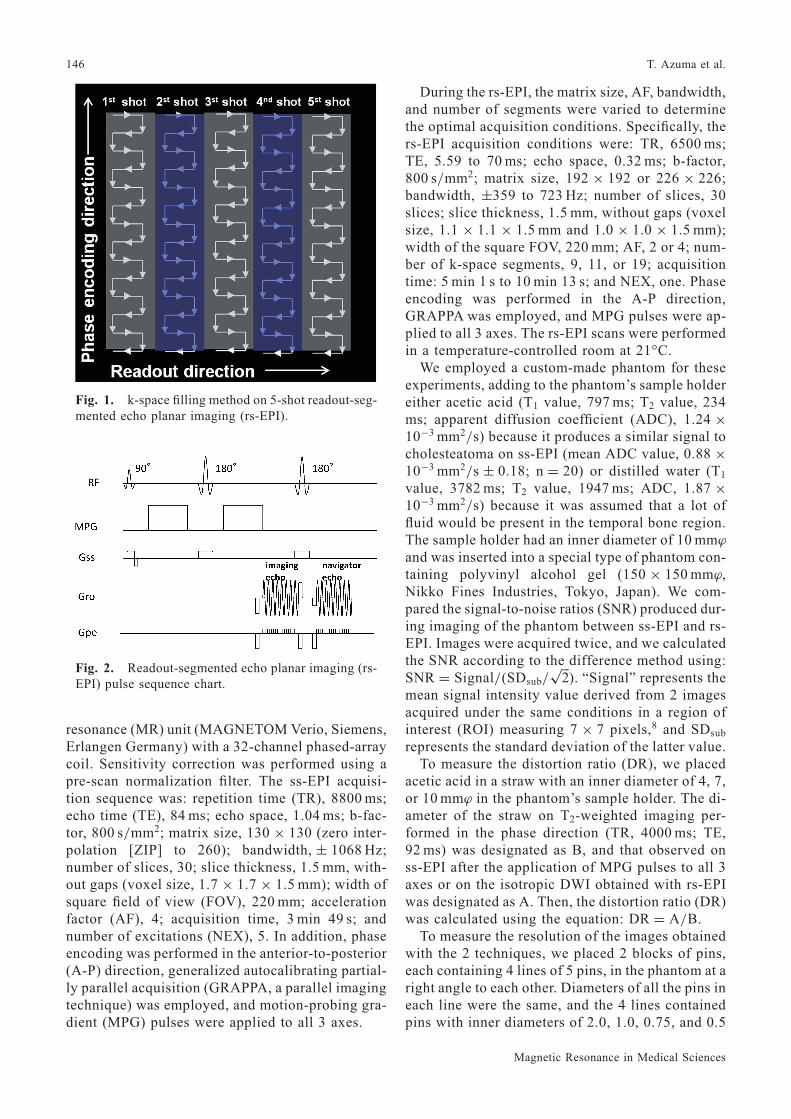
nals in each segment7 (Fig. 1). Data are sampled atfewer points in the readout direction in this method,so the echo space (ES) is shortened, which reducesthe effect of susceptibility artifacts on image qual-ity.We determined the optimum conditions for ac-
quisition of readout-segmented echo planar imag-ing (rs-EPI) for clinical imaging of the temporalbone region and investigated the clinical utility ofthe technique using a 3-tesla 32-channel coil.
Materials and Methods
rs-EPI employs the 2-spin echo-type data collec-tion method, in which both imaging and navigatorecho data are collected. In this method, a 180° re-focusing pulse is reapplied after the acquisition ofimaging echo data to collect the navigator echo dataand counteract the influence of subject movement(Fig. 2).
Phantom studyAll studies were performed using a 3T magnetic
*Corresponding author, Phone: +81-985-85-9421, Fax: +81-985-85-1239, E-mail: [email protected]
Magn Reson Med Sci, Vol. 14, No. 2, pp. 145–152, 2015©2014 Japanese Society for Magnetic Resonance in Medicine
TECHNICAL NOTE
doi:10.2463/mrms.2014-0047
145
resonance (MR) unit (MAGNETOM Verio, Siemens,Erlangen Germany) with a 32-channel phased-arraycoil. Sensitivity correction was performed using apre-scan normalization filter. The ss-EPI acquisi-tion sequence was: repetition time (TR), 8800 ms;echo time (TE), 84 ms; echo space, 1.04 ms; b-fac-tor, 800 s/mm2; matrix size, 130 © 130 (zero inter-polation [ZIP] to 260); bandwidth, « 1068 Hz;number of slices, 30; slice thickness, 1.5 mm, with-out gaps (voxel size, 1.7 © 1.7 © 1.5 mm); width ofsquare field of view (FOV), 220 mm; accelerationfactor (AF), 4; acquisition time, 3 min 49 s; andnumber of excitations (NEX), 5. In addition, phaseencoding was performed in the anterior-to-posterior(A-P) direction, generalized autocalibrating partial-ly parallel acquisition (GRAPPA, a parallel imagingtechnique) was employed, and motion-probing gra-dient (MPG) pulses were applied to all 3 axes.
During the rs-EPI, the matrix size, AF, bandwidth,and number of segments were varied to determinethe optimal acquisition conditions. Specifically, thers-EPI acquisition conditions were: TR, 6500 ms;TE, 5.59 to 70 ms; echo space, 0.32 ms; b-factor,800 s/mm2; matrix size, 192 © 192 or 226 © 226;bandwidth, «359 to 723 Hz; number of slices, 30slices; slice thickness, 1.5 mm, without gaps (voxelsize, 1.1 © 1.1 © 1.5 mm and 1.0 © 1.0 © 1.5 mm);width of the square FOV, 220 mm; AF, 2 or 4; num-ber of k-space segments, 9, 11, or 19; acquisitiontime: 5 min 1 s to 10 min 13 s; and NEX, one. Phaseencoding was performed in the A-P direction,GRAPPA was employed, and MPG pulses were ap-plied to all 3 axes. The rs-EPI scans were performedin a temperature-controlled room at 21°C.We employed a custom-made phantom for these
experiments, adding to the phantom’s sample holdereither acetic acid (T1 value, 797 ms; T2 value, 234ms; apparent diffusion coefficient (ADC), 1.24 ©10¹3 mm2/s) because it produces a similar signal tocholesteatoma on ss-EPI (mean ADC value, 0.88 ©10¹3 mm2/s « 0.18; n = 20) or distilled water (T1
value, 3782 ms; T2 value, 1947 ms; ADC, 1.87 ©10¹3 mm2/s) because it was assumed that a lot offluid would be present in the temporal bone region.The sample holder had an inner diameter of 10 mm¤
and was inserted into a special type of phantom con-taining polyvinyl alcohol gel (150 © 150 mm¤,Nikko Fines Industries, Tokyo, Japan). We com-pared the signal-to-noise ratios (SNR) produced dur-ing imaging of the phantom between ss-EPI and rs-EPI. Images were acquired twice, and we calculatedthe SNR according to the difference method using:SNR = Signal/(SDsub/
ffiffiffi
2p
). “Signal” represents themean signal intensity value derived from 2 imagesacquired under the same conditions in a region ofinterest (ROI) measuring 7 © 7 pixels,8 and SDsub
represents the standard deviation of the latter value.To measure the distortion ratio (DR), we placed
acetic acid in a straw with an inner diameter of 4, 7,or 10 mm¤ in the phantom’s sample holder. The di-ameter of the straw on T2-weighted imaging per-formed in the phase direction (TR, 4000 ms; TE,92 ms) was designated as B, and that observed onss-EPI after the application of MPG pulses to all 3axes or on the isotropic DWI obtained with rs-EPIwas designated as A. Then, the distortion ratio (DR)was calculated using the equation: DR = A/B.To measure the resolution of the images obtained
with the 2 techniques, we placed 2 blocks of pins,each containing 4 lines of 5 pins, in the phantom at aright angle to each other. Diameters of all the pins ineach line were the same, and the 4 lines containedpins with inner diameters of 2.0, 1.0, 0.75, and 0.5
Fig. 2. Readout-segmented echo planar imaging (rs-EPI) pulse sequence chart.
Fig. 1. k-space filling method on 5-shot readout-seg-mented echo planar imaging (rs-EPI).
146 T. Azuma et al.
Magnetic Resonance in Medical Sciences

mm. MPG pulses were applied to the 3 axes duringthe ss-EPI and the isotropic DWI obtained with rs-EPI (Fig. 3). When pins were correctly detected onthe images acquired in the phase direction, the res-olution of those with inner diameter of 2.0 mm wasone, of 1.0 mm, two, of 0.75 mm, three, and of 0.5mm, four. Seven radiologists, each with more than ayear’s experience in MR imaging, performed thevisual evaluations. The significance of differenceswas analyzed using the Mann-Whitney U-test (Fig.3D).
Clinical studyThe clinical ethics committee of our hospital ap-
proved the study, and subjects consented to partic-ipation. Subjects were 20 patients (8 men, 12 wom-en, mean age, 54.3 « 16.7 years) with cholestea-toma (14 on the right, 8 on the left). All subjects
underwent imaging between November 2012 andMay 2013.In this clinical study, the ss-EPI images were ac-
quired using the following sequence: TR, 8800 ms;TE, 84 ms; echo space, 1.04 ms; b-factor, 800 s/mm2; matrix size, 130 © 130 (zero interpolation[ZIP] to 260); bandwidth, « 1068 Hz; number ofslices, 30; slice thickness, 1.5 mm without gaps(voxel size: 1.7 © 1.7 © 1.5 mm); width of squareFOV, 220 mm; AF, 4; acquisition time, 3 min 49 s;and NEX, 5. In addition, phase encoding was per-formed in the A-P direction, GRAPPA was em-ployed, and MPG pulses were applied to all 3 axes.The rs-EPI acquisition sequence was: TR, 6500
ms; TE, 8.70 ms; echo spacing, 0.32 ms; b-factor,800 s/mm2; matrix size, 226 © 226; bandwidth,« 572 Hz; number of slices, 30; slice thickness,1.5 mm, without gaps (voxel size: 1.0 © 1.0 © 1.5mm); width of square FOV, 220 mm; AF, 2; numberof k-space segments, 11; acquisition time, 6 min 6 s;and NEX, one. In addition, phase encoding was per-formed in the A-P direction, GRAPPA was em-ployed, and MPG pulses were applied to all 3 axes.For each of the acquired ss-EPI images and the
isotropic DWI images obtained with rs-EPI, we cal-culated the contrast-to-noise ratio (CNR) of the le-sion relative to the brainstem using the equation:CNR = (S1-S2)/f(SD12+SD22)/2g1/2, in which S1represents the mean signal intensity value for ROI1and S2, that for ROI2, and SD1 represents thestandard deviation of the mean signal intensity val-ue for ROI1 and SD2, that for ROI2.ROI1 and ROI2both measured 50 pixels.9
Two neuroradiologists with more than 20 years’experience used a 5-point system to grade the abil-ity of rs-EPI to visualize lesions (relative to that ofss-EPI), scoring images that exhibited marked im-provement as excellent, 5; slight improvement,good, 4; similar quality, equal, 3; local failure tovisualize the lesion, fair, 2; and complete failureto visualize the lesion as poor, one. The significanceof differences was analyzed using the Mann-Whit-ney U-test.
Results
Phantom studyFigure 4 shows the SNR values exhibited by the
acetic acid and distilled water in the phantom’ssample holder (inner diameter, 10 mm¤) on ss- andrs-EPI. Both substances exhibited higher SNR onss-EPI than on rs-EPI at matrix sizes of 226 ©226 (Fig. 4A) and 192 © 192 (Fig. 4B). On rs-EPI, the SNR rose as the number of segments in-creased and decreased as the AF increased. No sig-
Fig. 3. Comparison of single-shot (ss)- and readout-segmented echo planar imaging (rs-EPI) (shots, fixedto 11) images of resolution phantom with changes inthe matrix size and acceleration factor. (A) ss-EPI. (B)rs-EPI at matrix size, 192 © 192 and acceleration fac-tor, 2. (C) rs-EPI at matrix size, 192 © 192 and accel-eration factor, 4. (D) rs-EPI at matrix size, 226 © 226and acceleration factor, 2. (E) rs-EPI at matrix size,226 © 226 and acceleration factor, 4.
147Optimal Imaging Parameters for Readout-segmented EPI of the Temporal Bone
Vol. 14 No. 2, 2015
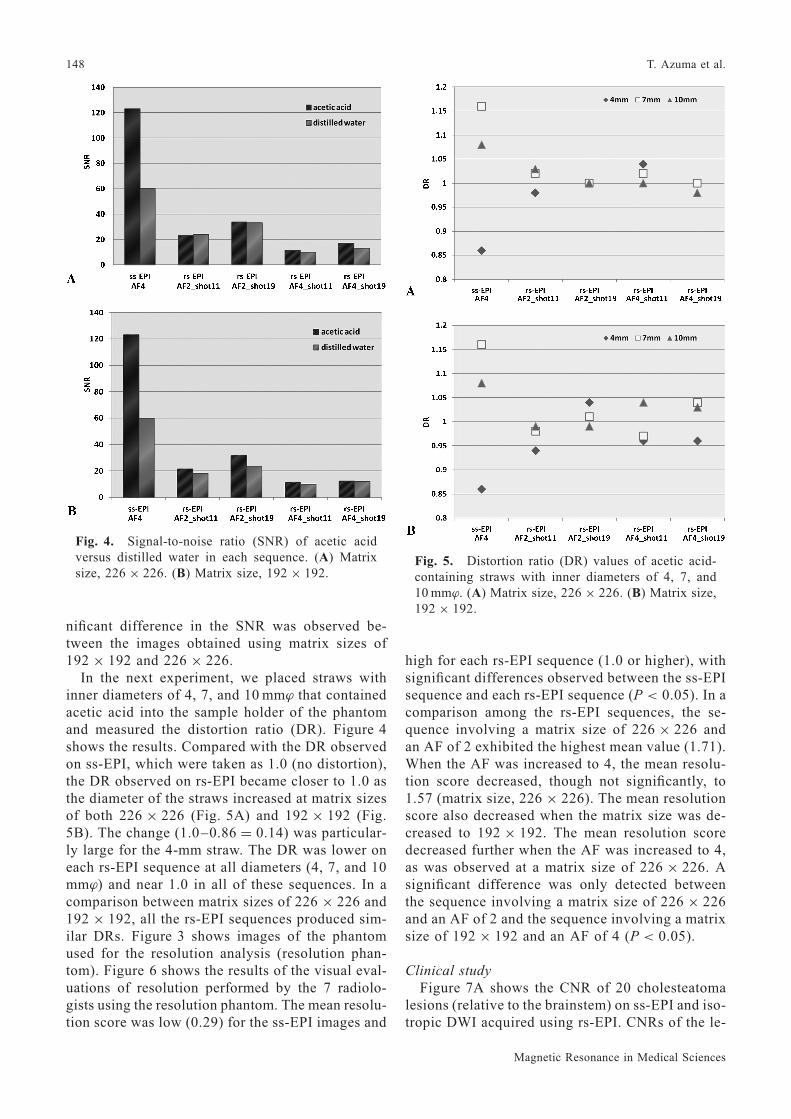
nificant difference in the SNR was observed be-tween the images obtained using matrix sizes of192 © 192 and 226 © 226.In the next experiment, we placed straws with
inner diameters of 4, 7, and 10 mm¤ that containedacetic acid into the sample holder of the phantomand measured the distortion ratio (DR). Figure 4shows the results. Compared with the DR observedon ss-EPI, which were taken as 1.0 (no distortion),the DR observed on rs-EPI became closer to 1.0 asthe diameter of the straws increased at matrix sizesof both 226 © 226 (Fig. 5A) and 192 © 192 (Fig.5B). The change (1.0–0.86 = 0.14) was particular-ly large for the 4-mm straw. The DR was lower oneach rs-EPI sequence at all diameters (4, 7, and 10mm¤) and near 1.0 in all of these sequences. In acomparison between matrix sizes of 226 © 226 and192 © 192, all the rs-EPI sequences produced sim-ilar DRs. Figure 3 shows images of the phantomused for the resolution analysis (resolution phan-tom). Figure 6 shows the results of the visual eval-uations of resolution performed by the 7 radiolo-gists using the resolution phantom. The mean resolu-tion score was low (0.29) for the ss-EPI images and
high for each rs-EPI sequence (1.0 or higher), withsignificant differences observed between the ss-EPIsequence and each rs-EPI sequence (P < 0.05). In acomparison among the rs-EPI sequences, the se-quence involving a matrix size of 226 © 226 andan AF of 2 exhibited the highest mean value (1.71).When the AF was increased to 4, the mean resolu-tion score decreased, though not significantly, to1.57 (matrix size, 226 © 226). The mean resolutionscore also decreased when the matrix size was de-creased to 192 © 192. The mean resolution scoredecreased further when the AF was increased to 4,as was observed at a matrix size of 226 © 226. Asignificant difference was only detected betweenthe sequence involving a matrix size of 226 © 226and an AF of 2 and the sequence involving a matrixsize of 192 © 192 and an AF of 4 (P < 0.05).
Clinical studyFigure 7A shows the CNR of 20 cholesteatoma
lesions (relative to the brainstem) on ss-EPI and iso-tropic DWI acquired using rs-EPI. CNRs of the le-
Fig. 4. Signal-to-noise ratio (SNR) of acetic acidversus distilled water in each sequence. (A) Matrixsize, 226 © 226. (B) Matrix size, 192 © 192.
Fig. 5. Distortion ratio (DR) values of acetic acid-containing straws with inner diameters of 4, 7, and10mm¤. (A) Matrix size, 226 © 226. (B) Matrix size,192 © 192.
148 T. Azuma et al.
Magnetic Resonance in Medical Sciences

sions were significantly higher on rs-EPI than ss-EPI (P < 0.05). The visual evaluation scores werealso significantly better for the rs-EPI images thanthe ss-EPI images (P < 0.05) (Fig. 7B).Following are typical clinical cases. Patient 1 was
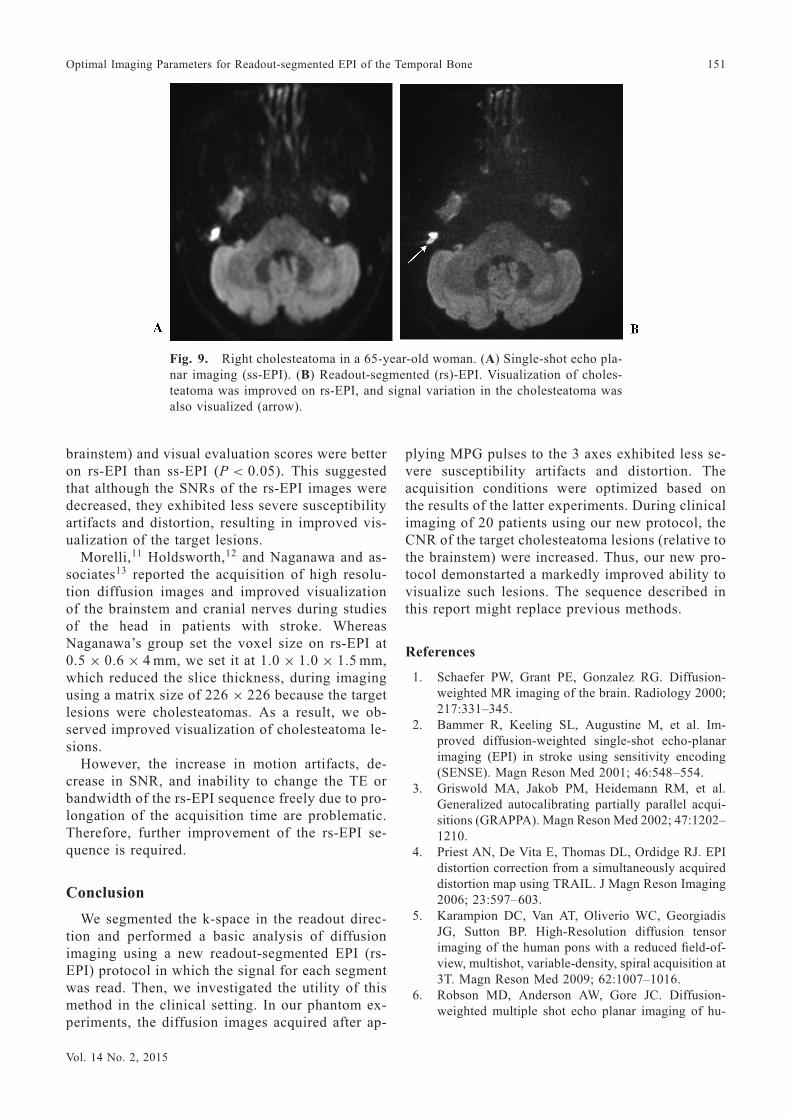
a 58-year-old man who developed a recurrent rightcholesteatoma following surgery. The lesion couldnot be clearly identified on ss-EPI but was success-fully visualized and exhibited high intensity andreduced distortion on rs-EPI (Fig. 8). Patient 2 wasa 65-year-old woman with a right cholesteatoma.The lesion could be identified on ss-EPI, but the le-sion was less distorted and its morphology was easi-er to visualize on rs-EPI. Furthermore, the rs-EPIimage exhibited high resolution (Fig. 9).
Discussion
We performed a basic investigation and assess-ment of the clinical utility of rs-EPI. When sampleholders (inner diameter, 10-mm¤) containing aceticacid or distilled water were imaged using rs-EPI andss-EPI, the highest SNR observed on rs-EPI (19segments; acquisition time 10 min 13 s) was lowerthan that on ss-EPI. Because the echo space re-mained constant, the SNR was improved by in-creasing the number of segments. The latter wasachieved by prolonging the readout time and reduc-ing the bandwidth. However, this prolonged the ac-quisition time, which is not appropriate for clinical
examinations. On rs-EPI, the SNR did not increasewhen the matrix size was reduced to 192 © 192,which might have been due to an increase in thebandwidth. The SNR did not decrease when the ma-trix size was set to a high resolution of 226 © 226.Thus, the latter matrix size was considered useful toimprove images by leading to an increased numberof sampling points in both readout directions.In the phantom and clinical studies, SNR and CNR
were measured using a 32-channel phased-array coil.The use of a prescan normalize filter for sensitivitycorrection was considered acceptable because thesame filter was applied to both signals and noise.As for the issues of heterogeneous sensitivity andparallel imaging, we considered our phantom meas-urements accurate because we employed the sub-traction mapping method described by Imai’sgroup8 and adopted an ROI size of 7 © 7 pixels.Heterogeneous sensitivity and parallel imaging
were also present during the CNR measurementsperformed in the clinical study, but these problemswere taken into consideration by the formula usedto calculate the CNR of the clinical images: CNR =(S1-S2)/f(SD12+SD22)/2g1/2. According to thestudy reported by Ogura and associates,9 stable val-ues with a normal distribution can be obtained usingan ROI size of 50 pixels, the same as that we used inthe present study.We also compared the DR of acetic acid-contain-
ing straws with inner diameters of 4, 7, or 10 mm¤
Fig. 6. Visual evaluation by 7 radiologists of single-shot (ss)- and readout-seg-mented echo planar imaging (rs-EPI) (shots, fixed to 11) images of resolutionphantom with changes in the matrix size and acceleration factor. n.s., not signifi-cant; *P < 0.05; **P < 0.005.
149Optimal Imaging Parameters for Readout-segmented EPI of the Temporal Bone
Vol. 14 No. 2, 2015

between ss-EPI and rs-EPI. On rs-EPI, the DR wasclose to 1.0 (representing the absence of distortion),even at an inner diameter of 4 mm. On ss-EPI, theDR changed depending on the inner diameter of thestraw, which might have been due to differences inmagnetic susceptibility. Because the magnetic di-pole is proportional to the magnetization of the 2poles and the distance between them, its influencemight have been large, even at identical levels ofmagnetic susceptibility. On rs-EPI, when the matrixsize was increased from 192 © 192 to 226 © 226,i.e., when the resolution was improved, the DR re-mained near 1.0. This suggests that increasing theresolution prolongs the readout time. Although thiswould have induced image distortion on ss-EPI, theabsolute amount of distortion would have been de-creased on rs-EPI by the reduction in pixel size,even though the readout time was extended.10
Therefore, high resolution images can be acquiredby setting the matrix size to 226 © 226. During themeasurements obtained with the resolution phan-tom, the highest resolution score was obtained at amatrix size of 226 © 226 and an AF of 2, whichagrees with the findings of the DR experiment. TheGRAPPA parallel imaging technique, which hasbeen suggested to shorten the readout time and re-duce distortion, is applicable to rs-EPI. However,when the AF was set to 4, the SNR decreased mark-edly and visual resolution also fell.Based on the above findings, the use of GRAPPA
with an AF of 2, 11 segments, and an acquisitiontime of 6 min 6 s might be appropriate because sus-ceptibility artifacts and distortion are less severe inthese conditions.In the clinical cases, lesional CNR (relative to the
Fig. 8. Right cholesteatoma in a 58-year-old man. (A) Single-shot echo planarimaging (ss-EPI). (B) Readout-segmented (rs)-EPI. Cholesteatoma was moreclearly visualized on rs-EPI (arrow).
Fig. 7. Evaluation of 20 patients with cholesteatomaon single-shot (ss)- and readout-segmented echo pla-nar imaging (rs-EPI). (A) Comparison of contrast-to-noise ratio (CNR) of cholesteatoma versus brainstem.CNR significantly increased on rs-EPI. *P < 0.05. (B)Visual evaluation by 2 neuroradiologists. The scoresignificantly increased on rs-EPI. *P < 0.05.
150 T. Azuma et al.
Magnetic Resonance in Medical Sciences
brainstem) and visual evaluation scores were betteron rs-EPI than ss-EPI (P < 0.05). This suggestedthat although the SNRs of the rs-EPI images weredecreased, they exhibited less severe susceptibilityartifacts and distortion, resulting in improved vis-ualization of the target lesions.Morelli,11 Holdsworth,12 and Naganawa and as-
sociates13 reported the acquisition of high resolu-tion diffusion images and improved visualizationof the brainstem and cranial nerves during studiesof the head in patients with stroke. WhereasNaganawa’s group set the voxel size on rs-EPI at0.5 © 0.6 © 4 mm, we set it at 1.0 © 1.0 © 1.5 mm,which reduced the slice thickness, during imagingusing a matrix size of 226 © 226 because the targetlesions were cholesteatomas. As a result, we ob-served improved visualization of cholesteatoma le-sions.However, the increase in motion artifacts, de-
crease in SNR, and inability to change the TE orbandwidth of the rs-EPI sequence freely due to pro-longation of the acquisition time are problematic.Therefore, further improvement of the rs-EPI se-quence is required.
Conclusion
We segmented the k-space in the readout direc-tion and performed a basic analysis of diffusionimaging using a new readout-segmented EPI (rs-EPI) protocol in which the signal for each segmentwas read. Then, we investigated the utility of thismethod in the clinical setting. In our phantom ex-periments, the diffusion images acquired after ap-
plying MPG pulses to the 3 axes exhibited less se-vere susceptibility artifacts and distortion. Theacquisition conditions were optimized based onthe results of the latter experiments. During clinicalimaging of 20 patients using our new protocol, theCNR of the target cholesteatoma lesions (relative tothe brainstem) were increased. Thus, our new pro-tocol demonstarted a markedly improved ability tovisualize such lesions. The sequence described inthis report might replace previous methods.
References
1. Schaefer PW, Grant PE, Gonzalez RG. Diffusion-weighted MR imaging of the brain. Radiology 2000;217:331–345.
2. Bammer R, Keeling SL, Augustine M, et al. Im-proved diffusion-weighted single-shot echo-planarimaging (EPI) in stroke using sensitivity encoding(SENSE). Magn Reson Med 2001; 46:548–554.
3. Griswold MA, Jakob PM, Heidemann RM, et al.Generalized autocalibrating partially parallel acqui-sitions (GRAPPA). Magn Reson Med 2002; 47:1202–1210.
4. Priest AN, De Vita E, Thomas DL, Ordidge RJ. EPIdistortion correction from a simultaneously acquireddistortion map using TRAIL. J Magn Reson Imaging2006; 23:597–603.
5. Karampion DC, Van AT, Oliverio WC, GeorgiadisJG, Sutton BP. High-Resolution diffusion tensorimaging of the human pons with a reduced field-of-view, multishot, variable-density, spiral acquisition at3T. Magn Reson Med 2009; 62:1007–1016.
6. Robson MD, Anderson AW, Gore JC. Diffusion-weighted multiple shot echo planar imaging of hu-
Fig. 9. Right cholesteatoma in a 65-year-old woman. (A) Single-shot echo pla-nar imaging (ss-EPI). (B) Readout-segmented (rs)-EPI. Visualization of choles-teatoma was improved on rs-EPI, and signal variation in the cholesteatoma wasalso visualized (arrow).
151Optimal Imaging Parameters for Readout-segmented EPI of the Temporal Bone
Vol. 14 No. 2, 2015

mans without navigation. Magn Reson Med 1997;38:82–88.
7. Porter DA, Heidemann RM. High resolution diffu-sion-weighted imaging using readout-segmentedecho-planar imaging and a two-dimensional naviga-tor-based reacquisition. Magn Reson Med 2009; 62:468–475.
8. Imai H, Miyati T, Ogura A, et al. [Signal-to-noiseratio measurement in parallel MRI with subtractionmapping and consecutive methods]. Jpn J RadiolTechnol 2008; 64:930–936. [Article in Japanese]
9. Ogura A, Miyati T, Kobayashi M, et al. [Method ofSNR determination using clinical images]. Jpn J Ra-diol Technol 2007; 63:1099–1104. [Article in Japa-nese]
10. Wan X, Gullberg GT, Parker DL, Zeng GL. Reduc-tion of geometric and intensity distortions in echo-
planar imaging using multireference scan. MagnReson Med 1997; 37:932–944.
11. Morelli J, Porter D, Ai F. at al. Clinical evaluation ofsingle-shot and readout-segmented diffusion-weight-ed imaging in stroke patients at 3T. Acta Radiol 2013;54:299–306.
12. Holdsworth SJ, Skera S, Newbould RD, Guzmann R,Blevins NH, Bammer R. Readout-segmented EPI forrapid high resolution diffusion imaging at 3T. Eur JRadiol 2008; 65:36–46.
13. Naganawa S, Yamazaki M, Kawai H, Sone M,Nakashima T, Isoda H. Anatomical details of thebrainstem and cranial nerves visualized by high res-olution readout-segmented multi-shot echo-planardiffusion-weighted images using unidirectional MPGat 3T. Magn Reson Med 2011; 10:269–275.
152 T. Azuma et al.
Magnetic Resonance in Medical Sciences