palm oil trade fair & seminar (pots kl...
TRANSCRIPT
1
10-16 October 2012
Shangri-La Hotel, Kuala Lumpur
OILS & FATS MARKET SCENARIO OF
BANGLADESH
PRESENTED BY
SYED RAFIQUR RAHMAN (B.Sc. Mechanical Engineer) Technical Director, City Group.
Dhaka, Bangladesh
PALM OIL TRADE FAIR & SEMINAR (POTS KL – 2012)
1
2
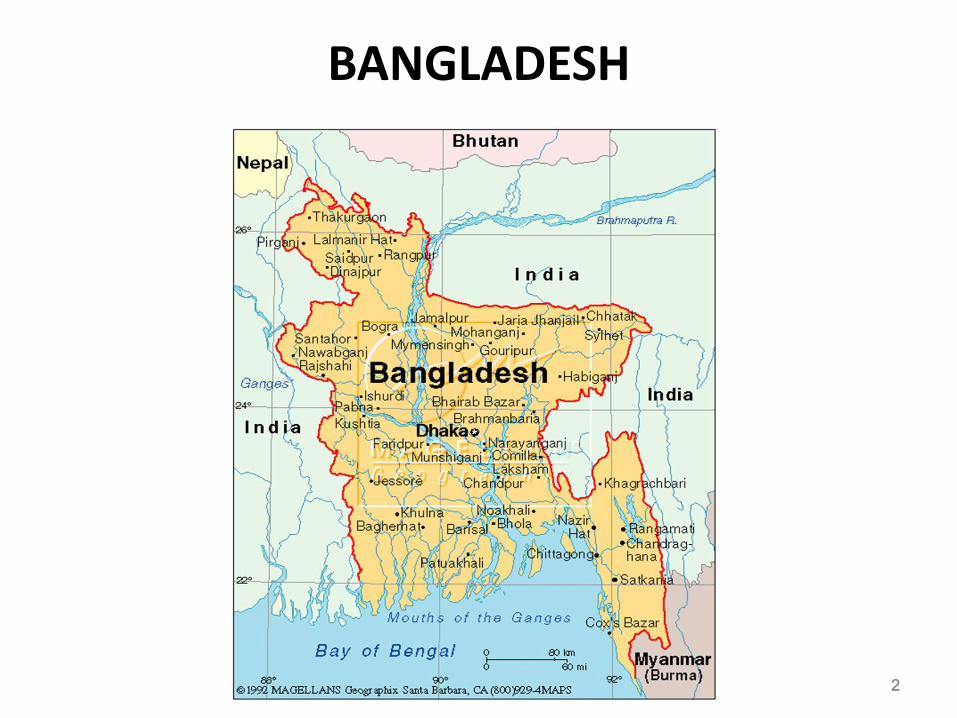
BANGLADESH
2

3
Statistical information • Country: Bangladesh • Capital: Dhaka • Area: 143,998 sq km • Population: 156,118,464 (July 2010 est.) • Population growth rate: 1.5% (2010 est.) • Life expectancy: 69 (2010 est.) • Ethnic groups: Bengali 98%, other 2% • Languages: Bangla (official), English • Inflation: 10.7% (2011 est.) • GDP purchasing power parity: US$282.2 billion (2011est.) • GDP per capita PPP: US$1,693 (2011 est.) • GDP per capita: US$ 678 (2011) • GDP composition by sector: agriculture: 20%; industry: 30%; services: 50% (2009
est.) • Land use: arable land: 55%; permanent crops: 3%; other: 42% (2005) • Major industries: cotton textiles, jute, garments, tea processing, paper newsprint,
cement, chemical fertilizer, light engineering, sugar • Agricultural products: rice, jute, tea, wheat, sugarcane, potatoes, tobacco, pulses,
oilseeds, spices, fruit; beef, milk, poultry • Natural resources: natural gas, arable land, timber, coal • Export commodities: garments, frozen fish and seafood, jute and jute goods, tea,
leather
3

4
Percentage of sector wise contribution to GDP during (2010 – 2011)
Sector wise contribution in economy
Service Sector 50%
Industry Sector 30%
Agriculture Sector 20%
Source:Bangladesh Economic Review-2011 (Bangla version), Ministry of Finance
4

5
Bangladesh GDP-per capita (PPP)
Bangladesh GDP - per capita (PPP)
Gross domestic
product based on
purchasing-power-
parity (PPP) per
capita GDP in US $
YearPercent
Change
1 301.8 19802 331.261 1981 9.76%3 353.214 1982 6.63%4 374.149 1983 5.93%5 394.136 1984 5.34%6 410.832 1985 4.24%7 426.118 1986 3.72%8 440.744 1987 3.43%9 456.103 1988 3.48%
10 482.679 1989 5.83%11 512.997 1990 6.28%12 541.8 1991 5.61%13 569.311 1992 5.08%14 594.82 1993 4.48%15 622.188 1994 4.60%16 652.432 1995 4.86%17 684.698 1996 4.95%18 719.758 1997 5.12%19 750.268 1998 4.24%20 787.812 1999 5.00%21 834.645 2000 5.94% Source: International Monetary Fund - 2011 World Economic Outlook
22 879.013 2001 5.32%23 920.411 2002 4.71%24 977.397 2003 6.19%25 1051.413 2004 7.57%26 1134.018 2005 7.86%27 1228.273 2006 8.31%28 1324.102 2007 7.80%29 1413.982 2008 6.79%30 1492.629 2009 5.56%31 1584.529 2010 6.16%32 1700 2011 7.32%
0
200
400
600
800
1000
1200
1400
1600
1800
1 2 3 4 5 6 7 8 9 1011121314151617181920212223242526272829303132
Gross domestic product based on purchasing-power-parity (PPP) per capita GDP in US $
Gross domesticproduct based
on purchasing-power-parity(PPP) percapita GDP in
US $
5

6
OILS & FATS IN BANGLADESH
BACKGROUND
• Bangladesh was self-sufficient in oils and fats till early `60s. Till that time Mustard oil was the major edible oil of Bangladesh, which was produced in sufficient quantity to meet the local demand. It is to be mentioned here that Mustard oil was the traditional edible oil of Bangladesh. Besides, some groundnut oil and sesame oil were also produced in the country to supplement the supply. But the supply of groundnut oil and sesame oil was not regular and the consumers were not as fond of this oil as edible oil because of comparatively high price. Major quantities of these two oils are being used as snack food.
• The local production of edible oil did not increase at the same pace as the demand increase with the population growth and increase in per capita consumption.
• As such at the end of the early part of `60s, soybean oil was brought from USA to meet the increasing demand. At first, consumers did not welcome soybean oil compared to mustard oil. Soybean oil was used to be sold through public distribution channel and was consumed by low income groups. After independence of Bangladesh in 1971, all essential commodities especially edible oil became insufficient and prices went up. Because of high price of locally produced mustard oil, the consumers inclined towards soybean oil, which was available at cheaper price and thus soybean oil started to dominate the market.
6

7
• In early `70s Palm oil was introduced to meet the growing demand.
• During that period there was no refining facility of crude palm oil. • As such, only refined palm olein was used to be imported. • Refined palm olein was being imported from Singapore by private
importers and was sold directly in the market. • On the other hand few international aid agencies distributed
refined palm olein through govt. rationing system. • Due to better quality and price compared to other cooking oils,
palm olein earned consumer’s confidence quickly as good cooking oil.
• But in mid `80s, because of anti-palm oil campaign and prevailing
market situation, negative perception about palm oil developed among the consumers of the country and import in relation to consumption of palm oil started to decline.
7

8
Bangladesh : One of the biggest markets of edible oil: • With the annual import of above 1.5 million tons of edible oils and fats, both crude
and refined, Bangladesh has turned into one of the biggest market of edible oil. For past few years, Malaysia and Indonesia have been exporting refined & crude edible oil to Bangladesh.
• Before '60s, oil industries in Bangladesh meant only local made oil seed crushing units. Later on, edible oil refining units started to setup gradually in the country but till late '80s, the growth was very slow. To cope up with the situation, new refineries started to set up and simultaneously palm oil refining technology was also introduced in the country. Since mid '90s, when the palm oil gradually became popular, more and more palm oil refining units were set up in Bangladesh.
• These industries started to refine crude palm olein, which received a good response from the market because of its competitive price and quality as well. In later part of `90s fractionation plant had been set up by few industries and double fractionated palm olein locally known as super palm started to come into the market, the acceptance of super palm olein in the country rapidly increased.
• At present in Bangladesh there are more than 50 oil refining units among which 18 of them are in active and together they produce about 1.4 million tonnes of refined
edible oils annually of which about 70% is refined Palm Olein and Super Palm
Olein and 30% refined soya bean oil. These refineries have their own coordinating organization – the Bangladesh Vegetable Oil Refiners Association – but refineries act individually when it comes to importing and any refinery can import CDSBO.
8

9
In 2011 total 420,000 hectares of land was cultivated to get 387,000 tonnes of oil
seeds namely, Mustard, Soybean, Groundnuts, Copra and Linseed. Mustard is the major oil seed crop occupying about 59.43% of total production annual production.
The Department of Agriculture Extension (DAE) had fixed a target of producing
259,258 tonnes of mustard seeds in 2011 from 216,048 hectares of land with a yield rate of 1.20 tonne mustard seed per hectare.
Sunflower cultivation is easier, cheaper and more profitable. It requires very little
irrigation and small amount of fertilizers and insecticides. The average yield of sunflower is 1.4 tonnes per hectare.
Local farmers are encouraged in cultivating sunflower, mustard and sesame as it
helps them to get edible oil at low cost while price of edible oil in local market is too high, while soyabean is cultivated for use in poultry feed production.
Besides, annually about 25,000 tonnes of cow ghee is produced
9
Indigenous Production of Oils & Fats

10
The decorticated pressed cake, the soya cake and mustard cake is being used as food ingredient for poultry and livestock, while some quantities of mustered cake is used as fertilizer also.
In 2003, the City Group of Industries established an oilseed solvent extraction
plant. Production is now on going at capacity of 1,000 MT per day. City Group is now crushing 50 percent soybean and 50 percent mustard/canola seeds. Installation work of another 2000 MT per day solvent extraction Plant is on process which will come on production during November-December 2012. Meghna Group of Industries installed one 2000 MT per day solvent extraction plant which is in operation since April 2012. Another smaller size plant [supplied by China] was set up in Chittagong by S. Alam Group. Crushing capacity of this plant is 200 MT per day but it is not in success due to high consumption of Hexane.
Recently, Vietnam Vegetable Oils Industry Corporation [VOCARIMEX], a state
owned enterprise has focused on Bangladesh market with their various products including crude and refined Soya Bean oil, Palm Oil, Coconut Oil, Cottonseed
Oil, Vegetable Ghee etc.
10

11
CONSUMPTION OF OILS & FATS IS INCREASING IN BANGLADESH
In Bangladesh, the per capita consumption of oils & fats remained far below the world average of 16 kgs. and was hovering in between 5 to 7 kg for long time. However, in 2011 it stands at 9 kg. Country`s nutritional experts described such increase as very encouraging, which, according to them, would have positive impact on national health.
Though still it is far below the required level prescribed by the nutritional experts, the
per capita consumption of oils & fats in Bangladesh has been increasing gradually. As the oil is a compact source of energy its regular consumption at required level is
essential for normal growth of human body. Besides, vitamins A,B,E& K are absorbed in our body through oil, “Accordingly, about
25 to 30% of our daily calories intake should come from oil “, experts maintain. The consumption of oil and fats in Bangladesh has been increasing due to increased
level of awareness of the consumers about health and nutrition and increase in population growth.
11

12
CDSBO imports stood at 395,290 tonnes in 2011 declining by 7,21% compared to 2010 due to its high price as shown on table-1. The average C&F price of CDSBO and refined soybean oil both increased by 40% in 2011 compared to 2010. On the other hand palm oil (CPO, CPL and RBD PL)
contributed to increase in import.
Soybean Seed imported for local crushing increased significantly by 184.33%
to 150,060 tonnes in 2011, the oil equivalent was 27,011 tonnes on 18% extraction basis. (Table-1). Canola/mustard seed imports registered to 157,133 tonnes up by 4.06% over the same period. The oil equivalent was 59,711 tonnes on 38% extraction basis. (Table-1)
CPO, CPL and RBD PL imports increased by 2.03% (Table-2) in spite of the 31-36% increase in average global price and consequent increase by a similar margin in the average prices of refined olein and super olein in Bangladesh.
12
Present Import Trend of Oils and Fats

13
Table 1: Oils & Fats Imports Trend in Bangladesh
Table 1: Oils & Fats Imports (tonnes)
Jan-Dec 2011 Jan-Dec 2010 Change(Vol) Change(%)
Crude degummed SBO 395,290 425,984 -30,694 -7.21
Crude SBO from imported beans1 27,011 (150,060)
9,500 (52,783)
17,511 184.33
Canola/mustard oil from imported seed2
59,711 (157,133)
57,381 (151,003)
2,330 4.06
Coconut oil3 8,352 6,006 2,346 39.06
CPO & CPL 671,122 804,140 -133,018 -16.54
RBD PL 277,953 126,007 151,946 120.59
Crude/RBD PS 9,232 7,990 1,242 15.54
PFAD 2,788 6,150 -3,362 -54.67
PKO 10,982 6,655 4,327 65.02
Refined vegetable oils4 1,976 1,090 886 81.28
Butter oil 91 187 -96 -51.34
Ghee/vegetable ghee/shortening 694 1,374 -680 -49.49
TOTAL 1,465,202 1,452,464 12,738 0.88
Source: Chittagong Port Authority/Bulk Storage Terminals/Importers, MPOC Market Intelligence:MPOB Note: 1Oil equivalent of imported beans @18% extraction: data within brackets=volume of imported beans. 2 Oil equivalent of imported seed @38% extraction: data within brackets=volume of imported seed. 3 includes both the oil & oil equivalent of imported copra @60% extraction. 4 all refined edible vegetable oils, except palm olein, imported in consumer packs/bulk
13

14
Table 2: Palm oil imports (tonnes)
Volume Change(%)
2011 949,075 2.03
2010 930,147 -9.09
2009 1,023,128 25.39
2008 815,965 40.21
2007 581,183 Source: MPOC Market Intelligence
14
Imports of Malaysian palm oil (MPO) declined to 134,010 tonnes in 2011, a drop of 18.45% compared to 2010 (Table-3).
Table-3: Palm oil Imports from Malaysia (tonnes)
Jan-Dec 2011 Jan-Dec 2010 Change (vol) Change (%)
CPO, CPL and RBD PL 134,010 164,320 -30,310 -18.45

15
IMPORT RATIO
In 2011 total import of fats & oils in Bangladesh was 1,465,202 tonnes of which Palm oil 949,075
tonnes, Soybean oil 422,301 tonnes and Canola/mustard oil 59,711 tonnes and (others 34,115 tonnes), i.e. at an import ratio of 66:30:4 respectively.
YEARWISE IMPORT TREND OF MAJOR THREE EDIBLE OILS: 2005--2011
2005 2006 2007 2008 2009 2010 2011
Palm oil 826 879 581 816 1,023 930 949
Soybean oil 207 320 508 217 397 435 422
Canola/Musta
rd oil 29 49 73 27 44 57 60
Total 1,062 1,248 1,162 1,060 1,464 1,422 1,431
Canola/Mustard oil figures are oil equivalent of imported seed @ 38% oil extractions
0
200
400
600
800
1000
1200
1400
1600
2005 2006 2007 2008 2009 2010 2011
Palm oil
Soybean oil
Canola/Mustard oil
Total
15

16
In 2011, the consumption quantity of fats & oils in Bangladesh was 1,582,000 tonnes of which
Palm oil 991,000 tonnes, soybean oil 405,000 tonnes and canola/mustard oil 106,000 tonnes,
i.e. consumption ratio 66:27:7 Fig: 2
Imports of Oils & Fats in Bangladesh in 2011 Consumption of Oils & Fats in Bangladesh in 2011
Total: 1,465,202 tonnes Total: 1,582,000 tonnes
Palm oil 949,075
Soybean oil 422,301
Canola/ Mustard oil 59,711
PKO 10,982
Coconutoil 8,352
Others 14,781
Palm oil 991,000
Soybean oil 405,000
Canola/ Mustard oil 106,000
PKO 22,000
Coconutoil 26,000
Sunflower oil 1,000
Butter 28,000
Others 3,000
991,000
405,000
106,000
22,000
26,000 1,000
28,000
3,000
Palm oil
Soybean oi l
Canola/ Mustard oil
PKO
Coconutoi l
Sunflower oi l
Butter
Others
Source: MPOC Market Intelligence Note: 1. Soybean oil figure indicates both CDSBO &oil eqivalent of extracted soybeans @ 18%
2. Canola/Mustard oil figure is the oil equivalent of extracted Canola/Mustard seed @ 38%
Source: MPOC Market Intelligence
CONSUMPTION RATIO
16

17
Yearwise Consumption of Palm Oil in Bangladesh in 1000 MT
Year Consumption
MT Growth
Rate
2000 306 90.06%
2001 395 29.08%
2002 398 0.76%
2003 540 35.68%
2004 747 38.33%
2005 800 7.10%
2006 860 7.50%
2007 797 -7.33%
2008 700 -12.17%
2009 891 27.29%
2010 1015 13.92%
2011 1020 0.49%
2012 until Aug.
1075 5.39% Source: United States Department of Agriculture
17

18
Yearwise Import of Palm oil in Bangladesh ( IN 1000 MT )
YEAR Imports
MT Growth
Rate
2000 327 90.12%
2001 399 22.02%
2002 398 -0.25%
2003 528 32.66%
2004 757 43.37%
2005 847 11.89%
2006 898 6.02%
2007 724 -19.38%
2008 700 -3.31%
2009 951 35.86%
2010 996 4.73%
2011 975 -2.11%
2012 until Aug
1075 10.26%
Source: United States Department of Agriculture
18

19
Yearwise Consumption of Soybean oil in Bangladesh (in 1000 MT)
Year Consumpti
on MT Growth
Rate
2000 503 5.67%
2001 416 -17.30%
2002 393 -5.53%
2003 366 -6.87%
2004 275 -24.86%
2005 276 0.36%
2006 342 23.91%
2007 380 11.11%
2008 353 -7.11%
2009 371 5.10%
2010 388 4.58%
2011 410 5.57%
2012 until AUGUST 415 1.22%
Source: United States Department of Agriculture
19

20
Yearwise Import of Soyabean oil in Bangladesh ( In 1000 MT)
Year Imports MT Growth
Rate
2000 503 4.57%
2001 406 -19.28%
2002 383 -5.67%
2003 332 -13.32%
2004 228 -31.33%
2005 262 14.91%
2006 327 24.81%
2007 401 22.63%
2008 254 -36.66%
2009 349 37.40%
2010 376 7.74%
2011 425 13.03%
2012 until
AUGUST 370 -12.94% Source: United States department of Agriculture
20

21
Bangladesh Palm oil/soybean oil domestic consumption by year in 1000 MT
Bangladesh Palm oil/Soybean oil Domestic Consumption by year (in 1000 MT)
2000 2001 2002 2003 2004 2005 2006 2007 2008 2009 2010 2011 2012 til Aug
Palm oil 306 395 398 540 747 800 860 797 700 891 1015 1020 1075
Soybean oil 503 416 393 366 275 276 342 380 353 371 388 410 415
Source: United States Department of Agriculture
0
200
400
600
800
1000
1200
2000 2001 2002 2003 2004 2005 2006 2007 2008 2009 2010 2011 2012 til Aug
Palm oil
Soybean oil
21

22
Yearwise Import of Palm Oil vis-à-vis Soyabean oil in Bangladesh (In 1000 MT)
2000 2001 2002 2003 2004 2005 2006 2007 2008 2009 2010 2011 2012 til Aug
Palm oil 327 399 398 528 757 847 898 724 700 951 996 975 1075
Soybean oil 503 406 383 332 228 262 327 401 254 349 376 425 370
Source: United States Department of Agriculture
0
200
400
600
800
1000
1200
2000 2001 2002 2003 2004 2005 2006 2007 2008 2009 2010 2011 2012 til Aug
Palm oil
Soybean oil
22

23
DESCRIPTION
TARIFF NOTES
Crude palm oil/Olein
0%
10% VAT
Crude Degummed Soybean Oil
0%
10% VAT
Refined Palm Olein
0%
10% VAT
Refined Soybean Oil
0%
10% VAT
Refined Sunflower Oil
0%
15% VAT
Crude Palm Stearin Restricted to Soap Products
13%
15% VAT
Palm Kernel Oil 25% 10% VAT + 5% regulatory duty
Crude Palm Kernel Oil
13%
15% VAT
Import Tariff on Oils and Fats

24
Name Estimated Volume of Palm Oil Imports
Brand Name of Palm Olein
City Group
38,700 MT CPO 98,753 MT CPL
Natural
S.A.Group
5,000 MT CPO 57,589 MT CPL
------
Nurjahan Group
6,000 MT CPO 146,950 MT CPL
------
T.K.Group
49,158 MT CPO 75,840 MT CPL
Hilsa Family
Mostafa Group
20,000 MT CPO 17,704 MT CPL
Shakti
S.Alam Group
40,327 MT CPL
--------
MEB
6,000MT CPO 122,513 MT CPL
Dalda Super
Meghna Group
9,500 MT CPO 92,871 MT CPL
Pure
Major Importers of Palm Oil in 2011 and Respective Brands

25
OILS & FATS INDUSTRIES BRIEF PROFILE MAJOR REFINERIES WITH CAPACITY
Name of the Refining Group Number of Plants (Units) Capacity (Tonnes/day)
City Group
Refineries-3 Dry Fractionation-2
2,300 1,800
S.A.Group
Refineries-3 Dry Fractionation-2
1,000 1,000
Nurjahan Group
Refineries-2 Dry Fractionation-1
1,300 500
T.K.Group
Refineries-3 Dry Fractionation-2
1,700 1,000
Mostafa Group
Refineries-1 Dry Fractionation-1
450 300
S.Alam Group
Refineries-2 Dry Fractionation-2
150 120
MEB
Refineries-1 Dry Fractionation-1
500 300
Meghna Group
Refineries-2 Dry Fractionation-2
1,300 1,100

26
NAME OF THE COMPANY CAPACITY
CITY GROUP (VOTT OIL REFINERY)
120,000 MT
SUMMIT UNITED TANK TERMINAL
85,000 MT
MEB GROUP OF INDUSTRIES
65,000 MT
T.K.GROUP OF INDUSTRIES
45,000 MT
MOSTAFA GROUP (EASTERN FISHING)
30,000 MT
Storage Capacity of Bonded Tank Terminals in Bangladesh

27

28

29
29

30
30

31
PROSPECT OF OIL PALM CALTIVATION IN BANGLADESH
The first batch of oil palm seeds was brought from Malaysia in 1978.
Oil palm cultivation started in Bangladesh from 1979 through the import of seedlings from Nigeria and Malaysia.
By 1981 about 784 acres of land were brought under oil palm plantations. Insects, rats, wild animals, and some diseases affect the growth and
cultivation of oil palm in Sylhet area. Considerable damage of plantations of Cox's Bazar Division by elephants is reported.
31

32
As it is a labour intensive work, such plantation would lead to generation of employment for the poor people and thus can contribute in create massive employment opportunity. The Job seekers who went to Malaysia and worked in oil palm gardens have practical experience in oil palm gardening can be engaged in oil palm plantation.
Few NGO`s started to work in oil Palm tree Plantation in Hilly district of
Chittagong and they have shown success in plantation. Nearly 500,000 Oil Palm trees, scattered across the country with concentration in Chittagong Hill tracks, are now fruit bearing and on an average, weight of each bunch is about 40 to 50 kgs, which shows that the land is suitable for Oil Palm planation.
The agriculture extension department and the forest department are assigned to take separate projects for oil palm plant cultivation in Bangladesh.
In Bangladesh, still there is no facility to extract palm oil from flash (mesocarp). Since, Oil Palm trees in Bangladesh are fruits bearing a Palm oil Mill may be set-up near the plantation area to extract Palm oil from the palm fruits. There is a good opportunity for the Malaysian expertise to utilize their technical know-how to work together with Bangladeshi entrepreneurs to build up the required facilities for extraction of palm oil.
In Bangladesh there are millions of hectors of uncultivated lands are laying
vacant, mostly are in Hilly district of Chittagong and nearby, Sylhet, Tangail, and Mymensingh, which could be taken under oil palm plantation.
32

33
Conclusion
Indigenous production of oils and fats in Bangladesh is insufficient to meet the local demand.
Bangladesh is dependent on import to meet its annual requirement of
oils and fats, which is in increasing trend in pace with increase of consumption.
Palm oil is price competitive and contributes to keep the prices of
edible oils steady in the local market. Palm oil is heart friendly and provides vitamins that protect us from
heart disease and cancer. So for cost and health ground palm oil is recommended for
consumption in Bangladesh.
33

34
THANK YOU
34