partim transshipment volumes
TRANSCRIPT

1
2 3
7th Framework Programme SST.2013.6-‐2. Towards a competitive and resource efficient port transport system Collaborative Project Grant Agreement no. 605176
Deliverable 1.1: State of the European Port System – market trends and structure update
Partim transshipment volumes
DOCUMENT ID PORTOPIA|D|1.1|DT|2013.05.11 DUE DATE OF DELIVERABLE 31/12/2013 ACTUAL SUBMISSION DATE 08/01/14 DISSEMINATION LEVEL
PU

Deliverable 1.1: State of the European Port System – market trends and structure update Partim transshipment volumes
0
DELIVERABLE 1.1: STATE OF THE EUROPEAN PORT SYSTEM – MARKET TRENDS AND STRUCTURE UPDATE Partim transshipment volumes
AUTHORSHIP
Author(s) Prof. dr. Notteboom, T., dr. Parola, F., dr. Satta, G.
Beneficiary Partner UA-‐ITMMA, UNIGE
Issue Date 2014-‐05-‐12
Revision
Status
Contributors /
Pages 31
Figures 13
Tables 7
Annexes 0
SIGNATURES
Author(s) Prof. dr. Theo Notteboom
Coordinator Prof. dr. Michaël Dooms
Disclaimer The information contained in this report is subject to change without notice and should not be construed as a commitment by any members of the PORTOPIA Consortium or the authors. In the event of any software or algorithms being described in this report, the PORTOPIA Consortium assumes no responsibility for the use or inability to use any of its software or algorithms. The information is provided without any warranty of any kind and the PORTOPIA Consortium expressly disclaims all implied warranties, including but not limited to the implied warranties of merchantability and fitness for a particular use. (c) COPYRIGHT 2014 The PORTOPIA Consortium This document may be copied and reproduced without written permission from the PORTOPIA Consortium. Acknowledgement of the authors of the document shall be clearly referenced. All rights reserved.

Deliverable 1.1: State of the European Port System – market trends and structure update Partim transshipment volumes
1
DELIVERABLE 1.1: STATE OF THE EUROPEAN PORT SYSTEM – MARKET TRENDS AND STRUCTURE UPDATE Partim transshipment volumes
REVISION
Revision Date Reviewer Name Reviewer Signature
2014-‐02-‐28 Prof. dr. Michaël Dooms
Drs. Mychal Langenus
Michaël Dooms
Mychal Langenus
2014-‐05-‐12 Prof. dr. Michaël Dooms
Drs. Mychal Langenus
Michaël Dooms
Mychal Langenus
HISTORY
Version Date Version Id Status Comment
2013-‐12-‐31 V0.0 [DRAFT] [BRIEF DESCRIPTION OF THE REVISION]
2014-‐01-‐08 V0.1 [DRAFT] Draft report
2014-‐02-‐28 V0.2 [DRAFT] Reviewing done by VUB (Coordinator)
2014-‐03-‐05 V0.2 [DRAFT] Presented at the EA&S Committee of ESPO
-‐ Comments by the EA&S committee and EC collected
-‐ Further review by ESPO membership and EC (March -‐ April 2014)
2014-‐05-‐11 V1.0 [FINISH] Final version
2014-‐05-‐12 V1.0 [FINISH] Quality check by VUB (Coordinator)
Deliverable 1.1: State of the European Port System – market trends and structure update Partim transshipment volumes
2
DELIVERABLE 1.1: STATE OF THE EUROPEAN PORT SYSTEM – MARKET TRENDS AND STRUCTURE UPDATE Partim transshipment volumes
Summary Report
Introduction
Deliverable 1.1 (D1.1) is focused on the state of the EU port system and an update on the market trends and structure. This includes four specific tasks: (1) an update of the traffic forecast of the EU Ports Policy impact assessment (2) a synthesis of the information regarding container transshipment volumes (3) the modal split figures of the core TEN-T ports (4) an approach to integrate intra-European dynamics into the Market Trends and Structure
This deliverable report focuses on (2): a synthesis of the information regarding container transshipment volumes.

Deliverable 1.1: State of the European Port System – market trends and structure update Partim transshipment volumes
3
DELIVERABLE 1.1: STATE OF THE EUROPEAN PORT SYSTEM – MARKET TRENDS AND STRUCTURE UPDATE Partim transshipment volumes
List of Contents
Summary Report ........................................................................................................................... 2
Positioning of this report in WP1 ........................................................................................... 4 1
Definition of transshipment ................................................................................................... 4 2
A global perspective of the transshipment market ................................................................ 6 3
Data collection on transshipment activities in European ports ........................................... 11 4
An overview of the T/S market in Europe and in European ports ........................................ 12 5
5.1 The environmental and business transformations .................................................... 13
5.2 The evolution of transshipment operations in North and South Europe .................. 17
Discussion and expectations for the future .......................................................................... 25 6
6.1 Overall transshipment incidence in Europe and European port ranges .................... 25
6.2 The Mediterranean and Black Sea ............................................................................. 27
6.3 The Baltic ................................................................................................................... 29
6.4 The UK/Ireland .......................................................................................................... 30
Conclusions and recommendations ..................................................................................... 31 7

Deliverable 1.1: State of the European Port System – market trends and structure update Partim transshipment volumes
4
POSITIONING OF THIS REPORT IN WP1 1
The aim of WP1 within the PORTOPIA project is to further develop the PPRISM indicators on market trends and structure and to seek meaningful expansions. The specific objectives of the work package include:
• Improving data availability and comparability of PPRISM indicators
• Collecting and presenting data at a more disaggregated level in terms of goods types and time periods
• Developing new indicators (ratios and indexes)
• Develop forecasts on short, medium and long term developments in port activities in Europe using a combination of techniques (modeling, meta-analysis and survey)
• Incorporation in a European Port Observatory (EPO) with a link between indicators and specific policy targets in the EU transport policy.
Deliverable 1.1 (D1.1) is focused on the state of the EU port system and an update on the market trends and structure. This includes four specific tasks:
(1) an update of the traffic forecast of the EU Ports Policy impact assessment
(2) a synthesis of the information regarding container transshipment volumes
(3) the modal split figures of the core TEN-T ports
(4) an approach to integrate intra-European dynamics into the Market Trends and Structure
This report deals with task (2).
DEFINITION OF TRANSSHIPMENT 2
From a network perspective, the location and function of container terminal facilities is not always guided by the proximity of the terminal/port toward a local/regional hinterland region. Also in Europe, the cargo distribution patterns of container ports not only rely on connecting maritime flows to inland transport modes (road haulage, rail and barge). In a growing number of ports, container shipping lines send their deepsea vessels to intermediate locations between origins and destinations where containers are transshipped between vessels. Thus, container cargo is transshipped by combining/linking two or more liner services. These intermediate nodes are added to a network when considered appropriate by the network operators in view of overall performance of the network. Shipping lines, in fact, aims at increasing the average utilization rate of vessels (i.e. to minimize empty slots onboard), in order to achieve economies of scale and go to break-even.
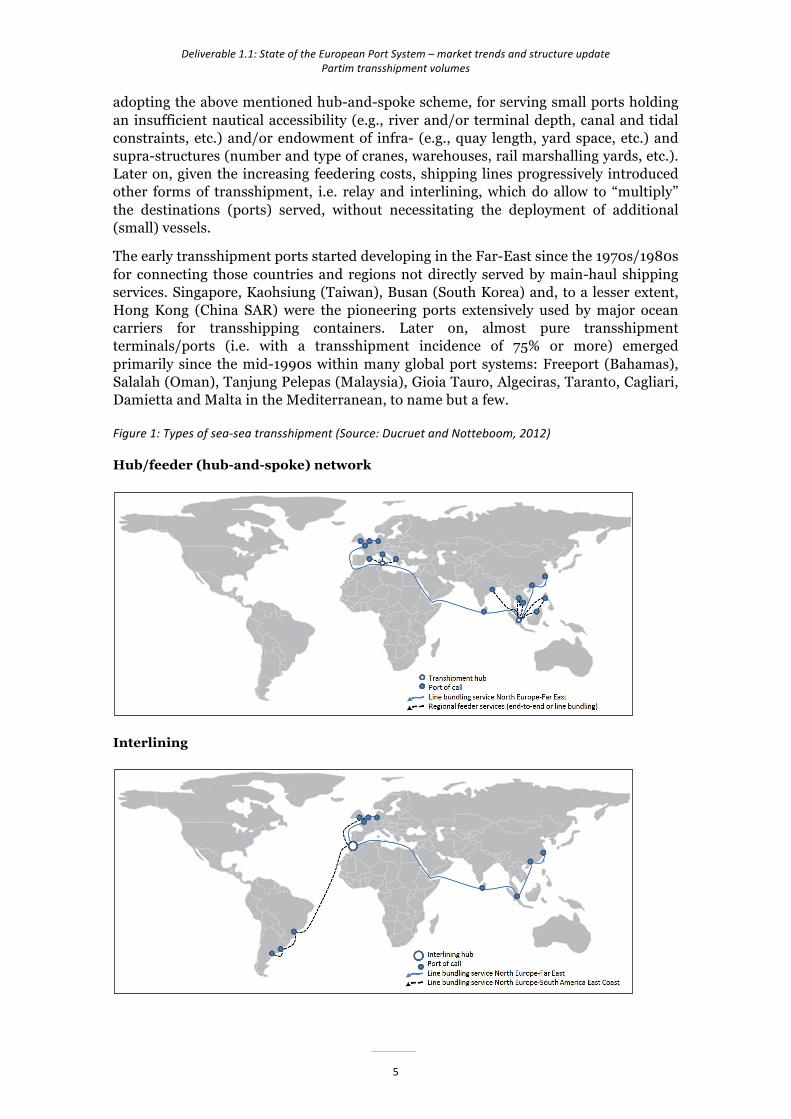
Three forms of sea-sea transshipment exist: hub-and-spoke (hub/feeder), interlining and relay (Figure 1). In all three cases a deepsea vessel discharges containers in the transshipment terminal which is later on (typically 1 to 3 days) picked up by a smaller container ship (feeder) or another large deepsea vessel (relay and interlining). Drewry (2010) estimates that 85% of the global transshipment market is connected to hub-and-spoke operations and 15% to relay/interlining. As we will discuss later in this report, these figures can vary significantly between individual transshipment ports, also within Europe. Originally, transshipment operations were introduced by shipping lines by
Deliverable 1.1: State of the European Port System – market trends and structure update Partim transshipment volumes
5
adopting the above mentioned hub-and-spoke scheme, for serving small ports holding an insufficient nautical accessibility (e.g., river and/or terminal depth, canal and tidal constraints, etc.) and/or endowment of infra- (e.g., quay length, yard space, etc.) and supra-structures (number and type of cranes, warehouses, rail marshalling yards, etc.). Later on, given the increasing feedering costs, shipping lines progressively introduced other forms of transshipment, i.e. relay and interlining, which do allow to “multiply” the destinations (ports) served, without necessitating the deployment of additional (small) vessels.
The early transshipment ports started developing in the Far-East since the 1970s/1980s for connecting those countries and regions not directly served by main-haul shipping services. Singapore, Kaohsiung (Taiwan), Busan (South Korea) and, to a lesser extent, Hong Kong (China SAR) were the pioneering ports extensively used by major ocean carriers for transshipping containers. Later on, almost pure transshipment terminals/ports (i.e. with a transshipment incidence of 75% or more) emerged primarily since the mid-1990s within many global port systems: Freeport (Bahamas), Salalah (Oman), Tanjung Pelepas (Malaysia), Gioia Tauro, Algeciras, Taranto, Cagliari, Damietta and Malta in the Mediterranean, to name but a few.
Figure 1: Types of sea-‐sea transshipment (Source: Ducruet and Notteboom, 2012)
Hub/feeder (hub-and-spoke) network
Interlining

Deliverable 1.1: State of the European Port System – market trends and structure update Partim transshipment volumes
6
Relay
Source: Ducruet and Notteboom, 2012
These transshipment hubs have a range of common characteristics in terms of nautical accessibility, proximity to main shipping lanes (i.e. low diversion distance from the trunk routes) and ownership, in whole or in part, by carriers or international terminal operators. These nodes multiply shipping options and improve connectivity within the network through their pivotal role in regional hub-and-spoke networks and in cargo relay and interlining operations between the carriers’ east–west services and other inter- and intra-regional services. Next to the ‘pure’ transshipment hubs, there are many ports combining significant gateway cargo flows with a hinterland orientation with transshipment flows. The situation and figures for the European port system will be provided later in this report.
A GLOBAL PERSPECTIVE OF THE TRANSSHIPMENT MARKET 3
The shipping industry has witnessed spectacular growth in container trade, fuelled by the globalization process and the large-scale adoption of the container. Worldwide container port throughput increased from 36 million TEU in 1980 and 88 million TEU in 1990 to about 528 million TEU in 2008 and 623 million TEU in 2012. Around 79% of the world port throughput involved laden containers, about 21% are empty containers. In addition, about 28% of the total throughput consists of transshipped containers. Sea-sea transshipment shows the strongest growth and more than tripled in the last 15 years (Table 1).
Deliverable 1.1: State of the European Port System – market trends and structure update Partim transshipment volumes
7
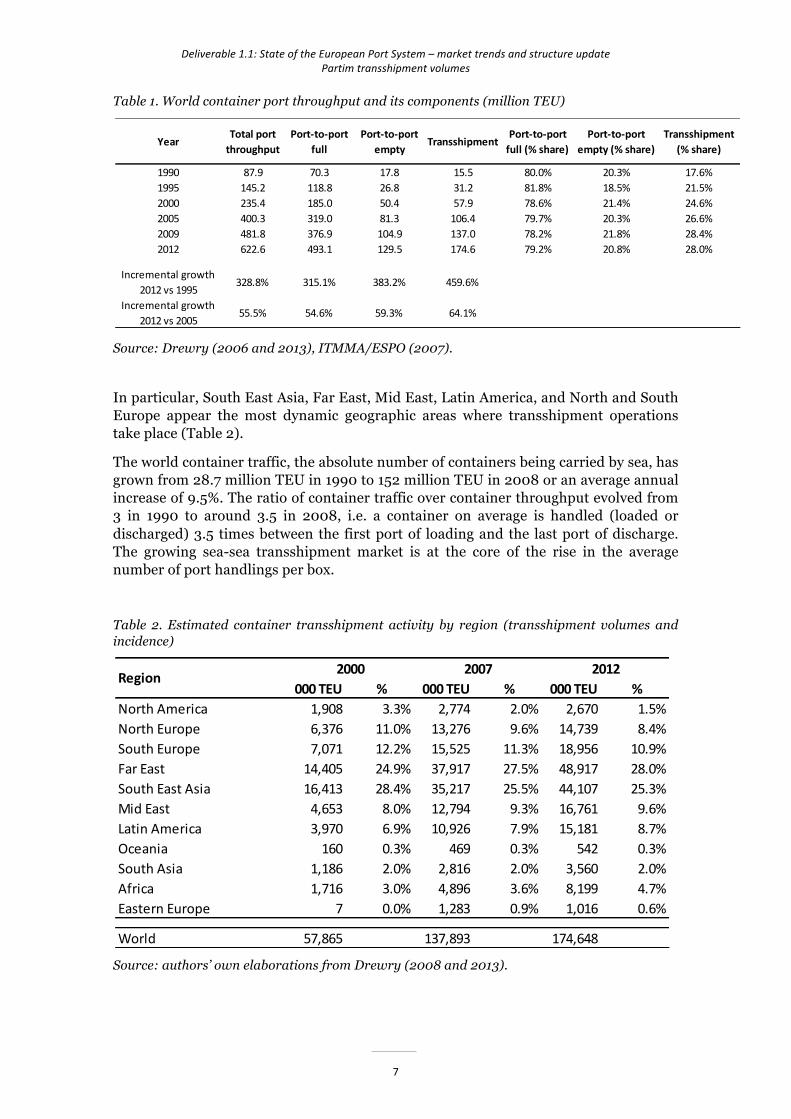
Table 1. World container port throughput and its components (million TEU)
Source: Drewry (2006 and 2013), ITMMA/ESPO (2007).
In particular, South East Asia, Far East, Mid East, Latin America, and North and South Europe appear the most dynamic geographic areas where transshipment operations take place (Table 2).
The world container traffic, the absolute number of containers being carried by sea, has grown from 28.7 million TEU in 1990 to 152 million TEU in 2008 or an average annual increase of 9.5%. The ratio of container traffic over container throughput evolved from 3 in 1990 to around 3.5 in 2008, i.e. a container on average is handled (loaded or discharged) 3.5 times between the first port of loading and the last port of discharge. The growing sea-sea transshipment market is at the core of the rise in the average number of port handlings per box.
Table 2. Estimated container transshipment activity by region (transshipment volumes and incidence)
Source: authors’ own elaborations from Drewry (2008 and 2013).
YearTotal port throughput
Port-‐to-‐port full
Port-‐to-‐port empty
TransshipmentPort-‐to-‐port full (% share)
Port-‐to-‐port empty (% share)
Transshipment (% share)
1990 87.9 70.3 17.8 15.5 80.0% 20.3% 17.6%1995 145.2 118.8 26.8 31.2 81.8% 18.5% 21.5%2000 235.4 185.0 50.4 57.9 78.6% 21.4% 24.6%2005 400.3 319.0 81.3 106.4 79.7% 20.3% 26.6%2009 481.8 376.9 104.9 137.0 78.2% 21.8% 28.4%2012 622.6 493.1 129.5 174.6 79.2% 20.8% 28.0%
Incremental growth 2012 vs 1995
328.8% 315.1% 383.2% 459.6%
Incremental growth 2012 vs 2005
55.5% 54.6% 59.3% 64.1%
000 TEU % 000 TEU % 000 TEU %North America 1,908 3.3% 2,774 2.0% 2,670 1.5%North Europe 6,376 11.0% 13,276 9.6% 14,739 8.4%South Europe 7,071 12.2% 15,525 11.3% 18,956 10.9%Far East 14,405 24.9% 37,917 27.5% 48,917 28.0%South East Asia 16,413 28.4% 35,217 25.5% 44,107 25.3%Mid East 4,653 8.0% 12,794 9.3% 16,761 9.6%Latin America 3,970 6.9% 10,926 7.9% 15,181 8.7%Oceania 160 0.3% 469 0.3% 542 0.3%South Asia 1,186 2.0% 2,816 2.0% 3,560 2.0%Africa 1,716 3.0% 4,896 3.6% 8,199 4.7%Eastern Europe 7 0.0% 1,283 0.9% 1,016 0.6%
World 57,865 137,893 174,648
Region 2000 2007 2012
Deliverable 1.1: State of the European Port System – market trends and structure update Partim transshipment volumes
8
Container shipping lines have been the key players in setting up liner services centred around transshipment hubs. Liner shipping networks are developed to meet the growing demand in global supply chains. Shippers demand direct services between their preferred ports of loading and discharge. The demand side thus exerts a strong pressure on the service schedules, port rotations and feeder linkages. Shipping lines, however, have to design their liner services and networks in order to optimize ship utilization and benefit the most from scale economies in vessel size. Their objective is to optimize their shipping networks by rationalizing coverage of ports, shipping routes and transit time. Shipping lines may direct flows along paths that are optimal for the system, with the lowest cost for the entire network being achieved by using transshipment nodes in the network.
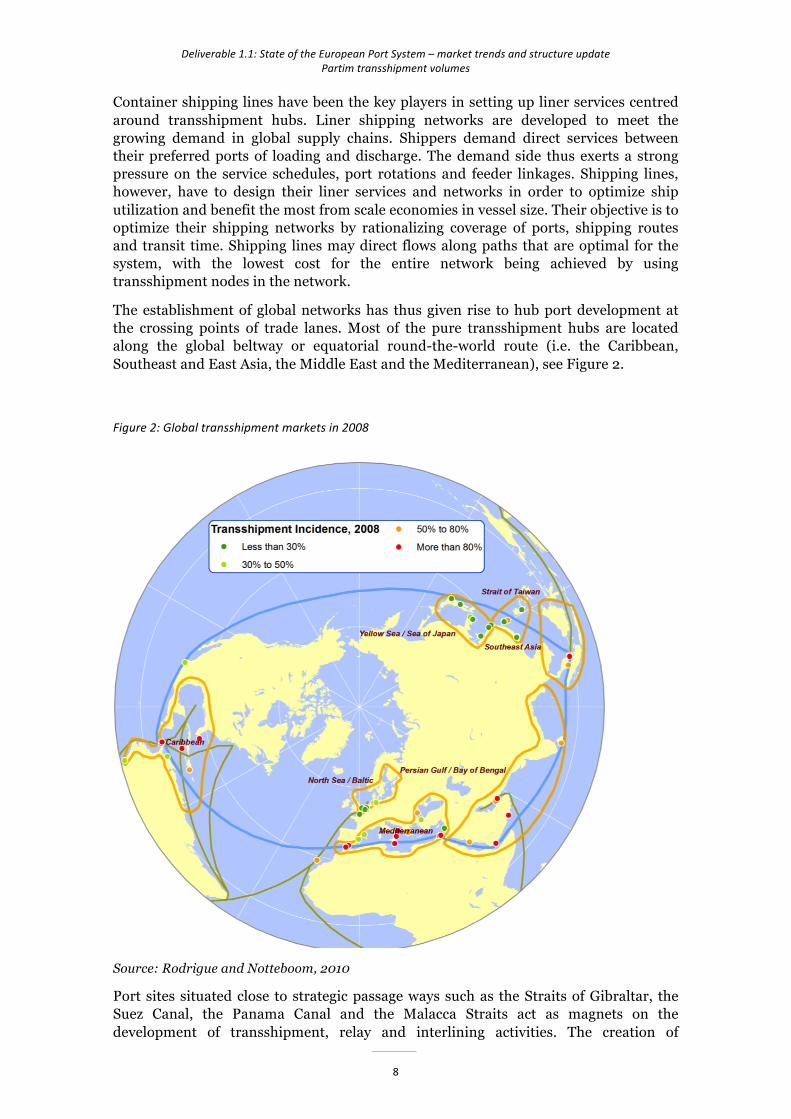
The establishment of global networks has thus given rise to hub port development at the crossing points of trade lanes. Most of the pure transshipment hubs are located along the global beltway or equatorial round-the-world route (i.e. the Caribbean, Southeast and East Asia, the Middle East and the Mediterranean), see Figure 2.
Figure 2: Global transshipment markets in 2008
Source: Rodrigue and Notteboom, 2010
Port sites situated close to strategic passage ways such as the Straits of Gibraltar, the Suez Canal, the Panama Canal and the Malacca Straits act as magnets on the development of transshipment, relay and interlining activities. The creation of
Deliverable 1.1: State of the European Port System – market trends and structure update Partim transshipment volumes
9
transshipment hubs does not occur in all port systems, but around specific regions ideally suited for maritime hub-and-spoke distribution patterns, thanks to geographical, nautical and market-related advantages.
Some markets seem to offer the right conditions for the emergence of more than one transshipment hub (like the Mediterranean), while other port systems do not feature any transshipment. For example, the port region near the Malacca Straits (Singapore, Port Klang, Tanjung Pelepas) primarily acts as a sea-sea transshipment platform (i.e. mainly hub function not gateway function), whereas for instance the seaport system in the Yangtze Delta (Shanghai, Ningbo, etc.) is a gateway region giving access to vast service areas in the Delta and along the Yangtze River and with a long transshipment incidence. In the US, many impediments in American shipping regulations gravitating around the Jones Act have favored a process of port system development with limited (feeder) services between American ports and the absence of US-based transshipment hubs (Freeport and other ports in the Caribbean to a limited extent take up this role), see Brooks (2009). The hubs have a range of common characteristics in terms of nautical accessibility, proximity to main shipping lanes and ownership, in whole or in part, by carriers or multinational terminal operators.
Most of these intermediate hubs are located along the global beltway or equatorial round-the-world route (i.e. the Caribbean, Southeast and East Asia, the Middle East and the Mediterranean). These nodes multiply shipping options and improve connectivity within the network through their pivotal role in regional hub-and-spoke networks and in cargo relay and interlining operations between the carriers’ east-west services and other inter- and intra-regional services. Figure 3 clearly shows the positioning of major hubs along East-West services in the major port regions across the globe.
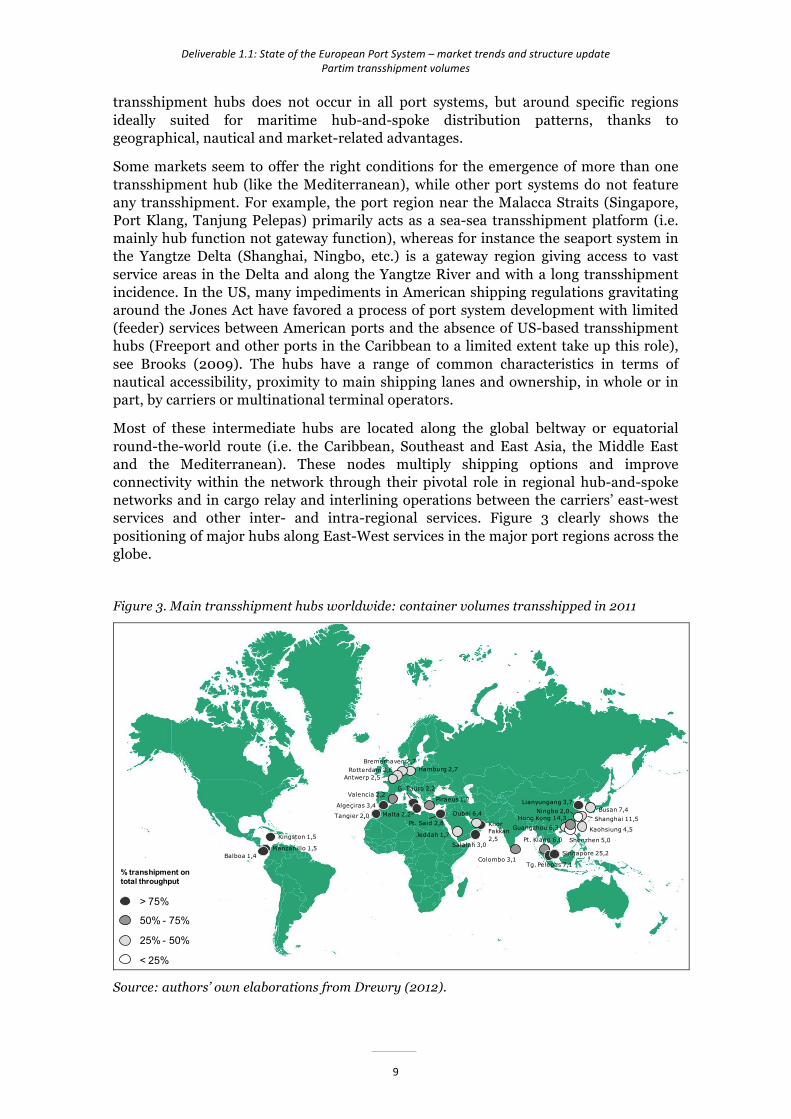
Figure 3. Main transshipment hubs worldwide: container volumes transshipped in 2011
Source: authors’ own elaborations from Drewry (2012).
> 75%
50% - 75%
25% - 50%
< 25%
Kingston 1,5
Malta 2,2
Manzanillo 1,5
Shanghai 11,5Hong Kong 14,3
Kaohsiung 4,5
Busan 7,4
Tg. Pelepas 7,1
Dubai 6,4
Salalah 3,0
Pt. Said 2,8
Rotterdam 3,6 Hamburg 2,7
G. Tauro 2,2
Algeçiras 3,4
Bremerhaven 2,7
Antwerp 2,5
Piraeus 1,2Valencia 2,2
Jeddah 1,7
Singapore 25,2
Pt. Klang 6,0
Colombo 3,1
KhorFakkan2,5
Guangzhou 6,3
Shenzhen 5,0
Lianyungang 3,7
Balboa 1,4
Ningbo 2,0Tangier 2,0
% transhipment on total throughput

Deliverable 1.1: State of the European Port System – market trends and structure update Partim transshipment volumes
10
The black dots refer to pure transshipment hubs (transshipment incidence above 75%), the dark grey refers to mixed ports, whereas the other symbols indicate gateway ports having a considerable portion of transshipment traffic. In this regard, in Asia clearly emerge the dominant position of some important gateway ports holding a strong transshipment share (in most cases below 50%), such as Hong Kong (SAR), mainland Chinese ports, besides Pusan (South Korea), Kaohsiung (Taiwan).
Analogously, in North Europe, “historical” load centers like Rotterdam, Antwerp, Bremerhaven and Hamburg hold a key role in transshipment operations for serving UK, Baltic, and Scandinavia. Finally, we find pure transshipment ports, which are strategically located along the trunk routes and therefore minimize the diversion distance: Kingston, Manzanillo and Balboa in Central America, Tangier, Algeciras, Gioia Tauro, Piraeus and Port Said in the Mediterranean, Salalah, and Khor Fakkan in Mid East, and Singapore, Tanjung Pelepas in South East Asia. Some of these pure transshipment hubs were realized as greenfield projects (e.g. Tanjung Pelepas, Salalah, for satisfying the growing demand of container handling in specific geographic areas).
To support the development of transshipment activities in liner service networks the top tier container shipping lines have shown a keen interest in developing dedicated terminal capacity. These dedicated facilities help to better control costs and operational performance and as a measure to remedy against poor vessel schedule integrity (see Notteboom, 2006 and Dullaert et al., 2007 for a discussion on schedule unreliability). Maersk Line’s parent company, AP Moller-Maersk, operates a large number of container terminals in Europe (and abroad) through its subsidiary APM Terminals. CMA-CGM (via its 51% share in Terminal Link), MSC (via its 65% stake in Terminal International Ltd), Evergreen, Cosco and Hanjin are among the shipping lines fully or partly controlling terminal capacity around the world. Global terminal operators such as Hutchison Port Holdings, PSA and DP World are increasingly hedging the risks by setting up dedicated terminal joint ventures in cooperation with shipping lines and strategic alliances. Terminal operators also seek long term contracts with shipping lines using gain sharing clauses. The above developments gave rise to a growing complexity in terminal ownership structures and partnership arrangements as demonstrated in Figure 4 for the Rhine-Scheldt Delta.
In academic literature it is often argued that the position of pure transshipment/interlining hubs is vulnerable and that the transshipment market is highly dynamics. First of all, the insertion of hubs often represents a temporary phase in connecting a region to global shipping networks. Hub-and-spoke networks would allow considerable economies of scale of equipment, but the cost efficiency of larger ships might be not sufficient to offset the extra feeder costs and container lift charges involved. Once traffic volumes for the gateway ports are sufficient, hubs are bypassed and become redundant (see also Wilmsmeier and Notteboom, 2010). Secondly, transshipment cargo can easily be moved to new hub terminals that emerge along the long distance shipping lanes. The combination of these factors makes that seaports which are able to combine a transshipment function with gateway cargo typically obtain a less vulnerable and thus more sustainable position in shipping networks than the pure transshipment hubs.

Deliverable 1.1: State of the European Port System – market trends and structure update Partim transshipment volumes
11
Figure 4. Terminal ownership in the Rhine-Scheldt Delta
Source: Notteboom (2013).
DATA COLLECTION ON TRANSSHIPMENT ACTIVITIES IN 4EUROPEAN PORTS
How can container transshipment data (T/S data) be collected in a meaningful way? During the PORTOPIA workshop with ESPO in Rome on 30 October 2013 it became clear that a number of ports collect transshipment data but long time series are hard to find and methodologies might differ. At a more aggregated level, transshipment data is available via estimates included in studies developed by consultancy firms (cf. Drewry, Dynamar, etc..). Transshipment data per port are rarely ever publicly available per transshipment market (cf. East Med, West Med, UK, Baltic, etc..) and, if figures are available, methodologies (e.g. aggregation of countries) might differ substantially. Also, transshipment data per shipping line are not public. Only liner service routing patterns (supply side) can offer some insight on the relative position of a specific shipping line in the transshipment business of a port.
Participants to the workshop in Rome further made the following observations:
• Sea-sea transshipment data are collected by terminal operators. Most port authorities depend on information from terminal operators to publish T/S data;
DP World
PSAHUTCHISON PORT HOLDINGS
APM Terminals(AP Moller Group)
ANTWERP
Antwerp Gateway
PSA (Antwerp/
Zeebrugge)
MSC Home terminal
CHZ
APM Terminals
ZEEBRUGGE
ROTTERDAM
Rotterdam World Gateway(Maasvlakte 2)
Operational by 2014
ECT
APM Terminal Maasvlakte CMA-CGM
Terminal Investment Ltd
(TIL)
NYK
Terminal 1(Maasvlakte 2)
Operational by 2014
Minority Shareholding
Waal- and Eemhaven
Delta Terminal
Euromax phase 1
Majorityshareholding
ZIM Line
DP World Delwaidedock
North Sea Terminal
Europe Terminal
Deurganck Terminal
New World Alliance
CYKH Green Alliance
Antwerp International Terminal (AIT) Shipping Line
(Global) Terminal Operator
Terminal
SIPG
Zeebrugge International Port (ZIP)
Cosco Pacific
100%
20%
50%
100%
100%
50%
50%
50%
60%
30%
10%
100%
100%
100%
50%50%
100%
42.5%10%
20%
100%
65%
51%
25%
PORT
Financial Holding
AMSTERDAM
ACT Smaller facilities (*)
(*) e.g. United Stevedores Amsterdam, Container Stevedoring Ijmuiden Evergreen
China shipping
Grand Alliance
G6 Alliance
Exploitatiemij. DDN
24%
Terminal Link
China MerchantsHoldings Internat.
51%
49%
35%
10%
Global Infrastructure Partners (GIP)
Minority Shareholding
35%
MSC
65%

Deliverable 1.1: State of the European Port System – market trends and structure update Partim transshipment volumes
12
• Some port authorities or port organizations publish T/S data on a regular interval. This is for instance the case for Puertos del Estado in Spain;
• The question was raised whether FEPORT could assist in collecting T/S data;
• In general it would be very difficult to get T/S data for hub-feeder and relay operations separately;
• Some workshop participants questioned the relevance of having T/S data: it might be more relevant to collect data on intra-European container flows as a percentage of the total container throughput of a port;
• It was stressed that next to total T/S data you also need to collect data on import, export flows and loaded/empties. The Rapid Exchange System would provide a good basis for the collection of such data;
• It will be very difficult to have a complete picture of the T/S market in the Med as many of the T/S ports are not in an EU member state (Tanger Med, Port Said, Damietta, Ambarli, etc.). This problem would not occur for North European T/S flows;
• Some participants underlined that it would also be useful to collect data on T/S in other cargo groups such as new cars and oil products;
• Data on T/S typically focus on ports that serve as transshipment point. This leads to double counting as each T/S container is counted twice. For many ports it would be interesting to know whether the import or export containers they handle are originating from a transshipment hub or, alternatively, are brought to the port via a direct call. Today these figures are difficult to gather;
• During the discussions it became clear that the e-manifest (linked to the use of Port Community Systems or PCS) could be a great source for getting more information on T/S data.
Based on the above observations, the research team decided to provide a comprehensive picture of the T/S market in the European port system by collecting data from various sources:
• Reports by consultancy firms (Drewry, Dynamar, etc.);
• Academic papers dealing with the T/S market and the role of intermediate locations;
• Data publicly available on websites or publications of port authorities or port organizations.
AN OVERVIEW OF THE T/S MARKET IN EUROPE AND IN 5EUROPEAN PORTS
In Europe, hubs with a transshipment incidence of 85% to 95% can only be found in the Med. Northern Europe does not count any pure transshipment hub. Gateway traffic always goes hand in hand with transshipment activity as the two are combined in each vessel call.
None of the players can look for transshipment in isolation, therefore. Hamburg, one of the North-European leader in terms of sea-sea flows, has a transshipment incidence of about 30% (figure 2012), far below the elevated transshipment shares in the main south European transshipment hubs. Barcelona and Valencia are among the large Med ports combining an important gateway function with significant transshipment flows.

Deliverable 1.1: State of the European Port System – market trends and structure update Partim transshipment volumes
13
According to MDS Transmodal (2006), sea-sea transshipment in UK ports represented only 7% of total lolo throughput in 2004. All Scottish ports together only handle about 300,000 TEU, a situation leading to significant container flows by truck and rail coming from gateway ports in the south and southeast of the United Kingdom.
5.1 The environmental and business transformations
The last few decades have been characterized by profound transformations in the container shipping business as well as in port governance settings and operations. In addition, the changes occurring in the economic environment and in world trade dynamics determined a repositioning of traffic flows and imposed a “re-tuning” of carriers’ strategies, in terms of geographic deployment of vessels, achievement of increasing economies of scale, and resort to inter-firm cooperative schemes.
In particular, the transshipment business in Europe has been subject to numerous factors, which progressively changed the geography of trade and provoked new operational and organizational challenges to shipping lines. In essence, the main transformations affecting the transshipment business in North and South Europe can be summarized as follows:
Dramatic traffic growth along the Europe-Far East trade lane; over the last 20 years the economic growth of Far East and the delocalization of production processes in those countries, triggered the growth of trade flows from China, South Korea, Japan, Taiwan, etc. to major European countries. Within the three main deep sea East-West shipping services the Europe-Far East progressively gained traffic raising its share from 18% in 1985 to 42% in 2011 (Figure 5). In 2012 the Europe-Far East and the Transpacific are definitely the two biggest trade lanes, accounting for 20 and 22 million TEUs of traffic (full containers) respectively. As a result of this growth, the Mediterranean basin and its ports recovered their own “centrality” within deep sea trade patterns, thanks to the transit of (almost) all mother vessels via the route Suez/Gibraltar. In this regard, since the late 1980s-early 1990s the development of transshipment operations (and the rise of new hubs like Gioia Tauro and Taranto) had the objective to capture a portion of the growing traffic flow coming from Asia and directed to North European markets.
Expansion of the European (hinterland) market; the progressive enlargement of the EU to other countries and in particular towards East favoured the entry of new markets within international trade lanes. The scarce infrastructural endowment in the ports of those emerging EU countries (e.g., Romania, Bulgaria, Poland, etc.) and in bordering countries (Russia, Ukraine, Turkey, etc.), and the relatively lower (international) trade volumes generated in the initial stages of development in such nations, required the massive introduction of transshipment operations by shipping lines in order to be able to serve the rising markets. Constantza in Romania, Ambarli in Turkey, Gdynia in Poland are just some examples of the greenfield ports acting as transshipment hubs for connecting via feedering a number of minor ports with major deep sea service.

Deliverable 1.1: State of the European Port System – market trends and structure update Partim transshipment volumes
14
Figure 5. The emergence of Europe-Far East long-haul shipping services: New “centrality” of the Mediterranean
Source: authors’ own elaboration from Containerisation International, Drewry (various years).
Emergence of North African ports; differently from gateway port operations (i.e. import/export), which strongly reply on hinterland transportation and the effectiveness of inland transport modes (road, rail and barge) and, ultimately, of the overall transport chain, transshipment volumes present a much higher degree of “contestability”. In other terms, a hub port can base its own competitiveness just on a few critical factors, e.g. the geographical position, the operational performance (fast and reliable) and pricing strategy. This is why transshipment volumes can be “delocalized” by shipping lines rather easily from one port to another, even 500/1,000 nautical miles away. More specifically, looking at the situation in the Mediterranean Sea, the pure transshipment hubs are those, which are much more exposed to the volatility of traffic (transshipment) flows, which in turn derives from the potentially easy delocalization of transshipment operations elsewhere. In this regard, since a few years, the hub ports of EU countries in the Mediterranean are experiencing the fierce competition of newcomers located in North Africa, which found their competitive advantage on the following factors: a) cost advantages (lower cost of space and very low wages); b) “legislative” advantages (simplified administrative procedures for FDIs, governmental incentives, etc.); c) geographical position advantages (lower diversion distance respect to the trunk route Suez/Gibraltar); d) physical advantages (deep-water terminals with large backyard spaces). Table 3 provides more details on the major new hub terminals arising in North Africa. Some of them are already fully operational (Tangier), while others are under construction or just in planning (Enfidha). The emergence of these African hubs, of course, is determining a restructuring of transshipment flows within the Mediterranean and it is feeding an “inter-generational” competition between the traditional hubs (born in the 1980s and 1990s) and the latecomers which recently entered into the market (Figure 6).
19%
34% 37% 37% 42%
41%
42%44%
47%45%
40%
24% 20% 15% 13%
0%
10%
20%
30%
40%
50%
60%
70%
80%
90%
100%
1985 1995 2000 2005 2011
Transatlantic Transpacific Europe-‐Far Est

Deliverable 1.1: State of the European Port System – market trends and structure update Partim transshipment volumes
15
Growing resort to economies of scale by carriers; as widely known major carriers, given the instability of freight rates and the scarce financial margins, undertook aggressive cost leadership strategies, in order to minimize the average cost per slot onboard. This choice led to the increase of the maximum vessel size on the mainhaul services: in 1996 the biggest container vessel had a capacity around 6,500 TEUs, in 2003 over 8,000 TEUs, in 2006 around 15,000, and since 2013 even 18,000. As economies of scale can be better exploited on the most crowded (in terms of traffic volumes) and longest (in terms of total distance) shipping trade lanes, i.e. East-West deep sea services. In particular, Europe-Far East services (as “end-to-end” services) are much longer of Transatlantic and Transpacific one and, therefore, Mediterranean and Northern European ports are called (at least potentially) by the biggest vessels in operation. This now offers strong opportunities in South and North European markets, as the deployment of bigger vessels increases the need of transshipment operations both in pure hub ports (in the Mediterranean) and large gateway ports (mostly in Northern Europe).
Table 3. The delocalization of transshipment in North Africa: the building of “competing” port capacity
Source: Ferrari et al. (2011).
Growing resort to consortia and strategic alliances by carriers; for smoothing the effects of a potentially dangerous and destructive competition, since the mid-1990s the major shipping line strengthened their involvement in consortia and strategic alliances. The resort to cooperative agreements represents a key building block within the overall strategic framework of carriers. Thanks to consortia and alliances, in fact, shipping lines aim at aggregating demand flows (and reduce investments in megavessels), with the ultimate objective of maximizing ship saturation and go to break even. The development of a multitude of consortia and the building of 2/3 big and rather “stable” strategic alliances (the P3 Alliance, composed by the three giants Maersk, MSC and CMA-CGM, is becoming operational right now) produced a strong concentration of the
Ports Terminal Projects Shareholders Opening year Capacity (‘000)
Tangier
APM Terminals (T1)
APTM (90%), Akwa (10%)Sept 2007 1300
APM Terminals (T3) >2012 3000
Eurogate Tanger (T2) Eurogate (50%), CMA-‐CGM (30%), MSC (20%) Oct 2008 1300
PSA Terminal (T4) PSA (50%), Marsa Maroc, SNI >2012 2000
Algiers DP World Djazair DPW (100%) 2009 700
DjenDjen DP World Djazair DPW (100%) 2009 1500
Port Said
Suez Canal Container Terminal APTM (55%), Cosco Pacific (45%) Oct2004 3000
SCCT – Phase 2 >2012 3000
Port Said Container Terminal Port Said Container and Cargo Handling Company (100%) 1988 900
Enfidha Container Terminal
Phase 1 (HPH) 2011-‐2015 2500-‐4000
Phase 2 2016-‐2021 1100
Phase 3 2022-‐2030 2000
El Sokhna El Sokhna Container Terminal DPW (90%), Amiral Holdings (10%) Feb 2008 900
Alexandria(El Dhekila) Alexandria International Container Terminal HPH (50%), Alexandria PA (50%) 2007 500
DamiettaDamietta Container Terminal Damietta Container & Cargo Handling Co (100%) 1986 1500
Phase 2 China Shipping (20%), CMA-‐CGM (20%), others >2013 2500

Deliverable 1.1: State of the European Port System – market trends and structure update Partim transshipment volumes
16
demand of container handling in a handful of players. These big players, indeed, massively resorted to transshipment operations (for filling in their big vessels) in the Mediterranean and in North Europe (as well as in Asia and Central America) and frequently (co-)invested in (hub) terminals for better controlling the ports phase. In Europe, as we will see later, we find many examples of carriers which vertically integrate their activities in ports, by taking stakes in some port facilities.
Table 4 provides an overview of the changes in liner services on the Europe-Far East trade for ports in the Hamburg-Le Havre range and the UK. Overall one can conclude that the P3 alliance has not opted to put all ‘eggs in one basket’: the portfolio of ports includes three ports in the Benelux, three in northern Germany, two in northern France and two ports in the UK. The last column shows the direct involvement or indirect involvement (via a sister company, e.g. APM Terminals vs. Maersk Line) of the P3 alliance partners in terminals. Most ports will face a decline in the number of weekly calls, but the number of services with ships of over 13,000 TEU capacity will increase. It has to be underlined that the services of the P3 alliance are not static: they are expected to be subject to changes every now and then.
Table 4. Impact of P3 alliance on calling patterns in parts of North Europe and link to direct terminal involvement of alliance partners
Source: Notteboom (2014) based on shipping line data.
Economic and trade crisis; as commonly acknowledged the year 2009 was the first “crisis” year within the overall history of the containerization. In 2009 the world throughput collapsed by almost 9%. The weakening of traffic volumes from Far East to Europe (even 20% less) provoked a restructuring of shipping services by carriers in the Mediterranean and in North Europe. As a result, in some cases, direct services (for instance from China to Black Sea) were replaced by indirect services via transshipment hub, thus determining an increase of transshipment activity in some ports. At the same time, however, ocean carriers, because of the strong pressure on their cost structure (which lower profit margins), started to be much more “severe” in the selection of their transshipment hubs. This strategic turn drove some ports to lose important traffic shares (e.g. Gioia Tauro, etc.), suggesting the risk of a progressive marginalization in the long term, also because of the emerging competition from Africa (see Point 3).
million TEU 2013
Transhipment incidence (%) Q3 2014 P3 alliance
Number of alliance partners with terminal ownership or shareholding in port
Antwerp 8.58 29.0% 3 (2) 4 (3) Two (MSC and CMA CGM)Rotterdam 11.62 35.9% 8 (4) 4 (4) All threeZeebrugge 2.03 25.1% 4 (2) 2 (0) Two (Maersk and CMA CGM)Hamburg 9.26 30.0% 4 (1) 3 (2) NoneBremerhaven 5.83 44.8% 7 (2) 6 (5) Two (Maersk and MSC)Wilhelmshaven 0.076 -‐ 1 (0) 2 (2) NoneLe Havre 2.49 16.9% 5 (2) 5 (3) All threeDunkirk 0.292 -‐ 1 (1) 1 (0) -‐Felixstowe (*) 3.43 9.1% 6 (2) 5 (4) NoneSouthampton (*) 1.56 6.0% 2 (1) 2 (0) None(*) = TEU figure for 2012
Total Number of Europe-‐FE services +(services with ships > 13000 TEU)

Deliverable 1.1: State of the European Port System – market trends and structure update Partim transshipment volumes
17
Figure 6. The generations of hubs in the Mediterranean basin
Source: Parola (2013).
5.2 The evolution of transshipment operations in North and South Europe
The transshipment incidence for a sample of European container ports for the years 2004, 2008 and 2012 is depicted in Table 5. In the present report we collected data on the major container ports in each EU country, limiting our analysis to those ports showing a substantial and regular transshipment activity over time. As a result, we excluded from the study the ports, which, despite the relevant throughput figures, presented negligible transshipment volumes. Overall, we gathered information (i.e. diversion distance, transshipment incidence, total throughput, transshipment volumes) regarding the main sample of European ports (see Table 5). In a second stage, for performing deeper and more specific analyses, we defined a smaller sample (27 ports), taking into account only the container ports showing a transshipment share above 5% for at least one of the three considered years.
Figures 7 to 9 provide a graphical presentation of the relation between transshipment incidence and the one-way ship diversion distance from the main shipping route to the ports of call in 2004, 2008 and 2012 respectively. First, the analysis of this sub-sample of ports (27) allowed to define a taxonomy based on the distinctions emerging combining the diversion distance of each port with the transshipment incidence. Basically, we defined three types of ports:
(1) the “gateway ports” , which regardless the amount of total throughput values, present a very low transshipment incidence and therefore based almost all their competitiveness on import/export cargo and the commercial relations with the hinterland;
(2) the “mixed ports”, which often unveil rather high throughput volumes (in this category, in fact, we also include the big load centres located in Northern
Cagliari
Malta
Gioia Tauro
Taranto
Ambarli
Piraeus
1st generation (pre-1990)
2nd generation (1990-early 2000s)
Bejaia
Enfidha
Constantza
Damietta
3rd generation (early 2000s-late 2000s)
4th generation (late 2000s onwards)
El Dekheila(Alexandria)
Port Said
Algiers
Djen Djen
El Sokhna
Algeciras
Tangier
Valencia

Deliverable 1.1: State of the European Port System – market trends and structure update Partim transshipment volumes
18
Europe) and present a valuable, although not dominant, incidence of transshipment activities on the total;
(3) the “pure transshipment hubs”, which found almost all their success on sea-to-sea handling operations. Besides, this latter category includes offshore facilities recently constructed in remote and low-cost areas, faraway from populated cities, as for the pure hubs of course there is no need to be connected with a commercial backyard (hinterland).
More specifically, looking at Figures 7 to 9, North Italian ports and UK ports, are predominantly involved in gateway functions. For these ports became therefore critical to achieve a high level of synchronization with the respective hinterland, which may be reached improving and fostering the capacity of inland infrastructure and corridors.
The load centres in the Hamburg-Le Havre range, Barcelona and Valencia act as mixed ports. For this nodes traditional gateway functions did not exclude the development of transshipment activities, which provide further business opportunities for increasing total throughput volumes and provide bundled services (combining gateway handling with transshipment) to main customers. Also in this case, of course, a critical success factor is represented by the availability of reliable and high capacity inland connections, preferably via rail or barge.

Deliverable 1.1: State of the European Port System – market trends and structure update Partim transshipment volumes
19
Table 5. Transshipment incidence in European container ports (based on throughput in TEU )
Notes: T/S = transshipment, T/S % = transshipment incidence (share of transshipment in total TEU throughput), diversion distance = one-way distance between main shipping route and port of call
Figures highlighted in red are not confirmed estimates, figures highlighted in yellow are based on secondary sources but not confirmed by the respective ports.
Source: authors’ own compilation based on port authority websites, press releases and various specialized reports from Drewry, ITMMA, ISL and Dynamar.
Pure hubs emerge in those places where the hub and spoke and interlining/relay solution ensure competitive advantages respect to direct port calls at mainland ports. In particular, they are located along the trunk route between Suez and Gibraltar, minimizing the diversion distance. Examples of pure hubs in the Mediterranean are Marsaxlokk, Algeciras and Piraeus (started before 1990), Gioia Tauro, Cagliari and Taranto (started in the mid/late 1990s).
Port name Port rangeDiversion
distance (nm)Total TEU 2004
T/S TEU 2004 T/S %
Total TEU 2008
T/S TEU 2008 T/S %
Total TEU 2012
T/S TEU 2012 T/S %
Antwerp Hamburg-‐Le Havre Range 135 6063747 1393509 23.0% 8662891 2887881 33.3% 8635169 2504000 29.0%Zeebrugge Hamburg-‐Le Havre Range 65 1196755 293205 24.5% 2209713 575000 26.0% 1953170 490000 25.1%Rotterdam Hamburg-‐Le Havre Range 67 8281000 3296400 39.8% 10783825 2588000 24.0% 11865916 4265000 35.9%Amsterdam Hamburg-‐Le Havre Range 73 51924 436074 68933Hamburg Hamburg-‐Le Havre Range 85 7003479 2299085 32.8% 9737110 3298000 33.9% 8863896 2659000 30.0%Bremerhaven Hamburg-‐Le Havre Range 10 3469104 1056394 30.5% 5448189 2765000 50.8% 6115211 2750000 45.0%Wilhelmshaven Hamburg-‐Le Havre Range 10 43032 0 23888Le Havre Hamburg-‐Le Havre Range 95 2131833 645000 30.3% 2488654 750000 30.1% 2303750 390000 16.9%Dunkirk Hamburg-‐Le Havre Range 38 200399 214485 260283Rouen Hamburg-‐Le Havre Range 215 139200 142035 127528St-‐Nazaire Atlantic range 330 138854 149281 184838Leixos Atlantic range 65 349495 450026 632673Lisbon Atlantic range 66 514769 556062 485761Sines Atlantic range 66 19211 0 0.0% 233118 115000 49.3% 553063 359491 65.0%Bilbao Mediterranean 485 468953 6800 1.5% 557355 13853 2.5% 610131 1134 0.2%Malaga Mediterranean 60 245000 225000 91.8% 428623 409759 95.6% 336265 300443 89.3%Vigo Atlantic range 100 197269 3700 1.9% 247873 3371 1.4% 198517 8390 4.2%Sevilla Mediterranean 167 111092 36 0.0% 130452 0 0.0% 156193 0 0.0%Bahia de Cadiz Mediterranean 70 114549 16700 14.6% 126408 1093 0.9% 96215 916 1.0%Algeciras Mediterranean 18 2937381 2487609 84.7% 3324364 3164696 95.2% 4070791 3707953 91.1%Tarragona Mediterranean 490 17214 1450 8.4% 47415 875 1.8% 188851 102083 54.1%Barcelona Mediterranean 555 1910723 571306 29.9% 2569572 997588 38.8% 1749974 435817 24.9%Valencia Mediterranean 320 2137137 393921 18.4% 3597215 1578482 43.9% 4469754 2280701 51.0%Marsaxlokk Mediterranean 75 1461174 1382819 94.6% 2337000 2174000 93.0% 2540000 2425000 95.5%Marseil le Mediterranean 650 916277 87000 9.5% 851425 0 0.0% 1062408 0.0%Genoa Mediterranean 767 1628594 127030 7.8% 1766605 169560 9.6% 2064806 181128 8.8%Leghorn Mediterranean 680 638586 36500 5.7% 778864 41000 5.3% 549047 26506 4.8%Naples Mediterranean 463 347500 0 0.0% 481521 0 0.0% 546818 0 0.0%Ravenna Mediterranean 1190 169432 0 0.0% 212324 0 0.0% 208162 0 0.0%Savona Mediterranean 745 83891 0 0.0% 252837 0 0.0% 75282 0 0.0%Trieste Mediterranean 1270 174729 0 0.0% 335943 0 0.0% 408023 0 0.0%Venice Mediterranean 1250 290898 0 0.0% 379072 0 0.0% 429893 0 0.0%Koper Mediterranean 1270 153347 0 0.0% 353880 0 0.0% 572263 0 0.0%La Spezia Mediterranean 730 1040438 72831 7.0% 1246139 85000 6.8% 1247218 91111 7.3%Gioia Tauro Mediterranean 473 3261034 2724580 83.5% 3467772 3221000 92.9% 2721000 2548000 93.6%Taranto Mediterranean 477 763318 613708 80.4% 786655 677000 86.1% 263461 196398 74.5%Cagliari Mediterranean 176 494766 450900 91.1% 307527 217000 70.6% 621536 568705 91.5%Piraeus Mediterranean 445 1541563 790822 51.3% 433582 35554 8.2% 2734004 2187000 80.0%Thessaloniki Mediterranean 910 336069 238940 317751Felixstowe UK/Ireland 45 2717000 561031 20.6% 3132000 269000 8.6% 3700000 305000 8.2%Southampton UK/Ireland 47 1441012 86461 6.0% 1617000 100000 6.2% 1600000 88000 5.5%Tilbury UK/Ireland 67 656783 962000 650000Thamesport UK/Ireland 62 632000 34760 5.5% 773000 50000 6.5% 350000 28500 8.1%Hull UK/Ireland 290 310000 262000 230000Teesport UK/Ireland 495 133000 155000 260000Liverpool UK/Ireland 640 603000 37386 6.2% 672000 50000 7.4% 650000 52000 8.0%Aarhus Scandinavia/Baltic 776 400000 458000 404287Gdynia Scandinavia/Baltic 1340 377236 610767 676349Gdansk Scandinavia/Baltic 1340 43739 2186.95 5.0% 163704 50748 31.0% 928905 560000 60.3%Szczecin Scandinavia/Baltic 27680 62913 60000Riga Scandinavia/Baltic 1685 150000 207122 362297Tallin Scandinavia/Baltic 1860 111599 180927 227809St-‐Petersburg Scandinavia/Baltic 2175 776576 1983110 2524680Helsinki Scandinavia/Baltic 1900 500000 419809 404895Kotka (incl. Hamina) Scandinavia/Baltic 1990 325730 627765 631042Gothenburg Scandinavia/Baltic 660 713439 863881 899628Oslo Scandinavia/Baltic 772 177019 190307 202791Constantza Black Sea 1452 386368 154547 40.0% 1380935 1036000 75.0% 684059 170000 24.9%Las Palmas Atlantic range 850 1215277 650000 53.5% 1311745 835094 63.7% 1207962 790232 65.4%
Deliverable 1.1: State of the European Port System – market trends and structure update Partim transshipment volumes
20
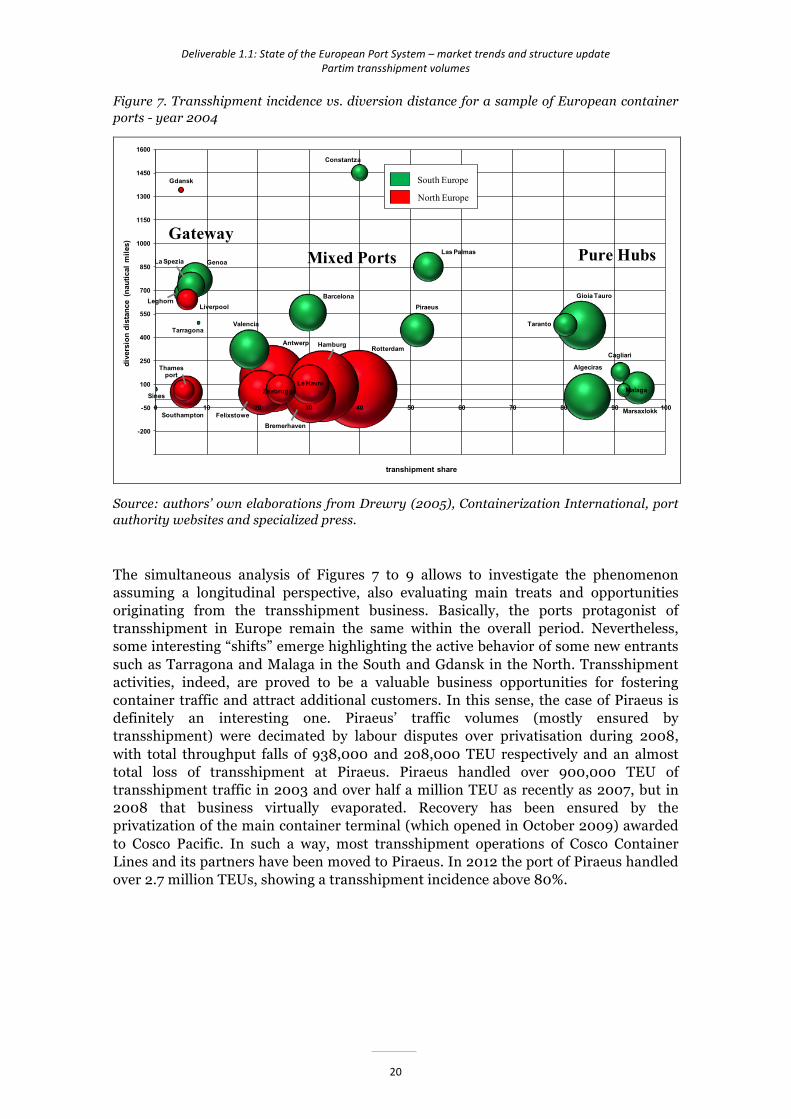
Figure 7. Transshipment incidence vs. diversion distance for a sample of European container ports - year 2004
Source: authors’ own elaborations from Drewry (2005), Containerization International, port authority websites and specialized press.
The simultaneous analysis of Figures 7 to 9 allows to investigate the phenomenon assuming a longitudinal perspective, also evaluating main treats and opportunities originating from the transshipment business. Basically, the ports protagonist of transshipment in Europe remain the same within the overall period. Nevertheless, some interesting “shifts” emerge highlighting the active behavior of some new entrants such as Tarragona and Malaga in the South and Gdansk in the North. Transshipment activities, indeed, are proved to be a valuable business opportunities for fostering container traffic and attract additional customers. In this sense, the case of Piraeus is definitely an interesting one. Piraeus’ traffic volumes (mostly ensured by transshipment) were decimated by labour disputes over privatisation during 2008, with total throughput falls of 938,000 and 208,000 TEU respectively and an almost total loss of transshipment at Piraeus. Piraeus handled over 900,000 TEU of transshipment traffic in 2003 and over half a million TEU as recently as 2007, but in 2008 that business virtually evaporated. Recovery has been ensured by the privatization of the main container terminal (which opened in October 2009) awarded to Cosco Pacific. In such a way, most transshipment operations of Cosco Container Lines and its partners have been moved to Piraeus. In 2012 the port of Piraeus handled over 2.7 million TEUs, showing a transshipment incidence above 80%.
-350
-200
-50
100
250
400
550
700
850
1000
1150
1300
1450
1600
0 10 20 30 40 50 60 70 80 90 100
dive
rsio
n di
stan
ce (
naut
ical
mile
s)
transhipment share
Constantza
La Spezia Genoa
Barcelona
Valencia
LiverpoolLeghorn
Southampton
Rotterdam
Felixstowe
Thamesport
Pure HubsGateway
Las Palmas
South Europe
North Europe
Antwerp Hamburg
Le Havre
Mixed Ports
Bremerhaven
Sines
Taranto
Gioia Tauro
Marsaxlokk
Zeebrugge
Algeciras
Malaga
Cagliari
Tarragona
Gdansk
Piraeus

Deliverable 1.1: State of the European Port System – market trends and structure update Partim transshipment volumes
21
Figure 8. Transshipment incidence vs. diversion distance for a sample of European container ports - year 2008
Source: authors’ own elaborations from Drewry (2009), Containerization International, port authority websites and specialized press.
Main data provided in this study, indeed, demonstrate how ports relying on a dominant transshipment share seem to be affected by a higher volatility, which originates from “up and down” trends of container growth/decline (2009 trade crisis) as well as the emergence of new entrants to the transshipment market, especially in North Africa (Rodrigue and Notteboom, 2010). See also Section 5.1, Points 3 and 6.
In fact, as the container port system may be triggered to support direct and end-to-end or line bundling service that bypass transshipment hubs the insertion of specific hubs into the overall network may just constitute a provisional stage. In other terms, in specific environmental contexts a hub can even become a redundant node in the network. In addition, transshipment hubs are exposed to changes in traffic volumes, originating from new entrants in the market that inevitably lead to transformations in the distribution of transshipment volumes among an increasing number of players and nodes. Under this perspective, some Italian ports such as Gioia Tauro and Taranto and other ports like Constantza experienced some commercial troubles with major customers and this has been translated into traffic loss, also accelerated by to the new competing hubs from North Africa.
Overall, the main conclusion is that the market is very different in North and South Europe: in the North in fact, transshipment is organized in a different way respect to Mediterranean Sea. In Northern Europe, in particular, no real transshipment hubs exist in the Hamburg-Le Havre range. The main ports of the area, in fact, although they handle very significant transshipment volumes (in TEU terms), they primarily act as load centres. They unveil a lower transshipment incidence respect to the high transshipment share characterizing main South European hubs (Rodrigue and Notteboom, 2010).
-350
-200
-50
100
250
400
550
700
850
1000
1150
1300
1450
1600
0 10 20 30 40 50 60 70 80 90 100
dive
rsio
n di
stan
ce (
naut
ical
mile
s)
transhipment share
Constantza
La SpeziaGenoa
Barcelona
Valencia
LiverpoolLeghorn
Southampton
RotterdamFelixstoweThamesport
Pure HubsGateway
Las Palmas
South Europe
North Europe
Antwerp
HamburgLe Havre
Mixed Ports
Bremerhaven
Sines
TarantoGioia Tauro
MarsaxlokkZeebrugge
Algeciras
Malaga
Piraeus
Gdansk
Tarragona
Cagliari
Deliverable 1.1: State of the European Port System – market trends and structure update Partim transshipment volumes
22
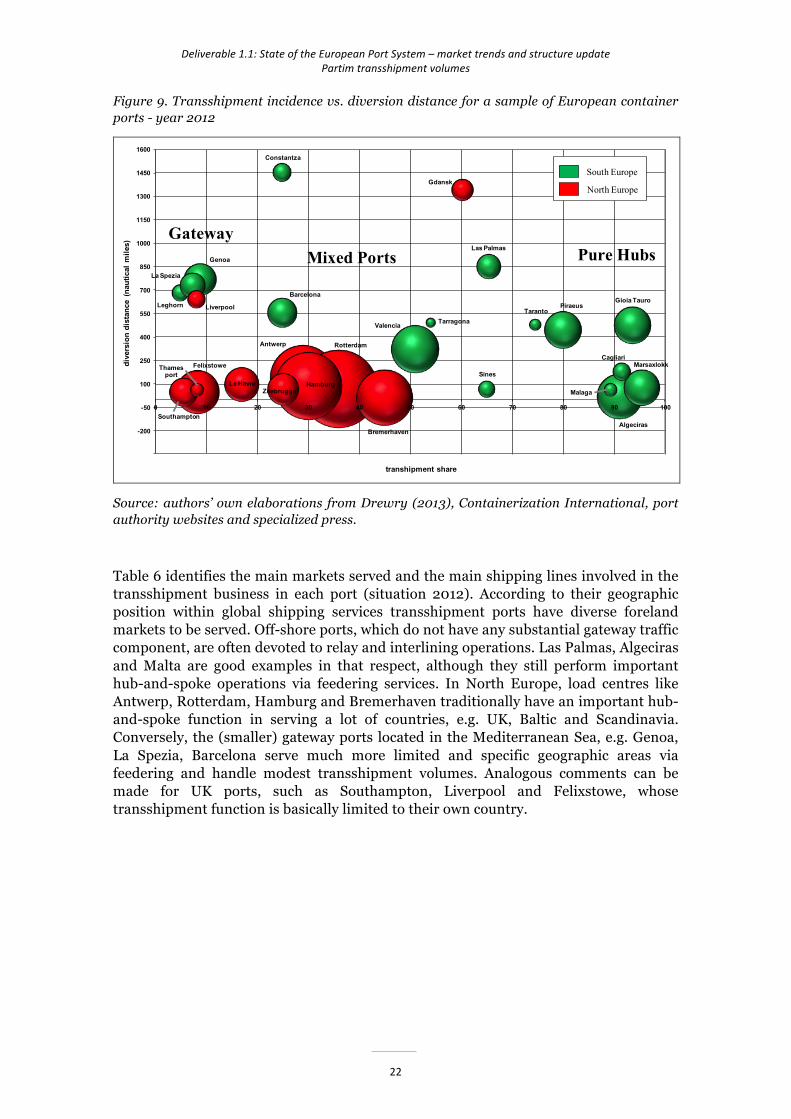
Figure 9. Transshipment incidence vs. diversion distance for a sample of European container ports - year 2012
Source: authors’ own elaborations from Drewry (2013), Containerization International, port authority websites and specialized press.
Table 6 identifies the main markets served and the main shipping lines involved in the transshipment business in each port (situation 2012). According to their geographic position within global shipping services transshipment ports have diverse foreland markets to be served. Off-shore ports, which do not have any substantial gateway traffic component, are often devoted to relay and interlining operations. Las Palmas, Algeciras and Malta are good examples in that respect, although they still perform important hub-and-spoke operations via feedering services. In North Europe, load centres like Antwerp, Rotterdam, Hamburg and Bremerhaven traditionally have an important hub-and-spoke function in serving a lot of countries, e.g. UK, Baltic and Scandinavia. Conversely, the (smaller) gateway ports located in the Mediterranean Sea, e.g. Genoa, La Spezia, Barcelona serve much more limited and specific geographic areas via feedering and handle modest transshipment volumes. Analogous comments can be made for UK ports, such as Southampton, Liverpool and Felixstowe, whose transshipment function is basically limited to their own country.
-350
-200
-50
100
250
400
550
700
850
1000
1150
1300
1450
1600
0 10 20 30 40 50 60 70 80 90 100
dive
rsio
n di
stan
ce (
naut
ical
mile
s)
transhipment share
Constantza
La Spezia
Genoa
Barcelona
Valencia
LiverpoolLeghorn
Southampton
Rotterdam
FelixstoweThamesport
Pure HubsGateway
Las Palmas
South Europe
North Europe
Antwerp
HamburgLe Havre
Mixed Ports
Bremerhaven
Sines
TarantoGioia Tauro
Marsaxlokk
Zeebrugge
Algeciras
Malaga
Piraeus
Cagliari
Gdansk
Tarragona

Deliverable 1.1: State of the European Port System – market trends and structure update Partim transshipment volumes
23
Table 6. Main markets served and shipping lines involved in the transshipment business in the major ports.
Note: #N/A = no data available or no specific main player in the port’s T/S business
Source: authors’ elaboration from Drewry (2013), corporate and port authority websites, and specialized press.
The analysis of the main shipping lines calling transshipment ports reveals a certain degree of “specialization” and “fidelization”. In other terms, carriers seems to carefully select their “pivot” points along main shipping services and calibrate their effort (e.g. number of calls per week, average vessel size, etc.) in the reason of the relative importance of each specific hinterland market to be served. Maersk Line, for instance, is based in Algeciras, Rotterdam, Bremerhaven, Le Havre and Zeebrugge and therefore show a highly diversified approach. MSC operates, among others, in Antwerp (which “de facto” is the operational main headquarters of MSC worldwide) and Bremerhaven in North Europe, and in Valencia, Leghorn, La Spezia in the Mediterranean. Evergreen operates in Taranto, Cosco in Piraeus, while CMA-CGM in Malta, Marseille, Le Havre and Antwerp.
Table 7 includes data on carriers’ investments in hub terminals, showing the entry patterns in each port (year of entry) and the equity throughput currently (2011) handled by each shareholder (i.e. a carrier) in its own terminals.
Port Range
Transshipment incidence on
overall container traffics
Main markets served Main players involved in transshipment operations
Las Palmas Atlantic range 65.4% Relay and interlining MSCSines Atlantic range 65.0% Relay and interlining MSCConstantza Black Sea 24.9% Black Sea #N/A
Antwerp Hamburg-‐Le Havre Range 29.0% UK and Baltic / ScandinaviaMSC, CMA-‐CGM, Cosco Lines, Hanjin, K-‐Line, Yang Ming Line, Zim
Bremerhaven Hamburg-‐Le Havre Range 45.0% Baltic / Scandinavia Maersk, MSCHamburg Hamburg-‐Le Havre Range 30.0% Baltic / Scandinavia Hapag-‐LloydLe Havre Hamburg-‐Le Havre Range 16.9% UK Maersk, CMA-‐CGM
Rotterdam Hamburg-‐Le Havre Range 35.9% UK and Baltic / ScandinaviaMaersk, Cosco Lines, Hanjin, K-‐Line, MSC, Yang Ming Line
Zeebrugge Hamburg-‐Le Havre Range 25.1% UK Maersk, CMA-‐CGMAlgeciras Mediterranean 91.1% Relay and interlining Maersk, HanjinBarcelona Mediterranean 24.9% West Mediterranean #N/ACagliari Mediterranean 91.5% Central and East Mediterranean #N/AGenoa Mediterranean 8.8% Central Mediterranean #N/AGioia Tauro Mediterranean 93.6% Central and East Mediterranean MaerskLa Spezia Mediterranean 7.3% Central Mediterranean MSCLeghorn Mediterranean 4.8% Central Mediterranean MSCMalaga Mediterranean 89.3% Relay and interlining #N/AMarsaxlokk Mediterranean 95.5% West Mediterranean, interlining CMA-‐CGMPiraeus Mediterranean 80.0% East Mediterranean Cosco GroupTaranto Mediterranean 74.5% Central and East Mediterranean EvergreenTarragona Mediterranean 54.1% Relay and interlining ZIMValencia Mediterranean 51.0% West Mediterranean MSCGdansk Scandinavia/Baltic 60.3% Baltic / Scandinavia Maersk LineFelixstowe UK/Ireland 8.2% UK #N/ALiverpool UK/Ireland 8.0% UK #N/ASouthampton UK/Ireland 5.5% UK #N/AThamesport UK/Ireland 8.1% UK #N/A

Deliverable 1.1: State of the European Port System – market trends and structure update Partim transshipment volumes
24
Table 7. Carriers’ investments in hub terminals in Europe.
Source: authors’ elaboration from Drewry (2012), corporate and port authority websites, and specialized press.
The outcomes unveil a massive presence of Maersk Line, through the sister company APM Terminals (commonly considered a hybrid operator, because it looks for third-party traffic as well), MSC, CMA-CGM and Cosco (either through Cosco Lines or Cosco Pacific). In the Mediterranean Sea carriers mostly invest in terminals for controlling pure transshipment hubs, often via wholly owned subsidiaries (WOS) or partially owned subsidiaries: CMA-CGM in Malta (100% share), Cosco in Piraeus (100% share), Evergreen in Taranto (initially 66% share, later increased up to 90%, and finally progressively reduced to around 40% share), APM Terminals in Algeciras (100% share).
In North Europe, as already mentioned, carriers mostly utilize big gateway ports for transshipment operations as well. In this regard, mega terminals requiring enormous investments are often involved in such kind of “mixed” activities. Indeed, in North Europe the need for handling capacity is much bigger and the space available is scarce, as it is difficult to get offshore areas. As a result, carriers given the above constraints are forced to share the terminal capacity, by co-investing in the same facility. The “consortium” formula (composed by one top pure stevedore plus a handful of carriers) is becoming very common in North Europe for managing big port infrastructures: the Deurgangdock terminals and the new facilities at the Maasvlakte II are clearly an example of the joint commitment of shipping lines in terminal equity and management.
Ports CountryTotal
throughput (2012)
Transshipment incidence (2012)
Entry patterns (carriers investment year)
Current investors (carriers) and equity throughput in '000 TEU (2011)
Algeciras Spain 4,070,791 91.1%Sealand (1975), Maersk (1986) and Hanjin (2010)
APM Terminals (3.096); Hanjin (612)
Antwerp Belgium 8,635,169 29.0%
MSC (2004), APM Terminals (2005), CMA-‐CGM (2005), Cosco Group (2005), Hanjin (2006), K-‐Line (2006), P&O Nedlloyd (2005), Yang Ming Line (2006), Zim Ports (2008)
MSC (2.302), CMA-‐CGM (95), Cosco Group (238), Hanjin (66), K-‐Line (66), Yang Ming Line (66), Zim Ports (238)
Bremerhaven Germany 6,115,211 45.0% Maersk (1999), MSC (2005) APM Terminals (1.717), MSC (850)Gioia Tauro Italy 2,721,000 93.6% APM Terminals (2002) APM Terminals (754)Hamburg Germany 8,863,896 30.0% Hapag-‐Lloyd (2001) Hapag-‐Lloyd (693)La Spezia Italy 1,247,218 7.3% MSC (2000) MSC (428)Las Palmas Spain 1,207,962 65.4% MSC (2000) MSC (278)
Le Havre France 2,303,750 16.9%MSC (2001), CMA-‐CGM (2003), APM Terminals (2007)
APM Terminals (135), CMA-‐CGM (529)
Leghorn Italy 549,047 4.8% MSC (2001) MSC (84)Marsaxlokk Malta 2,540,000 95.5% CMA-‐CGM (2004) CMA-‐CGM (984)Piraeus Greece 2,734,004 80.0% Cosco Group (2009) Cosco Group (1.188)
Rotterdam Netherlands 11,865,916 35.9%
Sealand (1993), Maersk (1999), Cosco Container Lines (2008), Hanjin (2008), YML (2008), K-‐Line (2008), NYK (2009), MSC (2011)
APM Terminals (2.371), Cosco Container Lines (234), Hanjin (234), K-‐Line (234), MSC (400), Yang Ming Line (234)
Sines Portugal 553,063 65.0% MSC (2011) MSC (222)Taranto Italy 263,461 74.5% Evergreen (2001) Evergreen (245)Tarragona Spain 188,851 54.1% ZIM Ports (2008) ZIM Ports (96)Valencia Spain 4,469,754 51.0% MSC (2006) MSC (1.558)
Zeebrugge Belgium 1,953,170 25.1% CMA-‐CGM (2005), APM Terminals (2006) APM Terminals (432), CMA-‐CGM (188)
Deliverable 1.1: State of the European Port System – market trends and structure update Partim transshipment volumes
25
DISCUSSION AND EXPECTATIONS FOR THE FUTURE 6
6.1 Overall transshipment incidence in Europe and European port ranges
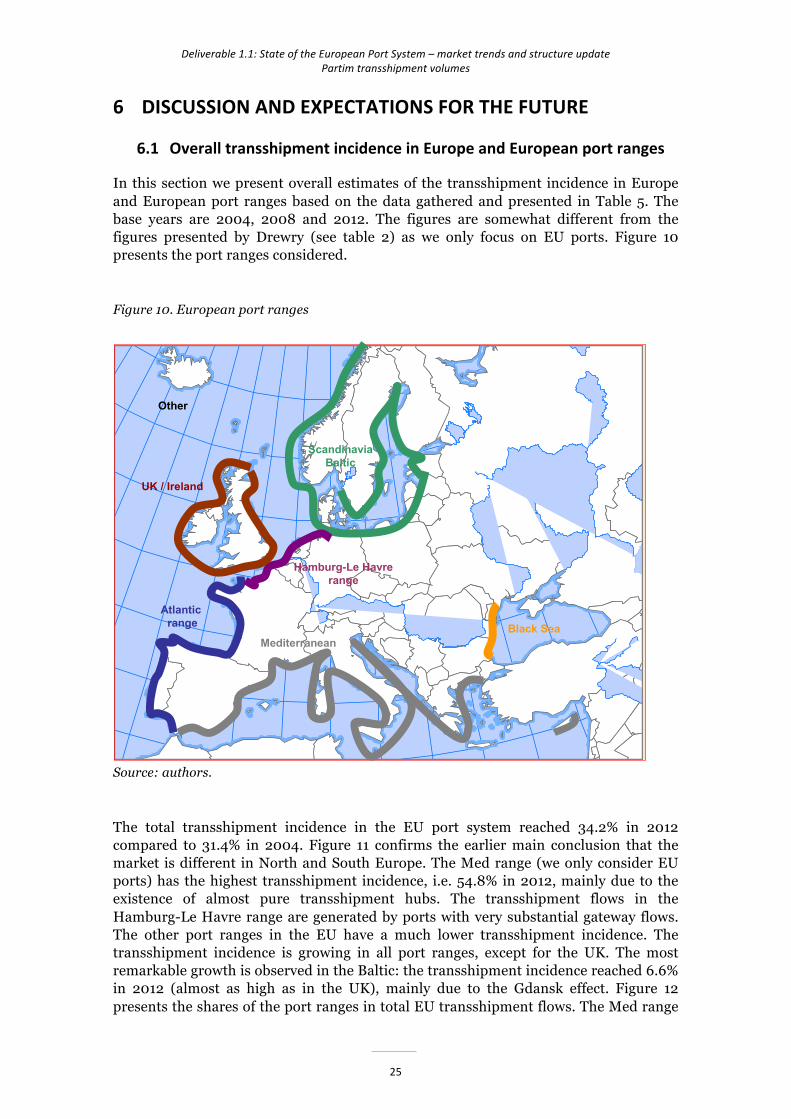
In this section we present overall estimates of the transshipment incidence in Europe and European port ranges based on the data gathered and presented in Table 5. The base years are 2004, 2008 and 2012. The figures are somewhat different from the figures presented by Drewry (see table 2) as we only focus on EU ports. Figure 10 presents the port ranges considered.
Figure 10. European port ranges
Source: authors.
The total transshipment incidence in the EU port system reached 34.2% in 2012 compared to 31.4% in 2004. Figure 11 confirms the earlier main conclusion that the market is different in North and South Europe. The Med range (we only consider EU ports) has the highest transshipment incidence, i.e. 54.8% in 2012, mainly due to the existence of almost pure transshipment hubs. The transshipment flows in the Hamburg-Le Havre range are generated by ports with very substantial gateway flows. The other port ranges in the EU have a much lower transshipment incidence. The transshipment incidence is growing in all port ranges, except for the UK. The most remarkable growth is observed in the Baltic: the transshipment incidence reached 6.6% in 2012 (almost as high as in the UK), mainly due to the Gdansk effect. Figure 12 presents the shares of the port ranges in total EU transshipment flows. The Med range
Atlanticrange
Hamburg-Le Havrerange
ScandinaviaBaltic
Mediterranean
UK / Ireland
Black Sea
Other

Deliverable 1.1: State of the European Port System – market trends and structure update Partim transshipment volumes
26
(EU ports only) is the largest transshipment market in Europe closely followed by the Hamburg-Le Havre range.
Figure 11. Transshipment incidence in European port ranges, 2004 - 2008 - 2012
Source: authors.
Figure 12. Share of port ranges in transshipment flows of the European port system, 2004 - 2008 - 2012
Source: authors.
0% 10% 20% 30% 40% 50% 60% 70%
Hamburg-‐Le Havre range
Atlantic range
Mediterranean range (EU)
UK
Baltic
Black Sea (EU)
TOTAL EU
Transhipment inciddence (%)
201220082004
45.6%
0.4%
49.5%
3.7% 0.0%0.8%
Transhipment EU -‐ 2004
Hamburg-‐Le Havre range
Atlantic range
Mediterranean range (EU)
UK
Baltic
Black Sea (EU)
46.4%
2.0%
46.2%
1.7% 0.0% 3.7%
Transhipment EU -‐ 2008
Hamburg-‐Le Havre range
Atlantic range
Mediterranean range (EU)
UK
Baltic
Black Sea (EU)
43.9%
2.3%
49.8%
1.6% 1.9% 0.6%
Transhipment EU -‐ 2012
Hamburg-‐Le Havre range
Atlantic range
Mediterranean range (EU)
UK
Baltic
Black Sea (EU)

Deliverable 1.1: State of the European Port System – market trends and structure update Partim transshipment volumes
27
6.2 The Mediterranean and Black Sea
In the Mediterranean, extensive hub-feeder container systems and shortsea shipping networks emerged since the mid-1990s to cope with the increasing volumes and to connect to other European port regions. Before that time, Mediterranean ports were typically bypassed by vessels operating on liner services between the Far East and Europe. Terminals at the transshipment hubs are typically owned, in whole or in part, by carriers which are efficiently using these facilities. Marsaxlokk on Malta, Gioia Tauro, Cagliari and Taranto in Italy and Algeciras in Spain act as turntables in a growing sea-sea transshipment business in the region.
While quite a number of shipping lines still rely on the hub-and-spoke configuration in the Med, others decided to add new liner services calling at mainland ports directly. In reaction, mainly Italian transshipment hubs have reoriented their focus a bit, now also serving Central and East Med regions. The net result of the above developments has been a slight decrease in the market share of the West Med hubs in recent years and a growth in the market share of mainland ports located between 100 and 250 nautical miles from the main maritime route (Figure 13). The transshipment business remains a highly footloose business. This has led some transshipment hubs such as Gioia Tauro and Algeciras to develop inland rail services to capture and serve the economic centres in the distant hinterlands directly, while at the same time trying to attract logistics sites to the ports.
Figure 13. The market shares of container ports in the West Mediterranean. Ports grouped according to the diversion distance from the main shipping route (1975-2012)
Source: updated from Notteboom (2009) based on aggregation of statistics of the respective port authorities.
Non-European ports have an increasing impact on the European container port system. The non-European competitors of the Italian transshipment hubs (Gioia Tauro, Taranto, Cagliari), Marsaxlokk on Malta and Piraeus in Greece are mainly found in Turkey (Ambarli, Mersin, etc..) and close to the entrance of the Suez Canal in Egypt
0%
10%
20%
30%
40%
50%
60%
70%
80%
90%
100%
1975
1976
1977
1978
1979
1980
1981
1982
1983
1984
1985
1986
1987
1988
1989
1990
1991
1992
1993
1994
1995
1996
1997
1998
1999
2000
2001
2002
2003
2004
2005
2006
2007
2008
2009
2010
2011
2012
Shar
e in
TEU
thro
ughp
ut W
est-M
ed
West-Mediterranean ports with one-way diversion distance > 250 nm
West-Mediterranean ports with one-way diversion distance 100-250 nm
West-Mediterranean ports with one-way diversion distance < 100 nm

Deliverable 1.1: State of the European Port System – market trends and structure update Partim transshipment volumes
28
(Port Said, Alessandria, Damietta). These ports have developed a strong market position to serve the East Med and increasingly act as turntables for the Black Sea at the expense of Black Sea ports, such as Constantza.
The port of Constantza recorded a throughput of 684,059 TEU in 2012, still far from the record of 1.4 million TEU in 2007. Early on in its development, Constantza was very much seen as the transshipment gateway for the Black Sea and reached a transshipment incidence of some 75% in 2008. However, times have changed quite significantly as traffic patterns in the region have evolved. When the crisis hit, many container lines changed their liner services in search of cost-efficient logistic solutions. A number of direct services from the Far East into the Black Sea region were cancelled, negatively affecting transshipment volumes. As a result, in 2012 almost three-quarters of the volumes handled at the port consisted of local import and export containers, with the remaining quarter being transshipment. Still, Constantza handles the largest vessels operated in the Black Sea (some 8,000 TEU). Terminal productivity plays an important role in the future development of container terminals in the Black Sea region, where operators in both Ukraine and Russia such as Odessa and Novorossiysk are trying to attract both transshipment and import/export business.
The growing container terminal market in the Maghreb countries increases competition in the Med region, but at the same time opens new growth opportunities for existing European transshipment hubs and gateway ports in the Med. Algeciras (stronghold of APM Terminals of the AP Moller Group) relies a lot on east-west and north-south interlining and is facing competition from Tanger Med where APM Terminals has also set up business. Tanger Med is hoping to bring in dividends from factory delocalization movements to Maghreb countries, particularly to Morocco. Other major port developments are planned in Algeria and Tunisia. Cargo activity in the port of Algiers has strongly increased in recent years in line with Algeria’s strong oil revenue figures. The Algerian government has developed a policy to upgrade the Algerian ports and improve terminal performance. The port of Djendjen is being positioned as a deepwater port for large container ships. The management of the Port of Algiers and that of Djendjen has been privatized allowing a strong involvement of DP World. There are still plans being implemented to transform the deepwater port of Enfidha in Tunisia into a major Central Mediterranean transshipment hub and a prime economic and logistics activity zone. Construction would be phased. Libya has no ports with dedicated container handling facilities yet. There were some initial ideas to develop a deepwater container terminal in Misurata but these have been halted during the Arab Spring.
As mentioned earlier, North African countries are trying to step in the transshipment business for progressively being an active player in international trade networks. Like what happened in Italy from the mid-1990s thanks to the development of Gioia Tauro, Taranto and Cagliari, the objective is to start “stopping” vessels from Asia for attracting cargo and partially deviating container volumes from traditional European ports. In addition, the launching of Free Trade Zones (FTZ) initiatives like in Tangier (Morocco), might stimulate local economic growth and attract foreign direct investments, thus boosting additional traffic growth. In this respect the aggressive strategic behavior of North African countries seems to go in contrast with the expectations of European gateway ports, which prefer direct calls from Asia instead of indirect services via (foreign) hub. Relatedly, we also have to recognize that the privatization of most ports in the Mediterranean (turning to the landlord system) coupled with the large involvement of carriers in such “low cost” facilities, seems to reasonably reduce to bargaining power of European Port Authorities in affecting the geography of trade and container shipping flows.

Deliverable 1.1: State of the European Port System – market trends and structure update Partim transshipment volumes
29
6.3 The Baltic
Major ports in the Hamburg-Le Havre range such as Rotterdam, Hamburg, Bremerhaven, Antwerp and Zeebrugge are not only competing amongst themselves to attract Baltic container transshipment volumes. They are increasingly facing competition from Scandinavian and Baltic ports that want to attract more direct mainline ships calls even on the Europe-Far East route. The competition for Baltic transshipment cargo is likely to increase given the moderate growth prospects for the direct hinterlands of the ports in the Hamburg-Le Havre range and significant port capacity additions (Maasvlakte II in Rotterdam, JadeWeserPort in Wilhelmshaven and planned extensions in the port of Gdansk, to name but a few). The transshipment business is a key component of ports’ and terminal operators’ strategies to fill capacity.
The connectivity of the Baltic region to overseas trading areas still primarily relies on feeder services to hub ports in the Le Havre-Hamburg range. The existing symbiotic relationship between the Baltic port system and the main ports in the Le Havre-Hamburg range (Hamburg, Rotterdam and Bremerhaven in particular) is a prime example of how ports in different regions can actively deploy their mutual dependence. In the last couple of years, terminal development in the Baltic Sea is characterized by scale increases in terminal surfaces and equipment. For example, the port of Gdansk in Poland is equipped to handle large container vessels and receives calls from Maersk Line using 14,000 TEU vessels, notwithstanding the fact that a very substantial share of the ports’ container volumes is feedered from the Le Havre-Hamburg range. Also other Baltic ports are gearing up to welcome more direct calls of mainline vessels. This is particularly felt in the port system at the entrance of the Baltic (Kattegat/The Sound) and in St-Petersburg (i.e. the largest and fast growing container port in the Baltic with 2.52 million TEU handled in 2012). Ports like Gothenburg and Aarhus are already acting as regular ports of call on quite a few intercontinental liner services. While these ports have a good position to act as turntables for the Baltic on many trade routes, the insertion of these ports as regular ports of call on the Europe-Far East trade remains uncertain. The large vessel sizes deployed on this route, the associated reduction in the number of ports of call and the additional diversion distance make regular direct calls to the multi-port gateway region Kattegat/The Sound less viable compared to other trade routes. The P3 Network, the alliance between Maersk Line, MSC and CMA-CGM, plans to include Gdansk and Aarhus in its rotation for the BALTIC service with ships of 14,000 TEU while Gothenburg will act as a port of call in the SKAW service with ships of 13,000 TEU. Since August 2013 the 18,000 TEU Triple E vessels of Maersk Line call at DCT Gdansk in Poland. With a throughput of over 1 million TEU in 2013, the port has ambitious plans to ultimately expand the terminal’s annual capacity to around 4 million TEU. The port is even challenging the established notion of ‘Hamburg-Le Havre range’ by proposing the notion of ‘Gdansk-Le Havre range’. Also smaller ports in the region are participating in the competitive game: e.g. TIL, partly owned by MSC, recently opened a new deepwater facility in the port of Klaipeda in Lithuania.
Quite a few ports in the Hamburg-Le Havre range continue to focus on the Baltic as a key market for the future. The healthy projected volume growth in Eastern Europe and the increasingly important Russian markets attract the attention from these ports. Hamburg remains the undisputed leader in transshipment flows to/from the Baltic with more than 150 sailings a week. However, Hamburg faced a difficult situation at the start of the global crisis as cargo volumes to the Baltic declined steeply due to a partial move of these feeder volumes to the western ports in the range, such as Zeebrugge and Rotterdam. This partly contributed to Hamburg’s container cargo decline of 28% in 2009. Hamburg reacted in early 2010 by introducing a new pricing system, which

Deliverable 1.1: State of the European Port System – market trends and structure update Partim transshipment volumes
30
rewards carriers with large transshipment volumes. Gradually transshipment volumes moved back to Hamburg, supporting the volume recovery in the port.
Newcomer Wilhelmshaven is actively pursuing transshipment business, given that it can yield volumes more quickly than gateway traffic, which is a much slower to attract to a new port. Note that rail services have been established primarily using in-house rail/intermodal firms, and prices to/from Wilhelmshaven and inland points have been matched with those to/from Hamburg and Bremerhaven to the same inland destinations. The P3 Network has announced that Wilhelmshaven will be served directly on two Europe-Asia loops: the ALBATROS service (vessels of 18,000 TEU) and the SHOGUN service (13,000 TEU). Not only newcomers such as Wilhelmshaven are shaping the competitive battleground for transshipment cargo in North Europe. Massive capacity reserves and extensions in Rotterdam (i.e. two new terminals at Maasvlakte II to come on stream in 2014), Zeebrugge (i.e. PSA’s ZIP terminal open since 2012 while APM Terminals still has a lot of capacity available on its facility) and other ports in the region will lead to a strong buyers’ market in the foreseeable future with a pressure on transshipment cargo handling rates and high requirements on terminal productivity and vessel turnaround time.
6.4 The UK/Ireland
The above discussion on the hub-feeder option versus the direct call option also applies to the UK port system. The mainland European ports active in this market segment are primarily Rotterdam, Zeebrugge, Antwerp and Le Havre, while Dunkirk and the North German ports play a more modest role. Most shipping lines and strategic alliances among them serve the southeastern part of the UK directly via the ports of Felixstowe, Southampton, Thamesport and Tilbury while Liverpool plays a role in trans-Atlantic services. The rest of the UK including Scotland is mainly served via feeders and intra-European services. Since mid-2013 the combination of bigger ships, larger alliances and the new London Gateway terminal are affecting the UK container port system.
Thamesport has lost virtually all deepsea services partly because of draft restrictions in the River Medway approach channel. Evergreen moved its UK cargo from Thamesport to Felixstowe while other lines such as Hapag-Lloyd, OOCL and NYK moved their transatlantic services from Thamesport to Southampton. The volume drop in Thamesport started already earlier with ‘only’ 300,000 TEU handled in 2012, compared to close to 800,000 TEU in 2008. Also Tilbury’s traffic is likely to be affected negatively by larger ships sizes and the opening of DP World’s London Gateway terminal. Both Thamesport and Tilbury, as well as other smaller container ports such as Great Yarmouth, will likely focus more on niche and short sea intra-European services.
The new London Gateway terminal complex will face competition from UK ports Felixstowe and Southampton, but also from mainland European ports such as Rotterdam, Zeebrugge, Antwerp and Le Havre which offer competitive feeder services to the UK. London Gateway received its first vessel in November 2013. The terminal can accommodate vessels with a draft of up to 17m at any state of the tide. Maersk, MOL and Deutsche Afrika Linien already decided to shift their UK port of call on the South Africa service from Tilbury to London Gateway. Rail links are already in place connecting the terminal with the big centres, with DB Schenker Rail UK taking a lead role in the provision of those services. In June 2013, Marks & Spencer confirmed to invest in a new distribution centre within the terminal area to open in 2016.

Deliverable 1.1: State of the European Port System – market trends and structure update Partim transshipment volumes
31
CONCLUSIONS AND RECOMMENDATIONS 7
The dynamics in the transshipment (T/S) business has implications on freight distribution patterns in Europe. A hub-and-spoke based network means less cargo concentration in mainland destination ports and as such a more dispersed or fragmented inland transport system. Alternatively, traffic growth can lead to an undermining of the position of transshipment hubs in favor of a limited number of large-scale mainland ports, each connected to intermodal corridors.
Based on this report and taking into account the scope and objectives of the PORTOPIA project and WP1 in particular, we make the following recommendations:
-‐ Given the importance of the transshipment market to many container ports in Europe, it is to be explored whether data gathering on transshipment flows can be integrated in the Rapid Exchange System (RES);
-‐ Data gathering on the European transshipment market should also include key ports in non-EU countries of Northern Africa and Turkey;
-‐ It is recommended that T/S data is collected on a continuous basis to monitor the tensions between T/S and direct calls for the Baltic, the UK/Ireland and the Med, but also to assess the vulnerability of ports and port regions to changes in the transshipment market.
In light of the above it might be relevant to consider the ‘transshipment incidence or T/S %’ as a relevant and meaningful indicator in the category of ‘market trends and market structure’.
*****