pdf (1636 kb) - world bank elibrary
TRANSCRIPT

Policy Research Working Paper 5794
Cargo Dwell Time in Durban
Lessons for Sub-Saharan African Ports
Tshepo KgareGael Raballand
Hans W. Ittmann
The World BankAfrica RegionTransport UnitSeptember 2011
WPS5794P
ublic
Dis
clos
ure
Aut
horiz
edP
ublic
Dis
clos
ure
Aut
horiz
edP
ublic
Dis
clos
ure
Aut
horiz
edP
ublic
Dis
clos
ure
Aut
horiz
ed
Produced by the Research Support Team
Abstract
The Policy Research Working Paper Series disseminates the findings of work in progress to encourage the exchange of ideas about development issues. An objective of the series is to get the findings out quickly, even if the presentations are less than fully polished. The papers carry the names of the authors and should be cited accordingly. The findings, interpretations, and conclusions expressed in this paper are entirely those of the authors. They do not necessarily represent the views of the International Bank for Reconstruction and Development/World Bank and its affiliated organizations, or those of the Executive Directors of the World Bank or the governments they represent.
Policy Research Working Paper 5794
Based on quantitative and qualitative data, this paper attempts to identify the main reasons why cargo dwell time in Durban port has dramatically reduced in the past decade to a current average of 3–4 days. A major customs reform; changes in port storage tariffs coupled with strict enforcement; massive investments in infrastructure and equipment; and changing customer behavior through contractualization between the port operator and shipping lines or between customs, importers, and
This paper is a product of the Africa Region, Transport Unit. It is part of a larger effort by the World Bank to provide open access to its research and make a contribution to development policy discussions around the world. Policy Research Working Papers are also posted on the Web at http://econ.worldbank.org. The author may be contacted at [email protected].
brokers have all played a major role. The main lesson for Sub-Saharan Africa that can be drawn from Durban is that cargo dwell time is mainly a function of the characteristics of the private sector, but it is the onus of public sector players, such as customs and the port authority, to put pressure on the private sector to make more efficient use of the port and reduce cargo dwell time.

Cargo Dwell Time in Durban: Lessons for Sub-Saharan African Ports
Tshepo Kgare
Gael Raballand
Hans W. Ittmann1
Keywords: Durban, South Africa, port, cargo dwell time, customs.
JEL: F15, L91, R41.
1 The authors would like to thank Nick Poree for his help and Salim Refas for inputs, Reynaldo Bench, Mervin
Chetty, Charles Kunaka and Dave Watts for comments and suggestions and the World Bank Netherlands Partnership Program for funding of the study. Tshepo Kgare, transport specialist, SSATP/World Bank, Gael Raballand, senior economist, World Bank, [email protected] (corresponding authors), Hans Ittmann, executive director of CSIR Built Environment.
2
Table of Contents
1. Introduction .......................................................................................................................................... 3
2. Cargo Dwell Time at the Port of Durban ............................................................................................... 6
3. How Can Low Cargo Dwell Time be Explained? .................................................................................. 10
A Change in Storage Pricing of the Port Operator .................................................................................. 11
The Role of Public Sector in Improving Efficiency ................................................................................... 12
Customs............................................................................................................................................... 12
Transnet Role and Infrastructure Investments ................................................................................... 13
4. Why Was it So Important to Reduce Cargo Dwell Time? ................................................................... 16
5. Lessons for Ports in SSA ...................................................................................................................... 18
6. What Remains to be Done to Reduce Cargo Dwell Time? .................................................................. 22
Increase Labor productivity .................................................................................................................... 22
Improve Port Access ............................................................................................................................... 23
7. Conclusions and How to Improve Port Competitiveness ................................................................... 24

3
1. Introduction
There is increasing evidence that transport time decreases trade and increases logistics costs,
notably because of increased inventories. Hummels (2001) demonstrated empirically that increased
transport time dramatically reduces trade. That probably explains why the location of exporters is
increasingly important and why Kwazulu-Natal, the province where Durban is located, contributes to
22% of South Africa’s manufacturing gross domestic product with manufacturing activities principally
located in the Greater Durban Metropolitan Area (Valodia, 2006 and Krugell et al. 2009). Among twelve
major impediments, the automotive industry in South Africa listed reducing inventories as the most
important objective (Barloworld 2010). Without reduced cargo dwell time and increasing dwell time
predictability, the objective of reducing inventories is not likely to be met.
Ports and cargo dwell time in ports are critical. Arvis et al. 2010 demonstrates that for land
transport to landlocked countries in Sub-Saharan Africa (SSA) over 50% of total transport time from port
to hinterland cities is spent in ports.
South Africa has the largest number of intra-regional maritime connections with international
carriers providing direct access to 29 other African countries (UNCTAD 2009). With the rise in maritime
traffic volumes, at their peak, South African ports handled up to 185 million tonnes in 2008 before
experiencing a slight drop in 2009/2010 because of the fallout from the global financial crisis. The
demand at South African ports surpasses all countries in Eastern and Southern Africa (see Annex 1).
With a network of eight ports, the country has a critical role to play in the international trade landscape
for the region.
Widely acknowledged for relatively good performance compared to others in the region, South
Africa and its network of ports is ranked 28th in the Logistics Performance Indicator (LPI) for 2010
followed by Senegal at 58th. The global trend of rising popularity of the container means African ports
also experienced growth in the containerized cargo market. South Africa handled the highest container
volumes reaching a peak of 3.9 million TEU’s in 2008 with the Port of Durban2 accounting for over 60%
2 In South Africa, all ports, freight rail and pipeline infrastructure are owned by the Transnet Group (and all its
subsidiaries). The South African government is the unique shareholder through the Department of Public Enterprise (DPE) which controls all parastatals. TNPA is the landlord port authority responsible for all the 8 national ports in the country providing port infrastructure and marine services as well as tariff setting and control of spatial allocation. Port operations are largely run by Transnet Port Terminals (TPT) with some small degree of private sector participation. The operations can be divided into 4 sectors namely bulk, break – bulk, automotive and
4
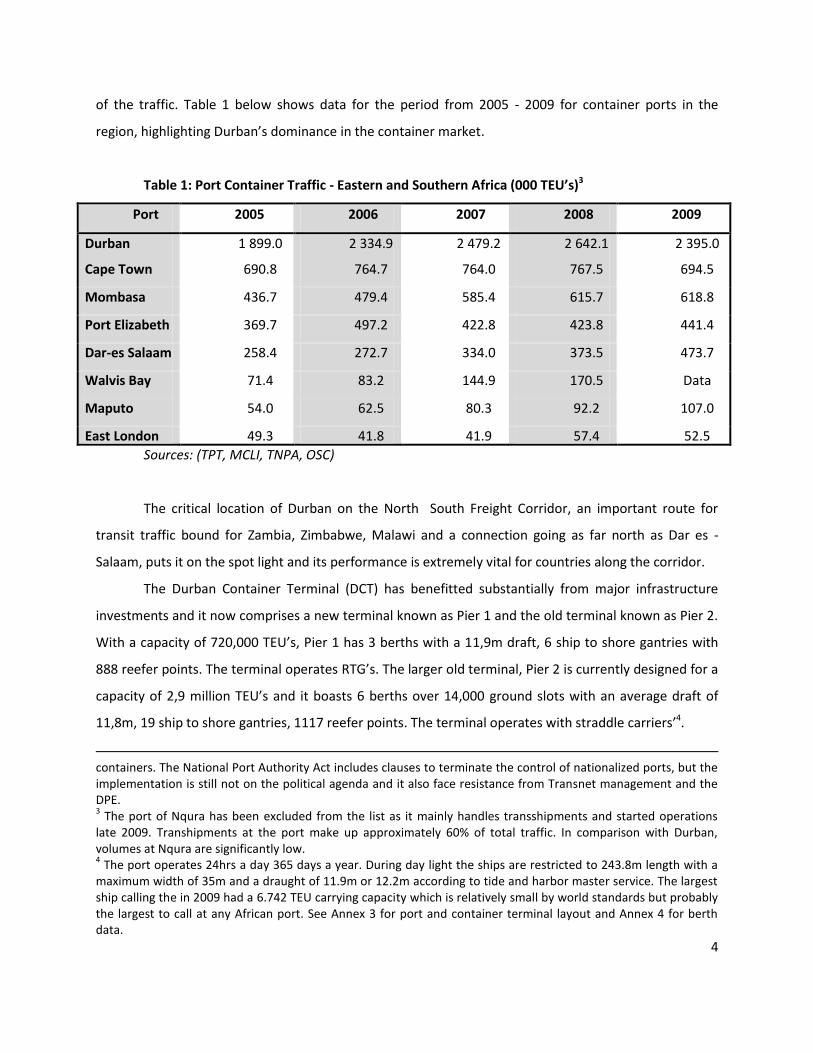
of the traffic. Table 1 below shows data for the period from 2005 - 2009 for container ports in the
region, highlighting Durban’s dominance in the container market.
Table 1: Port Container Traffic - Eastern and Southern Africa (000 TEU’s)3
Port 2005 2006 2007 2008 2009
Durban 1 899.0 2 334.9 2 479.2 2 642.1 2 395.0
Cape Town 690.8 764.7 764.0 767.5 694.5
Mombasa 436.7 479.4 585.4 615.7 618.8
Port Elizabeth 369.7 497.2 422.8 423.8 441.4
Dar-es Salaam 258.4 272.7 334.0 373.5 473.7
Walvis Bay 71.4 83.2 144.9 170.5 Data
not avail Maputo 54.0 62.5 80.3 92.2 107.0
East London 49.3 41.8 41.9 57.4 52.5
Sources: (TPT, MCLI, TNPA, OSC)
The critical location of Durban on the North South Freight Corridor, an important route for
transit traffic bound for Zambia, Zimbabwe, Malawi and a connection going as far north as Dar es -
Salaam, puts it on the spot light and its performance is extremely vital for countries along the corridor.
The Durban Container Terminal (DCT) has benefitted substantially from major infrastructure
investments and it now comprises a new terminal known as Pier 1 and the old terminal known as Pier 2.
With a capacity of 720,000 TEU’s, Pier 1 has 3 berths with a 11,9m draft, 6 ship to shore gantries with
888 reefer points. The terminal operates RTG’s. The larger old terminal, Pier 2 is currently designed for a
capacity of 2,9 million TEU’s and it boasts 6 berths over 14,000 ground slots with an average draft of
11,8m, 19 ship to shore gantries, 1117 reefer points. The terminal operates with straddle carriers’4.
containers. The National Port Authority Act includes clauses to terminate the control of nationalized ports, but the implementation is still not on the political agenda and it also face resistance from Transnet management and the DPE. 3 The port of Nqura has been excluded from the list as it mainly handles transshipments and started operations
late 2009. Transhipments at the port make up approximately 60% of total traffic. In comparison with Durban, volumes at Nqura are significantly low. 4 The port operates 24hrs a day 365 days a year. During day light the ships are restricted to 243.8m length with a
maximum width of 35m and a draught of 11.9m or 12.2m according to tide and harbor master service. The largest ship calling the in 2009 had a 6.742 TEU carrying capacity which is relatively small by world standards but probably the largest to call at any African port. See Annex 3 for port and container terminal layout and Annex 4 for berth data.
5
Total TEU’s handled across quay in 2010 for both piers was 2,5 million, still below the 2008 peak
of 2,6 million.
Most of the containers going through Durban are destined for Johannesburg and transported by
road while traffic volumes on rail have remained static over the years. A review study of the Durban
Inland Intermodal Terminal and Logistics Hub conducted in 2008 reveals the turnaround time within the
port area was too long and had major implications on efficiency thus dwell time (Arup, 2008).
Even though, from interviews, port performance usually emerges as the main culprit for long
delays along transit corridors, disentangling port inefficiency is scarcely carried out, especially in Sub-
Saharan Africa. However, in a country with relatively higher trade value, such as South Africa, this is of
even more importance.
Therefore, this study seeks to identify what has been done at the Port of Durban in the last
decade in Durban in the effort to reduce cargo dwell time within the last decade. It will also
demonstrate the impact of reduced cargo dwell time on port operational capacity. This paper especially
describes the of public sector actors, such as Customs, the port authority and the port operator.
The paper is based on interviews and data collected from a field visit to Durban carried out in
January 2011. During the mission, extensive consultations with port stakeholders involving port
authorities, shipping lines, freight forwarders, customs brokers and various cargo owners were
undertaken. Data on dwell time was also obtained from a number of sources including Transnet Port
Terminal (TPT) and the private sector port community5.
The main lessons for Sub-Saharan Africa, which can be drawn from Durban port, are that cargo
dwell time is mainly a function of the characteristics of the private sector, but the onus is on public
sector players such as customs, the port authority, etc. to put pressure to change the behavior of the
private sector port users to better comply and reduce cargo dwell time. In this regard, prohibitive
charges for storage, coupled with strict enforcement, and the possibility to pre-clear with Customs with
advantages attached to it and service level agreements binding both parties are critical tools for the
reduction of cargo dwell time
The outline of the paper is as follows: section two presents descriptive data on cargo dwell time
in Durban and compares it to several ports in Sub-Saharan Africa and decomposes the aggregate cargo
dwell time figure. Section three presents the technical measures, such as cargo storage fees changes,
5 Because of lack of detailed data and the limited share of transit traffic in the total traffic, the paper focuses on
domestic cargo.

6
which have contributed to decreasing cargo dwell time as well as the role of public stakeholders, mainly
Customs, the port authority and the port operator. Section four explains the justification of reducing
cargo dwell time from an operational approach. Then, the main lessons for SSA ports are presented. In
the sixth section two of the main remaining challenges to reduce cargo dwell time are discussed. The
final section concludes and presents some factors, which could contribute to improve port
competitiveness in general.
2. Cargo Dwell Time at the Port of Durban
“Normal” cargo dwell time differs between ports and even more importantly between port
users and stakeholders6. In the case of Durban, 28 days is the time limit for Customs to consider
“abandoned cargo” and this then represents the end of “normal” cargo dwell time. Shippers, who
represent the automotive industry, consider 3 days already as excessive dwell time. However, some
small shippers would tend to consider “normal” cargo dwell time around 4-5 days.
In the absence of an irrefutable and uncontested benchmark of what is considered to be
abnormal cargo dwell time, TNPA/TPT decided to target a dwell time of 3 days for the Port of Durban. In
reality, it seems as if this target has been achieved. Data obtained for the Durban Container Terminal
(DCT)/ Pier 2 (and confirmed by shippers and shipping lines), indicate a 3-4 days dwell time for that
terminal since 2006.
The figure below shows that the average dwell time at the port is below 4 days for both imports
and exports with a slight peak of 5 – 7 days around May 2010 which correlates with the 2010 Transnet
labor strike period.
6 See Refas and Cantens (2011) for a discussion on various definitions.

7
Figure 1: Durban Dwell Time (2006-2010) at DCT Pier 2
Source: Transnet Port Terminal
Dwell time for transshipments is around 5 to 10 days with a few irregular peaks at around the 15
days mark, notably between July and September7. This is also related to the fact that “free time”8 for
transshipment is set at 7 days (with low charges below 15 days)9.
It should be noted that cargo is generally moved from the terminal to bonded warehouses
before the expiry of the free storage period of 3 days offered by TPT. Therefore, the information
provided does not capture all dwell time figures for the port. Additional data were also collected from
those involved in cargo handling for the period from January to December 2010. The data are based on
accounting information from arrival at port to the time cargo is passed on to the owner. The data shows
that on average most cargo is held for less than 4 days (referred to as overstays).
According to the main shipping lines/warehouse owners, less than 10% of containers go beyond
the 3 day period and less than 1% go beyond 28 days. Based on these multiple interviews, it was
possible to reconstruct dwell time frequency (see Figure 2).
7 Transshipments account for approximately 20% of total cargo.
8 Free time is defined as the time from when the vessel completes discharge and the container is stored in the port
area until collection for a specified period without incurring any port storage charges. For import containers this is set at 3 days and 7 days for transshipments. 9 Figure 1 suggests that dwell time for exports and imports is rather similar and could tend to demonstrate that the
lower limit is rather close.
0.0
2.0
4.0
6.0
8.0
10.0
12.0
14.0
16.0
18.02
00
6-0
1
20
06
-03
20
06
-05
20
06
-07
20
06
-09
20
06
-11
20
07
-01
20
07
-03
20
07
-05
20
07
-07
20
07
-09
20
07
-11
20
08
-01
20
08
-03
20
08
-05
20
08
-07
20
08
-09
20
08
-11
20
09
-01
20
09
-03
20
09
-05
20
09
-07
20
09
-09
20
09
-11
20
10
-01
20
10
-03
20
10
-05
20
10
-07
20
10
-09
20
10
-11
Import
Export
Tranships

8
Figure 2: Durban Cargo Dwell Time Frequency
Source: Interviews with TPT and with major shipping lines and warehouses operators.
Therefore, Durban appears to be a good benchmark for Southern Africa, but even more
importantly, for SSA ports. Durban is, indeed, by far the port where cargo dwell time is the lowest in
Southern Africa and SSA in general (see Table 2 which presents data collected for the Africa
Infrastructure Country Diagnostic (AICD) for Southern Africa and Table 3 for selected ports in SSA).
Table 2: Dwell time in Southern Africa
Cape
Town
Durban East
London
Port
Elizabeth
Walvis
Bay
Luanda Beira Maputo
South Africa Namibia Angola Mozambique
Container dwell
time—average
(days) 6 4 7 6 8 12 20 22
Source: Africa Infrastructure Country Diagnostic, 2009
15%
30%
45%
6%3%
1%0%
5%
10%
15%
20%
25%
30%
35%
40%
45%
50%
Day 1 Day 2 Day 3 Day 4-8 Day 8-28 Over 28

9
Table 3: Dwell time in Sub-Saharan Africa
Durban Douala Lome Tema Mombasa Dar-es-
Salaam Average
(Durban
excluded) South
Africa Cameroon Togo Ghana Kenya Tanzania
4 19 18 20 9 19 17
Source: Refas et al (2011) for Douala, surveys for the other ports.
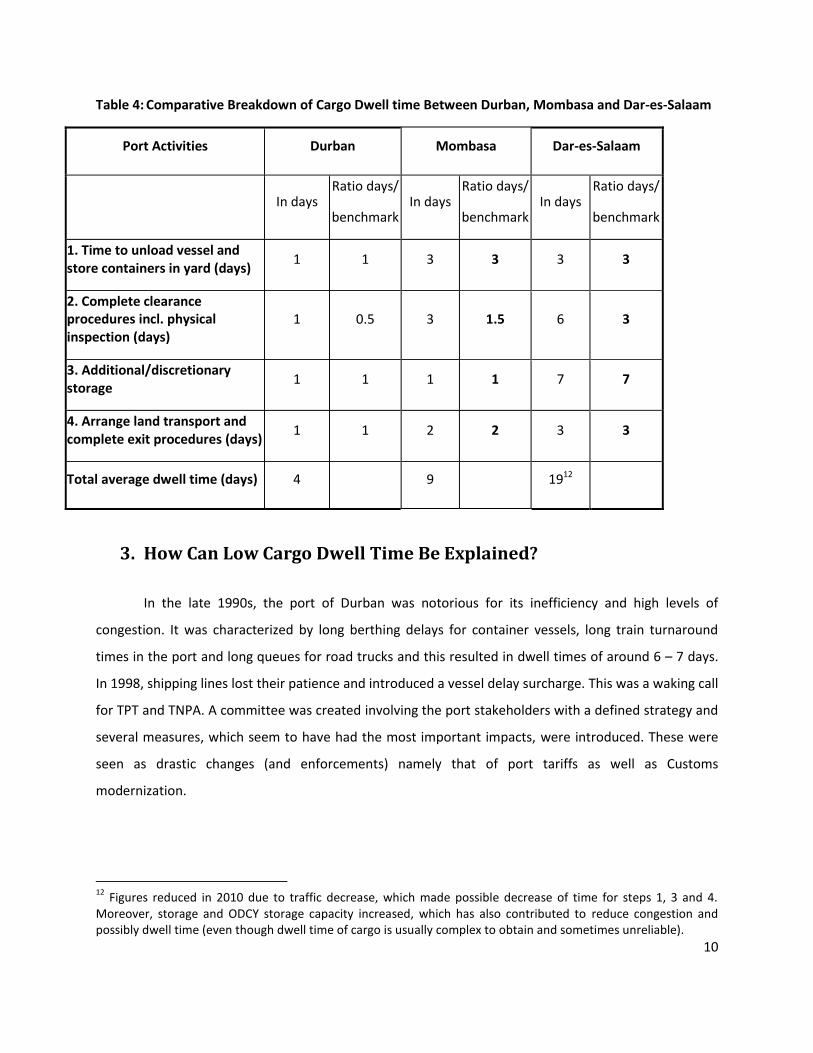
When cargo dwell time is broken down between operational, transactional and discretionary
storage10, it appears that Durban favorably compares with Mombasa and even more so with Dar-es-
Salaam11. The most significant difference concerns clearance procedures, where up to 6 days can be
gained, as well as for discretionary storage. The last factor seems to play a major role and is therefore
discussed in detail below.
10
Operational dwell time is mainly the time to unload vessels and store in yards. It mainly depends on the efficiency of the port and the availability of equipment combined with the level of occupancy of the storage facilities. Transactional dwell time mainly concerns the transaction time between the importers/port services and customs. Discretionary storage is the residual after having taken into account operational and transactional dwell times. 11
In an ideal situation, the minimum time for the transactions is 1 day for clearing the cargo depending on whether a physical inspection is required. Another 1-2 days for the transfer from the vessel to the yard and a similar amount for the transfer from the container yard to the ODCY. Finally it would require half a day/ a day to pay the port and shipping fees and exit the port, which means that mean dwell time can not really go, on average, below 3 days.
10
Table 4: Comparative Breakdown of Cargo Dwell time Between Durban, Mombasa and Dar-es-Salaam
Port Activities Durban Mombasa Dar-es-Salaam
In days
Ratio days/
benchmark In days
Ratio days/
benchmark In days
Ratio days/
benchmark
1. Time to unload vessel and store containers in yard (days)
1 1 3 3 3 3
2. Complete clearance procedures incl. physical inspection (days)
1 0.5 3 1.5 6 3
3. Additional/discretionary storage
1 1 1 1 7 7
4. Arrange land transport and complete exit procedures (days)
1 1 2 2 3 3
Total average dwell time (days) 4 9 1912
3. How Can Low Cargo Dwell Time Be Explained?
In the late 1990s, the port of Durban was notorious for its inefficiency and high levels of
congestion. It was characterized by long berthing delays for container vessels, long train turnaround
times in the port and long queues for road trucks and this resulted in dwell times of around 6 – 7 days.
In 1998, shipping lines lost their patience and introduced a vessel delay surcharge. This was a waking call
for TPT and TNPA. A committee was created involving the port stakeholders with a defined strategy and
several measures, which seem to have had the most important impacts, were introduced. These were
seen as drastic changes (and enforcements) namely that of port tariffs as well as Customs
modernization.
12
Figures reduced in 2010 due to traffic decrease, which made possible decrease of time for steps 1, 3 and 4. Moreover, storage and ODCY storage capacity increased, which has also contributed to reduce congestion and possibly dwell time (even though dwell time of cargo is usually complex to obtain and sometimes unreliable).

11
A Change in Storage Pricing of the Port Operator
TPT explained that to achieve their target of 3 days dwell time, one of the more practical and
simple measures employed was to enforce terms and conditions related to storage of cargo at ports,
which states that within 72 hours of the discharge of each container from the vessel the Customer or
the Container Operator shall provide the Terminal Operator with delivery instructions in respect of all
containers discharged. All containers remaining after the expiration of the 72 hr period shall incur
storage charges as shown in table 5 below13. Charges for Durban are almost six times as high as other
ports in the country.
Table 5: Storage Fees for Import Containers
No of Days Tariff per Container Type (USD estimate)
6m/20' 12m/40'14
Day 1 - 3 Free Storage Days15
Day 4 90 181
Day 5 237 475
Day 6 477 954
Day 7 716 1,432
Day 8 956 1,911
Day 9 1,195 2,389
Day 10 1,435 2,867
Source: Transnet
Uncleared cargo or cargo detained by customs for inspection is moved to licensed container
depots either by the carrier or the terminal operator. The licensed depots generally provide a cheaper
storage option compared to the terminal charges. It is estimated that about 90% of cargo can and is
generally cleared within 3 days and only less than 10% of cargo is moved to bonded warehouses where
the average stay is estimated at around 7 – 8 days with less than 1% of these ending up as long stay or
abandoned cargo (i.e. 28 days or more) which then goes to a state auction. Free storage for
13
It is worth noting that the free time period in most SSA countries is much higher: 11 days in Douala, Cameroon or even more in West Africa. 14
Forty-feet equivalent Unit 15
The first 3.25 days (78 hours) are free, the free period is applied from 00h01 on the day the vessel completes discharge until the container leaves the gate or is loaded for rail or until the 78 hr period is reached.

12
transshipments is 7 days, which probably explains the higher dwell time. However the proportion of
transshipments at Durban Port is small.
While the 3 day storage policy released much needed capacity inside the terminal, to address
congestion around the port area, TPT identified peak periods for collections at 8am – 11am and 2pm –
4pm which also happen to coincide with the general Durban city commuter traffic peak with a resultant
conflict between the two creating massive congestion in the city and constraining port access. Cargo
handling companies and large consignees such as Toyota were targeted and encouraged to collect goods
at night or during off peak periods.
Despite all these efforts, it is reported that almost 50% of customers still collect their cargo on
the last day of free storage.
Therefore, major stakeholders acknowledge that the introduction of the "punitive storage
charge" after day three is probably the most important single event impacting on dwell time at Durban
port. Even though it took some months for the impact to materialize, DCT saw a continuous drop in
dwell time and a reduction in the number of import boxes in yard at any given time.
It is worth noting that this was possible since systems to allow for prompt clearance and release
were in place. Even though pre arrival clearance has always been possible, it is noted that the length of
dwell time before the increase in port tariffs was certainly due to the low storage rate, which was at that
time approximately 10 USD per TEU per day, often cheaper than taking delivery if there was going to be
commercial storage required. For the storage policy to be effective, it does require the terminal to
perceive itself as part of a logistical chain and not as a storage facility. Once it has that mindset then
dwell times will fall assuming there are systems in place to allow for prompt clearance.
The Role of Public Sector in Improving Efficiency
Customs
It would obviously be unacceptable for TPT to impose such a charge to cargo owners when it is
not possible to clear cargo from customs. Therefore the importance of customs performance in the
issue of dwell time cannot be over emphasized.
Studies show that some of the major delays at ports and border crossings are because of
inefficiencies by the customs agencies. As pointed out by Raven, efficiency of ports or even the timing of
many of its activities is strongly influenced, if not dictated, by customs (Raven, 2000). The target for
South Africa’s Revenue Services (SARS) Customs, is to clear within 3 hours for declarations processed
through Electronic Data Interchange (EDI). According to SARS, during the first quarter of 2011, the
13
average time to release goods was 3 hours when processed through EDI and 10 hours when not
processed through EDI (with 75% of declarations processed through EDI).
With customs clearing cargo in less than 1 day and TPT efficiently moving cargo from the
terminal area, it is probably safe to assume that there is “no transactional dwell time” at the Port of
Durban as expressed by one stakeholder (or at least it is rather limited for a Southern or SSA standard).
Various research notes that customs service, rapidity of processing, simplicity of documentation
influences port competitiveness. The Customs modernization project made a significant contribution to
improving the competitiveness of the Port of Durban.
The project delivery strategy of enhanced compliance recognized three key elements influencing
customs operations, namely; (i) some taxpayers/traders will always try to comply whether effective
enforcement exists or not: (ii) the goal is to influence the undecided majority who will choose one way
or the other based upon how well the strategy is implemented and (iii) some taxpayers/traders will not
comply whether effective enforcement exists or not – the criminals.16
Within that context, the strategy was based on the fundamental principles of making it easy for
those trying to comply by improving services and making it hard for those who do not want to comply
by improving enforcement. Therefore, measures aimed at increasing treatment differentiation and
compliances were initiated. In this regard, contractualization between customs brokers and customs
was developed. For instance, for companies wishing to get an authorized economic operator status,
needed to go through detailed interviews and be transparent regarding their economic activities and
supply operations and are, from time to time, controlled randomly. However, these companies 17benefit
from a green channel, which means that as soon as the cargo is handled at the port, it can be removed.
Contrary to most countries in SSA, pre-clearance is then the rule and this explains why the target for
customs clearance time is in hours and not in days like in other countries.
Transnet Role and Infrastructure Investments
From an infrastructure perspective, South Africa was ill-prepared for the increased trade at the
time of adopting its port liberalization policy. The trade infrastructure was ageing and had been
neglected for many years; naturally most of the South African ports were under performing. As the size
of the container vessels calling at South African ports continued to increase, port or terminal congestion
16
Presentation by the Commissioner of SARS, SARS Custom Modernisation: The Modernisation journey; available on www.sars.gov.za. 17
SARS identified its top 20 clients to get accreditation with benefits such as green line, fewer inspections, post clearance audit etc. These companies account for approximately 70 – 80 % of total cargo.
14
became a critical issue thus increasing the risk of delays. With Durban housing the largest container
terminal, it was in the spotlight, it quickly gained a reputation of inefficiency and the words congestion
and delays were synonymous with the port itself. When the Minister of the Department of Public
Enterprise finally made an announcement about the infrastructure development cash injection into the
ports in 200118, the shipping lines were encouraged and in no time, the surcharge was dropped. From
2002, Transnet invested more than 700 million USD over a five year period focusing on creating capacity
and equipment. But, this was only the beginning of a long and hard but determined transformation
process by Transnet.
To date, the Port of Durban has seen the capacity of its container terminal increase to
approximately 3.6 million TEUs per annum with DCT standing at 2.9 million TEUs and the transformation
of Pier 1 into a high tech facility of 720,000 TEU’s per annum. The investments in the container terminal
also included 6 cranes in Pier 1 and 19 cranes with twin lifting capability in Pier 2. Further infrastructure
improvements included widening of the harbor channel entrance to 225 m and a deepening to 19 m at
the approach. The berthing draft is still below 12 m however it is intended to be deepened to 16.5 m.
As with most Transnet infrastructure, information and communications technology (ICT) was
also a neglected area and ICT transformation was one of the main elements of the Transnet
reengineering strategy. One of the key developments in ICT was the introduction of automated systems
using RFID tagging, high definition cameras, optical character recognition of license plates and
information exchange with SARS to replace truck drivers and vehicle checks aimed at reducing the
length of queues19. This also includes the move from Cosmos20 to NAVIS21 terminal operating system,
first piloted in Pier 1 at its opening and has been introduced in all ports except Pier 2 over the last year.
18
For a five year period up to 2009, Transnet had made capital investment of up to UD$11.5 billion with 59% spent in infrastructure related projects; 32% on rolling stock; 9% on machinery, equipment and a floating aircraft. In 2009 alone, 43% was spent at Durban. 19
Changing the way Transnet works, Internal Newsletter, 2010 available from the Transnet website, www.transnet.co.za. 20 Cosmos offers terminal operators, stevedores, shipping lines and port authorities advanced ICT solutions that
streamline the logistics of container terminal operations. The applications in the Cosmos suite helps plan, track and
monitor all container movements in the terminal, from arrival until departure, including booking, document
handling and invoicing (http://www.cosmos.be/container_terminal_systems.aspx) 21
Navis is the technology for managing the movement of cargo through terminals. It provides cargo tracking through the port, automated equipment operations, management of multiple terminals through an integrated, centralized solution. It integrates the industry’s leading terminal operating system with select, 3rd party technologies, to offer complete, pre-integrated solutions that are deployed quickly and easy to maintain (http://www.navis.com/about_us/index.jsp)

15
Pier 2 is currently crossing over from COSMOS to NAVIS. As expected, teething problems are prevalent
at the port of Durban as a result of the move.
While there are questions about the return on infrastructure investment, there is general
acknowledgement of the challenges brought about by the new infrastructure regarding human
resource. A study on the competitiveness of ports in Korea and China identified the role of professionals
and skilled labor force in port operations, the sophistication level of port information and the scope of
its applications, as some of the key elements for competitiveness (Gi Tae-Ye et al, 2008).
With new equipment on board, there was an urgent need to train operators in the use of the
new equipment. TNPA has committed to enhancing human capital in line with the Transnet group’s
growth strategy. Training opportunities focusing on marine operations, port engineering and leadership
development programs are available. In the case of Durban, TPT trained operators to work on the new
equipment with speed but in a safe way. A training service provider from Singapore was recruited to
assist in this regard. Some of the techniques they learned include hoisting a container by the crane
adopting a parabolic profile, which reduces the hoist cycle time by more than 45% thereby boosting
container handling frequency. TPT’s performance highlight for 2009/2010 includes improved
productivity at DCT and Pier 1 with increase of 4.6% and 26.3% moves per Gross Crane Hour (GCH)
respectively. DCT currently operates at a productivity of 28 moves per GCH, a major improvement from
the 19 moves per GCH a few years ago (Transnet, 2009).
Although Transnet had embarked on numerous initiatives to improve performance through
investment in infrastructure and its human capital, the behavior of third parties remained a challenge. It
is reported that in 2001, information provided by shipping lines had an accuracy of 43%, making
operational planning a headache. A strategy to alter behavior patterns of the private sector was
developed.
One of the key initiatives to achieving this was the introduction of the Container Terminal
Operation Contract (CTOC) with key customers, mainly shipping lines. CTOC entails establishment of
service level agreements between TPT and its customers regarding expected performance levels. These
bind the parties through contract to deliver specified targets such as level of service based on agreed
performance indicators (i.e. dedicated berthing window, guarantee 28 moves per GCH etc) on the part
of the terminal operator and observing specific regulations on the part of private port users (i.e.
compliance with specific requirements such as providing accurate information etc). Commercial
16
agreements with shipping lines now stipulate a 96% accuracy of information provided22. Failure to do so
attracts sanctions. Enforcement of CTOC agreements has been critical for success.
The interesting thing about the CTOC is that staff can commit to these targets as well and at the
moment about 5% of TPT staff have committed to a service level performance of 28 moves per hour.
Further incentives include a commitment to specific customers to be afforded an agreed level of service,
be it reduced, during periods of disruption such as labor strikes, etc. while the customer commits to
clearing cargo from the port within agreed times. With the bigger customers agreements may even
involve doing bulk runs at night.
In an environment where inefficiencies prevail, the private sector feeds from the public sector’s
inefficiency, therefore creating a virtuous cycle of inefficiency and corruption on both sides. The basic
issue here is really a need to establish rules of engagement and enforcement on both sides but the onus
is on Transnet to enforce the rules while fulfilling its mandate of providing an efficient service to its
customers. And so far, this arrangement seems to be working well.
TNPA also established port user forums for some of the key stakeholders, coordinated and
chaired by TNPA itself. These have been divided into six clusters as follows: Automotive, Coal,
Containers, Iron Ore, Liquid Bulk and Manganese. In the case of the DCT and Pier 1 there is a container
terminal advisory board which meets on a monthly basis. These meetings provide TNPA and its
customers an opportunity to discuss issues and try to find solutions together. While the process started
off with both parties playing blame games, the partnership between TNPA and its customers appears to
be working well as reflected by the recent Barloworld survey of 2010. At least, more than half of those in
the automotive industry proclaim that logistics capacity of SA’s ports has improved in the last two years
and they also think that the loading and docking capacity is now competitive and comparable to
international practice. The Industry also gave customs a vote of confidence by confirming that
compliance processes are being dealt with more efficiently than in the past and that corruption has
decreased, and physical security of goods in the port has improved (Barloworld Logistics, 2010).
4. Why Was It So Important to Reduce Cargo Dwell Time? Aggressive policies against long dwell times are often pointed at by shippers as unfair and
disproportionate. The complexity is to set tariffs and measures that are, on the one hand, strict enough
22
Some of the items stipulated in the agreements include Estimated Time of Arrival (ETA), Container lists or EDI capability.
17
to discourage shippers from using the port as a warehouse, and on the other hand, realistic given the
time necessary to perform clearance formalities and operations.
In the case of Durban, a target of 3 days has been considered both realistic and necessary to
achieve acceptable operational performance and it has been achieved through a set of direct and
indirect measures. If one were to evaluate the impact of such dwell time reduction on terminal handling
capacity and productivity, several factors need to be taken into account:
- the physical capacity of the port; and
- the usage patterns (dwell time distribution, traffic distribution, etc.)
Physical capacity is indeed a critical factor in port planning that is directly affected by long dwell
time patterns (the higher the dwell time the higher the occupancy of the yard). When facing capacity
shortage issues port planners have however a tendency to immediately consider capacity extension
projects without envisaging a more optimal use of the existing capacity.
We argue that dwell time reduction is often a more efficient way to release additional capacity
in a container terminal at limited cost. But this depends also on usage patterns and more specifically on
dwell time distribution and occupancy ratios23. For example we have developed a simple model to
estimate the impact of dwell time reduction in Durban container terminal given the current usage
patterns and port capacity.
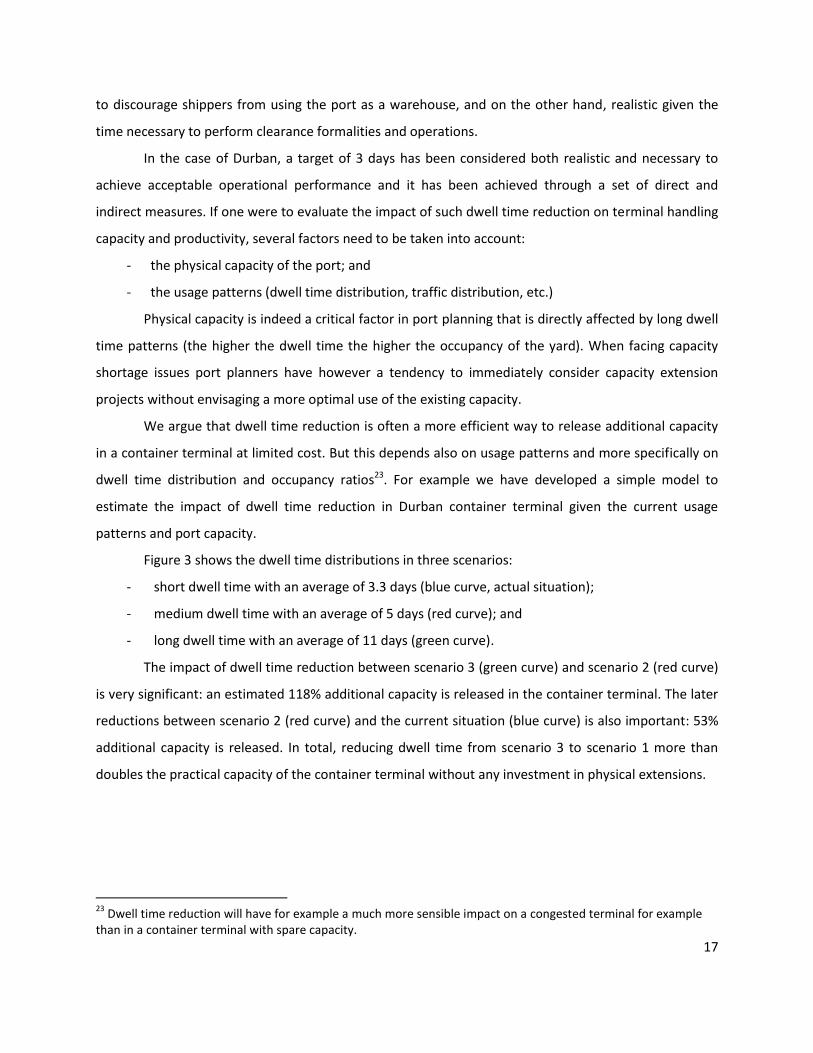
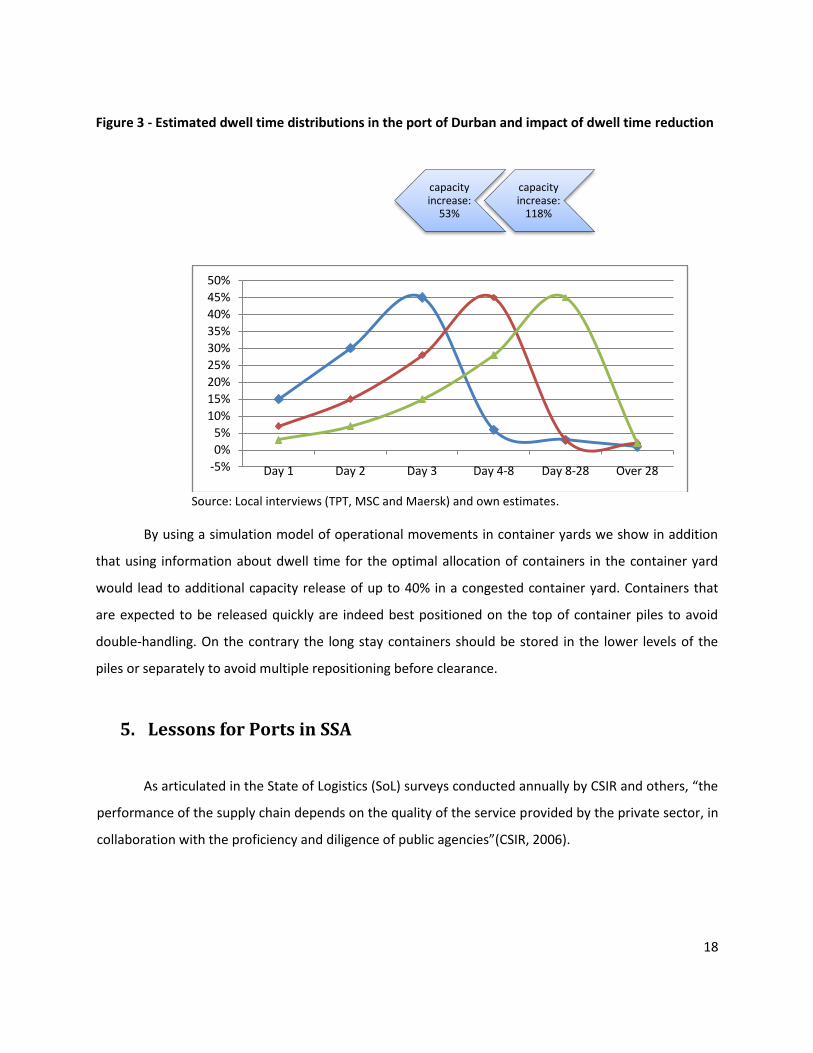
Figure 3 shows the dwell time distributions in three scenarios:
- short dwell time with an average of 3.3 days (blue curve, actual situation);
- medium dwell time with an average of 5 days (red curve); and
- long dwell time with an average of 11 days (green curve).
The impact of dwell time reduction between scenario 3 (green curve) and scenario 2 (red curve)
is very significant: an estimated 118% additional capacity is released in the container terminal. The later
reductions between scenario 2 (red curve) and the current situation (blue curve) is also important: 53%
additional capacity is released. In total, reducing dwell time from scenario 3 to scenario 1 more than
doubles the practical capacity of the container terminal without any investment in physical extensions.
23
Dwell time reduction will have for example a much more sensible impact on a congested terminal for example than in a container terminal with spare capacity.
18
Figure 3 - Estimated dwell time distributions in the port of Durban and impact of dwell time reduction
Source: Local interviews (TPT, MSC and Maersk) and own estimates.
By using a simulation model of operational movements in container yards we show in addition
that using information about dwell time for the optimal allocation of containers in the container yard
would lead to additional capacity release of up to 40% in a congested container yard. Containers that
are expected to be released quickly are indeed best positioned on the top of container piles to avoid
double-handling. On the contrary the long stay containers should be stored in the lower levels of the
piles or separately to avoid multiple repositioning before clearance.
5. Lessons for Ports in SSA
As articulated in the State of Logistics (SoL) surveys conducted annually by CSIR and others, “the
performance of the supply chain depends on the quality of the service provided by the private sector, in
collaboration with the proficiency and diligence of public agencies”(CSIR, 2006).
-5%
0%
5%
10%
15%
20%
25%
30%
35%
40%
45%
50%
Day 1 Day 2 Day 3 Day 4-8 Day 8-28 Over 28
capacity increase:
118%
capacity increase:
53%
19
TPT’s approach, in managing lower levels of occupancy, involves freeing up space and
improving distribution in the terminal concentrating mainly on the enforcement of the 3 days free
storage policy and encouraging cargo operators to remove their goods from the terminal as soon as
possible but within the free storage period. Measures applied include publishing information related to
arrival times of cargo expiry times for free storage period and sending regular reminders via sms to
encourage early collection of cargo. TPT also sought close cooperation with its customers targeting the
large operators, including shipping lines, and transporters, and offering incentives for clearing cargo
early by allocating preferential slots and stacking containers in a batch to facilitate the collection
process.
With most customers able to complete customs clearance procedures within 3 days, the
majority of port users do comply with the 72 hour policy, otherwise the implications for failure to
comply are later reflected in the cash books24, a key issue for the logistics industry regardless of size but
even more so for the South African industry struggling to recover from the global financial fallout.
Within this context, the main lesson for the rest of SSA is that: cargo dwell time is a function of
the characteristics of the private sector BUT the onus is on the public sector (customs, port authority) to
put pressure on private sector port users to make them more efficient (gradually). In South Africa, due
to the increasing importance of manufacturing/assembling industry, which competes worldwide,
Transnet is under severe pressure to perform and improve, not only from the private sector but also
from a government anxious to meet trade policy objectives. Therefore, a virtuous circle is in place as
demonstrated in Figure 4.
24
This does not necessarily mean that prohibitive tariffs has to be replicated in all ports in SSA since if not implemented, it would only lead to increased corruption and would then undermine the current situation.

20
Figure 4: The Virtuous Circle of Cargo Dwell Time
To get a sense of this point, it is important to understand the nature and characteristics of South
Africa’s private sector as it appears to be the main divergence from most countries in Sub-Saharan
Africa. A good place to start is by noting the trading policy of the country which moved from an import
substitution economy to value added manufacturing export in the late 1990s. This change integrated the
countries trade into the global market and more than any other country in Sub-Sahara Africa, South
Africa has strongly diversified export characteristics with a significantly advanced manufacturing
industry making it the most competitive regionally. South Africa’s manufactured export goods serve the
region but largely concentrate on Europe and America. However, from an international trading point of
view, its geographic remoteness from its key markets places a significant amount of pressure on its
global competitiveness.
According to the South African government, the country’s automotive industry is a global, turbo-
charged engine for the manufacture and export of vehicles and components. The sector accounts for
about 10% of South Africa's manufacturing exports and contributes about 7.5% of the country’s GDP25.
Manufacturing in the country is concentrated in the provinces of Gauteng and Kwazulu Natal (KZN). In
KZN alone, 80% of manufacturers export to Europe with most firms involved in both import and export
25
Source: South Africa info, a website developed by the department of trade to provide basic information about the country and a promotion tool for the South African marketing council.

21
(Valodia, 2006). For example most of the auto manufacturers import parts that are used to assemble
vehicles and the finished product is exported back to the key market, in most cases, Europe.
South Africa is also the largest food exporter in Africa and in 2007 the export value of its goods
was $ 4.2 billion (UNCTAD 2009) approximately 2% of GDP. Given its disadvantaged location and a few
other inefficiencies in the manufacturing system, logistics is one of the few key areas were the country
developed as one of the best in the world26 therefore improving the country’s competitiveness.
Another major observation at the Durban Port is that most of the cargo going through the port
is for the domestic market dominated by large companies as cargo owners but also cargo operators.
Transit or over border cargo as they call it, account for a very small share of the total cargo traffic. In
most coastal countries in Africa, these account for a larger proportion of import cargo and most of these
countries a significant proportion of the transiting goods experience problems relating to
documentation and abandoning of the cargo. Most of the big operators in South Africa also have service
level agreements with TPT and they prequalify their clients to ensure legitimacy and to avoid taking
clients with a low or non compliance record.
In the case of South Africa, any form of delay at the port is a major irritation for the
manufacturing industry but even more importantly as expressed by someone in the automotive
industry, they also have huge financial implications for those operating in a competitive environment as
their businesses have to absorb any cost inefficiencies wherever they occur.
For most shippers, hours count. The Citrus Growers‘ Association in South Africa estimates that
delays at the Port of Durban cost its growers US$10.5 million per season (on approximately US$400
million of exports), based on an average delay per load of 12 hours for each of the 20,000 citrus laden
trucks that enter the port during peak season (World Bank, 2011).
It is no surprise that import and export traders have very little tolerance for poor performance
by a state run freight company, neither does the Department of Trade and Industry which has the
responsibility of attracting investments into the country.
In what looks like the key dynamic of the private sector in SA, a Barloworld survey of businesses
involved in manufacturing and logistics, the industry expresses a sense of ownership to the logistics
process. While recognizing that public sector is key to this, they feel that the onus is on them to agitate
and drive the process to see transformation at Transnet (Barloworld Logistics, 2010). The strategy seems
to have contributed to reducing delays at some of the ports in South Africa. Facing internal pressure
26
Logistics Performance Index, 2010.

22
from the trade industry and a Trade Ministry eager to establish the country on the world stage, those
responsible for facilitating trade (Transnet and SARS) had no choice but to transform.
This presents a marked difference between the private sector in South Africa and that of other
African countries studied. With the exception of Kenya, most countries in Sub-Saharan Africa are
characterized by trade dominated by a handful of commodity exports or non time sensitive agricultural
products and very little value-added production, not even for the domestic market. Therefore, most are
largely dependent on imports of goods from China and India. Even then, the markets are generally small
with very little space for more than one large firm as a result, most firms operate monopolies without
any competition and under an extremely weak regulatory environment. For most, as we found in
Cameroon, inefficiencies in the supply chain can be easily passed on to a captive consumer market while
profits remain high. However, at the time when trade diversification has become a motto; without a
more advanced and less rent-seeking private sector, it will be extremely difficult to increase value-added
and then achieve diversification.
6. What Remains to Be Done to Reduce Cargo Dwell Time?
Judging from the reported container dwell time performance, Durban may have successfully
managed to shed its reputation as a congested and inefficient port. Over the last few years, there has
been significant progress in improving the efficiency of DCT but challenges remain, particularly with
regards to labor productivity and port access, all of which have an impact on cargo dwell time.
Increase Labor Productivity Using the number of cranes moves per hour as an indicator, productivity levels at DCT have
been gradually improving over the years increasing from 17 moves per hour to the current 28. However,
a recent study commissioned by the Port Regulator suggests that the current levels are not sufficient to
bring Durban to the performance standards of the world’s best ports. The report shows a comparison of
Durban with five27 other ports in different parts of the world and finds that the port falls short in the
area of productivity, operating at a rate of 23 moves per hour in 2007 while the best port was operating
at a level of 94 moves per hour (Ports Regulator of South Africa, 2010). But it may well be because some
of these ports use much more advanced equipment.
27
Antwerp, Belgium; Klang, Malaysia; Laem Chabang, Thailand; Rotterdam, Netherlands and Santos, Brazil.
23
Given that the port achieves its target of 28 moves per hour, the main issue emerging from the
interviews is the lack of consistency across shifts. It was reported that some shifts perform better than
others, meeting the agreed target of 28 moves per hour while others don’t. Possible reasons for this
inconsistency could be poor supervision or lack of staff motivation. The introduction of performance
contracts tied to an incentive scheme was introduced with the aim of encouraging staff to meet
specified targets daily in order to improve the improve the movements of cargo and to keep terminal
occupancy levels below the specified threshold of 70%. It should also be noted that only 5% of TPT staff
have committed to that level of performance. It is possible that the performance contracts are not
yielding the expected results and in that regard there may be a need to review their design and improve
if necessary.
Stability of port labor was also mentioned as a key concern for stakeholders as it is perceived to
have an impact on operations. The high turnover of management staff is listed ias a major cause of
instability and a desire for this to be reduced was expressed.
However, the greatest irritation seems to stem from the fact that strikes are widespread in
South Africa. In 2010, there was a protracted strike over pay and conditions lasting for almost 3 weeks
starting from 10th to 28th May. The strike effectively closed all port operations and the recovery took
months also evident in the dwell time data presented earlier.
Improve Port Access South Africa’s infrastructure quality is good compared to other SADC countries, and current
investment in infrastructure will ensure that this position is maintained in future. However, one major
inadequacy is the lack of intermodal facilities and integration between transport modes, which needs to
be addressed before South Africa can be seen as a true regional logistics hub (CSIR, 2007).
The port of Durban has good road connections to the extensive national trunk road network but
the access roads in its vicinity suffer from congestion. Mainly due to its location inside the Central
Business District, port traffic is sometimes in conflict with general traffic particularly during commuter
traffic peak hours therefore constraining port access and general movement of traffic.
While road still dominates, rail transport plays a major role in transporting a large bulk of
commodities, with some dedicated services. However turnaround times are still very high. With regards
to access, DCT is linked to 4 rail tracks with rail mounted gantries for loading and unloading. In 2008,
Transnet reported that it handles up to 16 trains per day in and out of the terminal area and this have
increased to 22 over the last few years (Arup (EThekwini Municipality report), 2008).

24
As previously mentioned, most of the cargo at the port of Durban is either destined for or
originates from the main economic areas in Gauteng. With the exception of commodities, a lot of
stuffing and destuffing of containers seems to take place in the Bayhead area28. Bayhead is served by
two rail tracks and road access is through Bayhead Road and South Coast Road. Bayhead Road currently
suffers from congestion mainly from operations located along that road and other city related traffic.
In addition, there are significant space constraints in the Bayhead area and the current
operation is inefficient and exacerbates the conflict between port and other city economic activities. As
mentioned earlier, the result of this conflict is restricted access to the port and increased turnaround
times.
To alleviate the situation, the Ethekwini report recommended the development of an inland
logistical hub, increasing capacity and improving rail turnaround times within the port area. If
implemented, these improvements will improve port access issues resulting from congestion around the
port area.
7. Conclusions and How to Improve Port Competitiveness
Durban enjoys unparalleled dominance in Sub-Saharan Africa from a size and performance
perspective, but TNPA’s aspiration to make Durban globally competitive means the port has to meet the
standards of other international ports such as the ports of Singapore, Rotterdam and others.
The main lessons for Sub-Saharan Africa that can be drawn from the Durban port are that cargo
dwell time is mainly a function of the characteristics of the private sector, but the onus is on public
sector players such as customs and the port authority to put pressure on private sector port users to
better comply and reduce cargo dwell time. Further cargo dwell time reduction is still possible;
however, it will be more difficult than what was the case in the early 2000s.
The level of service has significantly improved in the last decade. However, in order for Durban
to become a worldwide major port, TNPA still has to overcome a few challenges which are crucial for
port competitiveness from a cost perspective i.e. high port costs labor productivity and relatively
inefficient inland transport networks. Some of the issues of concern are already highlighted by the
28
Private sector companies involved in stuffing and destuffing of containers are located in a small area in Bayhead, Shipping and logistics companies and storage areas are located in and around the port area in a haphazard fashion, contributing to road congestion, conflicting with other economic activities.
25
Regulator’s report on the economic review of South African ports29. These issues are not just important
for dwell time. While the port of Durban has seen meaningful improvements over the last few years, the
challenge to address the above mentioned issues still remains.
The South African logistical capacity is as good as any developed country in the world; however,
logistical costs remain high. Cargo dues (berth costs, wharf age) and terminal handling charge, account
for more than 50% of total port costs in South Africa, a proportion far greater than at any other port in
the list (see Annex 5).
The issue of port dues is a major concern in the country, an aspect that is also raised in the
regulator’s report. According to TNPA, Cargo dues on all commodities, articles, things or containers (full
or empty) are levied at all ports belonging to or controlled and managed by Transnet. Cargo dues are
charged to recover the cargo contribution towards port infrastructure (TNPA, 2007).
It is noted that 70% of the port authorities’ income is derived from port charges and NEDLAC’s
view is that Transnet’s port charges are strategic and have characteristics of non-port financial
objectives. With the LPI showing that more than 50% of SA port users perceive charges to be high/very
high, clearly Transnet needs to pay attention to the issue in order to attract customers.
Among other things, the issue of transparency of port charges30 is an important factor to port
users (NEDLAC, 2007). Historically, Transnet has been perceived to be lacking in transparency and this
creates unnecessary suspicion from its customers and the public in general. Given the existing concerns
about cargo dues, improving transparency will by no means improve efficiency but it will change the
existing perception of foul play and therefore increase stakeholder confidence but also help in attracting
investors.
In summary, cargo dwell time is relatively close to international standards in Durban but certain
issues remain to make Durban fully competitive worldwide, such as reduced cargo dues (in order to
avoid excessive investments in infrastructure and equipment).
29
In Annex 5, a diagram shows a list of some of the most important factors for port competitiveness. 30 The NEDLAC report sought to examine administered prices in port services and port operations and it states that
limited access to information was a major problem for that particular study noting concluding that there is low trust and frustration between the players in the port system. It therefore recommends that price and performance indicators be collected and made public by the Department of Transport for the purposes of establishing an information basis for monitoring the South African waterfront. This is particularly problematic as there is a general sense that Transnet cargo dues are set to target revenues for the holding company.

26
However, labor, energy, tax regulations, etc. may be of even more importance for a firm to be
competitive worldwide, and Durban port should not be blamed for the lack of competitiveness of South
African firms.
27
Bibliography
Arup, Arcus Gibb (2008), Freight Logistics Hub Project: Durban Inland Intermodal and Logistics Hub,
Ethekwini Municipality.
Arvis, J.F., Raballand, G. and Marteau, J.F. (2010), The Cost of Being Landlocked: Logistics Costs and
Supply Chain Reliability, Washington, D.C.: World Bank.
Barloworld Logistics (2010), Supply Chain Foresight, Growth in Adversity: Resilience & Recovery through
Innovation.
Chasomeris, M. (2003), “South Africa’s Sea Transport Costs and Port Policy in a Global Context”, Africana
Bulletin Nr 51.
CSIR, Stellenbosch University, Imperial Logistics (2007), 4th Annual State of Logistics Survey for South
Africa 2006: Logistics for regional growth and development, Council for for Scientific and Industrial
Research.
CSIR, Stellenbosch University, Imperial Logistics (2010), 7th Annual State of Logistics Survey for South
Africa 2010: Value creation towards global competitveness and sustainability, Council for for Scientific
and Industrial Research.
Hummels, David (2001), “Time as a Trade Barrier”, GTAP Working paper 18, available at
http://docs.lib.purdue.edu/gtapwp/18.
Krugell, W. and Matthee, M. (2009), “Measuring the Export Capability of South African Regions”,
Development Southern Africa, Vol. 26, No. 3.
NEDLAC (2007), Prices Study on Economic Inputs: Ports Sector, Trade and Industry Chamber, Fund for
Research into Industrial Development Growth and Equity (FRIDGE), National Economic Development
and Labour Council.
TNPA (2009), Port Tariffs: Seventh Edition : Tariff book April 2009 – March 2010, Transnet National Ports
Authority.
Ocean Shipping Consultants (2008), Africa Infrastructure Country Diagnostic: Beyond the Bottlenecks:
Ports in Sub Saharan Africa, Background Paper 8, Washington, D.C.: World Bank.
Raven, J. (2000), “Trade and Transportation Facilitation: An Audit methodology”, Washington, D.C.:
World Bank.
Refas, S. and Cantens, T. (2011), “Why Does Cargo Spend Weeks in African Ports? The Case of Douala,
Cameroon?”, World Bank Policy Research Working Paper No. 5565, Washington DC: World Bank.

28
SARS (2010), “The SARS Modernisation Journey”, Presentation by the Commissioner: Oupa Magashule,
South African Revenue Services.
Transnet (2009), Transnet Limited: Annual report 2009.
UNCTAD (2009), Review of Maritime Transport 2009, New York and Geneva : United Nations Conference
on Trade and Development.
URBAN-ECON: Development Economists Consortium (2010), Economic Review of Participation in Ports
Operation and Services in South Africa, Ports Regulator of South Africa.
Valodia, I. and Velia, M. (2006), “Macro–Micro Linkages in Trade: Trade, Efficiency and Competitiveness
of Manufacturing Firms in Durban, South Africa”, Journal of African Economies, Volume 15 (4), pp. 688–
721.
World Bank (2010), Connecting to Compete 2010: Trade Logistics in the Global Economy. Washington,
D.C.: World Bank.
World Bank (2011), Harnessing Regional Integration for Trade and Growth in Southern Africa,
Washington, D.C.: World Bank.
Yeo, G.T., Roe, M. and Dinwoodie, J. (2008), “Evaluating Competitiveness of Container Ports in China and
Korea”, Transportation Research Part A 42 (2008) 910–921.

29
Annex 1: Trading Routes
Main International Shipping lanes through Africa31
31
UNCTAD, 2009

30
Export Trading Routes: South Africa32
Annex 2: Total Port Traffic – Eastern and Southern Africa (Metric Tons 000)
Country 2005 2006 2007 2008 2009
South Africa 173 555 179 984 183 353 185 079 182 735
Kenya 12 978 14 101 15 536 15 996 18 957
Mozambique 6 321 6505 6571 7426 7 994
Namibia 3 131 3 603 4 236 4 690 No data
Tanzania 5 572 6 020 6 690 6 732 7 353
Annex 3: Aerial View of the Port of Durban 33
32
TPT 33
Source : Transnet Port Terminals
Terminal Entrance
Rail Terminal
ITZ 205
ITZ 109
ITZ 202
Stacking Area
North Quay 203,204,205
South Quay 108,109 East Quay
200, 202

31
Annex 4: Container Terminal Facilities
Berth Data
Entrance draft Area Berth (m) Draft (m) Length (m)
16.4
100 8.2 276
101 11.6 229
102 11.7 213
103 11.9 235
DCT 104 11.6 351
105 11.9 235
106 11.5 213
107 11.7 238
Cross berth
108 11.6 273
109 11.8 272
201 11.9 216
202 12.3 216
New Pier 1 203 11.8 305
204 11.5 305
205 11.7 305

32
Annex 5: Structure for evaluating container port competitiveness in Korea and China
Source: Gi-Tae Yeo et al, 2008
Prompt response
24 hour/ 7 days a week service
Zero waiting time service
Professionals and skilled labor in port
operation
Size and activity of FTZ in port hinterland
Volume of total container cargos
Availability of vessel berth on arrival in
port
Port congestion
Water depth in approach channel at
berth
Sophisticated level of port information
& its application scope
Stability of port's labour
Inland transportation cost
Cost related vessel and cargo entering
Free dwell time on the terminal
Port accessibility
Deviation from main trunk routes
Land distance and connectivity to major
shippers
Efficient inland transport network
Regional
Center
Connectivity
Port
Competitiveness
Port Service
Hinterland
Condition
Availability
Convenience
Logistic Cost

33
Annex 6: Total port and handling costs per TEU (USD)
Source: NEDLAC, 2007