how t o l ead t he p ack: r unning p ower m eters & quality ... t o l ead t he p ack: r unning p...
TRANSCRIPT

How to Lead the Pack: Running Power Meters &
Quality Data
The Stryd Team
1. Introduction
Runners need quality training and guidance to succeed in their next race. Many runners
struggle to find a repeatable and reliable way to attain high quality training and racing. Everyday
there are questions that need correct answers: When should I run next? How hard should I run?
Stryd answers these questions with a metric new to the running world: power. But how accurate
is running power?
Power plays an essential role in helping cyclists achieve peak performance. Specifically, the
strong correlation between power and metabolic expenditure enables cyclists to accurate
quantify their cardiovascular capability, aerobic-anaerobic fitness, as well as the metabolic
intensity/load of each workout. For instance, functional threshold power is a direct measure of
the lactic threshold of the athlete. Stryd strives to achieve the same goal, by providing a power
metric that tracks the metabolic intensity/load for running.
This white paper evaluates the accuracy of the Stryd's measurement of running power, ground
time, and vertical oscillation, by comparing it with a lab grade force plate-based treadmill and a
metabolic measurement system. This paper delivers the following information:
1. Stryd measures the ground time with 97.17% accuracy.
2. Stryd measures the vertical oscillation with 96.82% accuracy.
3. Stryd estimates the force profile with 95% accuracy.
4. Stryd power has a 96% correlation with metabolic energy expenditure (VO2).
2. Protocol
We designed the testing protocol with the following goals and constraints in mind:
1. Measuring accuracy over a wide range of running speeds.
2. Evaluating on several runners to determine whether accuracy is maintained in the
presence of variation in form, physiology, and condition.
Stryd has conducted multiple tests verifying power and other Stryd metrics over the past 2
years. These tests have utilized the following equipment:
● Stryd power meter, publically available wearable technology
● AMTI force-sensing side by side treadmill, with +/- 0.2 % full scale output for linearity and
+/- 0.2 % full scale output for hysteresis
● TuffTread treadmill, designed to handle up to 700lb user weights and maintain speed on
runner impact. Force sensors mounted on the base of the treadmill to precisely measure
ground reaction forces, with +/- 0.03 % full scale output for linearity and +/- 0.03 % full
scale output for hysteresis
● Parvo Medics’ TrueOne® 2400, a compact, integrated metabolic measurement system
for cardiopulmonary stress testing, indirect calorimetry, and maximal O2 consumption
measurement. It supports up to 800 liters/minutes flow rate with accuracy of +/- 2% with
Precision “Yeh” Algorithm

Procedure:
For force testing, 13 different runners, ranging from sub-elite to recreational level, ran at 8
different speeds for 90 seconds. The speed of the treadmill started at 8.0 km/h and increased by
1.6 km/h per test. The final speed was 19.2 km/h.
For metabolic testing, 9 different runners, ranging from sub-elite to recreational level, ran at 8
different speeds for 3 minutes to establish a metabolic steady state. The speed started at 8.0
km/h and increased by 2.0 km/h per test. The final speed was 20.0 km/h.
3. Comparison
Running Power
Background
Running requires three dimensional motions. Your body moves forward, oscillates vertically,
and rotates side-to-side every step. All these movements require mechanical work. The forward
and vertical movements accounts for most of the mechanical work in this system.
Running is a cyclic activity. A cyclic activity means for constant-speed running, the net
mechanical work done in a complete running cycle is close to zero. Yet, there is obvious
metabolic energy expenditure (VO2) involved, indicating that the body is doing work. A part of
the external mechanical work is the work the environment applies against you (e.g., gravity pulls
you down or the ground resistance slows you). The work done by the environment is the
negative part of the external mechanical work. The other part of the external mechanical work is

the work your body does against the environment (e.g., the take-off push to lift your body).
Runner-applied work is the positive part of the external mechanical work.
There is no external force that adds positive power to the runner in this activity, and the positive
part of the external mechanical work is directly correlated with the metabolic energy expenditure
(VO2). Stryd measures (FIGURE 1) this part of the external mechanical work.

FIGURE 1. Metabolic energy expenditure of a runner in terms of mechanical energy and
thermal energy.
The forward and vertical motion accounts for most of the mechanical work in this system.
Forward movements can be quantified by the variation of kinetic energy at every instant in the
step cycle. The variations are found in the accelerations in the forward direction. Vertical
movements can be quantified by the variation of potential energy at every instant in the step
cycle. These variations are calculated from the vertical displacements of the center of mass.
The measurements of forward movements and vertical movements give us kinetic energy and
potential energy variations.
No device exists that measures “energy” and “power” directly; even cycling lacks this device.
Cycling power meters monitor the force applied to the pedal by the cyclist's foot. Then, the
power meter calculates the power based on the magnitude and direction of the applied force
and the angular velocity of the crank. Power is calculated differently in running, although similar
principles apply. A running power meter must calculate force accurately. The measurement of
forward power, a function of forward force, and, vertical power, a function of vertical force, must
be accurate in order to successfully calculate running power.
We first evaluate the accuracies of Stryd’s estimate of the horizontal & vertical forces. Then, we
correlate the power value with metabolic cost; thus, closing the loop to show the accuracy and
consistency of Stryd’s measurement.

Verification Results
Forward force
Forward force, along with forward speed, determines the change in kinetic energy. A runner in
motion has forward momentum, which changes within each step. The runner gains momentum
during take-off, and the runner loses momentum on foot impact (FIGURE 2).
FIGURE 2. A forward force profile from a force plate treadmill. Area A1 represents the
momentum lost. Area A2 represents the momentum gained as a result of the applied force.
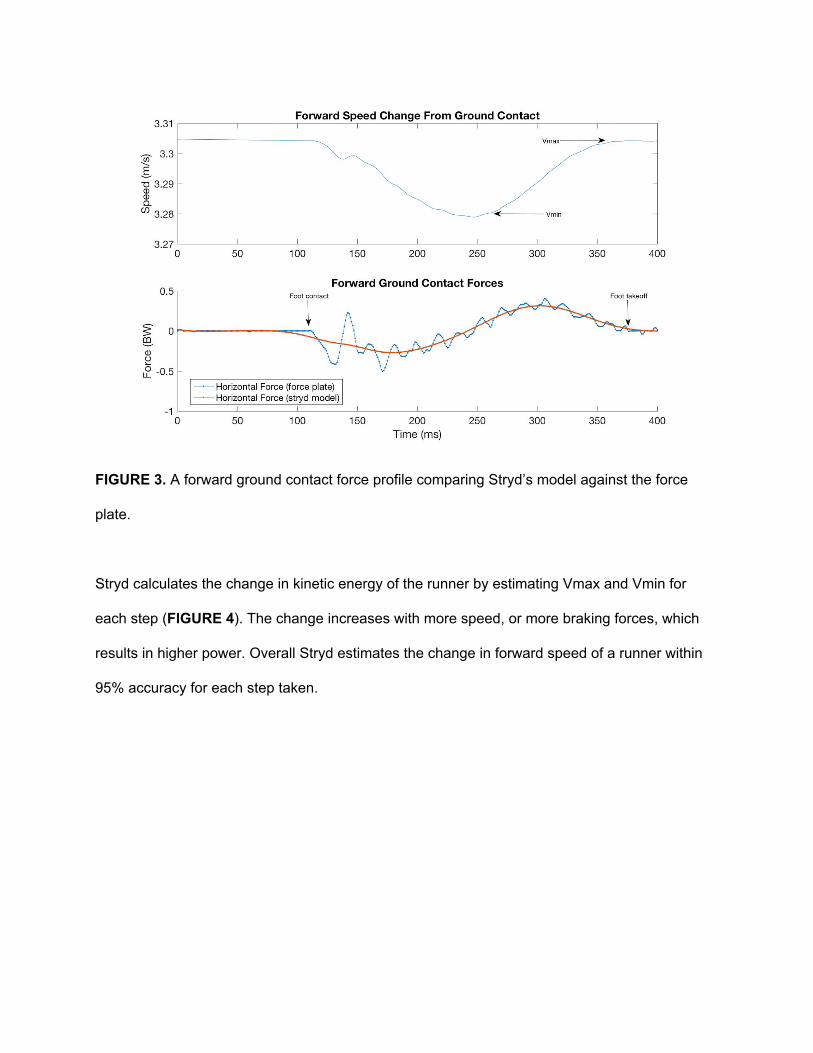
FIGURE 3. A forward ground contact force profile comparing Stryd’s model against the force
plate.
Stryd calculates the change in kinetic energy of the runner by estimating Vmax and Vmin for
each step (FIGURE 4). The change increases with more speed, or more braking forces, which
results in higher power. Overall Stryd estimates the change in forward speed of a runner within
95% accuracy for each step taken.

FIGURE 4. Stryd estimates the change in forward speed of a runner within 95% accuracy for
each step taken.
Vertical force
Runners lift their center of mass every step. This lifting process is negative work against gravity,
and this work is converted into potential energy. Potential energy is calculated from the vertical
displacement of the body’s center of mass.
Vertical displacement is fully reconstructed through the vertical component of the ground
reaction force. FIGURE 5 shows a typical ground reaction force profile on the vertical dimension

from the force plate treadmill. Additionally, you will see Stryd’s ground reaction force profile
overlayed on the force plate measurement.
FIGURE 5. A vertical ground reaction forces comparing Stryd’s model against the force plate.
Overall Stryd estimates the force profile with 95% accuracy.
Power vs Metabolic cost
The external mechanical power reported by Stryd has a well established relationship with
metabolic expenditure based on testing conducted by Stryd and other third party research
teams. FIGURE 6 shows the correlation between power and metabolic cost based on the data
collected from Stryd testing. Power (in watts/kg) is highly correlated (r^2 = 0.96) with metabolic
cost (VO2 in ml/kg/min). High correlation means Stryd is an accurate, reliable device to provide

real-time metabolic cost estimation in the real world. Metabolic cost estimation allows for an
objective view on current running performance. Athletes can use Stryd’s daily power value to
precisely gauge their training and racing efforts for effectiveness.
FIGURE 6. A metabolic cost (VO2 in ml/kg/min) vs. power (in Watt/kg) comparison. Stryd power
is 96% correlated with metabolic energy expenditure.
For results from a third party research team, please reference this source. Van Dijk and Van
Megen find that Stryd can provide sufficient VO2 measurements in substitution of a VO2max
test in a physiological laboratory.

All related tests using Stryd show a consistent metabolic efficiency range (GME) for running.
GME (Gross Metabolic Efficiency), is defined as
ME (%) Mechanical energy / Metabolic energy 100G = ×
The test data show that the power values reported by Stryd fall into 22% - 26% range of
metabolic cost across the different speeds. This GME range aligns with most academic
research results [1, 4, 5, 8, 9, 10]. The maximum efficiency of human muscles (positive work,
isometric contractions) is widely put around 25% in physiological textbooks and literature. This
efficiency is composed of 2 factors: the metabolic efficiency of the ATP-ADP cycle in the muscle
cells (this is around 39%) [3] and the work efficiency of the muscles (which depends on the type
of work and muscle actions, with a maximum around 65%) [2, 6, 7]. Therefore, the maximum
value for the total GME in running is
9% 65% 25%3 × =
The maximum efficiency of around 25% can be approached by elite runners because most of
the work they do is positive, and the muscles are primarily doing isometric contractions.
The power value purported by other products on the market implies GME.0%> 4
Ground Time
Background

Ground time is a measurement of how long a runner maintains physical contact with the ground
when running. This metric is measured in milliseconds. Ground times are important because
they are connected to a runner’s ability to apply power to the ground.
Results
Stryd’s ground time can be directly compared against the force plate ground time. The following
graph (FIGURE 7) clusters Stryd data against the data from the force sensor.
FIGURE 7. Stryd’s ground contact time (seconds) vs force plate ground contact time (seconds)
comparison. Average magnitude error: 2.83%
Vertical Oscillation
Background
Vertical oscillation is the change of the center of mass of the body when running. Center of
mass is a simple concept that can be demonstrated with household objects. Grab a nearby pen
and balance it on your finger. This balance point is the center of mass. The center of mass of a
non-rigid object will change as that object moves. Remove the cap from the pen and try to
balance the pen again. You will notice that the balance point has moved; thus, the center of
mass has changed.
A force plate can measure the ground truth vertical oscillation of the center of mass from the
vertical force profile during ground contact. Through Newton’s second law that force = mass *
acceleration, we then know the acceleration of the center of mass. From this acceleration and
knowing gravity you can subsequently derive velocity and position of the center of mass via
integration. Stryd uses similar approach to measure the vertical oscillation of the center of mass.
Why Center of Mass Measurement Instead of Torso Measurement?
Some technologies measure the vertical movement of the torso. Vertical movements measures
a single point on the body that is loosely connected from the center of mass. Other companies’
run dynamic pods measure vertical movement.
Stryd determines vertical oscillation at the center of mass. Comparing to the vertical movement
of the torso, center of mass measurement has the following advantages:
1. Comparable across runners. Let’s compare a fat runner and a lean runner. The fat
runner’s torso will oscillate more due to excessive fatty skin movement. The shorter
runner’s torso will oscillate less due to having less fat. However, the runners may have
very similar center of mass measurements. Center of mass makes vertical oscillations
more comparable across different runners.
2. Applies in physics. It is best to understand the center of mass of the body instead of an
arbitrary point on the body. This allows measurements of exact energy expenditure.
These benefits are important and indicate that the center of mass measurement has a firm
backing in science. Additionally, center of mass measurements allow for a more complete
understanding of energy expenditure and forces.
Results

FIGURE 8. Stryd’s vertical oscillation (centimeters) vs force plate vertical oscillation
(centimeters) comparison. Average magnitude error: 3.18%
Stryd’s modeled vertical ground reaction forces allow for an accurate measurement of vertical
oscillation of the center of mass across a wide range of different runners.
4. Final Remarks
Stryd delivers precise measurements. The technology produces data within 5% of those from
force sensor in a laboratory. Runners can use the Stryd power meter to measure their power,
ground time, and vertical oscillation. This works in the lab and outside the lab with a low cost
wearable sensor. With great confidence, Stryd's power measurements will enhance the quality
of running.
References
1. Aagaard P, Ball D, Bangsbo J, Ferguson R, Hellsten Y, Kjaer M, Krustrup P, Sargeant A.
(2001). Muscle oxygen uptake and energy turnover during dynamic exercise at different
contraction frequencies in humans. The Journal of Psychology.
https://www.ncbi.nlm.nih.gov/pmc/articles/PMC2278838/.
2. Barclay C, Loiselle D, Smith N. (2005). The efficiency of muscle contraction. Progress in
Biophysics and Molecular Biology.
http://www.sciencedirect.com/science/article/pii/S0079610703001081.
3. Beals M, Gross L, Harrell S. (1999). Efficiency of ATP production.
http://www.tiem.utk.edu/~gross/bioed/webmodules/ATPEfficiency.htm.
4. Brooks G, Gaesser G. (1975). Muscular efficiency during steady-rate exercise: effects of
speed and work rate. Journal of Applied Physiology.
https://www.researchgate.net/profile/George_Brooks/publication/22014772_Muscular_ef
ficiency_during_steady-rate_exercise_effects_of_speed_and_work_rate/links/02e7e531
d20463170e000000.pdf.
5. Carter H, Hopker J, Jobson S, Passfield L. (2010). Cycling efficiency in trained male and
female competitive cyclists. Journal of Sports Science and Medicine.
http://www.jssm.org/vol9/n2/24/v9n2-24text.php.
6. Cavagna G, Margaria S. (1964). Mechanical work in running. Journal of Applied
Physiology. http://jap.physiology.org/content/19/2/249.short.
7. Cavagna G, Kaneko M. (1976). Mechanical work and efficiency in level walking and
running. J. Physiol.
https://www.ncbi.nlm.nih.gov/pmc/articles/PMC1283673/pdf/jphysiol00809-0192.pdf.
8. Coyle E, Sidossis L. (1992). Load and velocity of contraction influence gross and delta
mechanical efficiency. International Journal of Sports Medicine.
https://www.researchgate.net/profile/Labros_Sidossis/publication/21633682_Load_and_
Velocity_of_Contraction_Influence_Gross_and_Delta_Mechanical_Efficiency/links/0a85
e532a399c7a83f000000/Load-and-Velocity-of-Contraction-Influence-Gross-and-Delta-M
echanical-Efficiency.pdf.
9. Coyle E, Sidossis L. (1994). High efficiency of type 1 muscle fibers improves
performance. International Journal of Sports Medicine.
https://www.researchgate.net/profile/Labros_Sidossis/publication/15192974_High_Efficie
ncy_of_Type_I_Muscle_Fibers_Improves_Performance/links/00b49532a39f0e92290000
00/High-Efficiency-of-Type-I-Muscle-Fibers-Improves-Performance.pdf.
10. Kaneko M. (1990). Mechanics and energetics in running with special reference to
efficiency. Journal of Biomechanics.
http://www.sciencedirect.com/science/article/pii/002192909090041Z.