people flow modelling - loughborough university · people flow modelling - ... experience advising...
TRANSCRIPT
People Flow Modelling - Benefits and Applications
within Industry
David Brocklehurst
Buro Happold Ltd 2 Brewery Place Brewery Wharf Leeds LS10 1NE
Centre for Innovative and Collaborative Engineering (CICE) Department of Civil & Building Engineering Loughborough University Loughborough Leics, LE11 3TU

Thesis Access Form Copy No ……………………………… Location……………………………… Author David Brocklehurst Title People Flow Modelling - Benefits and Applications within Industry Status of access [OPEN / RESTRICTED / CONFIDENTIAL] Moratorium period: ………………years, ending ……………… / 200……………… Conditions of access proved by (CAPITALS): ……………………………………………………… Director of Research (Signature) ……………………………………………………………… Department of Department of Civil and Building Engineering Author's Declaration: I agree the following conditions: OPEN access work shall be made available (in the University and externally) and reproduced as necessary at the discretion of the University Librarian or Head of Department. It may also be copied by the British Library in microfilm or other form for supply to requesting libraries or individuals, subject to an indication of intended use for non-publishing purposes in the following form, placed on the copy and on any covering document or label. The statement itself shall apply to ALL copies: This copy has been supplied on the understanding that it is copyright material and that no quotation from the thesis may be published without proper acknowledgement. Restricted/confidential work: All access and any photocopying shall be strictly subject to written permission from the University Head of Department and any external sponsor, if any. Author's signature ……………………………… Date ………………………
Users declaration: for signature during any Moratorium period (Not Open work): I undertake to uphold the above conditions:
Date Name (CAPITALS) Signature Address

Certificate of Originality This is to certify that I am responsible for the work submitted in this thesis, that the original work is my own except as specified in acknowledgments or in footnotes, and that neither the thesis nor the original work contained therein has been submitted to this or any other institution for a higher degree. Author's signature ……………………………………………………………… Date ………………………


PEOPLE FLOW MODELLING - BENEFITS,
KNOWLEDGE, AND APPLICATIONS WITHIN INDUSTRY
By David Brocklehurst
A thesis submitted in partial fulfilment of the requirements for the award of the degree Doctor of Engineering (EngD), at Loughborough University
November 2005
© by David Brocklehurst 2005
Buro Happold Ltd 2 Brewery Place Brewery Wharf Leeds LS10 1NE
Centre for Innovative and Collaborative Engineering (CICE) Department of Civil & Building Engineering Loughborough University Loughborough Leics, LE11 3TU

People Flow Modelling - Benefits, Knowledge, and Applications within Industry
ii
ACKNOWLEDGEMENTS
My thanks firstly go to Buro Happold Ltd for sponsoring this Engineering Doctorate and providing the opportunity of applied research in an interesting and challenging field. Out of the people who have provided significant support during the research, I would like to especially thank Dino Bouchlaghem (Loughborough University) for his continual encouragement and positive attitude, Kathryn Campbell for her invaluable and continual help with information/support and Keith Still whose advice was extremely useful. Special mention also goes to my family, together with Helen and Christina for their continual love and friendship.
iii
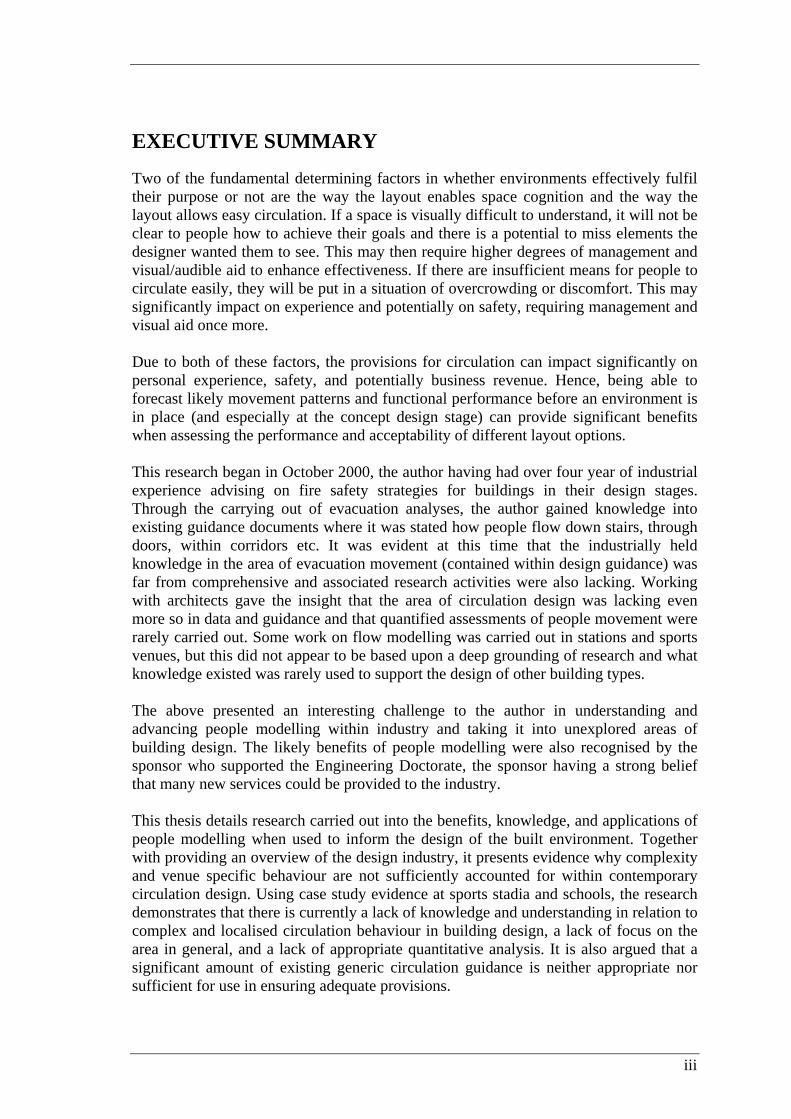
EXECUTIVE SUMMARY
Two of the fundamental determining factors in whether environments effectively fulfil their purpose or not are the way the layout enables space cognition and the way the layout allows easy circulation. If a space is visually difficult to understand, it will not be clear to people how to achieve their goals and there is a potential to miss elements the designer wanted them to see. This may then require higher degrees of management and visual/audible aid to enhance effectiveness. If there are insufficient means for people to circulate easily, they will be put in a situation of overcrowding or discomfort. This may significantly impact on experience and potentially on safety, requiring management and visual aid once more. Due to both of these factors, the provisions for circulation can impact significantly on personal experience, safety, and potentially business revenue. Hence, being able to forecast likely movement patterns and functional performance before an environment is in place (and especially at the concept design stage) can provide significant benefits when assessing the performance and acceptability of different layout options. This research began in October 2000, the author having had over four year of industrial experience advising on fire safety strategies for buildings in their design stages. Through the carrying out of evacuation analyses, the author gained knowledge into existing guidance documents where it was stated how people flow down stairs, through doors, within corridors etc. It was evident at this time that the industrially held knowledge in the area of evacuation movement (contained within design guidance) was far from comprehensive and associated research activities were also lacking. Working with architects gave the insight that the area of circulation design was lacking even more so in data and guidance and that quantified assessments of people movement were rarely carried out. Some work on flow modelling was carried out in stations and sports venues, but this did not appear to be based upon a deep grounding of research and what knowledge existed was rarely used to support the design of other building types. The above presented an interesting challenge to the author in understanding and advancing people modelling within industry and taking it into unexplored areas of building design. The likely benefits of people modelling were also recognised by the sponsor who supported the Engineering Doctorate, the sponsor having a strong belief that many new services could be provided to the industry. This thesis details research carried out into the benefits, knowledge, and applications of people modelling when used to inform the design of the built environment. Together with providing an overview of the design industry, it presents evidence why complexity and venue specific behaviour are not sufficiently accounted for within contemporary circulation design. Using case study evidence at sports stadia and schools, the research demonstrates that there is currently a lack of knowledge and understanding in relation to complex and localised circulation behaviour in building design, a lack of focus on the area in general, and a lack of appropriate quantitative analysis. It is also argued that a significant amount of existing generic circulation guidance is neither appropriate nor sufficient for use in ensuring adequate provisions.

People Flow Modelling - Benefits, Knowledge, and Applications within Industry
iv
From this basis, the research makes a number of significant advances in the understanding of people flow behaviour within circulation spaces, both on a local and complex level, and provides recommendations to industry of what issues to consider; focussing in this case on stadia and schools, but with the principles being generic and applicable to other building types. New methods for considering circulation space design are proposed, together with new data for use by industry. Combining local and complex issues, the research also provides a new and tested methodology for assessing the design of secondary schools. All of the advances in understanding, together with the new methodology, are shown to be practical on a number of live project applications.

v
KEY WORDS School Design Building Bulletin 98 Stadium Design Guide to Safety at Sports Grounds Green Guide Crowd Modelling Circulation Modelling People Modelling Levels of Service Crowd Dynamics

People Flow Modelling - Benefits, Knowledge, and Applications within Industry
vi
TABLE OF CONTENTS
Acknowledgements ...........................................................................................................ii EXECUTIVE SUMMARY............................................................................................. iii Key Words.........................................................................................................................v Table of Contents .............................................................................................................vi List of Figures ............................................................................................................... viii List of Tables....................................................................................................................ix List of Equations ...............................................................................................................x 1 Introduction..........................................................................................................11 1.1 Background to the Research ................................................................................11 1.2 The Context of the Research................................................................................11
1.2.1 The Industrial Sponsor ...........................................................................11 1.2.2 Research Focus.......................................................................................12
1.3 The Overarching Aim ..........................................................................................12 1.3.1 The Individual Objectives ......................................................................12
1.4 Justification ..........................................................................................................13 1.5 Thesis Structure ...................................................................................................14 2 Related Work .......................................................................................................15 2.1 Review of Previous Research ..............................................................................15
2.1.1 Racecourse Related Research.................................................................15 2.1.2 School Related Research........................................................................15 2.1.3 Miscellaneous Research .........................................................................16
2.2 Specialist Software...............................................................................................27 2.3 Novelty of this research .......................................................................................28 3 Research Methodology ........................................................................................30 3.1 Methodologies for Consideration ........................................................................30 3.2 Methodological Considerations ...........................................................................31 3.3 Methodology Development .................................................................................32
3.3.1 Preliminary Work...................................................................................32 3.3.2 Focus areas within methodology............................................................34
4 Research undertaken ............................................................................................38 4.1 Industry Review...................................................................................................38
4.1.1 Questionnaires to Consultants................................................................38 4.1.2 Interviews of Specialist Sector Consultants ...........................................39 4.1.3 Consultancy Experience.........................................................................41
4.2 Stadium Review (i) ..............................................................................................42 4.2.1 Turnstile/Entrance Performance (Ascot & York Racecourse)...............42 4.2.2 Egress Routes from Viewing (Ascot Racecourse) .................................46 4.2.3 End-of-Day Egress Routes .....................................................................48
4.3 Stadium Review (ii) .............................................................................................49 4.4 Schools Modelling ...............................................................................................49 4.5 Application of Knowledge...................................................................................50
4.5.1 Stadia Design..........................................................................................50 4.5.2 School Design ........................................................................................53
5 key Findings & Implications................................................................................57 5.1 The Key Findings of the Research.......................................................................57
5.1.1 Stadium Review (i).................................................................................57

vii
5.1.2 Stadium Review (ii) ............................................................................... 58 5.1.3 Schools Modelling ................................................................................. 58
5.2 The Contribution to Existing Theory or Practice ................................................ 59 5.3 The Implications/Impact on the Sponsor............................................................. 61 5.4 The Implications/Impact on Wider Industry ....................................................... 61 5.5 Conclusions and Recommendations for Industry/Further Research ................... 62
5.5.1 Conclusions............................................................................................ 62 5.5.2 Recommendations for Industry.............................................................. 63 5.5.3 Recommendations for Further Research................................................ 65
5.6 Critical Evaluation of the Research (Limitations)............................................... 66 6 References ........................................................................................................... 67 Appendix A Paper 1: .................................................................................................. 71 Appendix B Paper 2 ................................................................................................... 83 Appendix C Paper 3 ................................................................................................. 107 Appendix D Paper 4 ................................................................................................. 115
People Flow Modelling - Benefits, Knowledge, and Applications within Industry
viii
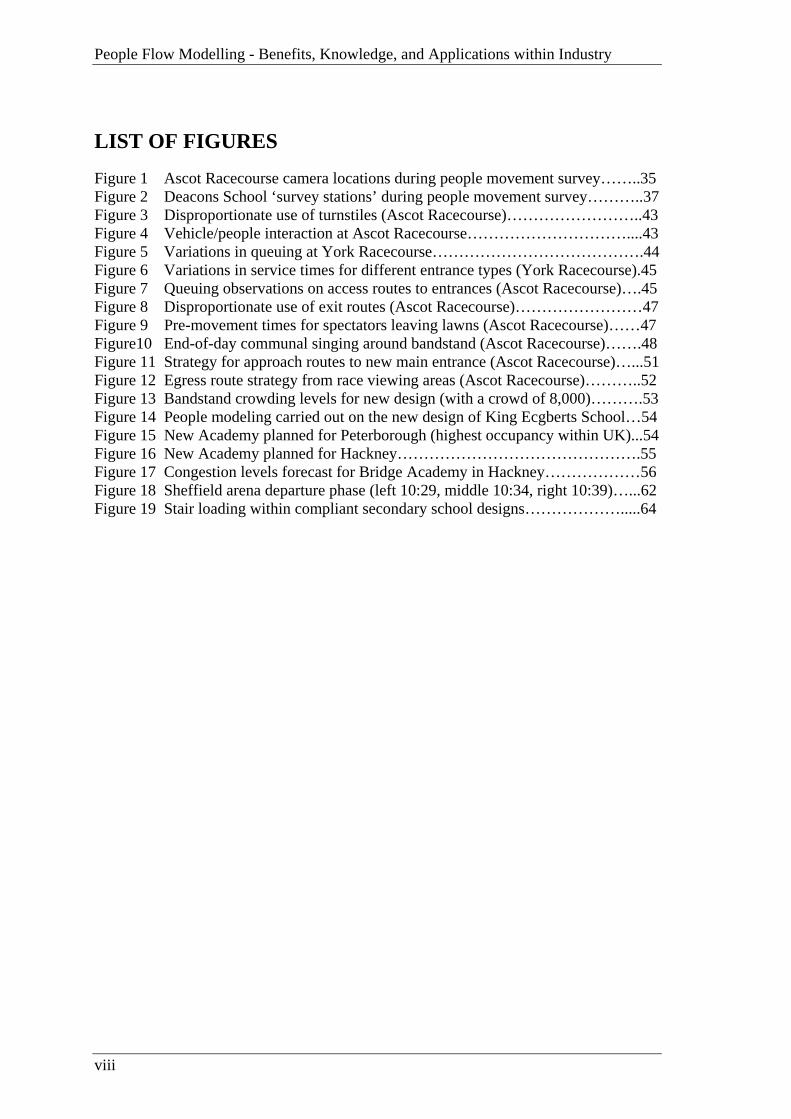
LIST OF FIGURES
Figure 1 Ascot Racecourse camera locations during people movement survey……..35 Figure 2 Deacons School ‘survey stations’ during people movement survey………..37 Figure 3 Disproportionate use of turnstiles (Ascot Racecourse)……………………..43 Figure 4 Vehicle/people interaction at Ascot Racecourse…………………………....43 Figure 5 Variations in queuing at York Racecourse………………………………….44 Figure 6 Variations in service times for different entrance types (York Racecourse).45 Figure 7 Queuing observations on access routes to entrances (Ascot Racecourse)….45 Figure 8 Disproportionate use of exit routes (Ascot Racecourse)……………………47 Figure 9 Pre-movement times for spectators leaving lawns (Ascot Racecourse)……47 Figure10 End-of-day communal singing around bandstand (Ascot Racecourse)…….48 Figure 11 Strategy for approach routes to new main entrance (Ascot Racecourse)…...51 Figure 12 Egress route strategy from race viewing areas (Ascot Racecourse)………..52 Figure 13 Bandstand crowding levels for new design (with a crowd of 8,000)……….53 Figure 14 People modeling carried out on the new design of King Ecgberts School…54 Figure 15 New Academy planned for Peterborough (highest occupancy within UK)...54 Figure 16 New Academy planned for Hackney……………………………………….55 Figure 17 Congestion levels forecast for Bridge Academy in Hackney………………56 Figure 18 Sheffield arena departure phase (left 10:29, middle 10:34, right 10:39)…...62 Figure 19 Stair loading within compliant secondary school designs……………….....64

ix
LIST OF TABLES
Table 1. Project opportunities enabled by the sponsor (Buro Happold Ltd)...……….12 Table 2. Free speeds (stairs) and the impact of age, gender, and geometry….………17 Table 3. Free speeds (level ground) and the impact of age, gender, and geometry….19 Table 4. Flow rates (stairs) and the impact of geometry……………………………..23 Table 5. Flow performance (stairs) and the impact of geometry…………………….23 Table 6. Flow rates, speeds and densities (stairs) in rail stations…………………….26 Table 7. Responses to questionnaires on industry use of circulation analysis.………38 Table 8. Provisions and influences considered in Stadium Review (i)..……………..42 Table 9. Variations in service times for different entrance types (York Racecourse)..44 Table 10. End-of-day communal singing around bandstand (Ascot Racecourse)……..48

People Flow Modelling - Benefits, Knowledge, and Applications within Industry
x
LIST OF EQUATIONS
Equation 1 Standard flow rate equation…………………………………………21
Introduction
11
1 INTRODUCTION
1.1 BACKGROUND TO THE RESEARCH
Within the design of any building, there is a requirement for designers to understand the intended purposes of the building and the elements that influence performance. These elements can be as tangible as providing a lecture hall within a university or relatively intangible such as the environmental temperatures of the rooms. The elements involved are generally recognised within the design industry and a combined force of engineers, architects, and specialist advisors work together to ensure all of the elements are in place for each new design. However, one element affecting performance that has not yet been comprehensively covered (at least for many building types) is that relating to occupant movement and the influence this has on experience and hence performance. For example, the number of times people have to negotiate cross-flow environments in a train station before becoming agitated is unknown. Also, the average distance people will walk through a shopping centre before becoming tired and ending the activity is unknown. Even so, they will both be impacted upon by the design and they will both reflect back on the performance of the design. Before starting this research, it was realised by the research engineer that there was only a limited understanding and application of people flow analyses within industry and, where it existed, it was solely related to transport terminals, pedestrian walkways/crossings, sports stadia arrivals/egress, and evacuation analyses. This research was undertaken with the sponsoring company to further understand the limitations of current practice, the benefits associated with people flow modelling, and to exploit the benefits where they exist.
1.2 THE CONTEXT OF THE RESEARCH
1.2.1 THE INDUSTRIAL SPONSOR As a leading multi-disciplinary consulting engineering company, Buro Happold have been involved with many high profile projects, including the British Museum Great Court, the Millennium Dome, BBC White City, and Arsenal Football Club. Together with providing the ‘traditional’ services of Structural Engineering, Building Services, and Civil Engineering, they also provide a number of specialist services such as wind analysis, security advice, and fire safety engineering. As a service that had not been traditionally provided within Buro Happold, they agreed to the idea of using the Engineering Doctorate to help in developing people modelling for the built and open environments. Their aim was to provide a place within Buro Happold where the author could carry out appropriate applied research so as to develop this service and open up a new market. In doing so, it was intended that the work would positively influence the design community and construction industry as a whole.
People Flow Modelling - Benefits, Knowledge, and Applications within Industry
12
Also, as a wide-spread international consultancy, Buro Happold works on many hundreds of commissions per year and therefore is in an ideal position to provide many opportunities for applied research on projects.
1.2.2 RESEARCH FOCUS At the start of the Engineering Doctorate, there were two strategic aims. Firstly to gain a clear idea of the application and limitations of contemporary circulation analysis within industry and to understand the industry benefits of improvements in the area. Secondly to choose one or more specific sectors where circulation analysis is not generally applied but would be of significant benefit and to demonstrate an improved way of approaching this issue. During the research, opportunities arose to study a number of racecourses and school projects. Therefore, together with appropriate generic background research, these sectors became the focus of the applied research.
1.3 THE OVERARCHING AIM
With consideration of Sections 1.1 and 1.2, the overarching aim for the research was chosen to be: ‘Investigate the limitations of contemporary circulation analysis and provide new and beneficial knowledge and techniques to advance the field; with special emphasis on
new building sectors’ In achieving this goal, the following value would be achieved:
• Informing the use of standardised design guidance. • Providing significant new people flow knowledge/data to the design community. • Providing new and practical performance-based approaches for industry use in
new sectors.
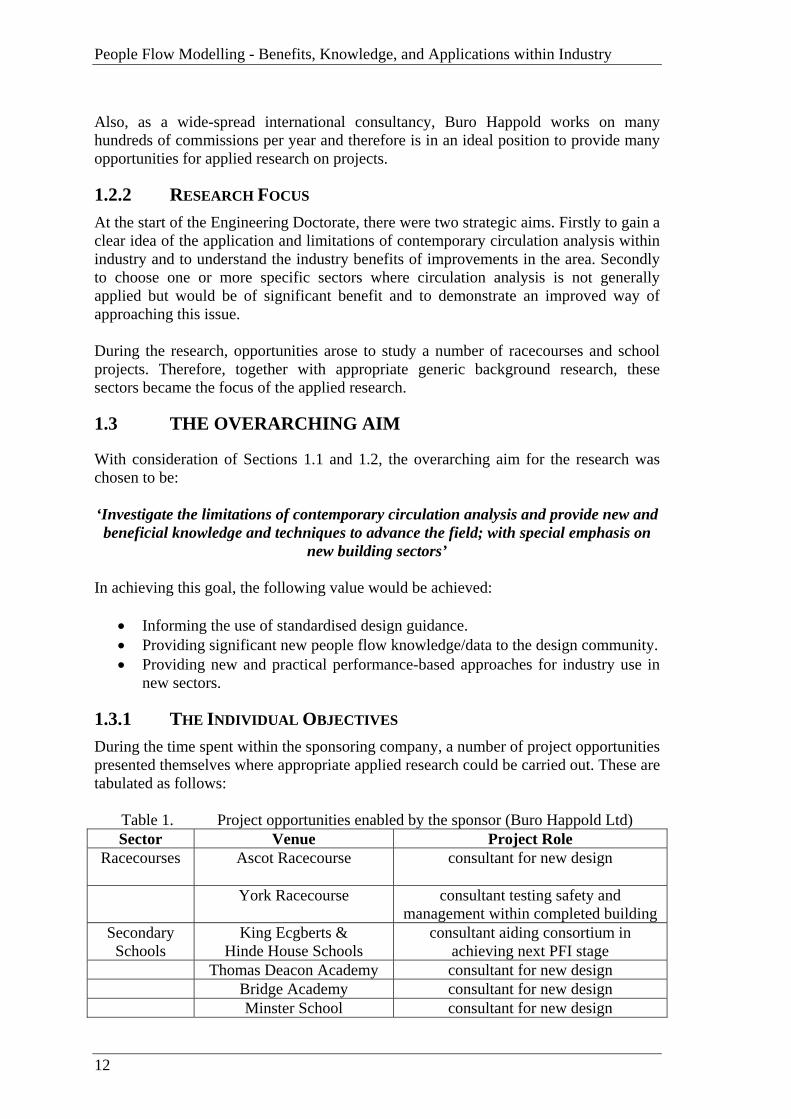
1.3.1 THE INDIVIDUAL OBJECTIVES During the time spent within the sponsoring company, a number of project opportunities presented themselves where appropriate applied research could be carried out. These are tabulated as follows:
Table 1. Project opportunities enabled by the sponsor (Buro Happold Ltd) Sector Venue Project Role
Racecourses
Ascot Racecourse consultant for new design
York Racecourse consultant testing safety and management within completed building
Secondary Schools
King Ecgberts & Hinde House Schools
consultant aiding consortium in achieving next PFI stage
Thomas Deacon Academy consultant for new design Bridge Academy consultant for new design Minster School consultant for new design
Introduction
13
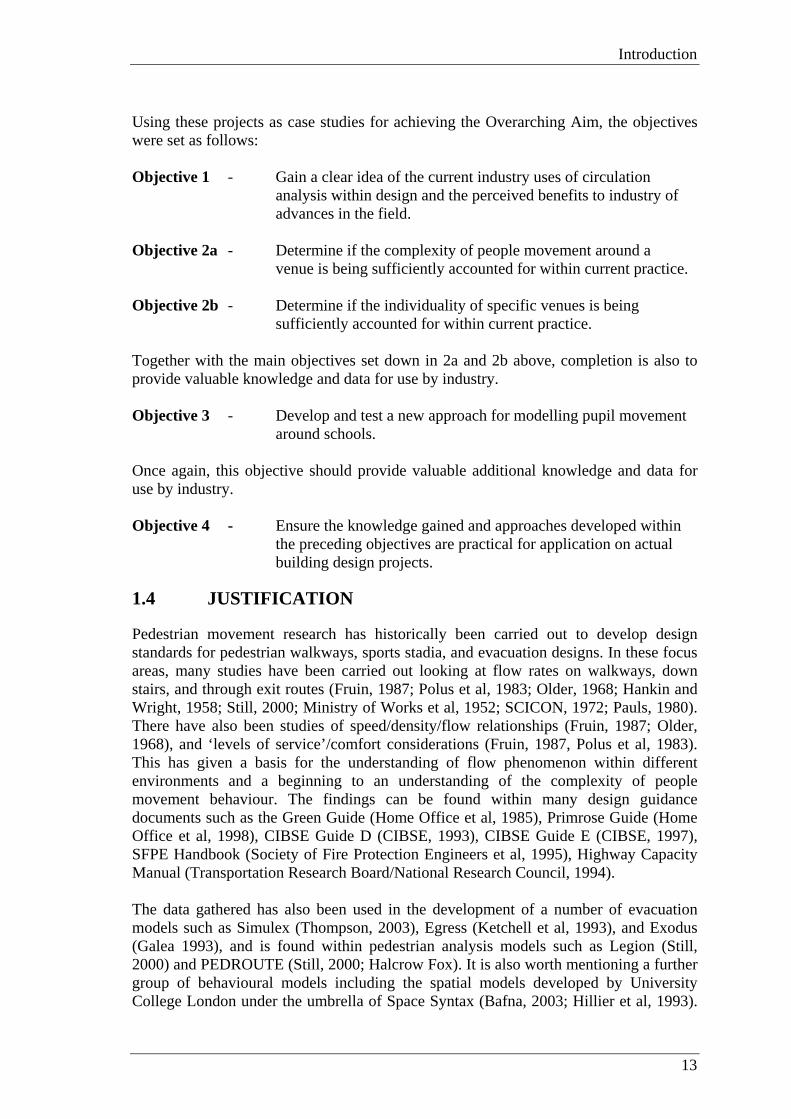
Using these projects as case studies for achieving the Overarching Aim, the objectives were set as follows: Objective 1 - Gain a clear idea of the current industry uses of circulation
analysis within design and the perceived benefits to industry of advances in the field.
Objective 2a - Determine if the complexity of people movement around a venue is being sufficiently accounted for within current practice.
Objective 2b - Determine if the individuality of specific venues is being sufficiently accounted for within current practice.
Together with the main objectives set down in 2a and 2b above, completion is also to provide valuable knowledge and data for use by industry. Objective 3 - Develop and test a new approach for modelling pupil movement
around schools. Once again, this objective should provide valuable additional knowledge and data for use by industry. Objective 4 - Ensure the knowledge gained and approaches developed within
the preceding objectives are practical for application on actual building design projects.
1.4 JUSTIFICATION
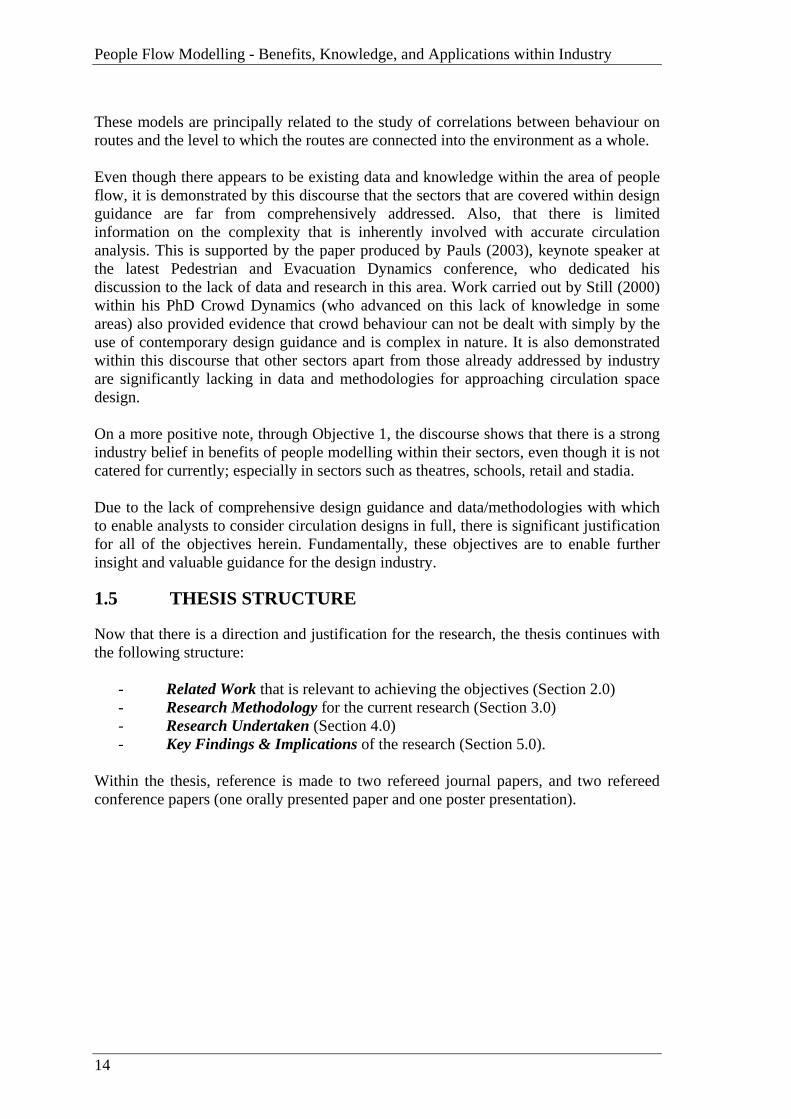
Pedestrian movement research has historically been carried out to develop design standards for pedestrian walkways, sports stadia, and evacuation designs. In these focus areas, many studies have been carried out looking at flow rates on walkways, down stairs, and through exit routes (Fruin, 1987; Polus et al, 1983; Older, 1968; Hankin and Wright, 1958; Still, 2000; Ministry of Works et al, 1952; SCICON, 1972; Pauls, 1980). There have also been studies of speed/density/flow relationships (Fruin, 1987; Older, 1968), and ‘levels of service’/comfort considerations (Fruin, 1987, Polus et al, 1983). This has given a basis for the understanding of flow phenomenon within different environments and a beginning to an understanding of the complexity of people movement behaviour. The findings can be found within many design guidance documents such as the Green Guide (Home Office et al, 1985), Primrose Guide (Home Office et al, 1998), CIBSE Guide D (CIBSE, 1993), CIBSE Guide E (CIBSE, 1997), SFPE Handbook (Society of Fire Protection Engineers et al, 1995), Highway Capacity Manual (Transportation Research Board/National Research Council, 1994). The data gathered has also been used in the development of a number of evacuation models such as Simulex (Thompson, 2003), Egress (Ketchell et al, 1993), and Exodus (Galea 1993), and is found within pedestrian analysis models such as Legion (Still, 2000) and PEDROUTE (Still, 2000; Halcrow Fox). It is also worth mentioning a further group of behavioural models including the spatial models developed by University College London under the umbrella of Space Syntax (Bafna, 2003; Hillier et al, 1993).
People Flow Modelling - Benefits, Knowledge, and Applications within Industry
14
These models are principally related to the study of correlations between behaviour on routes and the level to which the routes are connected into the environment as a whole. Even though there appears to be existing data and knowledge within the area of people flow, it is demonstrated by this discourse that the sectors that are covered within design guidance are far from comprehensively addressed. Also, that there is limited information on the complexity that is inherently involved with accurate circulation analysis. This is supported by the paper produced by Pauls (2003), keynote speaker at the latest Pedestrian and Evacuation Dynamics conference, who dedicated his discussion to the lack of data and research in this area. Work carried out by Still (2000) within his PhD Crowd Dynamics (who advanced on this lack of knowledge in some areas) also provided evidence that crowd behaviour can not be dealt with simply by the use of contemporary design guidance and is complex in nature. It is also demonstrated within this discourse that other sectors apart from those already addressed by industry are significantly lacking in data and methodologies for approaching circulation space design. On a more positive note, through Objective 1, the discourse shows that there is a strong industry belief in benefits of people modelling within their sectors, even though it is not catered for currently; especially in sectors such as theatres, schools, retail and stadia. Due to the lack of comprehensive design guidance and data/methodologies with which to enable analysts to consider circulation designs in full, there is significant justification for all of the objectives herein. Fundamentally, these objectives are to enable further insight and valuable guidance for the design industry.
1.5 THESIS STRUCTURE
Now that there is a direction and justification for the research, the thesis continues with the following structure:
- Related Work that is relevant to achieving the objectives (Section 2.0) - Research Methodology for the current research (Section 3.0) - Research Undertaken (Section 4.0) - Key Findings & Implications of the research (Section 5.0).
Within the thesis, reference is made to two refereed journal papers, and two refereed conference papers (one orally presented paper and one poster presentation).
Related Work
15
2 RELATED WORK
Within Section 1.4, brief reference was made to a number of researchers who have carried out people movement/modelling research, together with various modelling software designed for people flow analysis. This section focuses on this research and software in relation to the specific goals of the current research and shows the novelty of the new work and how it fits within and builds upon the existing knowledge base.
2.1 REVIEW OF PREVIOUS RESEARCH
The case studies for the current research are centred on the sectors of racecourses and schools. Therefore, it is important to review the specific research relating to these sectors, together with other research which is generically applicable to the work. In order to review the previous work that is relevant to this research, the following questions are therefore addressed:
1) What specific research has been carried out into racecourse people movement?
2) What specific research has been carried out into people movement around schools?
3) What research has been carried out that are not directly related to, but still relevant to school and racecourse people modelling?
2.1.1 RACECOURSE RELATED RESEARCH Looking at the first question, it has been found that the only people modelling research directly applicable to the work on racecourses is by Still (2000) who, within his PhD research, studied two racecourses in Hong Kong; namely Happy Valley and Sha Tin racecourses. For Happy Valley he looked at the entrance design with a combination of surveys, focal path diagrams and least effort agent-based modelling. Data was not given for arrival rates used in the modelling and it can only be postulated that the simulation used steady-state arrivals. The analysis concluded that the geometry of the entrance design had a significant effect on disproportionate entrance utilisation and that this would not be shown by traditional queuing analysis or design guidance methods. Also studied with agent based software was a tunnel at the racecourse where once again the geometry was shown to be important in relation to turnstile utilisation and safety. At the Sha Tin Racecourse similar findings were noted.
2.1.2 SCHOOL RELATED RESEARCH For the second question, it was found that there were no previous research papers looking into this area of school circulation. Where reference is made to this, it is within design guidance documents, where minimum widths are provided e.g. Building Bulletin 98 (Department for Education and Skills, 1998). A typical example of the vagueness of documents such as this is also shown by Circular No 3; Guidance on Determining School Capacities (Scottish Executive Education Department, 2004) – see below:

People Flow Modelling - Benefits, Knowledge, and Applications within Industry
16
‘In determining school capacities, authorities will need to take into account:
• the size and number of classrooms; • the size of dining spaces; • the number of toilets; • any circulation requirements; • the size and number of any staircases; • planning to improve access to education for pupils with disabilities.’
In relation to circulation guidance, exact recommendations for provisions, data, and references, are not given.
2.1.3 MISCELLANEOUS RESEARCH To answer the third question, there have been a number of pieces of research that can be pieced together to inform our current research. These are related to:
• Free speeds on stairs • Free speeds on level ground • A standard flow rate equation • Capacity flow rates on stairs in relation to:
- Width - Boundaries - Counter Flow - Flow Direction - Urgency - Stair Geometry - Measured Values
• Capacity flow rates on level routes in relation to:
- Width - Boundaries and Obstacles - Counter Flow - Route Length - Corners - Incline - Measured Values
2.1.3.1 Free speeds for stairs Fruin (1987) found on his research into commuter movement that normal stair locomotion can occur with quite high densities of approximately 1 person/m2. Fruin (1987) also notes that horizontal speeds of locomotion on stairs have a close relationship with riser height with the faster speeds for both upward and downward movement occurring at lower riser heights. Age and gender also lead to a distribution of speeds. A survey of over 700 people gave the results tabulated in Table 2.

Related Work
17
Table 2. Free speeds (stairs) and the impact of age, gender, and geometry (Fruin, 1987) Stair Speed (along slope) m/s Down
Direction Down
Direction Up Direction Up Direction
0.18m riser, 0.29m tread,
32 degree angle
0.15 riser, 0.3m tread, 27 degree angle
0.18m riser, 0.29m tread,
32 degree angle
0.15 riser, 0.3m tread, 27 degree angle
Age 29 or under
Males 0.98 1.04 0.66 0.68 Females 0.70 0.75 0.64 0.63 Average 0.90 0.91 0.65 0.65
Age 30 to 50 Males 0.81 0.91 0.60 0.66
Females 0.60 0.73 0.57 0.61 Average 0.77 0.88 0.59 0.65
Age – over 50 Males 0.67 0.67 0.51 0.46
Females 0.55 0.63 0.46 0.51 Average 0.65 0.66 0.50 0.47 Overall Average
0.79 0.86 0.60 0.64
The overall average free speed for downwards direction was found by Fruin (1987) to be approximately 0.82m/s. For free speeds on stairs, Pauls (Society of Fire Protection Engineers et al, 1995) also states that the average horizontal speed of a person on a stair is 0.8m/s. This translates to approximately 0.9m/s down the stair. Also, Hankin and Wright (1958), who studied passenger flow in subways gave an unimpeded average speed for movement up stairs of 0.8m/s and down stairs of 0.98m/s. As seen by the Fruin (1987) table, changes in riser and going dimensions do have an affect on the speed of movement. A question of whether it is the angle of the stair or the going dimension that changes the speed is also partly answered by this work in that there is only a small change in going for a significant change is speed. Therefore, we can more confidently state that gradient is the significant contributing factor impacting on speed. Within the standard BS5395 (BSI, 2000), it is assumed that speed also depends upon whether the steps allow for a comfortable gait (everyone has experienced walking up a stair with unusual going depths where it takes 1.5 strides per step which leads to a slowing down). There is a general guidance equation given of ‘g+2r’ with a maximum and minimum value for stadia being 0.7m and 0.55m respectively. The maximum and minimum rise is set at 0.18m and 0.1m (below this value is thought to cause a trip hazard) respectively and the going is set at 0.35m and 0.28m respectively. Using the ‘going’ and ‘riser’ guidance within BS5395 (BSI, 2000) the maximum gradient for a stair would be 33o.
People Flow Modelling - Benefits, Knowledge, and Applications within Industry
18
Also from Table 2, it is clear that the more men present, and the more people between 30 to 50, the faster the speed.
2.1.3.2 Free speeds for level ground It is recognised within various research that free speeds occur at relatively low densities. Fruin (1987) noted the density at which this happens on level routes to be in the region of 2.5m2/person and greater. At such densities, work by Tregenza (1976), Helbing (2001), Henderson (1971), Fruin (1987), and Still (2000), show that walking speeds within sample groups follow a normal distribution with the mean changing more between samples than the standard deviation. The mean of the free speed distribution was found to be affected by: Age - As shown by Ando et al (1988), people walk fastest in their early
twenties, with older and younger people having slower free speeds. The studies carried out to gather this data were from people in a train station in Japan and it must be recognised that there may be a cultural difference in speeds. However, the phenomenon was also noted in work carried out by Peschel (1957) for people on pedestrian crossings. For a mix of men and women of different ages he gained the following averages:
age 6-10 mean = 1.1m/s
age 13-19 mean = 1.8m/s men below 40 mean = 1.7m/s
men over 55 mean = 1.5m/s Gender - It has been found by Ando et al (1988), Henderson (1971),
Peschel (1957), Polus et al (1983), Navin and Wheeler (1969), that women have lower free speeds than men. Ando et al (1988) showed a ratio of male speed to female speed ranged from 1.0 to 1.5 depending upon the age, while Polus et al (1983) noted a ratio was between 1.07 and 1.12.
Trip Purpose - Trip purpose was shown by Surti and Burke (1971) to have a significant impact on free speeds, with the average walking speed of tourists outside the Whitehouse in Washington being 1.0m/s while that of other pedestrians was 1.6m/s. Tregenza (1976) also noted other effects on free speed including:
- highway crossings (faster) - time of day (fastest between 8a.m. and 9 a.m.;
probably due to a higher proportion of people on a work related trip purpose)
- specific trip purpose (people walking to restaurants travelling more quickly than those with business or shopping purposes)
- weather (people walking faster at colder temperatures)
Related Work
19
- floor surface (harder surfaces have been reported to promote faster walking speeds than softer carpeted surfaces)
Route Inclination - Fruin (1987) found that below a gradient of 5-6% there
was no change in walking speeds. At a gradient of 10%, there was an 11.5% reduction and at 20% there was a 25% reduction.
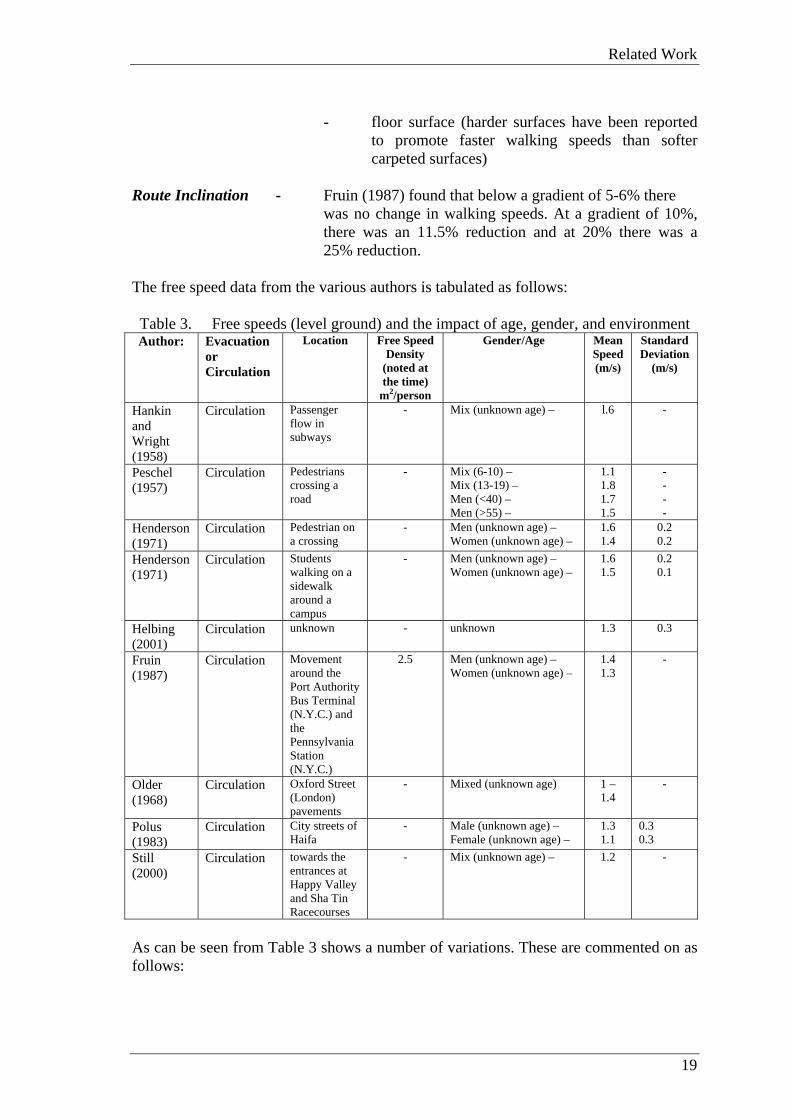
The free speed data from the various authors is tabulated as follows: Table 3. Free speeds (level ground) and the impact of age, gender, and environment Author: Evacuation
or Circulation
Location Free Speed Density
(noted at the time)
m2/person
Gender/Age Mean Speed (m/s)
Standard Deviation
(m/s)
Hankin and Wright (1958)
Circulation Passenger flow in subways
- Mix (unknown age) –
l.6 -
Peschel (1957)
Circulation Pedestrians crossing a road
- Mix (6-10) – Mix (13-19) – Men (<40) – Men (>55) –
1.1 1.8 1.7 1.5
- - - -
Henderson (1971)
Circulation Pedestrian on a crossing
- Men (unknown age) – Women (unknown age) –
1.6 1.4
0.2 0.2
Henderson (1971)
Circulation Students walking on a sidewalk around a campus
- Men (unknown age) – Women (unknown age) –
1.6 1.5
0.2 0.1
Helbing (2001)
Circulation unknown - unknown 1.3 0.3
Fruin (1987)
Circulation Movement around the Port Authority Bus Terminal (N.Y.C.) and the Pennsylvania Station (N.Y.C.)
2.5 Men (unknown age) – Women (unknown age) –
1.4 1.3
-
Older (1968)
Circulation Oxford Street (London) pavements
- Mixed (unknown age) 1 – 1.4
-
Polus (1983)
Circulation City streets of Haifa
- Male (unknown age) – Female (unknown age) –
1.3 1.1
0.3 0.3
Still (2000)
Circulation towards the entrances at Happy Valley and Sha Tin Racecourses
- Mix (unknown age) –
1.2 -
As can be seen from Table 3 shows a number of variations. These are commented on as follows:

People Flow Modelling - Benefits, Knowledge, and Applications within Industry
20
1) The pedestrians surveyed by Hankin and Wright (1958), Peschel (1957), and Henderson (1971), were likely to be either in somewhat of a rush to cross the road or have a strong trip purpose when moving along the subway to get their underground train. They display high free walking speeds of between 1.4m/s and 1.8m/s (ignoring people under 13). When sampling a mix of people in these circumstances within future surveys, it would be reasonable to obtain a normal distribution of speeds with a mean of 1.6m/s and a standard deviation of between 0.2m/s and 0.3m/s. The work by Hankin and Wright (1958) gives quite a simple baseline value to compare against for other samples.
2) It is likely that the students surveyed by Henderson (1971) would have been within the highest speed age range. Looking at the work by Peschel (1957), one would expect the students to move at a speed of 1.7-1.8m/s if commuting. Therefore, because the mean speeds were measured at approximately 1.6m/s, it is expected that the sampled students were not in as much of a hurry to cross the road as the other samples taken by Peschel (1957), and Henderson (1971).
3) It is more difficult to be certain about the work by Helbing (2001) and Fruin (1987) because it is unclear whether the people involved had a strong trip purpose at the time of being surveyed. It is likely that the majority did not have a strong trip purpose due to their relatively slow free speeds compared with the work by Hankin and Wright (1958).
4) Older (1968) notes that most of the people surveyed on city streets were shoppers. Therefore, it is reasonable to assume that they were not in a rush and there may have been a high percentage of women within the flow. This is assumed to be the reason why the free speeds are relatively low, with the same reason assumed for the work carried out by Polus et al (1983). This would need to be researched further, but it would not be unreasonable to expect a normal distribution of free speeds with a mean of 1.2m/s with a standard deviation of 0.3m/s.
5) Within studies by Still (2000) of unimpeded spectator speeds towards the entrances at Happy Valley and Sha Tin Racecourses, mean speeds were measured of approximately 1.2m/s. This is very slow compared with the commuter travelling at 1.6m/s. However, as noted earlier, Tregenza (1976) observed the speeds of people attending a sports stadia to be less than people within a city centre environment. With our shoppers also achieving speeds of approximately 1.2m/s (mean) it would seem that Still (2000) and Tregenza (1976) corroborate. It should also be kept in mind that there would be a higher number of women within the shoppers and a higher number of men within a sports crowd. An assumption is therefore made that, even though males will be predominant within a sports crowd, they will have less drive than shoppers within a city. This therefore balances the free speeds out somewhat.
This information would arguably give a way of estimating free flow speeds likely at most venues. Take for example Ascot Racecourse during one of their major festivals such as Royal Week. On Ladies Day of Royal Week the percentage of women can be estimated to be in excess of 50%. Also, in excess of 60% of the spectators will be over 35 years of age. Reviewing the work by Still (2000), most of the occupants going to the Hong Kong racecourses, where there was an average free speed of 1.2m/s, were young males. Therefore, because the spectators at Ascot Racecourse are older with a higher

Related Work
21
proportion of females, it would be reasonable to expect the Ascot occupants to have a normal free speed distribution with a mean of between 1m/s and 1.2m/s (or less).
2.1.3.3 Standard flow rate equation As within other research, there has been some historical debate over a number of elements making up capacity flow rates. This can mostly be related to the standard flow rate formula (see Equation 1) with design guidance given by Tregenza (1976), Fruin (1987), and Society of Fire Protection Engineers et al (1995): Flow rate (p/s) = mean speed (m/s) x mean density (p/m2) x width of route (m) (1) In principle, this equation, which applies to both level routes and stairs, looks relatively simple. There is an impact of width and a simple dependency between speed and density. Both Older (1968) and Fruin (1987) demonstrated that, for most densities, speed reduces linearly with increasing density. This fundamentally means that, as the density increases, the ‘rate of increase’ in flow rate will reduce until a point where the flow rate reaches a maximum; referred to here as the ‘capacity’ flow rate. In excess of this density the flow rate will then start to reduce; giving a ‘limit exceeded’ flow. This ‘limit exceeded’ phenomenon was captured by Older (1968) on city streets in London. Virkler and Elayadath (1994), who fitted various curves to field data, also noted that the May’s Bell curve and two regime linear fit were good for the flow-density relationship. However, even though the above equation appears relatively simple, the exact relationships between speed, density, and width can vary depending upon the situation in question and there can also be many influences on each element and therefore the capacity of any given route. Fruin (1987) supports this by stating that there can be many different types of flows and that the curves he developed could well be a different shape for different environments. The influences on flow rate and capacities achieved by routes are not something fully agreed upon by the research community and the following therefore discusses each of the main influences and the apparent consensus at the time of writing.
2.1.3.4 Capacities flow rates for stairs a Variations with width Historically, researchers have debated whether there is a step-wise change in flow rates with width or a linear change implied by Equation 1. The older ideas seemed to focus on the step-wise theory with people forming discrete channels and the flow rate being a multiple of the number of channels. However, Pauls (1980) presented findings of over 58 experiments, showing very clearly that capacity flow rate is directly proportional to what he called ‘effective width’ (width minus boundary layer). The widths used within the experiments were 0.91m, 1.07m, 1.12m, 1.14m, 1.19m, 1.22m, 1.42m, and 1.52m. It was noted that widths greater than this exhibited essentially the same linearity. However, as there was no flow rate data presented for widths above 1.52m and the report shows that the centre of larger stairs are used somewhat less, it would be reasonable to expect that the flow rate is only fully linear up until a certain width unless further hand-rails or central barriers are provided.
People Flow Modelling - Benefits, Knowledge, and Applications within Industry
22
b Influence of boundaries As noted in (a), the studies carried out by Pauls (1980) [on data gathered by Hankin and Wright (1958)], gave the strongest linear relationship between flow rate and width adopting a parameter called ‘effective width’. This is the width after subtracting a boundary effect near the walls or hand-rails. His study adopts a width reduction of 150mm from each side of a stair. Pauls (1980) did however note that different circumstances could cause this width to be greater and provided further detail within the SFPE Handbook (Society of Fire Protection Engineers et al, 1995) where a 150mm width was given from the wall and 90mm width from the centre-line of a central hand-rail.
c Influence of counter flow Very little has been researched into the relationship between counter-flow and capacity on stairs. This is therefore an area worthy of further research. Currently, the most that can be assumed within analysis would be to use the research sited within the following sections for counter-flow within level routes.
d Influence of flow direction Fruin (1987) observed only a relatively small capacity flow rate difference between upwards movement and downwards movement on stairs and definitely not the 20-30% difference inferred by the free speed data. Hankin and Wright (1958) further confirms this by providing uni-directional flow rates of 69 people/minute/metre for movement downstairs and 62 people/minute/metre for movement upstairs; an 11% difference . However, Pushkarev and Zupan (1975) also did their own studies on movement up subway stairs where a range of flow rates was found from 42 people/minute/metre to 53 people/minute/metre. This is an area that would clearly benefit from further evidence/investigation.
e Influence of urgency The research by Pauls (1980), further stated within the SFPE Handbook (Society of Fire Protection Engineers et al, 1995), shows a non-linear relationship between evacuation population within a building and flow rate. In terms of effect, the research shows significantly varying capacity flow rates from as low as 43 people/ metre eff. /minute to an optimum value of 71 people/ metre eff. /minute. It is stated that this may be due to an ‘urgency’ factor but Pauls (1980) presents no further justification to support this theory.
f Influence of stair geometry Within the SFPE Handbook (Society of Fire Protection Engineers et al, 1995), Harold E. “Bud” Nelson and Hamish A. MacLennan present the findings of flow research on stairs with different going and riser dimensions. An example of the output is given as follows:
Related Work
23
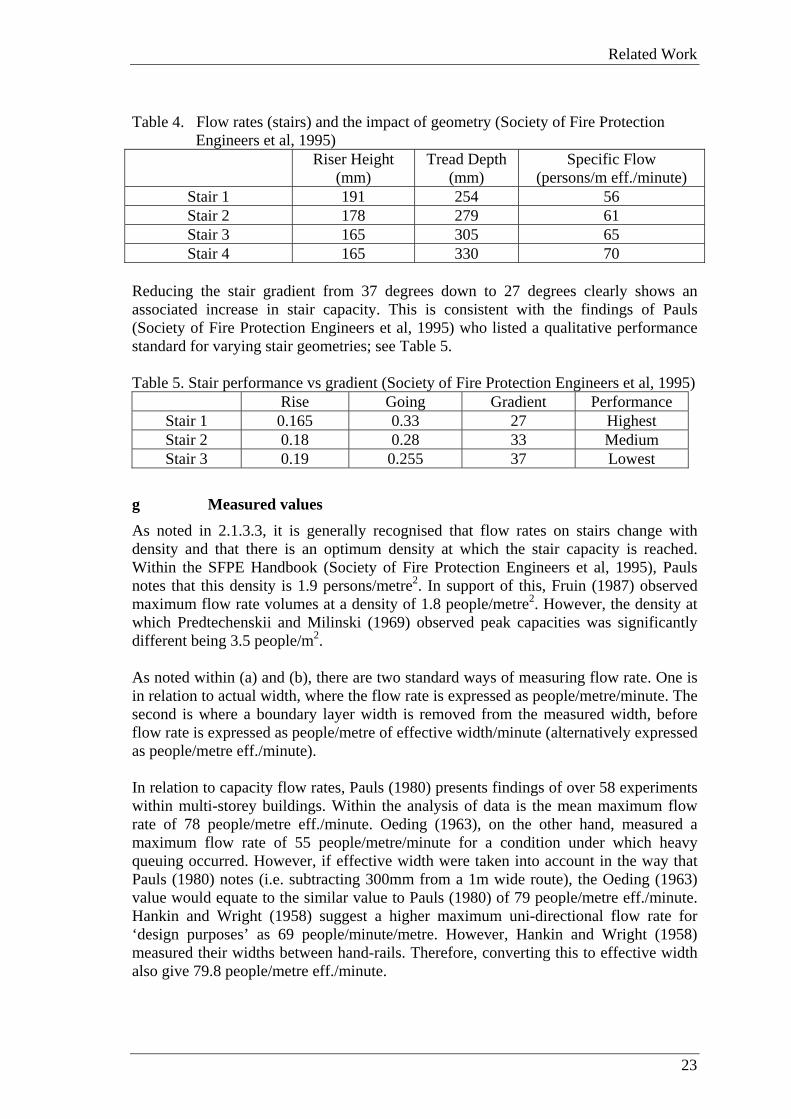
Table 4. Flow rates (stairs) and the impact of geometry (Society of Fire Protection Engineers et al, 1995)
Riser Height (mm)
Tread Depth (mm)
Specific Flow (persons/m eff./minute)
Stair 1 191 254 56 Stair 2 178 279 61 Stair 3 165 305 65 Stair 4 165 330 70
Reducing the stair gradient from 37 degrees down to 27 degrees clearly shows an associated increase in stair capacity. This is consistent with the findings of Pauls (Society of Fire Protection Engineers et al, 1995) who listed a qualitative performance standard for varying stair geometries; see Table 5. Table 5. Stair performance vs gradient (Society of Fire Protection Engineers et al, 1995)
Rise Going Gradient Performance Stair 1 0.165 0.33 27 Highest Stair 2 0.18 0.28 33 Medium Stair 3 0.19 0.255 37 Lowest
g Measured values As noted in 2.1.3.3, it is generally recognised that flow rates on stairs change with density and that there is an optimum density at which the stair capacity is reached. Within the SFPE Handbook (Society of Fire Protection Engineers et al, 1995), Pauls notes that this density is 1.9 persons/metre2. In support of this, Fruin (1987) observed maximum flow rate volumes at a density of 1.8 people/metre2. However, the density at which Predtechenskii and Milinski (1969) observed peak capacities was significantly different being 3.5 people/m2. As noted within (a) and (b), there are two standard ways of measuring flow rate. One is in relation to actual width, where the flow rate is expressed as people/metre/minute. The second is where a boundary layer width is removed from the measured width, before flow rate is expressed as people/metre of effective width/minute (alternatively expressed as people/metre eff./minute). In relation to capacity flow rates, Pauls (1980) presents findings of over 58 experiments within multi-storey buildings. Within the analysis of data is the mean maximum flow rate of 78 people/metre eff./minute. Oeding (1963), on the other hand, measured a maximum flow rate of 55 people/metre/minute for a condition under which heavy queuing occurred. However, if effective width were taken into account in the way that Pauls (1980) notes (i.e. subtracting 300mm from a 1m wide route), the Oeding (1963) value would equate to the similar value to Pauls (1980) of 79 people/metre eff./minute. Hankin and Wright (1958) suggest a higher maximum uni-directional flow rate for ‘design purposes’ as 69 people/minute/metre. However, Hankin and Wright (1958) measured their widths between hand-rails. Therefore, converting this to effective width also give 79.8 people/metre eff./minute.
People Flow Modelling - Benefits, Knowledge, and Applications within Industry
24
No capacity flow rate data could be found specifically for school stairs, but research data was found for stadia within the SCICON (1972) report, for which data was gathered from football and rugby stadia environments. The flow rate noted as applicable for stairs within the SCICON (1972) report was 82 people/metre/min. However, the graphs for stairways within the report show that the value of 82 people/metre/min was an observed peak at one particular point in time and not a sustained value. This is noted by the current Green Guide (Home Office et al, 1985). Therefore, considering graph data over a more appropriate 2-3 minute period, the results would show an average flow rate for the fully loaded condition of between 62-75 people/metre/min (overall average of 68 people/metre/min). Assuming the width were measured between walls, these values still seem relatively high compared with other research, potentially due to the highly charged crowd.
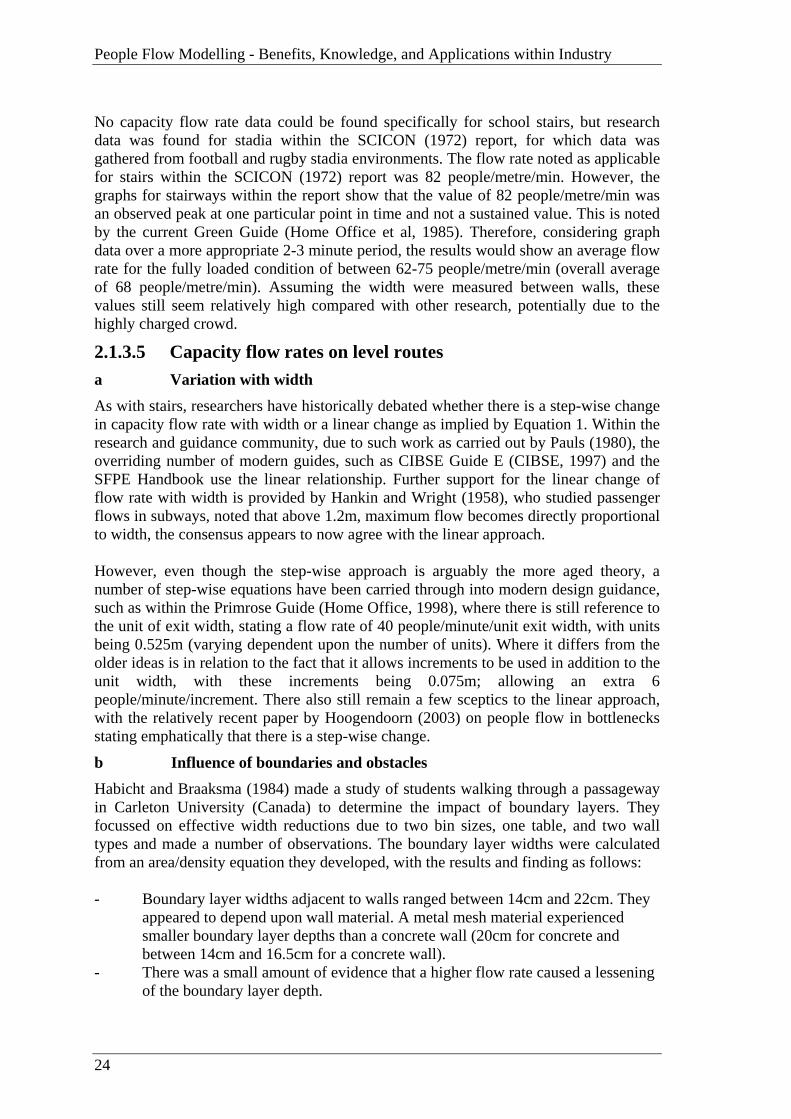
2.1.3.5 Capacity flow rates on level routes a Variation with width As with stairs, researchers have historically debated whether there is a step-wise change in capacity flow rate with width or a linear change as implied by Equation 1. Within the research and guidance community, due to such work as carried out by Pauls (1980), the overriding number of modern guides, such as CIBSE Guide E (CIBSE, 1997) and the SFPE Handbook use the linear relationship. Further support for the linear change of flow rate with width is provided by Hankin and Wright (1958), who studied passenger flows in subways, noted that above 1.2m, maximum flow becomes directly proportional to width, the consensus appears to now agree with the linear approach. However, even though the step-wise approach is arguably the more aged theory, a number of step-wise equations have been carried through into modern design guidance, such as within the Primrose Guide (Home Office, 1998), where there is still reference to the unit of exit width, stating a flow rate of 40 people/minute/unit exit width, with units being 0.525m (varying dependent upon the number of units). Where it differs from the older ideas is in relation to the fact that it allows increments to be used in addition to the unit width, with these increments being 0.075m; allowing an extra 6 people/minute/increment. There also still remain a few sceptics to the linear approach, with the relatively recent paper by Hoogendoorn (2003) on people flow in bottlenecks stating emphatically that there is a step-wise change.
b Influence of boundaries and obstacles Habicht and Braaksma (1984) made a study of students walking through a passageway in Carleton University (Canada) to determine the impact of boundary layers. They focussed on effective width reductions due to two bin sizes, one table, and two wall types and made a number of observations. The boundary layer widths were calculated from an area/density equation they developed, with the results and finding as follows: - Boundary layer widths adjacent to walls ranged between 14cm and 22cm. They
appeared to depend upon wall material. A metal mesh material experienced smaller boundary layer depths than a concrete wall (20cm for concrete and between 14cm and 16.5cm for a concrete wall).
- There was a small amount of evidence that a higher flow rate caused a lessening of the boundary layer depth.
Related Work
25
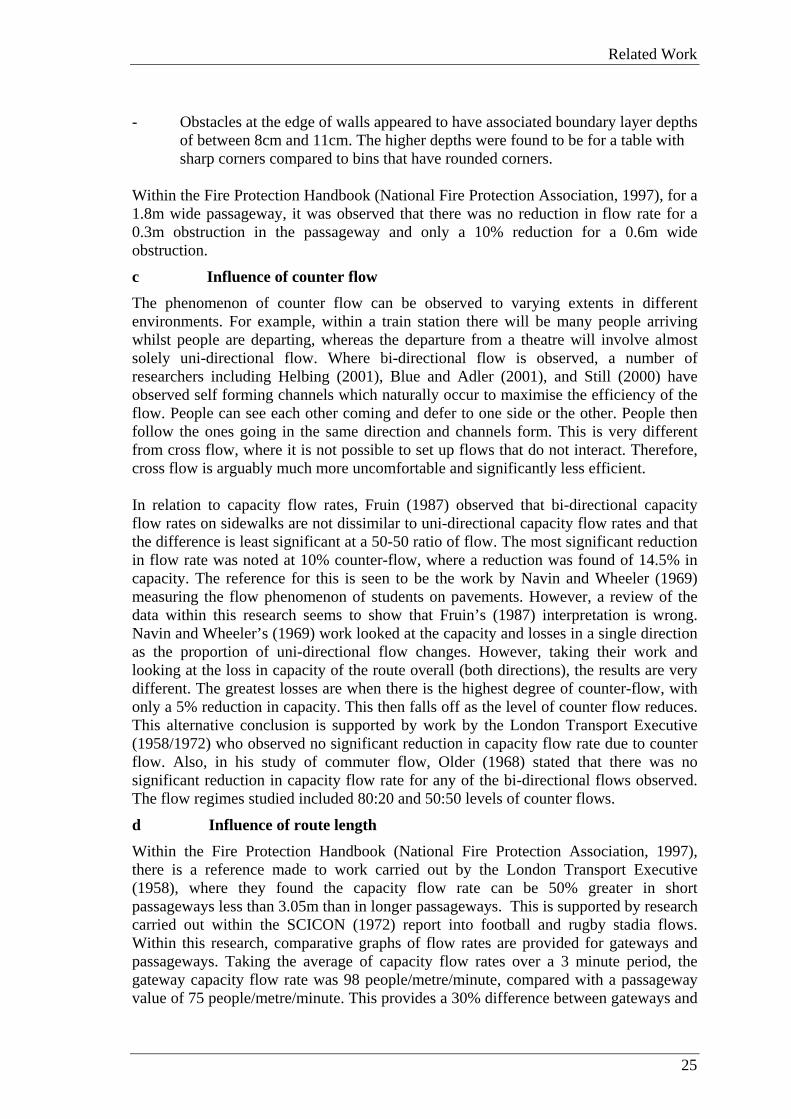
- Obstacles at the edge of walls appeared to have associated boundary layer depths of between 8cm and 11cm. The higher depths were found to be for a table with sharp corners compared to bins that have rounded corners.
Within the Fire Protection Handbook (National Fire Protection Association, 1997), for a 1.8m wide passageway, it was observed that there was no reduction in flow rate for a 0.3m obstruction in the passageway and only a 10% reduction for a 0.6m wide obstruction.
c Influence of counter flow The phenomenon of counter flow can be observed to varying extents in different environments. For example, within a train station there will be many people arriving whilst people are departing, whereas the departure from a theatre will involve almost solely uni-directional flow. Where bi-directional flow is observed, a number of researchers including Helbing (2001), Blue and Adler (2001), and Still (2000) have observed self forming channels which naturally occur to maximise the efficiency of the flow. People can see each other coming and defer to one side or the other. People then follow the ones going in the same direction and channels form. This is very different from cross flow, where it is not possible to set up flows that do not interact. Therefore, cross flow is arguably much more uncomfortable and significantly less efficient. In relation to capacity flow rates, Fruin (1987) observed that bi-directional capacity flow rates on sidewalks are not dissimilar to uni-directional capacity flow rates and that the difference is least significant at a 50-50 ratio of flow. The most significant reduction in flow rate was noted at 10% counter-flow, where a reduction was found of 14.5% in capacity. The reference for this is seen to be the work by Navin and Wheeler (1969) measuring the flow phenomenon of students on pavements. However, a review of the data within this research seems to show that Fruin’s (1987) interpretation is wrong. Navin and Wheeler’s (1969) work looked at the capacity and losses in a single direction as the proportion of uni-directional flow changes. However, taking their work and looking at the loss in capacity of the route overall (both directions), the results are very different. The greatest losses are when there is the highest degree of counter-flow, with only a 5% reduction in capacity. This then falls off as the level of counter flow reduces. This alternative conclusion is supported by work by the London Transport Executive (1958/1972) who observed no significant reduction in capacity flow rate due to counter flow. Also, in his study of commuter flow, Older (1968) stated that there was no significant reduction in capacity flow rate for any of the bi-directional flows observed. The flow regimes studied included 80:20 and 50:50 levels of counter flows.
d Influence of route length Within the Fire Protection Handbook (National Fire Protection Association, 1997), there is a reference made to work carried out by the London Transport Executive (1958), where they found the capacity flow rate can be 50% greater in short passageways less than 3.05m than in longer passageways. This is supported by research carried out within the SCICON (1972) report into football and rugby stadia flows. Within this research, comparative graphs of flow rates are provided for gateways and passageways. Taking the average of capacity flow rates over a 3 minute period, the gateway capacity flow rate was 98 people/metre/minute, compared with a passageway value of 75 people/metre/minute. This provides a 30% difference between gateways and
People Flow Modelling - Benefits, Knowledge, and Applications within Industry
26
passageways and, even though not totally equivalent to the London subway data, does seem to show that shorter routes have a higher capacity than longer routes.
e Influence of corners It has been observed within the SCICON (1972) report and by Tsuji (2003) that corners on routes lead to an increase in localised crowd density. In relation to the impact of this increase in crowd density, there are conflicting comments by researchers. Still (2000) notes an impact on the performanc achieved but doesn’t qualify this with any proof. On the other hand, there are notes in the Fire Protection Handbook (National Fire Protection Association, 1997) referencing work carried out by the London Transport Executive (1958), where it was observed that corners and bends have no effect on flow rate. Uneven density may form but speeds will also re-distribute to ensure the same flow rate. What seems to be clear from the work by Tsuji (2003), who studied a pedestrian bridge where a number of people were crushed and died, is that the increased densities caused at corners can, in high pressure circumstances, lead to high enough pressures to cause fatalities.
f Influence of incline Similar to the findings by Fruin (1987) in relation to free speeds, there are notes in the Fire Protection Handbook (National Fire Protection Association, 1997) referencing work on London subways (London Transport Executive, 1958), where it was observed that gradients of up to 6% had no effect on flow rate. There were no further comments for other gradients.
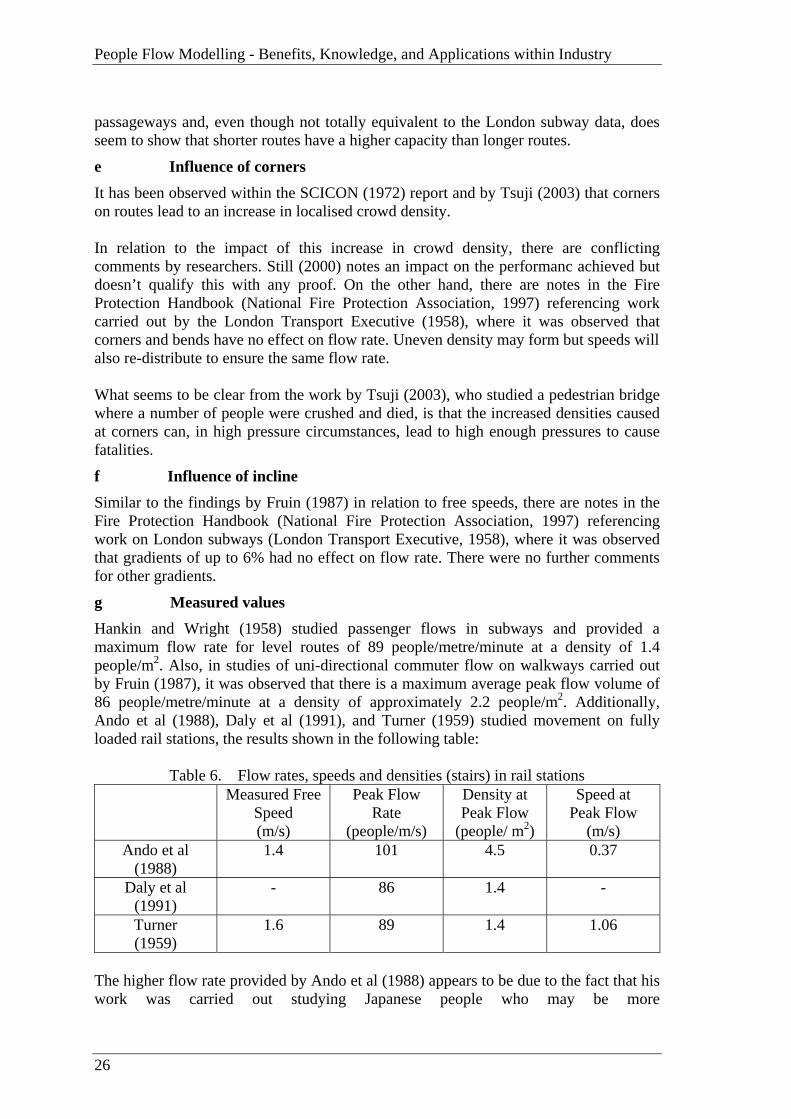
g Measured values Hankin and Wright (1958) studied passenger flows in subways and provided a maximum flow rate for level routes of 89 people/metre/minute at a density of 1.4 people/m2. Also, in studies of uni-directional commuter flow on walkways carried out by Fruin (1987), it was observed that there is a maximum average peak flow volume of 86 people/metre/minute at a density of approximately 2.2 people/m2. Additionally, Ando et al (1988), Daly et al (1991), and Turner (1959) studied movement on fully loaded rail stations, the results shown in the following table:
Table 6. Flow rates, speeds and densities (stairs) in rail stations Measured Free
Speed (m/s)
Peak Flow Rate
(people/m/s)
Density at Peak Flow
(people/ m2)
Speed at Peak Flow
(m/s) Ando et al
(1988) 1.4 101 4.5 0.37
Daly et al (1991)
- 86 1.4 -
Turner (1959)
1.6 89 1.4 1.06
The higher flow rate provided by Ando et al (1988) appears to be due to the fact that his work was carried out studying Japanese people who may be more
Related Work
27
experienced/comfortable moving at a higher density. Whether all of the values are sustained maxima during fully loaded conditions is also in question. Together with carrying out research on subways, Hankin and Wright (1958) also carried out limited experimental studies on capacity flow rates within a boy’s school. Even though they predicted that higher capacity flow rates could be achieved, the maximum measured fully loaded flow rate was approximately 100 pupils/metre/minute. This is relatively high considering the rest of the research referenced within this review and doubt could be cast on the research approach due to it being an experimental study (i.e. the measurements were not taken of capacity flows occurring naturally within a normal school environment). As noted previously, the SCICON (1972) research into flows at football and rugby stadia provides us with capacity flow rates for gateways of 98 people/metre/minute, with a value for passageways of 75 people/metre/minute.
2.1.3.6 Summary of miscellaneous research The review of miscellaneous research has shown that there can be many influences on free speeds and flow rates and has attempted to show the importance of each one. From the work carried out, there appears to be varying capacity flow rates on both stair and level routes depending upon the situation. It can also be said that there is not a comprehensive set of research data for all environments and conditions.
2.2 SPECIALIST SOFTWARE
Software models have mainly been developed to fill a perceived gap in the market for reliable ways of forecasting evacuation times for buildings. There have also been a few models developed for transport terminal designs. The different types of models developed are briefly summarised below in order to provide further grounding for the development of the research methodologies. The models can firstly be split into three groups. The first is Optimisation where the model attempts to determine the optimum solution (in evacuation this would be an even split of people to all exits). The second is Simulation where the model attempts to model a version of reality in a stochastic or deterministic way. The third is Risk Assessment where the modelling is carried out many times to gain a distribution of results. The first type of modelling is extensively published within design guidance, whilst the prevailing models that fall into the second and third groups tend to be ‘agent-based’ in nature. Agent-based, or cellular automata models as they are also known, take individual entities through geometries that are either coarse grid or fine grid; agents occupying particular grid positions (nodes) and moving between these positions dependent upon the modelling system. The coarse grid models tend to be less computationally expensive, even though they do not deal with local effects as well as the fine grid models. There are a number of ways in which the behaviour of each agent is specified including Rule Based, Implicit, No-Rule Based, and Functional Analogy; arguably the most realistic out of these would be Rule-Based, which aims to simulate a version of human response to other agents and the geometry. When a route achieves capacity flow

People Flow Modelling - Benefits, Knowledge, and Applications within Industry
28
depends upon the software used and the input provided by the user. Generally, experience shows that the default values for route capacities are not generic (as would be expected from the review carried out within Section 2.1). There are a number of successful models on the market:
• LEGION (Still, 2000) • buildingEXODUS (Galea 1993) • Simulex (Thompson, 2003) • Steps (Gwynne et al, 1999) • PAXPORT & PEDROUTE (Still, 2000; Halcrow Fox) • CRISP (Gwynne et al, 1999)
The first of the models, LEGION (Still, 2000), is a Simulation model, with fine grid geometry using Functional Analogy to define behaviour. The black-box nature of the agent based behaviour is a drawback of this software. buildingEXODUS (Galea, 1993), Simulex (Thompson, 2003) and Steps (Gwynne et al, 1999) are also agent-based Simulation models, with fine grid geometries, but using Rule Based behaviour. The limitations of these software products are varied. buildingEXODUS (Galea 1993) only employs eight directions by which agents can move which can cause problems when an open space does not follow one of these directions. However, Simulex (Thompson, 2003) and Steps (Gwynne et al, 1999) do not have the ability to employ itineraries, which can be of significant benefit if not employing least effort rules. Both PAXPORT and PEDROUTE (Still, 2000; Halcrow Fox) can be Optimisation or Simulation models, are based upon coarse grid geometries, have global perspectives for individuals, and have implicit behaviour. The problems with these models are that the coarse-grid non-agent based nature of the models means that a calculated density within a ‘block’ has no associated direction of people movement. This has been agreed by the developers to inappropriately model phenomena such as cross-flow in a concourse. Another problem of the software is that there is no clear understanding of the individual’s perspective in moving through their environment. As part of this Engineering Doctorate work, further agent-based software was developed by Sharma and Brocklehurst (2004) to enable fast testing of solutions, with dynamic re-routing. This enabled the analysis to be carried out testing various phenomena within Ascot Racecourse and Thomas Deacon Academy. Dynamic re-routing is not a functionality known to be contained within any other software and the fast network modelling enables a large number of sensitivity tests to be carried out in a short period of time.
2.3 NOVELTY OF THIS RESEARCH
There is clearly an existing, if fragmented, knowledge-base of people flow behaviour coming out of previous research. However, this is not comprehensive in relation to building type, population profile, or activity. At the Human Behaviours in Fire Conference, Pauls (2004) stated that:

Related Work
29
‘Additional study is needed on basic crowd movement characteristics – density, speed and flow – and their relationship, including the effect of culture…’ Therefore, if looking at a tennis club, shopping arcade, or any of a number of other environments, it would not be clear as to the data applicable. From discussions within industry (which are covered in detail within this discourse), it is clear that there is also a lack of focus within the industry as a whole in relation to people modelling benefits and applications. In order to provide further support and focus for circulation analysis, this research will firstly show the many areas where more thorough circulation analysis would be of significant benefit. Following on from this, the research will provide a much needed advance upon the current ‘state of the art’ through a study to demonstrate the importance of complexity and venue specific behaviour in circulation analysis; including the sensitivity to population profile and building type (data and knowledge provided throughout). Finally, a new methodology will be provided for the appropriate treatment of circulation analysis within secondary schools.

People Flow Modelling - Benefits, Knowledge, and Applications within Industry
30
3 RESEARCH METHODOLOGY
The following presents the methodologies considered within the research. It then goes on to show which one of these has been used for each objective and why.
3.1 METHODOLOGIES FOR CONSIDERATION
Observation A method of data collection in which data are gathered through visual observations. It must firstly be decided whether this method is structured or unstructured, with the following definitions:
Structured Observation The researcher determines at the outset precisely what behaviours are to be observed and typically uses a standardised checklist to record the frequency with which those behaviours are observed over a specified time period.
Unstructured Observation
The researcher uses direct observation to record behaviours as they occur, with no preconceived ideas of what will be seen; there is no predetermined plan about what will be observed.
Important considerations when using observation are:
1. The observations must be consistent with the theoretical framework chosen for the study.
2. The recording of the observations must be systematic and standardized
3. Controls must be used to keep the environmental influences from skewing the data.
4. Consider the role of the observer - is he concealed or not concealed
5. Does the observer carry out an intervention or does he just observe?
6. Ethical issues must be considered?
7. Was informed consent used? How would this affect the subject's performance? (The Hawthorne effect - an increase in worker productivity produced by the psychological stimulus of being singled out and made to feel important.) If the subject is not informed until after the observation is completed - debriefing - has the person's rights been violated?
A benefit of this method is that the observational study can be structured so that there is minimal influence on those being observed. If the observation is taped, there can also be no question as to what happened. However, in terms of why people did what they did, there is a level of interpretation made by the researcher.

Research Methodology
31
Interviewing A method of data collection involving an interviewer asking questions of another person (a respondent). This may be structured, with a specific set of questions, or unstructured with just a general theme to start the interview. Interviews can be taped - or the researcher may take field notes as the interview progresses. A benefit of this method is that there is less interpretation made by the researcher. However, interviewing is subject to many sources of error, including memory effects, and the unconscious motivations of respondents to tell the interviewer what they think the interviewer wants to hear (or in some cases what the interviewer does not want to hear!). Questionnaires A method of data collection involving a form containing a set of questions; submitted to people to gain statistical information. The questionnaire can be open ended or closed ended:
Open-ended The subject uses his own words to describe the response. Closed-ended Responses are pre-selected and the subject is forced to choose one of the items – or to rank the items.
Similar to the interview, a benefit of this method is that there is less interpretation made by the researcher. However, interviewing is subject to many sources of error, including memory effects, and the unconscious motivations of respondents to tell the interviewer what they think the interviewer wants to hear (or in some cases what the interviewer does not want to hear!). Pre-Existing Records Pre-existing records or records are sometimes available depending upon the research venue. Important considerations when using pre-existing records are:
1. Issue of privacy - the Privacy Act states that the individual must not be able to be identified.
2. The data on the records must be obtained in similar fashion and recorded in such a way that consistency can be obtained.
The main benefit of this data source is that it cuts down time on the data collection process.
3.2 METHODOLOGICAL CONSIDERATIONS
In order to obtain a comprehensive overview of current industry uses of circulation analysis and the perceived benefits of advances in the field (Objective 1), it would be necessary to gain a large amount of feedback from a number of widespread industry bodies. There were also a number of specialist groups who knew a significant amount about one specific building sector.
People Flow Modelling - Benefits, Knowledge, and Applications within Industry
32
For Objective 2a and 2b, it would firstly be necessary to determine a number of specific focus areas/provisions for the analysis of crowd flows. The areas chosen within Ascot Racecourse and York Racecourse would need to be those where it was possible to look at how the complexity of crowd flow influences and also make a performance comparison to traditional design guidance. It also needed to be recognised that it would not be clear as to the extent to which different influences would impact on the performance and whether the performance would be affected by locally and/or site wide occurrences. It is therefore necessary for the methodology to include the gathering of information from many separate locations at the same time. For each of the areas studied the crowds being observed should also not be impacted upon by the study; thus negating the Hawthorn Effect. One further consideration for the methodology applied to these objectives is in relation to the time of the study. There are only a few days per year when there are large race days at both Ascot Racecourse and York Racecourse. Therefore, a large amount of information would need to be collected in a relatively short time period. It would also benefit significantly if the crowd movements could be reviewed after the event. For Objective 3, one of the main considerations would be to ensure that a sufficiently broad band of input data is gathered to carry out sensitivity tests within the modelling. Also, the data would need to be generic to all schools so as to provide the maximum benefit for future school assessments within industry. Also, because the data within a school will have a level of randomness dependent upon the location and environment, each sample of school movement must be gained through the study of multiple locations at the same time. Finally, the study should not influence the pupil movements themselves. For Objective 4, the knowledge and approaches need to be tested within the design process on real projects.
3.3 METHODOLOGY DEVELOPMENT
3.3.1 PRELIMINARY WORK Arguably, the designers/engineers most involved in circulation design are the Transport Consultants/ Highways Engineers/Urban Designers/Council Planners. Therefore, a questionnaire was drawn up for issuing over the internet to approximately 150 consultants as follows: Transport/Highways/Urban Design 36 transport consultants
31 highway engineers 73 urban design consultants 9 council planners
The e-mailed questions were intended to determine the usual methods employed within circulation analysis and design, together with the perceived benefits of advances in the field of circulation analysis. These questionnaires formed the first stage in achieving Objective 1. For the second stage, it was necessary to consider designers and consultants who work solely within certain specific building sectors. For this, meetings were held to once again determine the usual methods employed within circulation analysis and design and the perceived benefits of advances in the field of circulation
Research Methodology
33
analysis. The companies (and sectors) with which meetings were held are listed as follows:
• Lord Cultural Resources (museum specialists) • Theatre Projects Consultants (theatre specialists) • Consarc Design (hotel architects) • Eric Khune & Associates (retail specialists) • Seymour Harris Keppie (school architects) • Bryanston Square (educational consultants)
It was also possible to gain a further and necessary understanding of the circulation design methods specific to stadia and schools through consultancy experience gained on live projects including Ascot Racecourse, York Racecourse, King Ecgberts School, Thomas Deacon Academy, the Bridge Academy, and Minster School. The work on these projects entailed gaining a thorough understanding of client needs, design guidance, and traditional methods employed by architects such as Foster and Partners, JM Architects, Building Design Partnership, Penoyre and Prasad, and HOK Sport Venue and Events. The consultancy also entailed the studying of people movement behaviour and gave numerous opportunities to compare guidance against real life movement patterns. For Objectives 2a, 2b, and 3, the following approaches were used: Stadium Review (i) (Objective 2a) - Determine a number of appropriate areas
for consideration within Ascot Racecourse and York Racecourse during their biggest venue days i.e. when large crowds would be present.
Make judgements as to the elements that would influence circulation performance and therefore would require inclusion within the people movement assessment. Determine the appropriate methodology out of those listed for studying the chosen elements. Carry out the appropriate data gathering. Analyse the data and review the results.
Stadium Review (ii) (Objective 2b) - Choose an important generality present
within sports stadia design guidance.
Focus on a location where this generality can be considered in detail at one of the chosen racecourses.
People Flow Modelling - Benefits, Knowledge, and Applications within Industry
34
Determine the appropriate methodology out of those listed for studying people movement at the chosen location. Carry out the appropriate data gathering. Analyse the data. Review how applicable the generality is for a racecourse and what this can reveal about contemporary circulation analyses and design.
Schools Modelling (Objective 3) - Gain information on how schools function
during the times of pupil movement and what would be beneficial to forecast about new school designs; through discussions with deputy heads. Make judgements as to the elements that would influence circulation performance and therefore would require inclusion within the people movement assessment. Determine the appropriate methodology out of those listed for studying the chosen elements. Carry out the appropriate data gathering.
Review the findings. Develop and test a methodology for modelling school circulation using the gathered information.
3.3.2 FOCUS AREAS WITHIN METHODOLOGY Stadium Review (i & ii) (Objective’s 2a & 2b) For Objective 2a, the focus areas at Ascot Racecourse were chosen to be the Main turnstile bank on the High St, the egress routes from the grandstand viewing lawns, and the departure behaviour. The focus areas at York Racecourse were the entrances around the site. All of these provisions can be directly compared with contemporary guidance to gain an understanding of the influence of complexity. For Objective 2b, the areas chosen at Ascot Racecourse were the main vomitory leading from the grandstand viewing lawns through the Grandstand and two circulation/egress stairs. The generality considered here is in relation to capacity flow rates, where there is arguably the only detailed information provided within contemporary guidance.
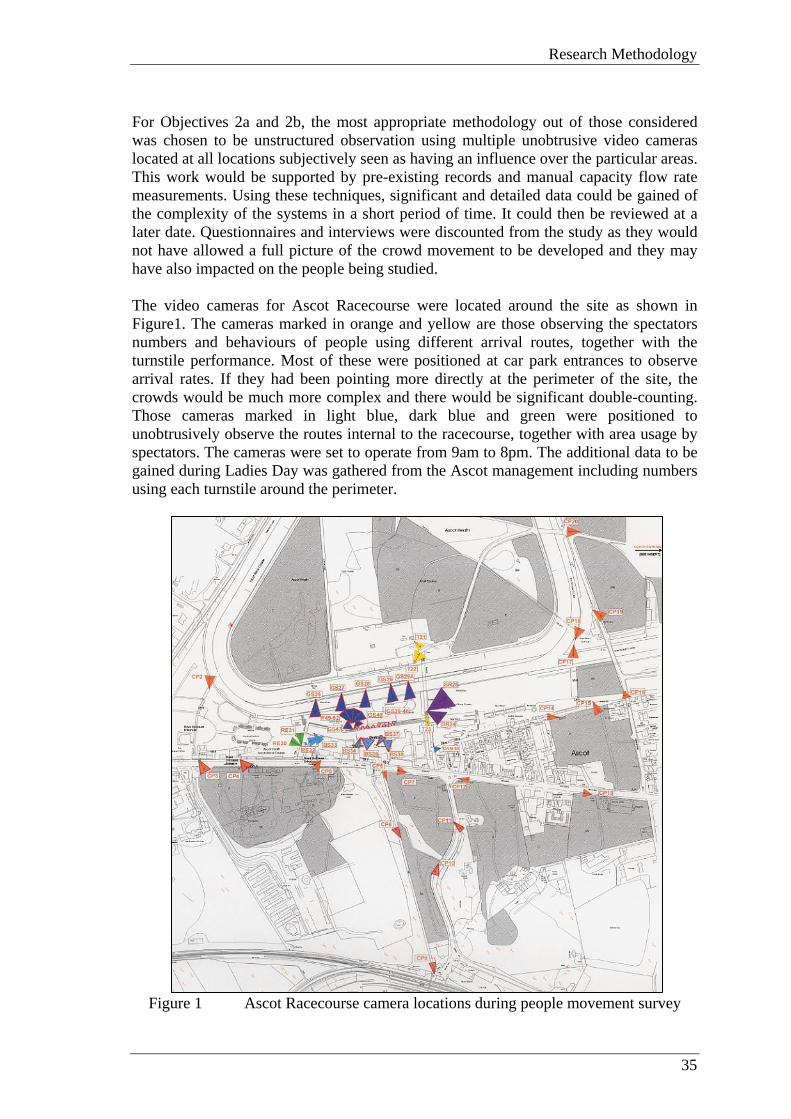
Research Methodology
35
For Objectives 2a and 2b, the most appropriate methodology out of those considered was chosen to be unstructured observation using multiple unobtrusive video cameras located at all locations subjectively seen as having an influence over the particular areas. This work would be supported by pre-existing records and manual capacity flow rate measurements. Using these techniques, significant and detailed data could be gained of the complexity of the systems in a short period of time. It could then be reviewed at a later date. Questionnaires and interviews were discounted from the study as they would not have allowed a full picture of the crowd movement to be developed and they may have also impacted on the people being studied. The video cameras for Ascot Racecourse were located around the site as shown in Figure1. The cameras marked in orange and yellow are those observing the spectators numbers and behaviours of people using different arrival routes, together with the turnstile performance. Most of these were positioned at car park entrances to observe arrival rates. If they had been pointing more directly at the perimeter of the site, the crowds would be much more complex and there would be significant double-counting. Those cameras marked in light blue, dark blue and green were positioned to unobtrusively observe the routes internal to the racecourse, together with area usage by spectators. The cameras were set to operate from 9am to 8pm. The additional data to be gained during Ladies Day was gathered from the Ascot management including numbers using each turnstile around the perimeter.
Figure 1 Ascot Racecourse camera locations during people movement survey
People Flow Modelling - Benefits, Knowledge, and Applications within Industry
36
For York Racecourse, four hand-held video recorders were to be used in a more structured way to generally observe the turnstile and gate performance around the site. The main focus for these cameras was queue length and service times at entrances. One of the most high profile and well attended days at Ascot Racecourse is Ladies Day during Royal Week, with the highest attendance day at York Racecourse being John Smiths Day. The methodology outlined here was developed for application on these days during 2001 for Ascot Racecourse and 2002 for York Racecourse. Schools Modelling (Objective 3) Following discussions with a number of school deputy headmasters, it was determined that the most important issues to forecast for schools is the maximum flow rates within circulation routes and the maximum levels of queuing at stairs. To provide generic data for a new school circulation model, the most appropriate methodology was chosen to be structured observation using multiple unobtrusive video cameras; mounted at specifically chosen locations around a school. Using this technique, significant and detailed data could be gained for a number of locations within the school in the short period of time it takes for class changeovers. It could then be reviewed at a later date. This generic data was to be supported by existing time-tabling data for the chosen test school. The input data chosen was as follows:
- times relative to the bell when teachers let their children leave a classroom - flow rates out of classrooms following class discharge - free speeds of pupils within corridors and on stairs - capacity flow rates in corridors and on stairs
(additional data on door flow rates was gained using a tally counter at King Ecgberts School in Sheffield during a 2001 survey) The test school for Objective 3 was chosen to be Deacon’s Secondary School in Peterborough, as this was to be one of the schools absorbed into a new Peterborough Academy where Buro Happold were providing engineering services. Six survey stations were selected for the gathering of the generic input data as illustrated in Figure 2. This data was gathered throughout May and June of 2004.

Research Methodology
37
Figure 2 Deacons School ‘survey stations’ during people movement survey
Together with the generic input data, localised queuing and flow rate data was also gathered at Survey Stations 3, 4, and 5. This was to be used for the testing of the developed model. The data was planned for collection during the 11:20 class changeover (movement from tutor groups) on 11th June 2004. Timetabling data was also gained for this changeover from the school management. This data provided each pupil’s specific location before and after the changeover.
Survey Station 1
Survey Station 2
Survey Station 4
Survey Station 3
Survey Station 5
Survey Station 6
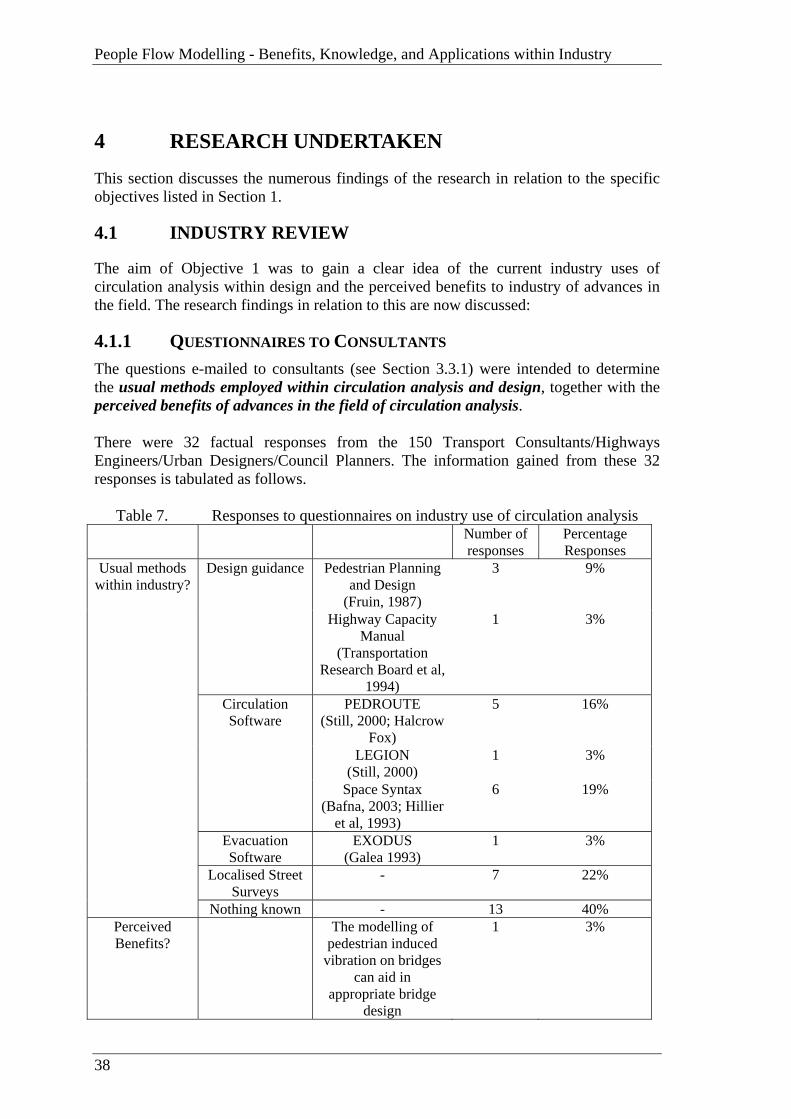
People Flow Modelling - Benefits, Knowledge, and Applications within Industry
38
4 RESEARCH UNDERTAKEN
This section discusses the numerous findings of the research in relation to the specific objectives listed in Section 1.
4.1 INDUSTRY REVIEW
The aim of Objective 1 was to gain a clear idea of the current industry uses of circulation analysis within design and the perceived benefits to industry of advances in the field. The research findings in relation to this are now discussed:
4.1.1 QUESTIONNAIRES TO CONSULTANTS The questions e-mailed to consultants (see Section 3.3.1) were intended to determine the usual methods employed within circulation analysis and design, together with the perceived benefits of advances in the field of circulation analysis. There were 32 factual responses from the 150 Transport Consultants/Highways Engineers/Urban Designers/Council Planners. The information gained from these 32 responses is tabulated as follows.
Table 7. Responses to questionnaires on industry use of circulation analysis Number of
responses Percentage Responses
Pedestrian Planning and Design
(Fruin, 1987)
3 9% Design guidance
Highway Capacity Manual
(Transportation Research Board et al,
1994)
1 3%
PEDROUTE (Still, 2000; Halcrow
Fox)
5 16%
LEGION (Still, 2000)
1 3%
Circulation Software
Space Syntax (Bafna, 2003; Hillier
et al, 1993)
6 19%
Evacuation Software
EXODUS (Galea 1993)
1 3%
Localised Street Surveys
- 7 22%
Usual methods within industry?
Nothing known - 13 40% Perceived Benefits?
The modelling of pedestrian induced
vibration on bridges can aid in
appropriate bridge design
1 3%
Research Undertaken
39
It could be expected that the 32 responses would be mainly from people who are aware of people modelling within industry; the ones not knowing choosing not to reply at all. However, the responses gained still show that there is minimal circulation analyses carried out in general throughout these industrial groups. Over 40% of the respondents wrote to say they were not aware of any modelling or analyses carried out. There was some awareness of the book Pedestrian Planning and Design (Fruin, 1987) for use in street design and the Space Syntax techniques (Bafna, 2003; Hillier et al, 1993) used for forecasting street behaviour, but this was far from the majority. Approximately one quarter of the respondents also knew about localised street surveys to determine whether crossings were needed; comparing pedestrian footfall with traffic volumes to make a judgement on crossing needs. The only other sector mentioned was train stations where 16% of respondents knew about the software PEDROUTE (Still, 2000; Halcrow Fox). However, very few people actually used software (approximately 3%). This clearly shows a low level of design input and software usage by groups who it can readily be assumed would be the main ones inputting into circulation design within the current industry.
4.1.2 INTERVIEWS OF SPECIALIST SECTOR CONSULTANTS The following responses came from the specialist consultants for the various sectors considered. The questions were again posed as ‘what are the usual methods employed within circulation analysis and design?’ and ‘what are the perceived benefits of advances in the field of circulation analysis?’. Lord Cultural Resources (museum specialists)
- A meeting was held with specialists from Lord Cultural Resources in October 2000. Overall they were not aware of any analysis or modelling currently carried out within the industry. They could also not see significant benefits being provided in this area of any advances in the field .
Theatre Projects Consultants (theatre specialists) - A meeting was held with specialists from TPC in
December 2000. They were also not aware of any analysis or modelling currently carried out within the industry. However, there were significant benefits noted, with the specific quote provided as follows:
‘ - relationship of bar to auditorium entrance lobbies
- location and number of toilets - vision of crowding preventing or determining routes - when does aisle width become counter-productive; are narrower aisles
more effective for movement - counter shape and location of box office - handrails – effective or obstructive?

People Flow Modelling - Benefits, Knowledge, and Applications within Industry
40
- Emergency lighting – how often have theatres been successfully evacuated under these conditions?
- Effectiveness of managed escapes – do ushers work? - Effect of new emergency announcement systems? ……’
Consarc Design (hotel architects)
- A meeting was held with architects from Consarc Design in December 2000. Overall they not aware of any analysis or modelling currently carried out within the industry. They could also not see significant benefits being provided in this area of any advances in the field .
Eric Khune & Associates (retail specialists)
- At a meeting with Eric Khune in 2003, once again he was not aware of any specific analysis or modelling carried out within the industry except for evacuation modelling. However, he showed
considerable interest in people modelling in general for forecasting footfall within large-scale shopping complexes.
Seymour Harris Keppie (school architects) & Bryanston Square (educational consultants)
- At a meeting with SHK in 2004 they showed no awareness of any modelling or analysis currently carried out within industry. They thought that benefits did exist but that no architect would pay for the use of analysis unless it was a client requirement or was part of the ITN briefing documents for PFI schools. At a meeting with Bryanston Square in January 2005, once again there was no awareness of circulation analysis or modelling but significant interest was noted in relation to circulation modelling and the impact of pastoral systems, stair/corridor provisions, and cloakroom design/management.
It can be concluded from the samples taken that, depending upon the sector, industry does recognise a value of people modelling and advances in circulation analysis. However, it was evident that there were only minimal quantified people modelling analyses carried out in the sectors studied.
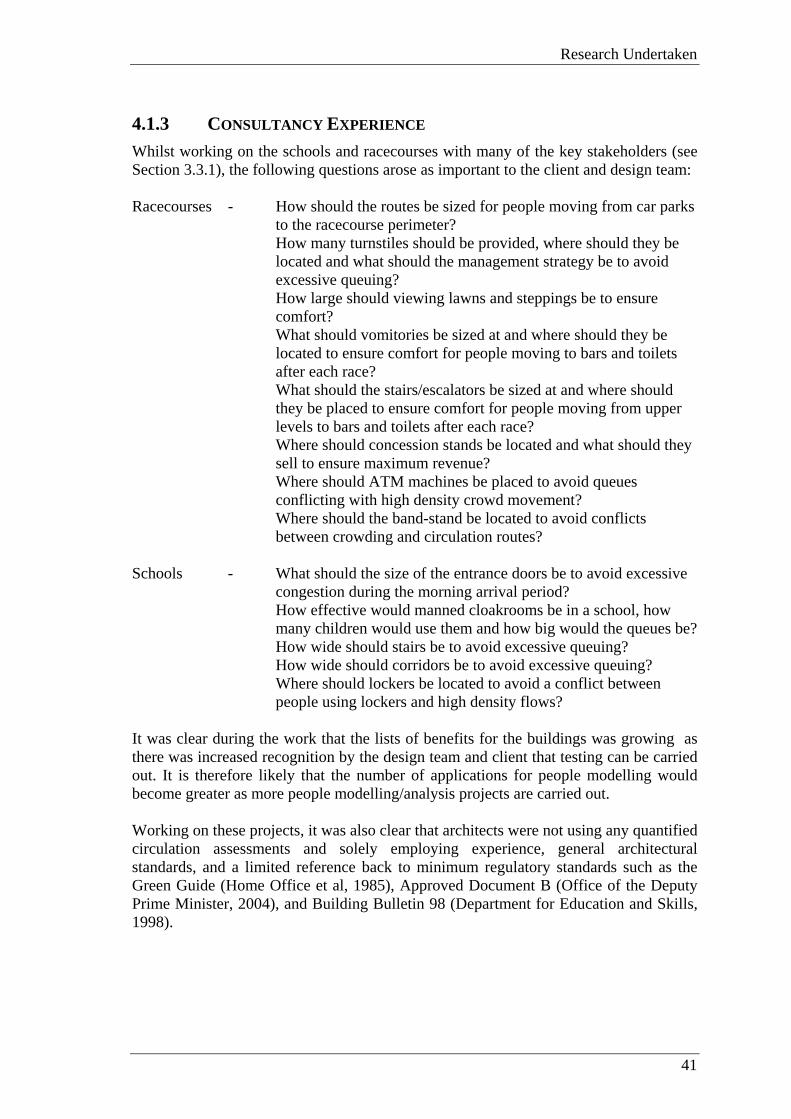
Research Undertaken
41
4.1.3 CONSULTANCY EXPERIENCE Whilst working on the schools and racecourses with many of the key stakeholders (see Section 3.3.1), the following questions arose as important to the client and design team: Racecourses - How should the routes be sized for people moving from car parks
to the racecourse perimeter? How many turnstiles should be provided, where should they be located and what should the management strategy be to avoid excessive queuing? How large should viewing lawns and steppings be to ensure comfort? What should vomitories be sized at and where should they be located to ensure comfort for people moving to bars and toilets after each race? What should the stairs/escalators be sized at and where should they be placed to ensure comfort for people moving from upper levels to bars and toilets after each race? Where should concession stands be located and what should they sell to ensure maximum revenue? Where should ATM machines be placed to avoid queues conflicting with high density crowd movement? Where should the band-stand be located to avoid conflicts between crowding and circulation routes?
Schools - What should the size of the entrance doors be to avoid excessive
congestion during the morning arrival period? How effective would manned cloakrooms be in a school, how many children would use them and how big would the queues be? How wide should stairs be to avoid excessive queuing? How wide should corridors be to avoid excessive queuing? Where should lockers be located to avoid a conflict between people using lockers and high density flows?
It was clear during the work that the lists of benefits for the buildings was growing as there was increased recognition by the design team and client that testing can be carried out. It is therefore likely that the number of applications for people modelling would become greater as more people modelling/analysis projects are carried out. Working on these projects, it was also clear that architects were not using any quantified circulation assessments and solely employing experience, general architectural standards, and a limited reference back to minimum regulatory standards such as the Green Guide (Home Office et al, 1985), Approved Document B (Office of the Deputy Prime Minister, 2004), and Building Bulletin 98 (Department for Education and Skills, 1998).

People Flow Modelling - Benefits, Knowledge, and Applications within Industry
42
4.2 STADIUM REVIEW (I)
The aim of Objective 2a was to determine if the complexity of people movement around a venue is being sufficiently accounted for within current practice. Following the methodology outlined in the preceding sections, information and data were gathered for all areas impacting on the performance of the various chosen provisions. The provisions and influences assessed are listed in the following table.
Table 8. Provisions and influences considered in Stadium Review (i) Provision Location Influences
Turnstiles/Entrances Ascot Racecourse and York
Racecourse
- pedestrian arrival profiles - car/coach park locations and the associated arrival direction - vehicle/pedestrian interaction - service times
Egress Routes from Viewing
Ascot Racecourse and York
Racecourse
- spectator viewing numbers - route locations - rates of passage
End of Day Egress Routes Ascot Racecourse - pedestrian departure profile - entertainment provisions
The performance of these provisions can be directly related back to contemporary guidance to gain an understanding of the influence of complexity. Each of the provisions is considered now and discussed in detail within Conference Paper 1 (Appendix A).
4.2.1 TURNSTILE/ENTRANCE PERFORMANCE (ASCOT & YORK RACECOURSE)
The first focus area here was the Ascot High St turnstiles. There are 15 turnstiles within these turnstile banks and they were observed to perform well for the number of persons using them; with sporadic queueing never exceeding 5-10. However, the Green Guide (Home Office et al, 1985) would have recommended there to be 19 turnstiles in place for the number of occupants served. The reason for the adequate performance despite the guidance standard is shown within Conference Paper 1 in Appendix A to be due to the significantly lower arrival rate at a racecourse compared with a football or rugby ground; as is the basis for much of the Green Guide (Home Office et al, 1985) recommendations. The highest arrival rate at Ascot Racecourse was measured to be from the Northern car parks where there is picnicking up until the start of the race, at which point there is a large migration towards the racecourse enclosures and race viewing areas. In this location there remains a maximum arrival percentage of only 45%, compared with that measured at a football stadium of approximately 80% in one hour. However, a complexity issue that acted negatively on the performance of the turnstiles was due to the car/coach park locations leading to most of the occupants arriving at the entrance from the east and not central to the entrance (see Figure 3).
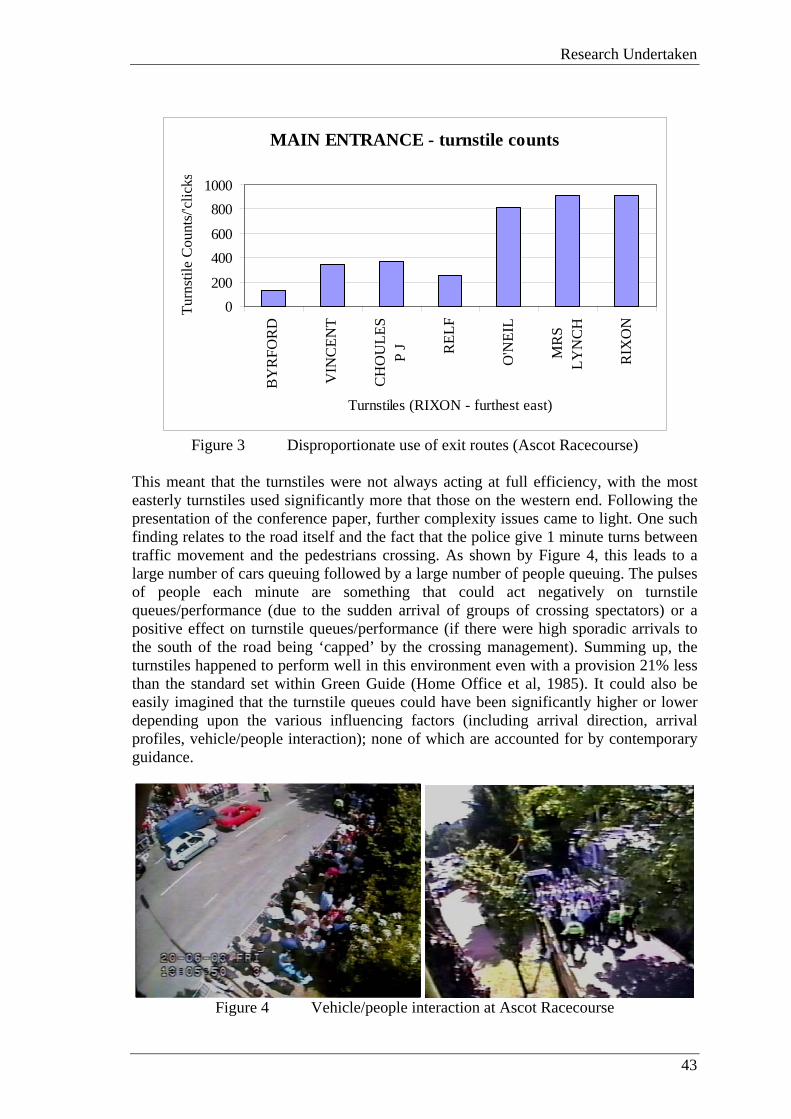
Research Undertaken
43
MAIN ENTRANCE - turnstile counts
0200
400600
8001000
BY
RFO
RD
VIN
CEN
T
CH
OU
LES
P J REL
F
O'N
EIL
MR
SLY
NC
H
RIX
ON
Turnstiles (RIXON - furthest east)
Turn
stile
Cou
nts/
'clic
ks
Figure 3 Disproportionate use of exit routes (Ascot Racecourse)
This meant that the turnstiles were not always acting at full efficiency, with the most easterly turnstiles used significantly more that those on the western end. Following the presentation of the conference paper, further complexity issues came to light. One such finding relates to the road itself and the fact that the police give 1 minute turns between traffic movement and the pedestrians crossing. As shown by Figure 4, this leads to a large number of cars queuing followed by a large number of people queuing. The pulses of people each minute are something that could act negatively on turnstile queues/performance (due to the sudden arrival of groups of crossing spectators) or a positive effect on turnstile queues/performance (if there were high sporadic arrivals to the south of the road being ‘capped’ by the crossing management). Summing up, the turnstiles happened to perform well in this environment even with a provision 21% less than the standard set within Green Guide (Home Office et al, 1985). It could also be easily imagined that the turnstile queues could have been significantly higher or lower depending upon the various influencing factors (including arrival direction, arrival profiles, vehicle/people interaction); none of which are accounted for by contemporary guidance.
Figure 4 Vehicle/people interaction at Ascot Racecourse
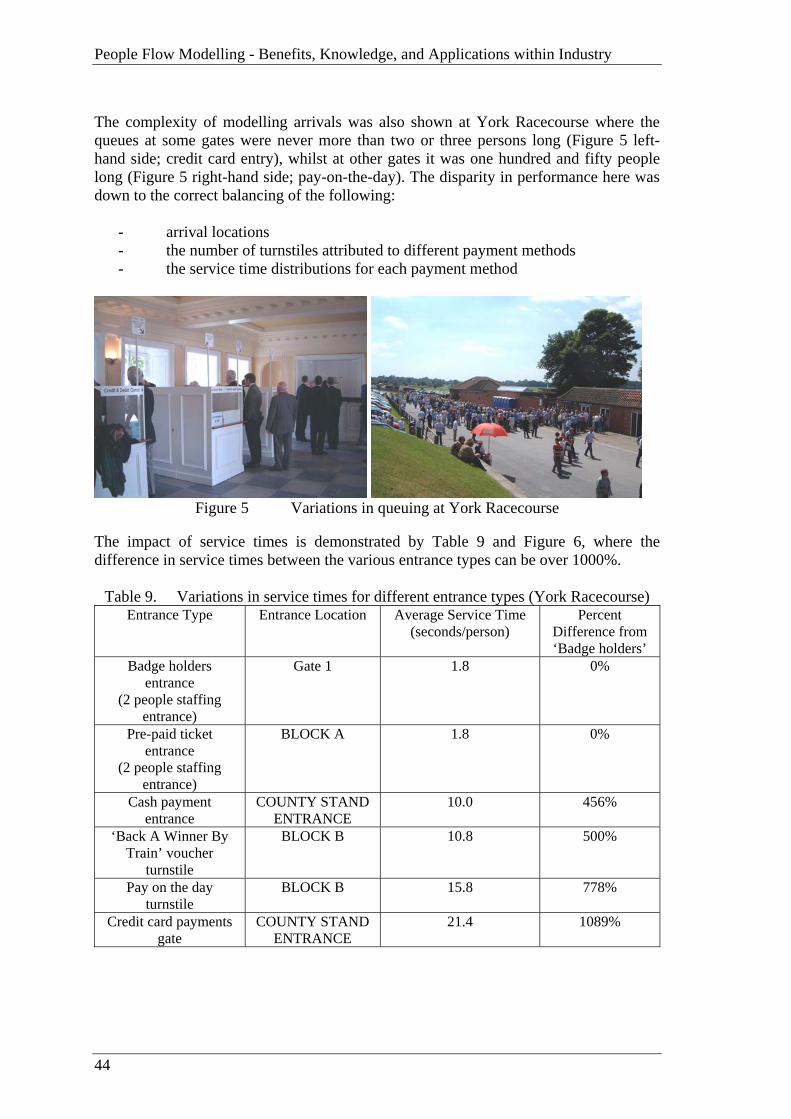
People Flow Modelling - Benefits, Knowledge, and Applications within Industry
44
The complexity of modelling arrivals was also shown at York Racecourse where the queues at some gates were never more than two or three persons long (Figure 5 left-hand side; credit card entry), whilst at other gates it was one hundred and fifty people long (Figure 5 right-hand side; pay-on-the-day). The disparity in performance here was down to the correct balancing of the following:
- arrival locations - the number of turnstiles attributed to different payment methods - the service time distributions for each payment method
Figure 5 Variations in queuing at York Racecourse
The impact of service times is demonstrated by Table 9 and Figure 6, where the difference in service times between the various entrance types can be over 1000%.
Table 9. Variations in service times for different entrance types (York Racecourse) Entrance Type Entrance Location Average Service Time
(seconds/person) Percent
Difference from ‘Badge holders’
Badge holders entrance
(2 people staffing entrance)
Gate 1 1.8 0%
Pre-paid ticket entrance
(2 people staffing entrance)
BLOCK A 1.8 0%
Cash payment entrance
COUNTY STAND ENTRANCE
10.0 456%
‘Back A Winner By Train’ voucher
turnstile
BLOCK B 10.8 500%
Pay on the day turnstile
BLOCK B 15.8 778%
Credit card payments gate
COUNTY STAND ENTRANCE
21.4 1089%
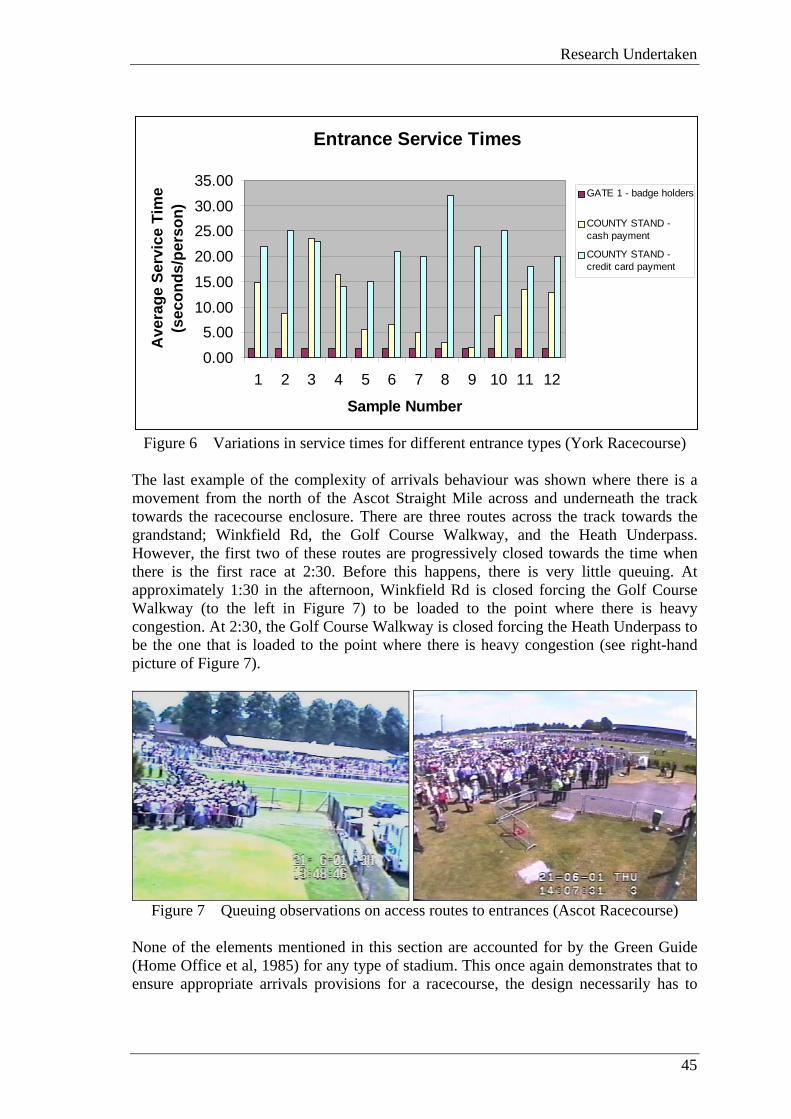
Research Undertaken
45
Entrance Service Times
0.005.00
10.0015.0020.0025.0030.0035.00
1 2 3 4 5 6 7 8 9 10 11 12
Sample Number
Ave
rage
Ser
vice
Tim
e (s
econ
ds/p
erso
n)GATE 1 - badge holders
COUNTY STAND -cash payment
COUNTY STAND -credit card payment
Figure 6 Variations in service times for different entrance types (York Racecourse)
The last example of the complexity of arrivals behaviour was shown where there is a movement from the north of the Ascot Straight Mile across and underneath the track towards the racecourse enclosure. There are three routes across the track towards the grandstand; Winkfield Rd, the Golf Course Walkway, and the Heath Underpass. However, the first two of these routes are progressively closed towards the time when there is the first race at 2:30. Before this happens, there is very little queuing. At approximately 1:30 in the afternoon, Winkfield Rd is closed forcing the Golf Course Walkway (to the left in Figure 7) to be loaded to the point where there is heavy congestion. At 2:30, the Golf Course Walkway is closed forcing the Heath Underpass to be the one that is loaded to the point where there is heavy congestion (see right-hand picture of Figure 7).
Figure 7 Queuing observations on access routes to entrances (Ascot Racecourse)
None of the elements mentioned in this section are accounted for by the Green Guide (Home Office et al, 1985) for any type of stadium. This once again demonstrates that to ensure appropriate arrivals provisions for a racecourse, the design necessarily has to
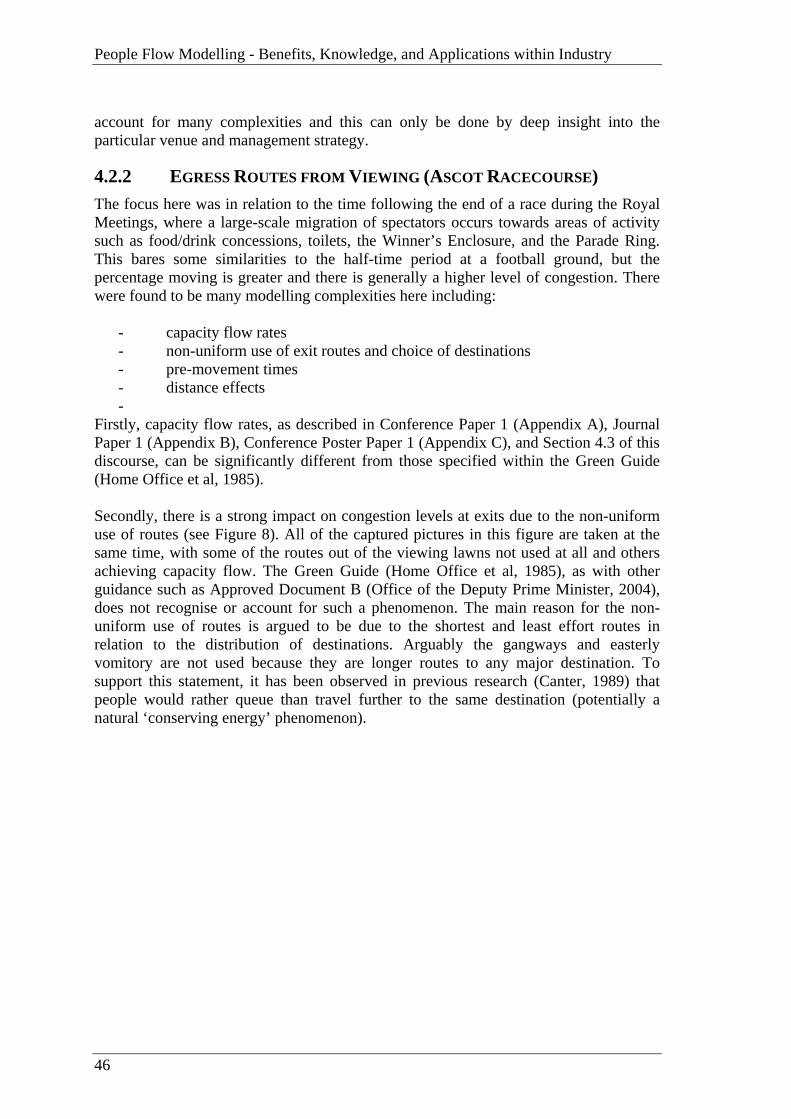
People Flow Modelling - Benefits, Knowledge, and Applications within Industry
46
account for many complexities and this can only be done by deep insight into the particular venue and management strategy.
4.2.2 EGRESS ROUTES FROM VIEWING (ASCOT RACECOURSE) The focus here was in relation to the time following the end of a race during the Royal Meetings, where a large-scale migration of spectators occurs towards areas of activity such as food/drink concessions, toilets, the Winner’s Enclosure, and the Parade Ring. This bares some similarities to the half-time period at a football ground, but the percentage moving is greater and there is generally a higher level of congestion. There were found to be many modelling complexities here including:
- capacity flow rates - non-uniform use of exit routes and choice of destinations - pre-movement times - distance effects -
Firstly, capacity flow rates, as described in Conference Paper 1 (Appendix A), Journal Paper 1 (Appendix B), Conference Poster Paper 1 (Appendix C), and Section 4.3 of this discourse, can be significantly different from those specified within the Green Guide (Home Office et al, 1985). Secondly, there is a strong impact on congestion levels at exits due to the non-uniform use of routes (see Figure 8). All of the captured pictures in this figure are taken at the same time, with some of the routes out of the viewing lawns not used at all and others achieving capacity flow. The Green Guide (Home Office et al, 1985), as with other guidance such as Approved Document B (Office of the Deputy Prime Minister, 2004), does not recognise or account for such a phenomenon. The main reason for the non-uniform use of routes is argued to be due to the shortest and least effort routes in relation to the distribution of destinations. Arguably the gangways and easterly vomitory are not used because they are longer routes to any major destination. To support this statement, it has been observed in previous research (Canter, 1989) that people would rather queue than travel further to the same destination (potentially a natural ‘conserving energy’ phenomenon).

Research Undertaken
47
Figure 8 Disproportionate use of exit routes (Ascot Racecourse)
The third demonstration of complexity impacting on performance of egress routes relates to the pre-movement times for people leaving viewing accommodation after a race (happening six times a day, together with at the end of the day during departures). During observations, it was evident that people generally do not move at one single time; with the distribution of times measured to be over approximately seven minutes (see Figure 9). This is quite different to the observed movement at such as a theatre during an opera, where it has been observed within this research that over 90% of the auditorium rose off their seats and started to move within the first 10 seconds of the interval starting (observations made at the Royal Opera House in London).
Figure 9 Pre-movement times for spectators leaving lawns (Ascot Racecourse)
The final point for egress routes relates to the impact of the distance people have to move from their viewing position to the egress route. On the Ascot viewing lawns (see Figure 8) this can vary between 0m and 150m, with people and obstacles slowing the time of arrival at exits even further.
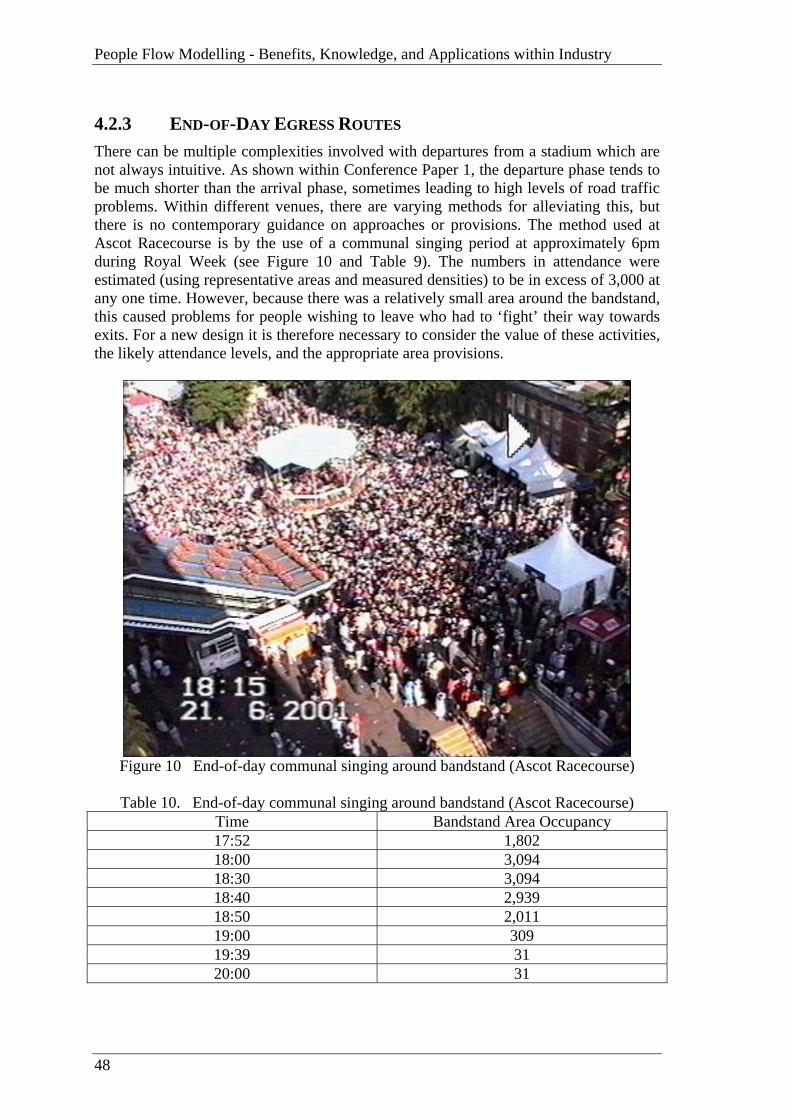
People Flow Modelling - Benefits, Knowledge, and Applications within Industry
48
4.2.3 END-OF-DAY EGRESS ROUTES There can be multiple complexities involved with departures from a stadium which are not always intuitive. As shown within Conference Paper 1, the departure phase tends to be much shorter than the arrival phase, sometimes leading to high levels of road traffic problems. Within different venues, there are varying methods for alleviating this, but there is no contemporary guidance on approaches or provisions. The method used at Ascot Racecourse is by the use of a communal singing period at approximately 6pm during Royal Week (see Figure 10 and Table 9). The numbers in attendance were estimated (using representative areas and measured densities) to be in excess of 3,000 at any one time. However, because there was a relatively small area around the bandstand, this caused problems for people wishing to leave who had to ‘fight’ their way towards exits. For a new design it is therefore necessary to consider the value of these activities, the likely attendance levels, and the appropriate area provisions.
Figure 10 End-of-day communal singing around bandstand (Ascot Racecourse)
Table 10. End-of-day communal singing around bandstand (Ascot Racecourse)
Time Bandstand Area Occupancy 17:52 1,802 18:00 3,094 18:30 3,094 18:40 2,939 18:50 2,011 19:00 309 19:39 31 20:00 31
Research Undertaken
49
4.3 STADIUM REVIEW (II)
The aim of Objective 2b was to determine if the individuality of specific venues is being sufficiently accounted for within current practice. For this objective, the provisions chosen were the main ‘vomitory’ at Ascot Racecourse leading from the Grandstand viewing lawns into the Grandstand, a stair leading under the Members Enclosure and a final egress stair from the Grandstand. The generalities considered here are capacity flow rates, where arguably the only specific guidance is provided. In line with the methodology provided in the preceding sections, detailed and extensive video footage was gained of these circulation and egress routes. The detailed methodology and findings are provided within Journal Paper 1 in Appendix B and Conference Poster Paper 1 in Appendix C. The conclusions coming from the papers show that it is possible for capacity flow rates within venues such as the racecourse to be over 50% lower than the guidance values, leading to twice the expected time for egress, ingress, or evacuation. The results relate back to the complexity issues discussed within Section 4.2. The venue specific elements impacting upon capacity flow rates were postulated to be:
- level of crowd determination - level of crowd experience in high density flows - proportion of females - proportion of older aged occupants - potential for counter flow - potential for ‘forced flow’ phenomenon (where density exceeds the value
where optimum capacity flow occurs) Additional complexity issues were noted to reduce the flows even further including obstacles and social gathering behaviour. This specific sort of behaviour has not been written about before within research papers on high density flows and will vary depending upon the venue. The contemporary guidance also does not reference such occurrences or provide guidance on the impact on flow rates. After making it clear why it was important to move beyond contemporary guidance, Journal Paper 1 and Conference Poster Paper 1 (Appendix B and C respectively) gave additional advice on methods of determining more appropriate values for specific venues.
4.4 SCHOOLS MODELLING
The aim of Objective 3 was to develop and test a new approach for modelling pupil movement around schools. In line with the methodology provided in the preceding sections, detailed and extensive video data was gathered of circulation behaviour around the test school. A generic approach was then developed and tested against capacity flow rates and queue lengths at the school. Details of this approach and the tests carried out are provided within Journal Paper 2 in Appendix D. The tests carried out on the approach were successful, demonstrating that the methodology can provide good indicative predictions for both flow rates and queuing
People Flow Modelling - Benefits, Knowledge, and Applications within Industry
50
levels. A number of sensitivity tests were also carried out to aid in the use of the approach and further research developments. The approach developed is generic in nature because it provides realistic forecasts using the information available during the design process. Existing timetables can be used (from previous schools) for placing numbers of pupils in classrooms, planned tutor group management rules employed to determine destinations for each pupil, and the gathered movement data (from the test school) appropriately applied to any school.
4.5 APPLICATION OF KNOWLEDGE
The specific aim of Objective 4 was to ensure the developed knowledge for racecourses and approach for schools were practical for use within design. The following examples give areas where the generically deeper understanding of people movement behaviour has significantly improved the design of Ascot Racecourse and how the new generic schools modelling approach has already benefited a number of school designs.
4.5.1 STADIA DESIGN 4.5.1.1 Arrival route design The progressive closing of routes at Ascot Racecourse effectively reduced the arrival capacity across the straight mile by more than 2/3 causing significant congestion to occur during Royal Week. Understanding this phenomenon has enabled the problem to be minimised within the new design by providing a new tunnel that allows all major routes to be permanently open. Also, the understanding of flow rates has lead to the new design of a ramp for one of the routes (where stairs previously existed) with a gradient which is less than 5%. This gradient will ensure there is minimal impact on flow performance. Also, understanding that the direction of arrivals and interaction with traffic have a significant effect on entry performance enabled a holistic design to be produced for the new main entrance at Ascot Racecourse including asymmetric entrance provisions, continued use of the existing subway, and the provision of a new route approaching the centre of the entrance (see Figure 11).
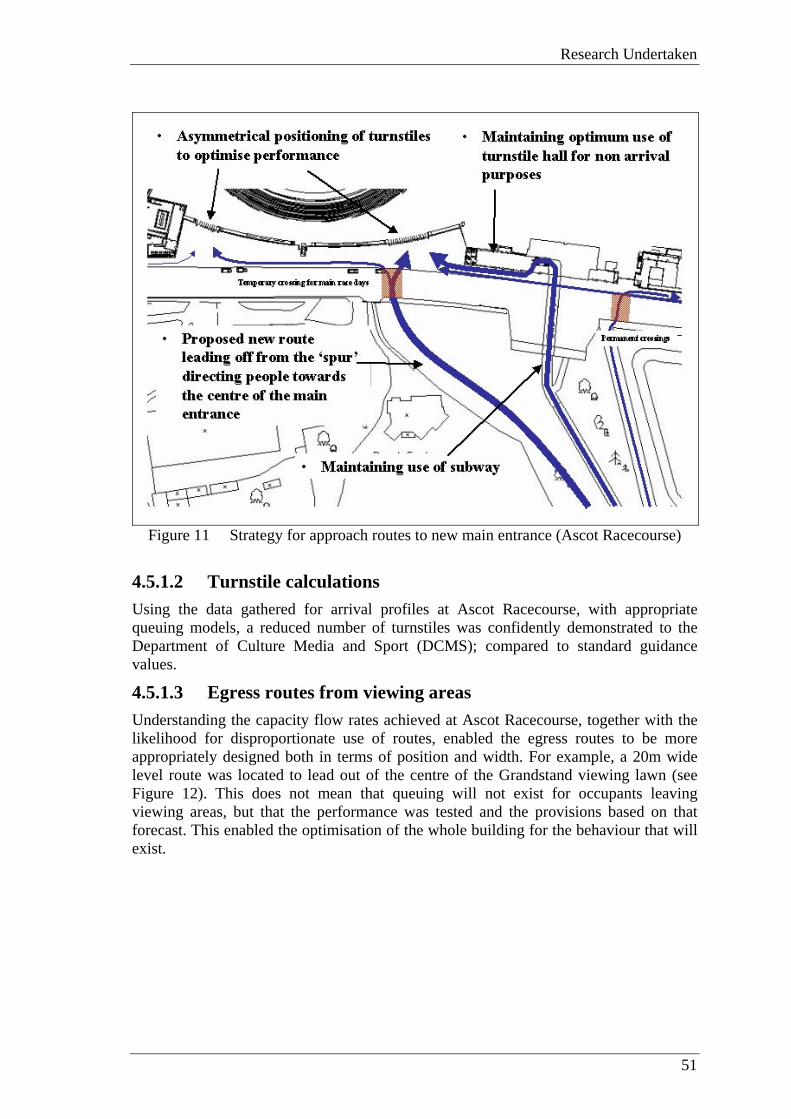
Research Undertaken
51
Figure 11 Strategy for approach routes to new main entrance (Ascot Racecourse)
4.5.1.2 Turnstile calculations Using the data gathered for arrival profiles at Ascot Racecourse, with appropriate queuing models, a reduced number of turnstiles was confidently demonstrated to the Department of Culture Media and Sport (DCMS); compared to standard guidance values.
4.5.1.3 Egress routes from viewing areas Understanding the capacity flow rates achieved at Ascot Racecourse, together with the likelihood for disproportionate use of routes, enabled the egress routes to be more appropriately designed both in terms of position and width. For example, a 20m wide level route was located to lead out of the centre of the Grandstand viewing lawn (see Figure 12). This does not mean that queuing will not exist for occupants leaving viewing areas, but that the performance was tested and the provisions based on that forecast. This enabled the optimisation of the whole building for the behaviour that will exist.
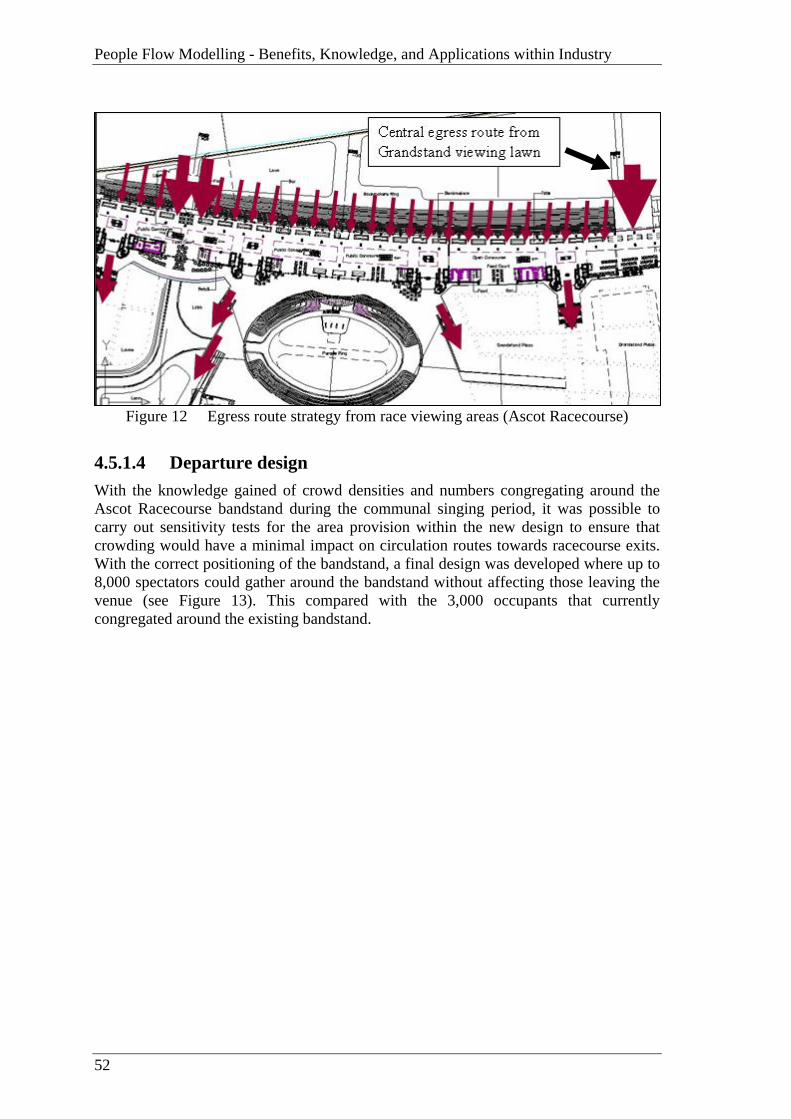
People Flow Modelling - Benefits, Knowledge, and Applications within Industry
52
Figure 12 Egress route strategy from race viewing areas (Ascot Racecourse)
4.5.1.4 Departure design With the knowledge gained of crowd densities and numbers congregating around the Ascot Racecourse bandstand during the communal singing period, it was possible to carry out sensitivity tests for the area provision within the new design to ensure that crowding would have a minimal impact on circulation routes towards racecourse exits. With the correct positioning of the bandstand, a final design was developed where up to 8,000 spectators could gather around the bandstand without affecting those leaving the venue (see Figure 13). This compared with the 3,000 occupants that currently congregated around the existing bandstand.
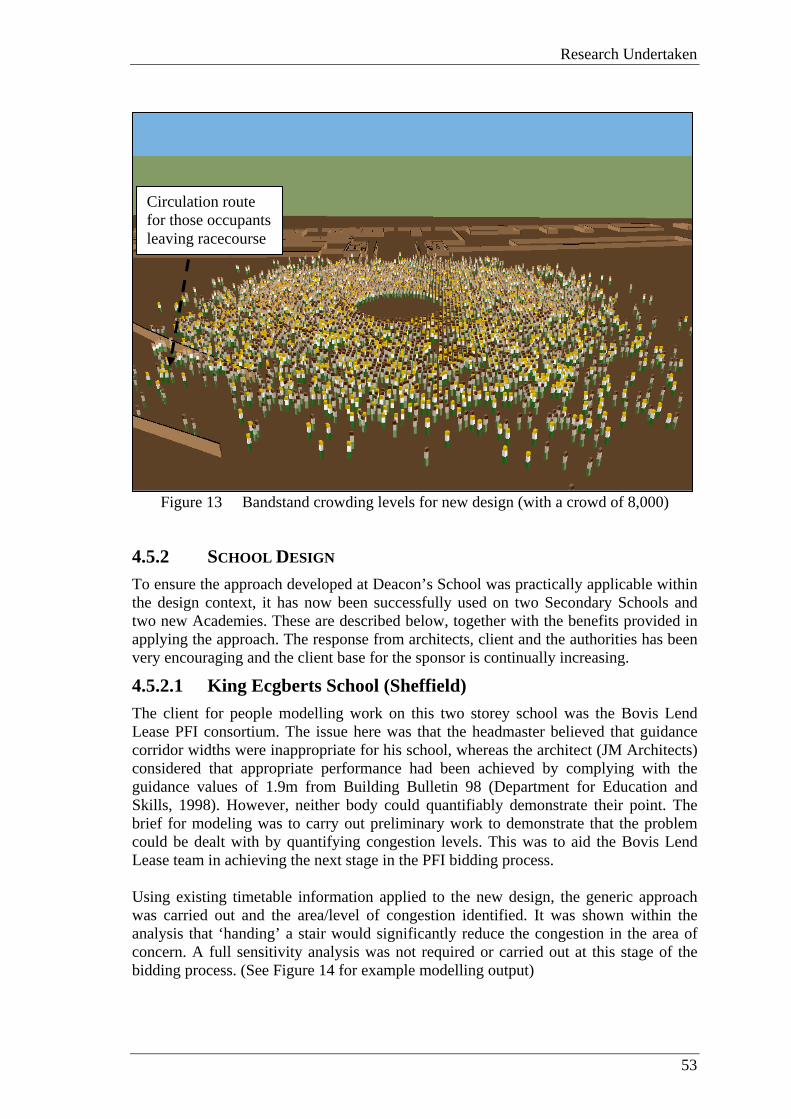
Research Undertaken
53
Figure 13 Bandstand crowding levels for new design (with a crowd of 8,000)
4.5.2 SCHOOL DESIGN To ensure the approach developed at Deacon’s School was practically applicable within the design context, it has now been successfully used on two Secondary Schools and two new Academies. These are described below, together with the benefits provided in applying the approach. The response from architects, client and the authorities has been very encouraging and the client base for the sponsor is continually increasing.
4.5.2.1 King Ecgberts School (Sheffield) The client for people modelling work on this two storey school was the Bovis Lend Lease PFI consortium. The issue here was that the headmaster believed that guidance corridor widths were inappropriate for his school, whereas the architect (JM Architects) considered that appropriate performance had been achieved by complying with the guidance values of 1.9m from Building Bulletin 98 (Department for Education and Skills, 1998). However, neither body could quantifiably demonstrate their point. The brief for modeling was to carry out preliminary work to demonstrate that the problem could be dealt with by quantifying congestion levels. This was to aid the Bovis Lend Lease team in achieving the next stage in the PFI bidding process. Using existing timetable information applied to the new design, the generic approach was carried out and the area/level of congestion identified. It was shown within the analysis that ‘handing’ a stair would significantly reduce the congestion in the area of concern. A full sensitivity analysis was not required or carried out at this stage of the bidding process. (See Figure 14 for example modelling output)
Circulation route for those occupants leaving racecourse
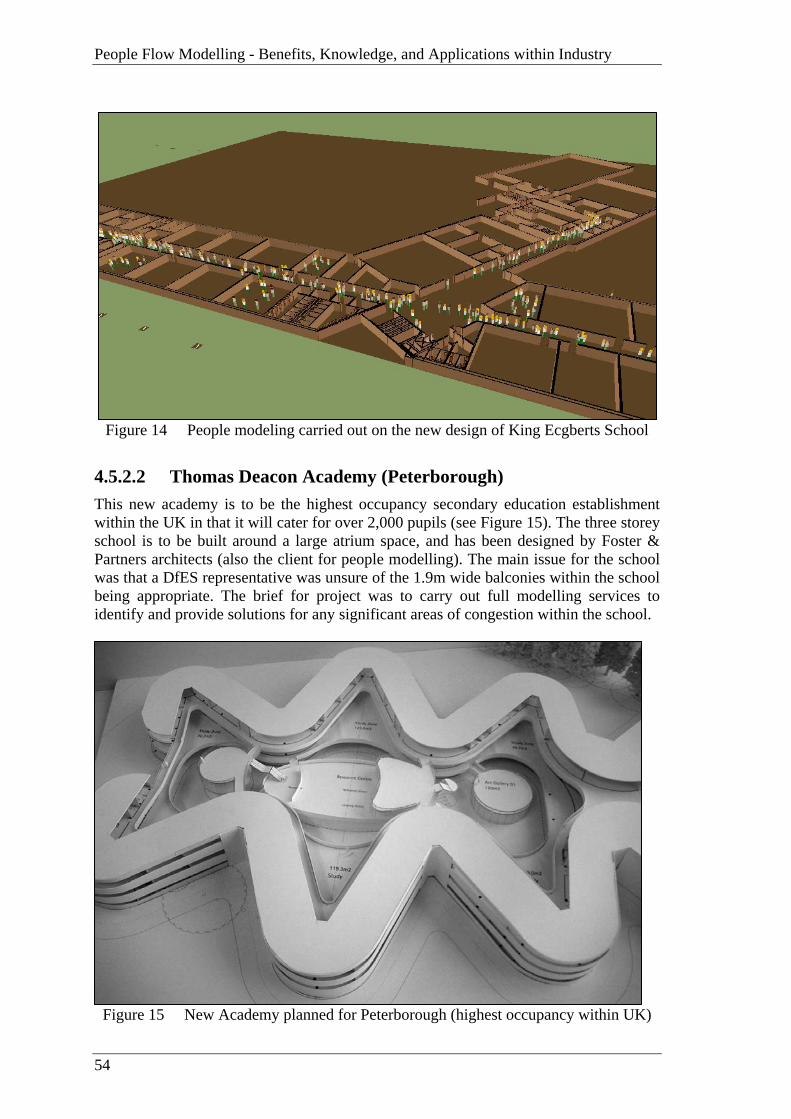
People Flow Modelling - Benefits, Knowledge, and Applications within Industry
54
Figure 14 People modeling carried out on the new design of King Ecgberts School
4.5.2.2 Thomas Deacon Academy (Peterborough) This new academy is to be the highest occupancy secondary education establishment within the UK in that it will cater for over 2,000 pupils (see Figure 15). The three storey school is to be built around a large atrium space, and has been designed by Foster & Partners architects (also the client for people modelling). The main issue for the school was that a DfES representative was unsure of the 1.9m wide balconies within the school being appropriate. The brief for project was to carry out full modelling services to identify and provide solutions for any significant areas of congestion within the school.
Figure 15 New Academy planned for Peterborough (highest occupancy within UK)
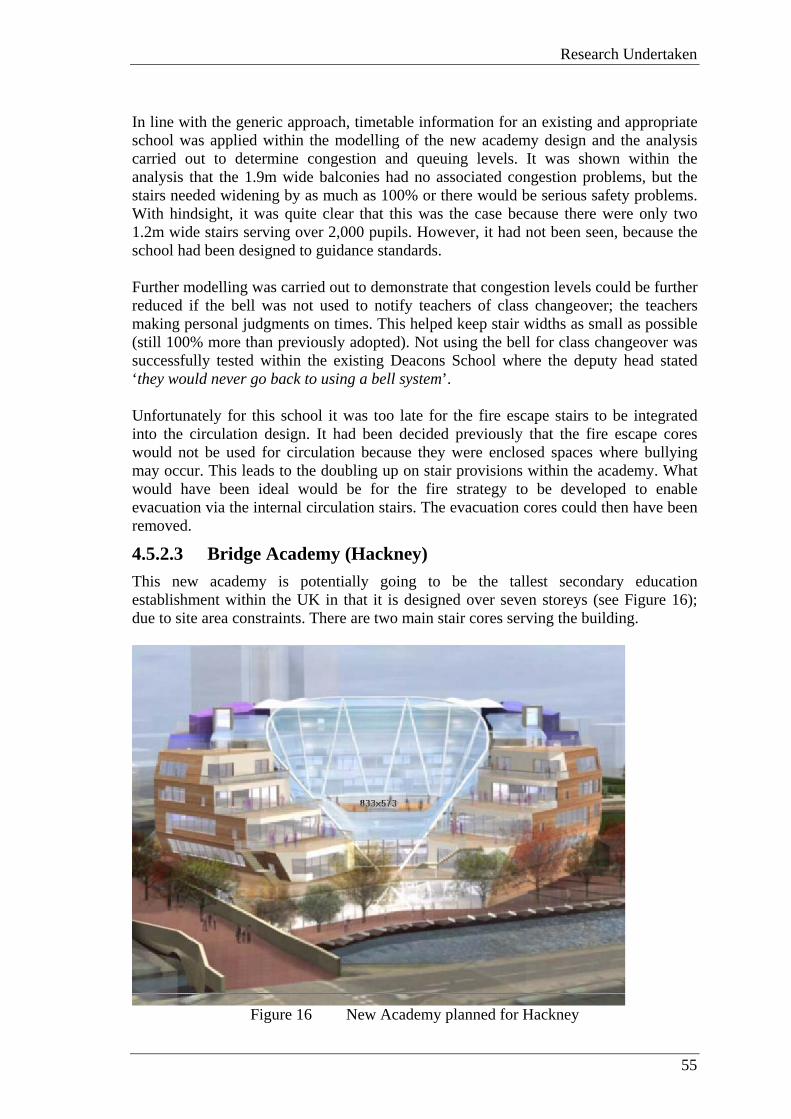
Research Undertaken
55
In line with the generic approach, timetable information for an existing and appropriate school was applied within the modelling of the new academy design and the analysis carried out to determine congestion and queuing levels. It was shown within the analysis that the 1.9m wide balconies had no associated congestion problems, but the stairs needed widening by as much as 100% or there would be serious safety problems. With hindsight, it was quite clear that this was the case because there were only two 1.2m wide stairs serving over 2,000 pupils. However, it had not been seen, because the school had been designed to guidance standards. Further modelling was carried out to demonstrate that congestion levels could be further reduced if the bell was not used to notify teachers of class changeover; the teachers making personal judgments on times. This helped keep stair widths as small as possible (still 100% more than previously adopted). Not using the bell for class changeover was successfully tested within the existing Deacons School where the deputy head stated ‘they would never go back to using a bell system’. Unfortunately for this school it was too late for the fire escape stairs to be integrated into the circulation design. It had been decided previously that the fire escape cores would not be used for circulation because they were enclosed spaces where bullying may occur. This leads to the doubling up on stair provisions within the academy. What would have been ideal would be for the fire strategy to be developed to enable evacuation via the internal circulation stairs. The evacuation cores could then have been removed.
4.5.2.3 Bridge Academy (Hackney) This new academy is potentially going to be the tallest secondary education establishment within the UK in that it is designed over seven storeys (see Figure 16); due to site area constraints. There are two main stair cores serving the building.
Figure 16 New Academy planned for Hackney

People Flow Modelling - Benefits, Knowledge, and Applications within Industry
56
The client for people modeling work was the educationalist Bryanston Square and the brief was to carry out a general assessment of circulation performance. For this school, using the generic approach demonstrated that there was going to be significant problems due to the provision of only two stairs within a school where the main movement patterns were vertical. At this stage of the design, there was minimal input that could be made to the layout. The changes which were employed were in relation to the location where the highest levels of congestion were forecast to occur (on the landing half-way up the most integrated staircase). In this area, it was predicted that over 40% of the time there would be queuing of over 30 pupils on the landing (see Figure 17). The solution recommended was to change the rooms directly adjacent to this area to be rooms of little movement (6th form rooms, admin etc). This reduced the occurrence to 10% without significantly impacting on the rest of the school.
Figure 17 Congestion levels forecast for Bridge Academy in Hackney
4.5.2.4 Minster School (Nottingham) This new secondary school was a ‘traditional’ style two/three storey school found in most UK cities. For this project the architect (Penoyre and Prasad) wished to have an integrated fire and circulation strategy. This was ideal for the school because it allowed an integrated approach where the evacuation and circulation stairs would have been one and the same. Through the application of the generic modelling approach and reviewing the results in light of the fire strategy, the optimum design for this school was arguably achieved. All routes are multi-purpose, with the circulation flows being evenly distributed around the school and minimal congestion forecast.
Key Findings & Implications
57
5 KEY FINDINGS & IMPLICATIONS
5.1 THE KEY FINDINGS OF THE RESEARCH
It has been shown within Objective 1 of this research that detailed and thorough circulation analysis is not prevalent within the current design community, a fact which is true for all building types reviewed; inclusive of racecourses and schools. However, it was also shown for building types such as theatres, retail, stadia/racecourses and schools that industry could see significant benefits of advances in this area. The following provides the specific findings of the research in relation to the design of stadia and schools. However, it is reasonable to state that the conclusions in relation to complexity and venue specific behaviour will be generally applicable to circulation analyses for all building types.
5.1.1 STADIUM REVIEW (I) To summarise the key finding from this work, it has been demonstrated within the first stadium review that there are significant levels of complexity to be taken into account when ensuring appropriate circulation provisions for a building. Very little of this is addressed within contemporary design guidance or current practice. The complexity for a stadium necessarily includes consideration of the following: Arrivals
- arrival period (different between stadia types) - arrival direction at entrances - interaction with traffic - entrance types and associated service times
Internal Circulation Routes
- capacity flow rates - non-uniform use of exit routes - pre-movement times - distance effects - obstacles - social behaviour
Departure - methods of slowing departure periods As noted, there is clear evidence why circulation provisions can not simply be accounted for by the basic guidance calculations contained within such as the Green Guide (Home Office et al, 1985). Within this discourse and associated papers, a number of recommendations have been made for ways of addressing this complexity (supported by new data and understandings). In relation to design guidance, it is recommended that new clauses are written similar to that being proposed for schools (see Section 4.5)
People Flow Modelling - Benefits, Knowledge, and Applications within Industry
58
where the onus is put on the designer to demonstrate appropriate consideration is being given to the specific issues relevant to their venue.
5.1.2 STADIUM REVIEW (II) Within the second stadia review, it was demonstrated that different building types (even within the same sector such as sports/stadia) can exhibit very different people flow phenomena. An example of this has been clearly shown for sports stadia, where the following evidence has been given for racecourses: • Within non-football/rugby stadia environments such as Ascot Racecourse it was
shown that significantly lower capacity flow rates than the Green Guide (Home Office et al, 1985) values do occur. This has been noted for both level routes and stairs and provides first stage evidence that the flow rates occurring within highly charged football and rugby crowds (used as generic stadia guidance values) are the maximum that would be achieved within a stadium and not applicable to all stadia types. This leads to the idea that there is potentially a graduated range of flow rates for different environments. Based on the Ascot Racecourse case study, the likely influences have been shown to be as follows:
- level of determination within the crowd - level of experience of spectators in high density flows - proportion of females - proportion of older aged occupants - potential for counter flows - potential for forced flow phenomena - social behaviour in relation to bumping into fellow spectators - alcohol consumption
With these factors all working negatively, it was measured that capacity flow rates can be reduced by as much as ½ (even before accounting for obstacles).
Overall, the fact that there is very little design guidance on this issue should lead designers to carry out sampling of values at similar venues to ensure their provisions are appropriate to achieve the chosen level of performance. However, current practice is for designers to use the minimal (and largely inappropriate) guidance that exists to justify their designs. This is relatively blind. Within this discourse and associated papers, a number of recommendations have been made for designers to gain the venue specific data via localised surveys. In relation to design guidance such as the Green Guide (Home Office et al, 1985), it is recommended that significant emphasis is made on the designer demonstrating why the values used are appropriate for the venue being designed.
5.1.3 SCHOOLS MODELLING As described in Journal Paper 2 (within Appendix D), the first findings from the School Modelling research show that design guidance within documents such as Building Bulletin 98 (Department for Education and Skills, 1998) can not capture the complexities inherent within pupil movement around a school. In the past, this has lead
Key Findings & Implications
59
to buildings having poor circulation performance, with high levels of crowding in corridors, and high levels of associated bullying, vandalism, and required corridor management. This is an issue of major interest to the Partnership for Schools (PfS), who manage the Building Schools for the Future Programme for the Department for Education and Skills (DfES). Within a recent meeting held to discuss the findings of this research, the PfS Programme Development Manager commented as follows: ‘This is quite a ‘revelation’ to us and there is a lot of education to be done within the design industry… Schools have previously had to be demolished due to poor circulation provisions and it is therefore of major importance for us to get it right’ In addition to this, the PfS are now considering changes within their standard ITN guidance documents used for all new PFI schools. Example text has now been discussed for the documents as shown below: ‘Bidders are required to provide: Drawings and an explanation of how the width, position, and number of stairs and internal circulation routes are safe and comfortable for all users at lesson changes. Consideration should be given to the proposed management strategy within the school (e.g. queuing outside classrooms) and to the areas where the highest levels of pupil crowding are likely to occur. Consideration should also be given to how the evacuation stairs for the building can be appropriately integrated into the circulation design. This requirement is in addition to the guidance already stated within Building Bulletin 98.’ To aid with the continuing developments in this area, the modelling approach developed within Journal Paper 2 (in Appendix D) has been demonstrated to provide realistic results for both peak flow rates and queuing levels at stairs. The sensitivity of results was tested to determine the effects of varying the input data, which will also help with further use and development of this approach within industry. The approach developed is generic in nature and has been successfully applied to the design of four new schools; s part of the school engineering services provided by the sponsor. At least two of the schools which had been designed to standard guidance were shown to be at risk of poor performance if left un-checked.
5.2 THE CONTRIBUTION TO EXISTING THEORY OR PRACTICE
Overall, the evidence provided in this discourse shows that appropriate circulation design can not simply rely upon the limited level of design guidance available and needs a specific focus on the venue being dealt with and the complex phenomenon that will exist. Arguably, this is appropriate to any building type, whether it is a racecourse, a theatre, a shopping centre, or a museum. There are also many areas where the research carried out has contributed in a building-specific way to existing theory and practice. These are briefly listed as follows:
People Flow Modelling - Benefits, Knowledge, and Applications within Industry
60
Sports Stadia Design Within the discourse and associated papers, the research has uncovered and demonstrated the impact of a number of the complexity issues within different sports stadia venues. New case-study data has been provided, together with methods of gaining sample data, for these issues. This can now be used by designers within more thorough assessments of future designs when accounting for complexity issues. A number of the issues and new understandings found are listed below.
Arrival profiles can vary widely (profiles have been provided for the case study racecourse). Direction of arrivals at entrances can have a significant effect on entry performance (turnstile usage data has been provided for the case study racecourse to demonstrate the point and importance). Interactions of vehicles with people (at such as crossings) has been demonstrated as having a significant impact on entrance performance. Temporal changes in circulation provisions have been highlighted as a further complexity issue (an example of this has been shown to be the progressive closing down of the straight mile at Ascot Racecourse). Capacity flow rates have been shown to vary widely for level routes and stairs (data provided for case study racecourse). First stage evidence has been provided for the existence of graduated changes in flow rates depending upon a number of factors ranging from age to alcohol consumption. The new phenomenon of social gathering in high density flows has also been highlighted to reduce flow width, together with inanimate objects such as bins. Furthermore, down-stream congestion has been shown to impact heavily on capacity flow rates for a circulation route. Non-uniform use of exit routes has been demonstrated to occur on a significant scale.
School Design It has been clearly demonstrated within the research that the school design industry needs a new approach to minimise the risk of circulation problems in future buildings. This work has directly lead to changes being made by the Partnership for Schools (PfS) within their Invitation To Negotiate (ITN) guidance documents for all new schools within the UK. These changes will require designers to demonstrate adequate circulation performance will be achieved, as opposed to the traditional approach of designers showing that they have simply met minimum guidance width and area recommendations. To aid industry in complying with such requirements, a new and practical quantitative approach has also been developed and tested for informing school circulation design. The approach is generic in nature and available for others to use and develop further.
Key Findings & Implications
61
Generic data is also provided within Journal Paper 2 (Appendix D) for others to develop and test their own approaches if they so desire.
5.3 THE IMPLICATIONS/IMPACT ON THE SPONSOR
As part of this research, the sponsor has learned new skills and approaches to circulation design and an understanding of the importance of specific and complex issues. Many live fee-paying projects have also been undertaken (see below list), giving the sponsor a track record in providing circulation consultancy services which will aid significantly in future market development. Projects King Ecgberts School - new school planned for Sheffield Thomas Deacon Academy - proposed to be the highest occupancy academy within the UK (2,200 pupils) Bridge Academy - proposed to be the academy within the UK with the
most storeys (7 storeys; 14 including half-landings) Minster School - new school planned for Nottingham Kings Waterfront - multi-use site including a 10,000 capacity concert arena, exhibition centre, hotels, and multi-storey car park York Racecourse - racecourse with capacity of over 35,000 Ascot Racecourse - racecourse with capacity of 80,000 To enable the project work to be carried out for both the Ascot Racecourse project and Thomas Deacon Academy, new software has also been developed using a fast network agent-based technique (Sharma S. and Brocklehurst D. et al, 2004). The impact on the sponsor is further demonstrated by the fact that a new staff member has been employed and a third is now being recruited. At the time of writing, follow-up work has also been gained for Kings Waterfront, together with new appointments for work on the Natural History Museum and the Dallas Opera House.
5.4 THE IMPLICATIONS/IMPACT ON WIDER INDUSTRY
The main impact of this research is to help change industry thinking in relation to approaches to circulation design. It has been demonstrated through a number of published papers that the complexities of circulation behaviour and influences, together with the specific nature of each venue, are of significant importance when achieving appropriate circulation performance within buildings. It is hoped that through this work designers and engineers will gain a better appreciation and understanding of the following: • The limitations within circulation design guidance. • The fact that circulation provisions should account for complex issues related to
the specific environment being addressed. • Some of the complex issues inherent to the design of sports stadia and schools.
Data has also been provided to aid designers in addressing these issues. • New practical and tested modelling approaches that can be used and further
developed for such as schools (together with other building types).
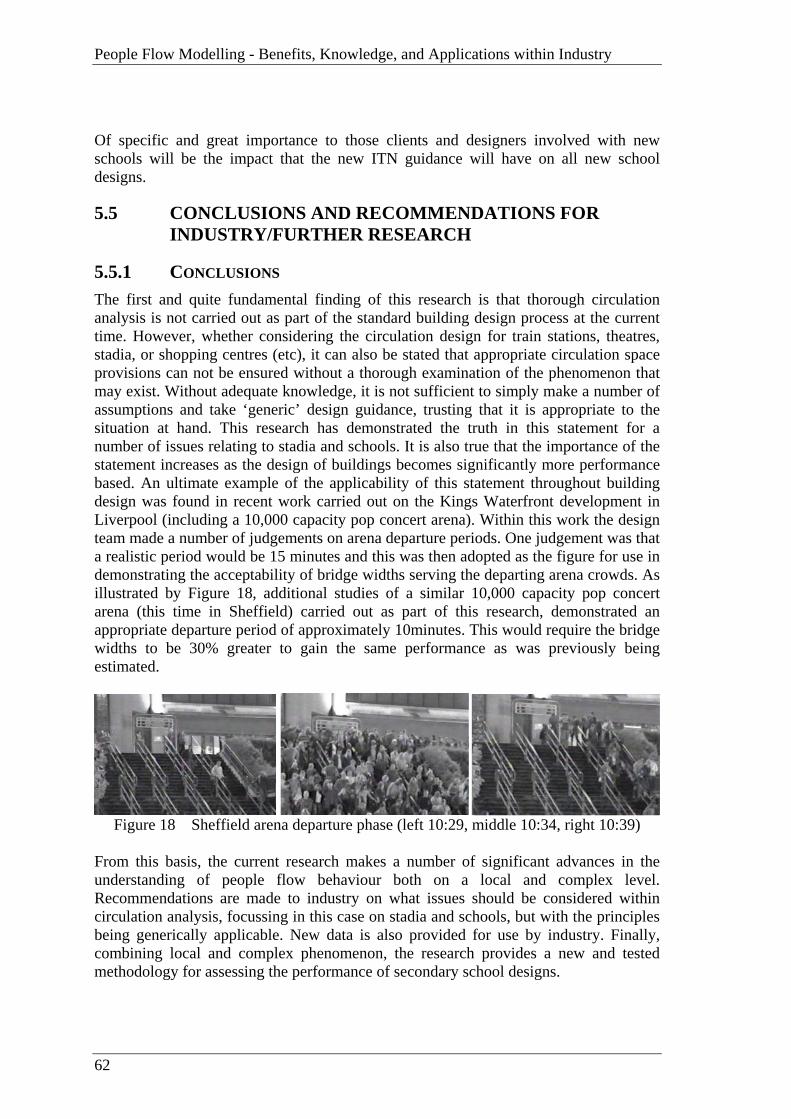
People Flow Modelling - Benefits, Knowledge, and Applications within Industry
62
Of specific and great importance to those clients and designers involved with new schools will be the impact that the new ITN guidance will have on all new school designs.
5.5 CONCLUSIONS AND RECOMMENDATIONS FOR INDUSTRY/FURTHER RESEARCH
5.5.1 CONCLUSIONS The first and quite fundamental finding of this research is that thorough circulation analysis is not carried out as part of the standard building design process at the current time. However, whether considering the circulation design for train stations, theatres, stadia, or shopping centres (etc), it can also be stated that appropriate circulation space provisions can not be ensured without a thorough examination of the phenomenon that may exist. Without adequate knowledge, it is not sufficient to simply make a number of assumptions and take ‘generic’ design guidance, trusting that it is appropriate to the situation at hand. This research has demonstrated the truth in this statement for a number of issues relating to stadia and schools. It is also true that the importance of the statement increases as the design of buildings becomes significantly more performance based. An ultimate example of the applicability of this statement throughout building design was found in recent work carried out on the Kings Waterfront development in Liverpool (including a 10,000 capacity pop concert arena). Within this work the design team made a number of judgements on arena departure periods. One judgement was that a realistic period would be 15 minutes and this was then adopted as the figure for use in demonstrating the acceptability of bridge widths serving the departing arena crowds. As illustrated by Figure 18, additional studies of a similar 10,000 capacity pop concert arena (this time in Sheffield) carried out as part of this research, demonstrated an appropriate departure period of approximately 10minutes. This would require the bridge widths to be 30% greater to gain the same performance as was previously being estimated.
Figure 18 Sheffield arena departure phase (left 10:29, middle 10:34, right 10:39)
From this basis, the current research makes a number of significant advances in the understanding of people flow behaviour both on a local and complex level. Recommendations are made to industry on what issues should be considered within circulation analysis, focussing in this case on stadia and schools, but with the principles being generically applicable. New data is also provided for use by industry. Finally, combining local and complex phenomenon, the research provides a new and tested methodology for assessing the performance of secondary school designs.
Key Findings & Implications
63
All of the advances in understanding, data, and methodologies provided within the discourse have been demonstrated to be of significant and practical benefit through successful application on multiple live projects.
5.5.2 RECOMMENDATIONS FOR INDUSTRY It is generally recommended that the built environment design industry recognises and takes full account of the local and complex phenomenon involved in people flow behaviour with determining appropriate circulation provisions. Examples of the issues to consider for stadia and schools are provided as follows:
5.5.2.1 Sports Stadia For the determination of appropriate sports stadia circulation design, the complexities for consideration include, but are not limited to: • Arrival profiles potentially being significantly different to those assumed within the
Green Guide (Home Office et al, 1985); including short period surges. • Non-uniform use of entrances/turnstiles. • Large-scale migration patterns during the day at specific venues. • Achievable flow rates being potentially different than those of the Green Guide
(Home Office et al, 1985). • Post race-day entertainment, the requirement for appropriate area provisions, and the
impact on other circulation routes. Where it is clear that there may be a ‘low flow rate system’ present, it is recommended that the designer carries out flow rate sampling at a similar venue to that being designed. Consideration should be given to the following:
- level of determination within the crowd - level of experience the crowd has within high density flows - proportion of females - proportion of older aged occupants - potential for counter flow - potential for forced flow phenomenon - social behaviour - alcohol consumption - obstacles
With these factors all working negatively in relation to the flow rate, it is possible for the flow rate to be reduced by more than 50%.
5.5.2.2 Schools To ensure appropriate circulation provisions within a new school design, consideration should be given to the following: a Layout The layout of corridors and especially stairs within a school is fundamental in achieving an optimum balance of performance and hence in avoiding underused stairs and high levels of congestion. It is recommended that designers give significant consideration for
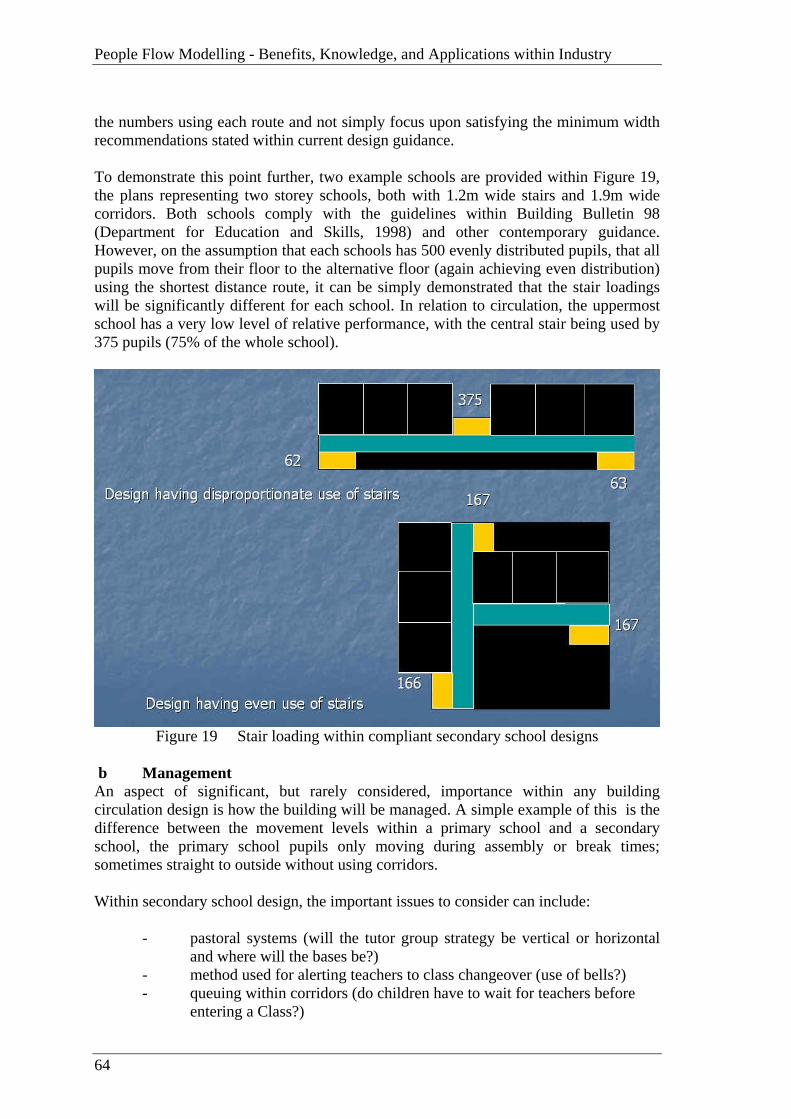
People Flow Modelling - Benefits, Knowledge, and Applications within Industry
64
the numbers using each route and not simply focus upon satisfying the minimum width recommendations stated within current design guidance. To demonstrate this point further, two example schools are provided within Figure 19, the plans representing two storey schools, both with 1.2m wide stairs and 1.9m wide corridors. Both schools comply with the guidelines within Building Bulletin 98 (Department for Education and Skills, 1998) and other contemporary guidance. However, on the assumption that each schools has 500 evenly distributed pupils, that all pupils move from their floor to the alternative floor (again achieving even distribution) using the shortest distance route, it can be simply demonstrated that the stair loadings will be significantly different for each school. In relation to circulation, the uppermost school has a very low level of relative performance, with the central stair being used by 375 pupils (75% of the whole school).
Figure 19 Stair loading within compliant secondary school designs
b Management An aspect of significant, but rarely considered, importance within any building circulation design is how the building will be managed. A simple example of this is the difference between the movement levels within a primary school and a secondary school, the primary school pupils only moving during assembly or break times; sometimes straight to outside without using corridors. Within secondary school design, the important issues to consider can include:
- pastoral systems (will the tutor group strategy be vertical or horizontal and where will the bases be?)
- method used for alerting teachers to class changeover (use of bells?) - queuing within corridors (do children have to wait for teachers before
entering a Class?)

Key Findings & Implications
65
- lunchtime strategy (will the school lunchtime strategy include a split or single lunch sitting?)
- use of lockers for storing books (do pupils carry their books with them?) All of these elements have been demonstrated to be influential on school circulation performance. c Evacuation Strategy To achieve optimum performance for a school design, both in terms of circulation and evacuation, consideration should be given to the integration of evacuation stairs/routes within the circulation design. This not only avoids evacuation routes being redundant during normal use (and hence a waste of money), but also aids significantly in achieving effective building evacuations during both drills and emergency conditions. This is due to the safe egress routes also being the routes pupils and teachers are familiar with and use on a day-to-day basis.
5.5.3 RECOMMENDATIONS FOR FURTHER RESEARCH This research has succeeded in advancing the approach to design, the data/knowledge held within industry, the methods available for use by industry, and the guidance documents setting the design standards. However, this is an early step in changing industry as a whole towards and in ensuring fully informed and appropriate performance-based circulation designs. For many different building types, including retail, museums, theatres, and even city streets, similar research can be carried out as was performed within this Engineering Doctorate. Also, the work for stadia and schools is still not complete and there is a significant amount of follow-up work required. Specifically, the following additional research is recommended:
5.5.3.1 Stadia For stadia, it is recommended that the following research be undertaken:
- Research considering in greater detail the relative and quantified importance of age, gender, determination, experience (etc) on capacity flow rates; on various terrain.
- Further sampling be carried out of capacity flow rates achieved at different stadia types, with varying population profiles.
- Quantified examination be made of the disproportionate use of egress routes within a stadium.
5.5.3.2 Schools To build on the research in schools, it is recommended that further valuable research work be carried out in the following areas:
- Research to further test the modelling methodology developed within for schools, using further flow samples in existing schools; both for stair queues and corridors flow rates.
- Advancing the schools modelling approach for applications to other
People Flow Modelling - Benefits, Knowledge, and Applications within Industry
66
issues such as queuing phenomenon at school cloak rooms. Manned cloakrooms are becoming ever more present within new school designs and a common question arising has been how they perform.
5.6 CRITICAL EVALUATION OF THE RESEARCH (LIMITATIONS)
In relation to this Engineering Doctorate, the research on schools would have benefited from further sampling of flow rates to provide more comprehensive testing of the school congestion modelling methodology. Ideally this would have been carried out at one or more different schools, with a number of additional scenarios tested. This was not possible within the research period due to a lack of time and resources. For stadia, the research would have benefited from a review of flow rates in circulation routes that were not racecourses. There are numerous examples of these stadia including velodromes, swimming venues, golf stands, tennis courts etc. This was not possible within the research period due to a lack of time and resources. There are also a number of building types that this Engineering Doctorate did not consider in detail such as people flow phenomenon within shopping centres.
References
67
6 REFERENCES
Ando K. Ota H. Oki T., 1988, ‘Forecasting the Flow Of People’, Railway Research Review, (45) pp 8-14. Bafna S., 2003, 'Space syntax - A brief introduction to its logic and analytical techniques', Environment and Behavior, 35(1), January 2003, pp 17-29. Blue V.J. and Adler J.L., 2001, ‘Flow Capacities from Cellular Automata; Modelling of Proportional Splits of Pedestrians by Direction’, Proceedings of the 1st Pedestrian and Evacuation Dynamics conference held in Duisburg. BSI, 2000, BS5395 ‘Stairs, ladders and walkways – Part 1: Code of practice for the design, construction and maintenance of straight stairs and winders’, ISBN 0 580 33175 X. Canter D., Comber M., and Uzzell D.L., 1989, ‘Football in its place; an environmental psychology of football grounds’, Routledge, pp 94-102, ISBN 0-415-01240-6. CIBSE (The Chartered Institute of Building Services Engineers), 1993, ‘CIBSE Guide D; Transportation systems in buildings’, ISBN 0 900953 57 8 CIBSE (The Chartered Institute of Building Services Engineers), 1997 ‘CIBSE Guide E; Fire Engineering’, ISBN 0 900953 78 0. Daly P.N., McGrath F. and Annesley T.J., 1991, ‘Pedestrian speed/flow relationships for underground stations’, Traffic Engineering and Control, 32, 2, pp 76-78. Department for Education and Skills, 1998, ‘Building Bulletin 98: Briefing Framework for Secondary School Projects’, Castle View House, Runcorn, Castle View House, East Lane, Runcorn WA7 2GJ, http://www.teachernet.gov.uk. Fruin, J. J., 1987, ‘Pedestrian planning and design’, Elevator World Inc. (Educational Services Division), Alabama, LIB.CON 70-159312. Galea E. R., J M Perez Galparsoro and J Pearce, 1993, ‘A Brief Description of the EXODUS Evacuation Model’, in Proceedings 18th International Conference on Fire Safety, San Francisco, USA, Vol.18, pp.149-162. Gwynne S., Galea E.R., Owen M., Lawrence P.J., and Filippidis L.A., 1999, ‘Review of the Methodologies Used in Evacuation Modelling’, Fire and Materials, V23, 6, pp383-389. T.A. Habicht and J.P. Braaksma, 1984, ‘Effective Width of Pedestrian Corridors’, J. Trans Engineering, 110, 80.

People Flow Modelling - Benefits, Knowledge, and Applications within Industry
68
Halcrow Fox, (http://www.dft.gov.uk/stellent/groups/dft_railways/documents/page/dft_railways_035922.pdf) Hankin B. D. and Wright R. A., 1958, ‘Passenger Flow in Subways’, in Operational Research Quarterly, Vol. 9 pp81-88. Helbing D. et al, 2001, ‘Self-organizing pedestrian movement’, Environment and Planning B: Planning and Design, volume 28, pages 361-383. Henderson L F, 1971, ‘The statistics of crowd fluids’, Nature (229), P 381-383. Hillier B, Penn A, Hanson J, Grajewski T, Xu J, 1993, 'Natural movement: or configuration and attraction in urban pedestrian movement', Environment & Planning B: Planning & Design 20, pp. 29-66. Home Office/Scottish Home and Health Department, 1985, ‘Guide to Safety at Sports Grounds (Football)’ also known as the ‘Green Guide’, (Third Edition), HMSO, ISBN 0 11 3407610. Home Office/Scottish Office, 1998, ‘Guide to fire precautions in existing places of entertainment and like premises’ also known as the ‘Primrose Guide’, HMSO London, ISBN 0113409079. Hoogendoorn S. P., Daamen W., 2003, ‘Qualitative Results from Pedestrian Laboratory Experiments’, in Proceedings of Pedestrian and Evacuation Dynamics Conference, Section 2: Pedestrian Performance Data, University of Greenwich, ISBN No. 1-904521-08-8. Ketchell, N, Cole, S. et. al., 1993, ‘The EGRESS code for human movement and behaviour in emergency evacuations’, in Engineering for Crowd Safety, Elsevier. (Ed Smith RA, Dickie J) ISBN 0 444 899200. London Transport Executive, 1958, ‘Second report of the operational research team on the capacity of footways’, Research report no. 95, London. London Transport Executive, 1972, ‘The capacity of passageways for unidirectional and for crossing flows of pedestrians’, O.R. Memorandum M258, London. Ministry of Works/Joint Committee of the Building Research Board of the Department of Scientific & Industrial Research and of the Fire Offices Committee, 1952, ‘Post War Building Studies - No. 29; Fire Grading of Buildings Parts II, III, and IV’, H.M.S.O., London. National Fire Protection Association (NFPA), 1997, ‘Fire Protection Handbook’, Eighteenth Edition. Navin F. P. D.and Wheeler R. J., 1969, ‘Pedestrian Flow and Characteristics’, in Traffic Engineering, June.

References
69
Oeding D., 1963, ‘Verkehrsbelastung und Dimensionierung von Gehwegen und anderen Anlagen des Fussgangerverkehrs’, Strassenbau und Strassenverkehrstechnik, Heft 22, Bonn. Office of the Deputy Prime Minister, 2004, ‘Approved Document B to the Building Regulations 2000; Fire Safety’, TSO (The Stationary Office), PO Box 29, Norwich, NR3 1GN. Older S.J., 1968, ‘Movement of Pedestrians on Footways in Shopping Streets’, in Traffic Engineering and Control, August, pp. 160-163.. Pauls J., 1980, ‘Building Evacuation: Research Findings and Recommendations’, in Fires and Human Behaviour (Chapter14:), John Wiley & Sons, Chichester/New York/Brisbane/Toronto. Pauls J., 2003, ‘Evacuation and Other Movement in Buildings; Some High Rise Evacuation Models, General Pedestrian Movement Models, and Human Performance Data Needs’, in Proceedings of Pedestrian and Evacuation Dynamics Conference, Section 2: Pedestrian Performance Data, University of Greenwich, ISBN No. 1-904521-08-8. Pauls J., 2004, ‘Suggestions on Evacuation Models and Research Questions’, in Proceedings of 3rd International Symposium on Human Behaviour in Fire, Interscience Communications, University of Ulster. Peschel, R., 1957, ‘Untersuchungen uber die Leistangsfahigkeit ungeschutzter Fussgangeruberwege (Research into the capacity of unprotected pedestrian crossings)’ (in German), Strassertechnik, 5, part 6, 63-7. Polus A., Joseph L. Schofer, and Ushpiz A., 1983, ‘Pedetsrian Flow and Level of Service’, in Journal of Transportation Engineering, Vol. 109, January, pp. 46-56. Predtechenskii, V.M. and Milinski, A.I., 1969, ‘Planning for Foot Traffic Flows in Buildings’, Stoiizdat Publishers, Moscow. (Translated and published by Amerind Publishing Co. Pvt. Ltd, New Delhi, 1978.) Pushkarev and Zupan, 1975, Urban Space for Pedestrians. SCICON, 1972, ‘Safety in football stadia: a method of assessment’ [study conducted for the Wheatley enquiry into crowd safety at sports grounds], London: SCICON. Scottish Executive Education Department (Schools Division), 2004, Circular No 3, ‘Guidance on Determining School Capacities’, Victoria Quay, Edinburgh, EH6 6QQ. Sharma S., Brocklehurst D., and Westbury P., 2004, ‘A dynamic network model for circulation and evacuation’, in Proceedings of 3rd International Symposium on Human Behaviour in Fire, Interscience Communications, University of Ulster.
People Flow Modelling - Benefits, Knowledge, and Applications within Industry
70
Society of Fire Protection Engineers/National Fire Protection Association, 1995, ‘The SFPE Handbook; Fire Protection Engineering’, 2nd Edition. Still K., 2000, ‘Crowd dynamics’ [PhD thesis], University of Warwick; Department of Mathematics, Warwick, 2000. Surti V.H. and Burke T.J., 1971, ‘Investigation of the capacity of the Whitehouse sidewalk for orderly demonstrations’, Highway Research Record, no. 355. Thompson P., 2003, ‘Simulex: Analysis and Changes for IMO Compliance’, in Proceedings of Second International Conference in Pedestrian and Evacuation Dynamics (PED), The University of Greenwich, London SE10 9LS. Tregenza P. 1976, 'The design of interior circulation: people and buildings', London: Crosby Lockwood. Transportation Research Board/National Research Council, 1994, ‘Highway Capacity Manual’, Special Report 209, Chapter 13, Washington, D.C.. Tsuji Y., 2003, ‘Numerical Simulation of Flow at High Densities’, in Proceedings for Pedestrian and Evacuation Dynamics’, University of Greenwich. Turner F.S.P., 1959, ‘Preliminary planning for a new tube railway across London’, Proceedings of the ICE Conference, 12, pp 19-38. Virkler, M.R. and S. Elayadath, 1994, ‘Pedestrian Speed-Flow-Density Relationships’, Transportation Research Record, 1438, pp 51-58.

Paper 1
71
APPENDIX A PAPER 1:
David Brocklehurst, Prof Dino Bouchlaghem, Dr David Pitfield, Dr Garry Palmer, 2003, ‘Overview of Design Issues Relating to Racecourse Circulation’, conference paper presentation at 2nd International Conference on Pedestrian and Evacuation Dynamics, for proceedings contact CMS Press, School of Computing and Mathematical Sciences, University of Greenwich, London, SE10 9LS, ISBN No. 1-904521-08-8.

People Flow Modelling - Benefits, Knowledge, and Applications within Industry
72
OVERVIEW OF DESIGN ISSUES RELATING TO RACECOURSE CIRCULATION
David Brocklehurst *, Dr G Palmer *, Dr D Bouchlaghem **, Dr D E Pitfield **,
* Buro Happold, Brodricks Building, 51 Cookridge Street, Leeds, LS2 3AW
** CICE Department of Civil and Building Engineering, Loughborough University, Loughborough, Leicestershire, LE11 3TU
ABSTRACT This paper presents some of the findings of the crowd movement studies carried out at Ascot Racecourse during Ladies Day 2001 & 2002. It introduces this by discussing the limitations of the Guide to Safety at Sports Grounds in relation to providing specific guidance and data for sports venues such as racecourses. Quantitative survey findings are then discussed in order to highlight some of the issues designers need to account for when looking at racecourse circulation. Mention is also made of the application of buildingEXODUS software. Such software provides a useful tool for the assessment and visualisation of circulation flows, but as with other methods, correct input data is necessary to gain meaningful results. The paper is by no means exhaustive in relation to racecourse data and there are many areas where, space allowing, further quantification could have been provided. INTRODUCTION In order to have an effective design for circulation, there must be an understanding of the circulation flows, the circulation issues, and a set of related performance goals. The primary UK guidance document used to inform stadia design in relation to crowd movement and safety limits is arguably The Guide to Safety at Sports Grounds (Green Guide)1. The Green Guide states that the grounds to which it applies are likely to be those which stage the following sports:
American Football Golf Motor Racing Athletics Greyhound Racing Polo Cricket Hockey Rugby (Union and League) Equestrian Activities Horse Racing Speedway Racing Football Lacrosse Tennis The Green Guide is a general guide for most stadia with no focus on the specifics related to any one in particular. There are a number of areas where, even though it provides valuable qualitative guidance, it does not give the necessary detail and quantification of the appropriate circulation variables (concourse widths for general circulation, arrival profiles, circulation flow rates etc). This is illustrated by the following Green Guide sections: Providing a sufficient number of turnstiles or entry points (Green Guide Section 6.7) Within the section of the Green Guide dealing with arrivals and entry design, it points out that using 1 hour as an arrival period may not be applicable for many grounds. This is based on the fact that people can arrive either well before the start of a sporting event

Paper 1
73
or arrive very close to the start of the event. It states that this should be recognised when sizing entrances but offers no further quantification. Circulation on concourses (Green Guide Section 8.5) Within Section 8.5 of the guide, there is a general discussion regarding the design of concourses for circulation. The statement is made that ‘..careful design should ensure that during periods of peak use circulation is not impeded’. However, there is no quantification of how to determine appropriate widths for comfort and safety. Recommended rates of passage (Green Guide Section 9.6) During the discussion on flow rates within Section 9.6 it is stated that ‘consideration should be given to applying rates of passage lower than the maximum’. This is due to the fact that the stated flow rates can not be sustained for long periods of time. However, the rates that should be applied are not given. The authors of the guide would most likely agree that it acts to give an initial level of information based on previous experience of specific incidents, but that further investigation is required to gain a thorough understanding of specific stadia. This paper presents some of the findings of the crowd movement studies carried out at Ascot Racecourse during the Ladies Day’s of 2001 & 2002. It looks at some of the specific issues related to arrival, circulation during the day, and departure. A number of the issues covered in this paper are not considered at all or in any depth by the Green Guide. DESCRIPTION OF MAIN AREAS WITHIN ASCOT RACECOURSE Ascot is an 80,000 capacity racecourse within the South of England. It includes a Grandstand Enclosure, Members Enclosure, Silver Ring, accommodation on the Heath, and a number of hospitality areas external to the main buildings. The main features are illustrated by Figure 1. Out of the Ascot racing calendar, Ladies Day (within Royal Week) presents a time when the racecourse gets closest to the capacity crowd.
Track Car/coach parks Members/Grandstand Silver Ring Enclosure
Paddock Hospitality
Stables Train station
Figure 1: Aerial view of Ascot racecourse
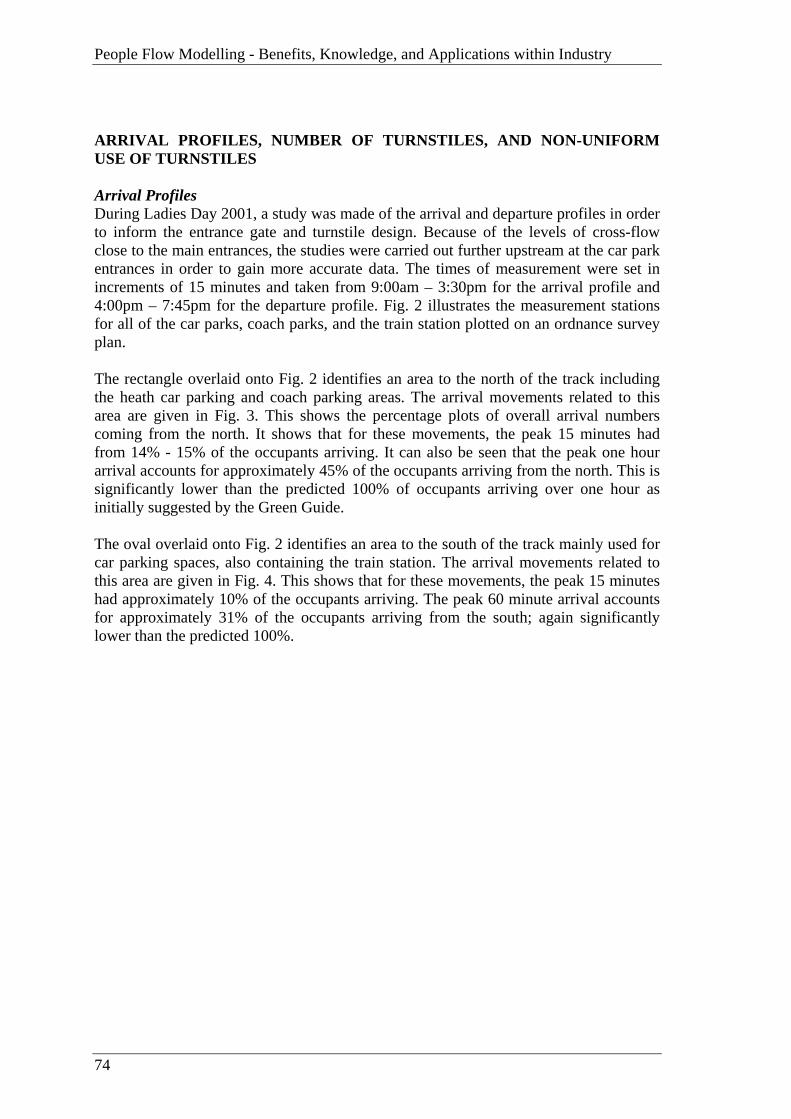
People Flow Modelling - Benefits, Knowledge, and Applications within Industry
74
ARRIVAL PROFILES, NUMBER OF TURNSTILES, AND NON-UNIFORM USE OF TURNSTILES Arrival Profiles During Ladies Day 2001, a study was made of the arrival and departure profiles in order to inform the entrance gate and turnstile design. Because of the levels of cross-flow close to the main entrances, the studies were carried out further upstream at the car park entrances in order to gain more accurate data. The times of measurement were set in increments of 15 minutes and taken from 9:00am – 3:30pm for the arrival profile and 4:00pm – 7:45pm for the departure profile. Fig. 2 illustrates the measurement stations for all of the car parks, coach parks, and the train station plotted on an ordnance survey plan. The rectangle overlaid onto Fig. 2 identifies an area to the north of the track including the heath car parking and coach parking areas. The arrival movements related to this area are given in Fig. 3. This shows the percentage plots of overall arrival numbers coming from the north. It shows that for these movements, the peak 15 minutes had from 14% - 15% of the occupants arriving. It can also be seen that the peak one hour arrival accounts for approximately 45% of the occupants arriving from the north. This is significantly lower than the predicted 100% of occupants arriving over one hour as initially suggested by the Green Guide. The oval overlaid onto Fig. 2 identifies an area to the south of the track mainly used for car parking spaces, also containing the train station. The arrival movements related to this area are given in Fig. 4. This shows that for these movements, the peak 15 minutes had approximately 10% of the occupants arriving. The peak 60 minute arrival accounts for approximately 31% of the occupants arriving from the south; again significantly lower than the predicted 100%.

Paper 1
75
80825364
7068
186
7128
5220
1149
4659
2091
1404
2911Train
1563
11657Train
1116
30147
CP19
CP19CP19
CP19
3792
CP19
CP3 CP4
CP5
CP9CP10
CP7CP6351 1053372 744
104
1459
CP8bCP11
CP12
418
1673CP13a
CP15CP14
11652329
1165CP13b
CP8a
1563 418
CP3
Total number of occupants within carpark
People flow direction
Reference for graph
Fraction of the total occupants
Figure 2: Survey sites for arrival/departure flow-rates
Percentage of Total Arrival Flows vs Time
02468
1012141618
10:1
5
10:4
5
11:1
5
11:4
5
12:1
5
12:4
5
13:1
5
13:4
5
14:1
5
14:4
5
15:1
5
Time
%
Figure 3: Northern spectator arrival profile
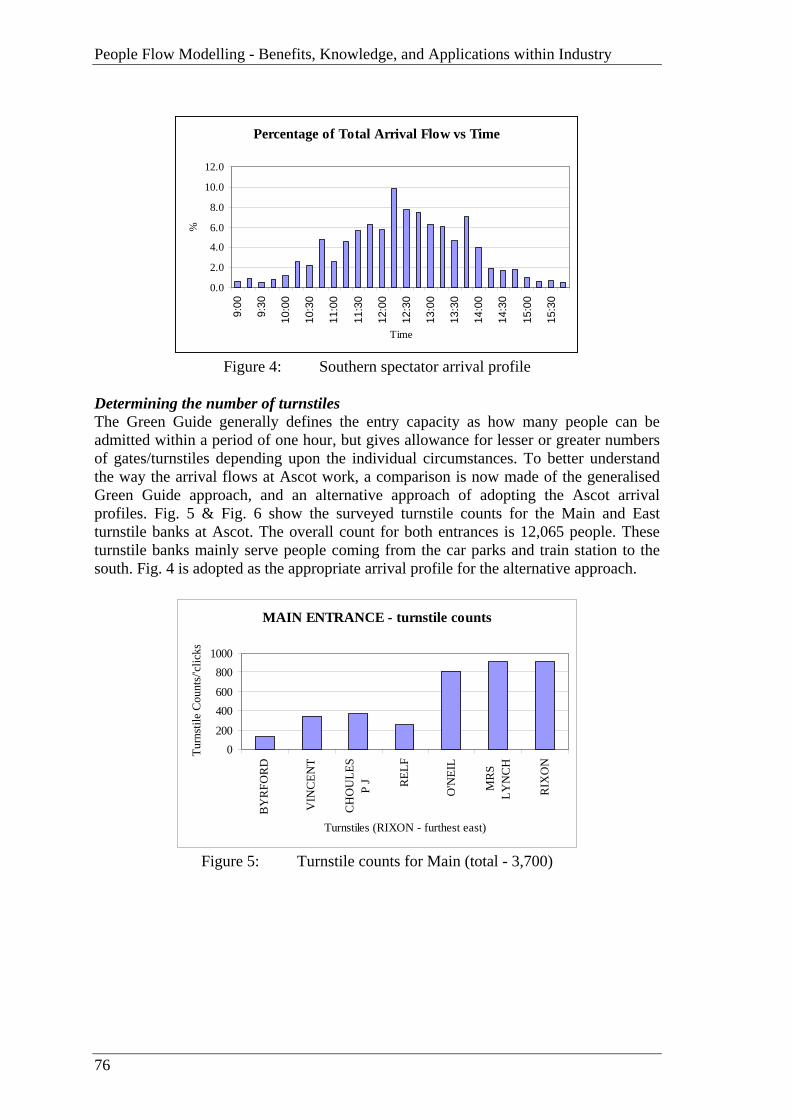
People Flow Modelling - Benefits, Knowledge, and Applications within Industry
76
Percentage of Total Arrival Flow vs Time
0.0
2.0
4.0
6.0
8.0
10.0
12.0
9:00
9:30
10:0
0
10:3
0
11:0
0
11:3
0
12:0
0
12:3
0
13:0
0
13:3
0
14:0
0
14:3
0
15:0
0
15:3
0
Time
%
Figure 4: Southern spectator arrival profile
Determining the number of turnstiles The Green Guide generally defines the entry capacity as how many people can be admitted within a period of one hour, but gives allowance for lesser or greater numbers of gates/turnstiles depending upon the individual circumstances. To better understand the way the arrival flows at Ascot work, a comparison is now made of the generalised Green Guide approach, and an alternative approach of adopting the Ascot arrival profiles. Fig. 5 & Fig. 6 show the surveyed turnstile counts for the Main and East turnstile banks at Ascot. The overall count for both entrances is 12,065 people. These turnstile banks mainly serve people coming from the car parks and train station to the south. Fig. 4 is adopted as the appropriate arrival profile for the alternative approach.
MAIN ENTRANCE - turnstile counts
0200
400600
8001000
BY
RFO
RD
VIN
CEN
T
CH
OU
LES
P J REL
F
O'N
EIL
MR
SLY
NC
H
RIX
ON
Turnstiles (RIXON - furthest east)
Turn
stile
Cou
nts/
'clic
ks
Figure 5: Turnstile counts for Main (total - 3,700)
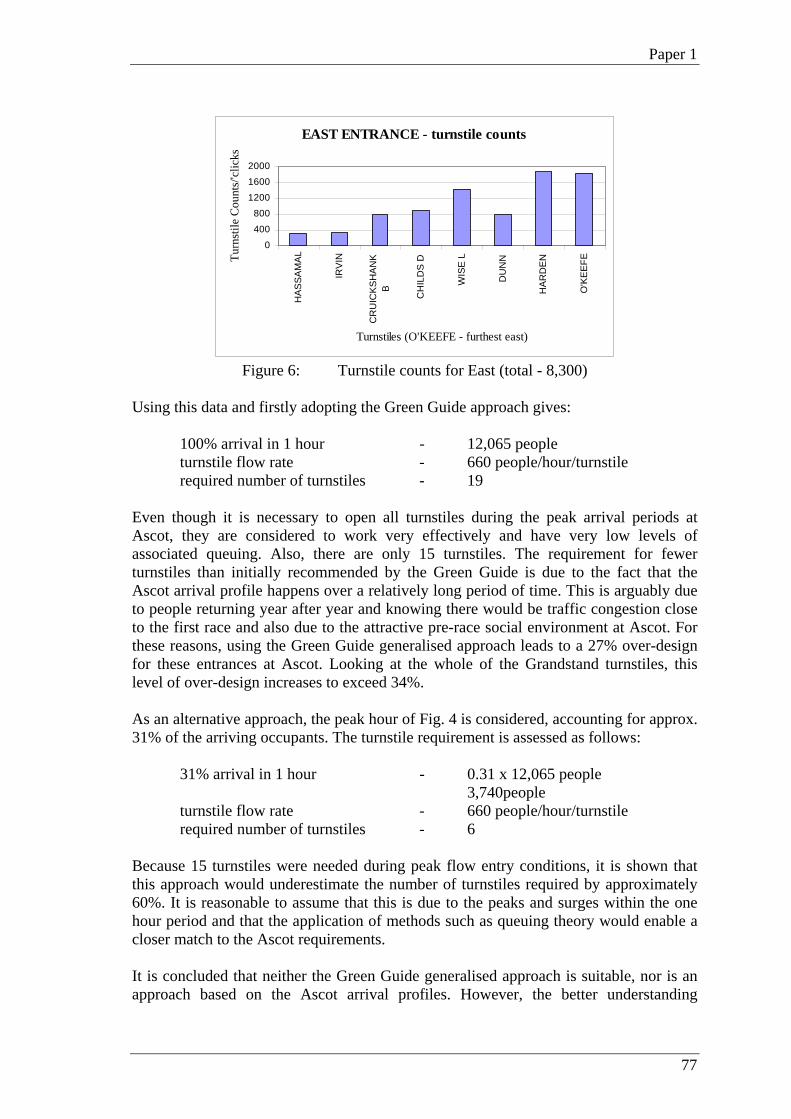
Paper 1
77
EAST ENTRANCE - turnstile counts
0
400
800
1200
1600
2000
HAS
SAM
AL
IRV
IN
CR
UIC
KS
HA
NK
B
CH
ILD
S D
WIS
E L
DU
NN
HA
RD
EN
O'K
EEFE
Turnstiles (O'KEEFE - furthest east)
Turn
stile
Cou
nts/
'clic
ks
Figure 6: Turnstile counts for East (total - 8,300)
Using this data and firstly adopting the Green Guide approach gives:
100% arrival in 1 hour - 12,065 people turnstile flow rate - 660 people/hour/turnstile required number of turnstiles - 19
Even though it is necessary to open all turnstiles during the peak arrival periods at Ascot, they are considered to work very effectively and have very low levels of associated queuing. Also, there are only 15 turnstiles. The requirement for fewer turnstiles than initially recommended by the Green Guide is due to the fact that the Ascot arrival profile happens over a relatively long period of time. This is arguably due to people returning year after year and knowing there would be traffic congestion close to the first race and also due to the attractive pre-race social environment at Ascot. For these reasons, using the Green Guide generalised approach leads to a 27% over-design for these entrances at Ascot. Looking at the whole of the Grandstand turnstiles, this level of over-design increases to exceed 34%. As an alternative approach, the peak hour of Fig. 4 is considered, accounting for approx. 31% of the arriving occupants. The turnstile requirement is assessed as follows:
31% arrival in 1 hour - 0.31 x 12,065 people 3,740people
turnstile flow rate - 660 people/hour/turnstile required number of turnstiles - 6 Because 15 turnstiles were needed during peak flow entry conditions, it is shown that this approach would underestimate the number of turnstiles required by approximately 60%. It is reasonable to assume that this is due to the peaks and surges within the one hour period and that the application of methods such as queuing theory would enable a closer match to the Ascot requirements. It is concluded that neither the Green Guide generalised approach is suitable, nor is an approach based on the Ascot arrival profiles. However, the better understanding
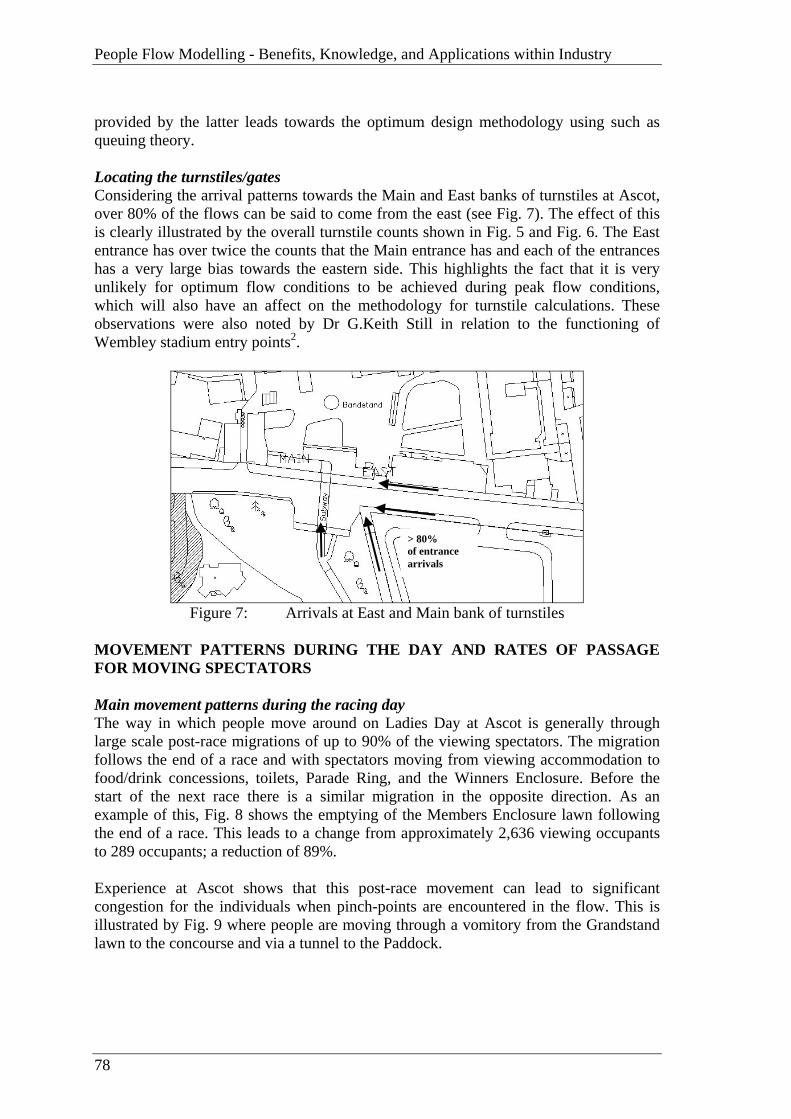
People Flow Modelling - Benefits, Knowledge, and Applications within Industry
78
provided by the latter leads towards the optimum design methodology using such as queuing theory. Locating the turnstiles/gates Considering the arrival patterns towards the Main and East banks of turnstiles at Ascot, over 80% of the flows can be said to come from the east (see Fig. 7). The effect of this is clearly illustrated by the overall turnstile counts shown in Fig. 5 and Fig. 6. The East entrance has over twice the counts that the Main entrance has and each of the entrances has a very large bias towards the eastern side. This highlights the fact that it is very unlikely for optimum flow conditions to be achieved during peak flow conditions, which will also have an affect on the methodology for turnstile calculations. These observations were also noted by Dr G.Keith Still in relation to the functioning of Wembley stadium entry points2.
Figure 7: Arrivals at East and Main bank of turnstiles
MOVEMENT PATTERNS DURING THE DAY AND RATES OF PASSAGE FOR MOVING SPECTATORS Main movement patterns during the racing day The way in which people move around on Ladies Day at Ascot is generally through large scale post-race migrations of up to 90% of the viewing spectators. The migration follows the end of a race and with spectators moving from viewing accommodation to food/drink concessions, toilets, Parade Ring, and the Winners Enclosure. Before the start of the next race there is a similar migration in the opposite direction. As an example of this, Fig. 8 shows the emptying of the Members Enclosure lawn following the end of a race. This leads to a change from approximately 2,636 viewing occupants to 289 occupants; a reduction of 89%. Experience at Ascot shows that this post-race movement can lead to significant congestion for the individuals when pinch-points are encountered in the flow. This is illustrated by Fig. 9 where people are moving through a vomitory from the Grandstand lawn to the concourse and via a tunnel to the Paddock.
> 80%of entrancearrivals
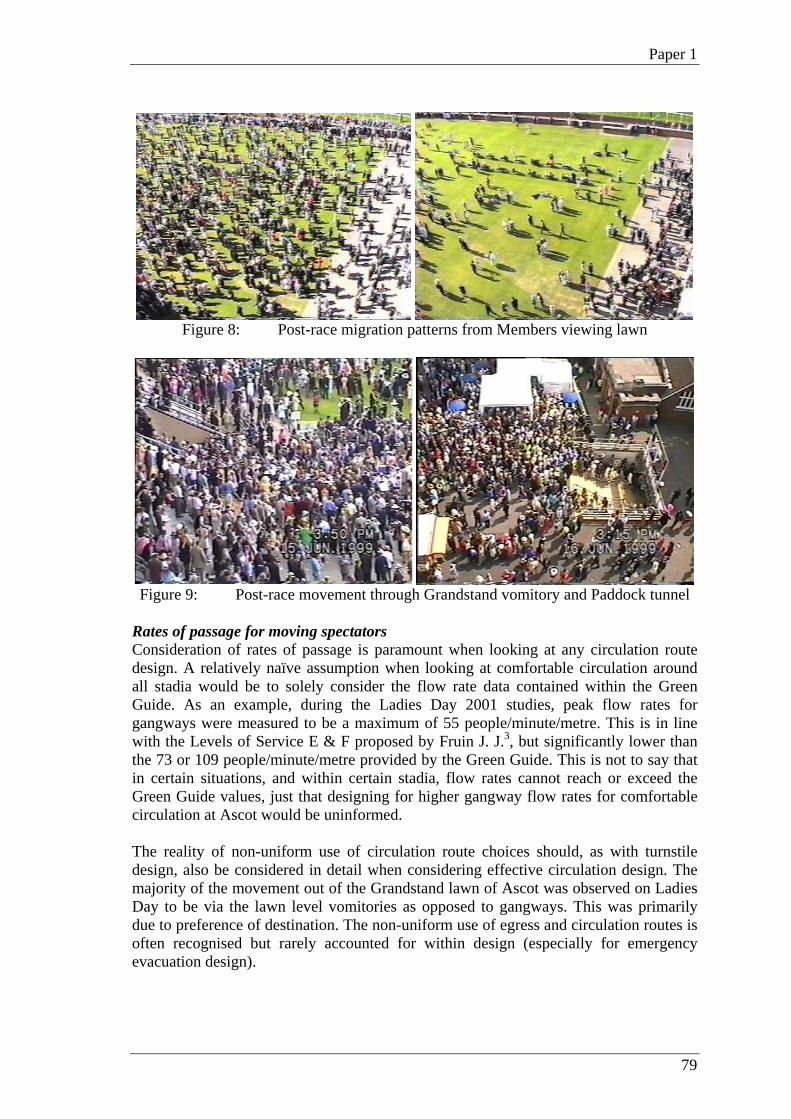
Paper 1
79
Figure 8: Post-race migration patterns from Members viewing lawn
Figure 9: Post-race movement through Grandstand vomitory and Paddock tunnel
Rates of passage for moving spectators Consideration of rates of passage is paramount when looking at any circulation route design. A relatively naïve assumption when looking at comfortable circulation around all stadia would be to solely consider the flow rate data contained within the Green Guide. As an example, during the Ladies Day 2001 studies, peak flow rates for gangways were measured to be a maximum of 55 people/minute/metre. This is in line with the Levels of Service E & F proposed by Fruin J. J.3, but significantly lower than the 73 or 109 people/minute/metre provided by the Green Guide. This is not to say that in certain situations, and within certain stadia, flow rates cannot reach or exceed the Green Guide values, just that designing for higher gangway flow rates for comfortable circulation at Ascot would be uninformed. The reality of non-uniform use of circulation route choices should, as with turnstile design, also be considered in detail when considering effective circulation design. The majority of the movement out of the Grandstand lawn of Ascot was observed on Ladies Day to be via the lawn level vomitories as opposed to gangways. This was primarily due to preference of destination. The non-uniform use of egress and circulation routes is often recognised but rarely accounted for within design (especially for emergency evacuation design).

People Flow Modelling - Benefits, Knowledge, and Applications within Industry
80
Circulation modelling With the appropriate input data for rates of passage, levels of movement, together with assumptions or data on delay times and destination profiles, it is possible to start effectively modelling circulation routes. This level of detail was applied in order to inform the circulation design for Ascot Racecourse. The results gained from the assessment were communicated to the design team and client through crowd movement visualisations produced using the buildingEXODUS software; Fig. 10 shows one such visualisation. This software has been developed by the Fire Safety Engineering Group (FSEG) within the University of Greenwich.
Figure 10: buildingEXODUS used for visualisations of crowd movement
DEPARTURE PROFILES AND THE REQUIREMENT FOR POST-DAY ENTERTAINMENT To compare against the arrival profile given in Fig. 3, the departure profile at the same location is plotted in Fig. 11. As would be expected for a sporting venue, once the last race finishes at 5:30 there is a peak flow period much higher than associated with the gentle and more social arrival period. The one-hour maximum movement within Fig. 11 accounts for approximately 80% of all of the people departing via this route.
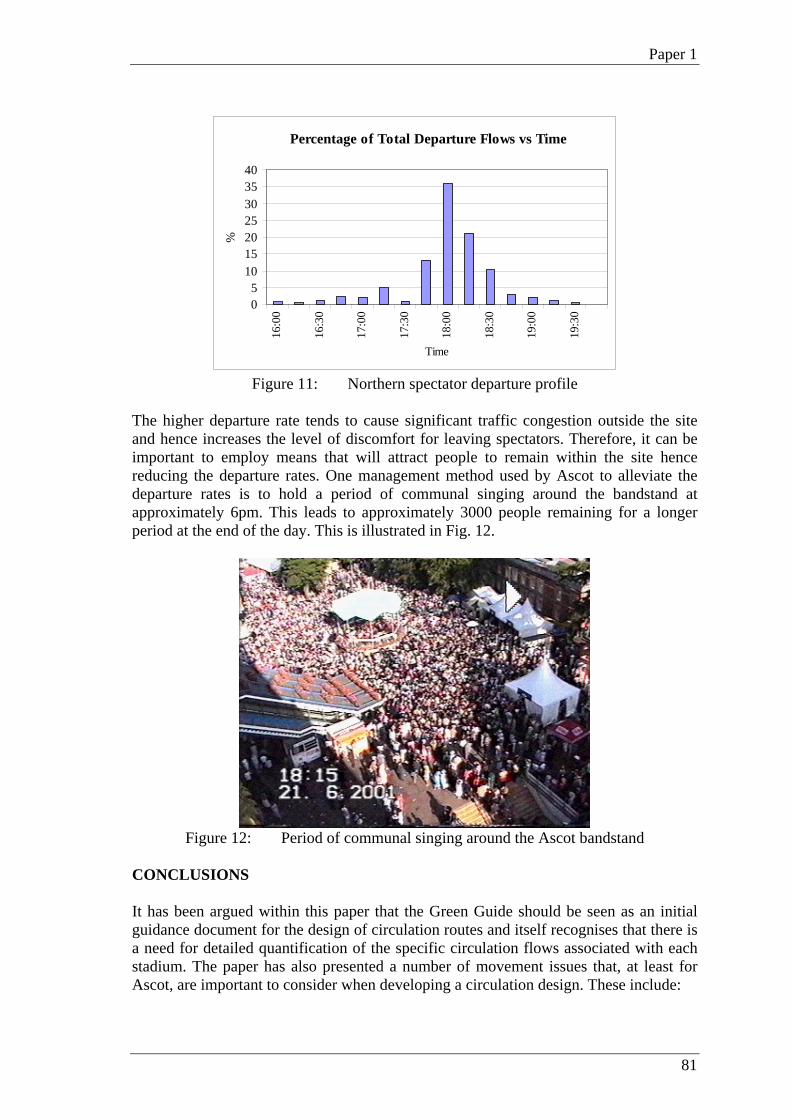
Paper 1
81
Percentage of Total Departure Flows vs Time
05
10152025303540
16:0
0
16:3
0
17:0
0
17:3
0
18:0
0
18:3
0
19:0
0
19:3
0
Time
%
Figure 11: Northern spectator departure profile
The higher departure rate tends to cause significant traffic congestion outside the site and hence increases the level of discomfort for leaving spectators. Therefore, it can be important to employ means that will attract people to remain within the site hence reducing the departure rates. One management method used by Ascot to alleviate the departure rates is to hold a period of communal singing around the bandstand at approximately 6pm. This leads to approximately 3000 people remaining for a longer period at the end of the day. This is illustrated in Fig. 12.
Figure 12: Period of communal singing around the Ascot bandstand
CONCLUSIONS It has been argued within this paper that the Green Guide should be seen as an initial guidance document for the design of circulation routes and itself recognises that there is a need for detailed quantification of the specific circulation flows associated with each stadium. The paper has also presented a number of movement issues that, at least for Ascot, are important to consider when developing a circulation design. These include:
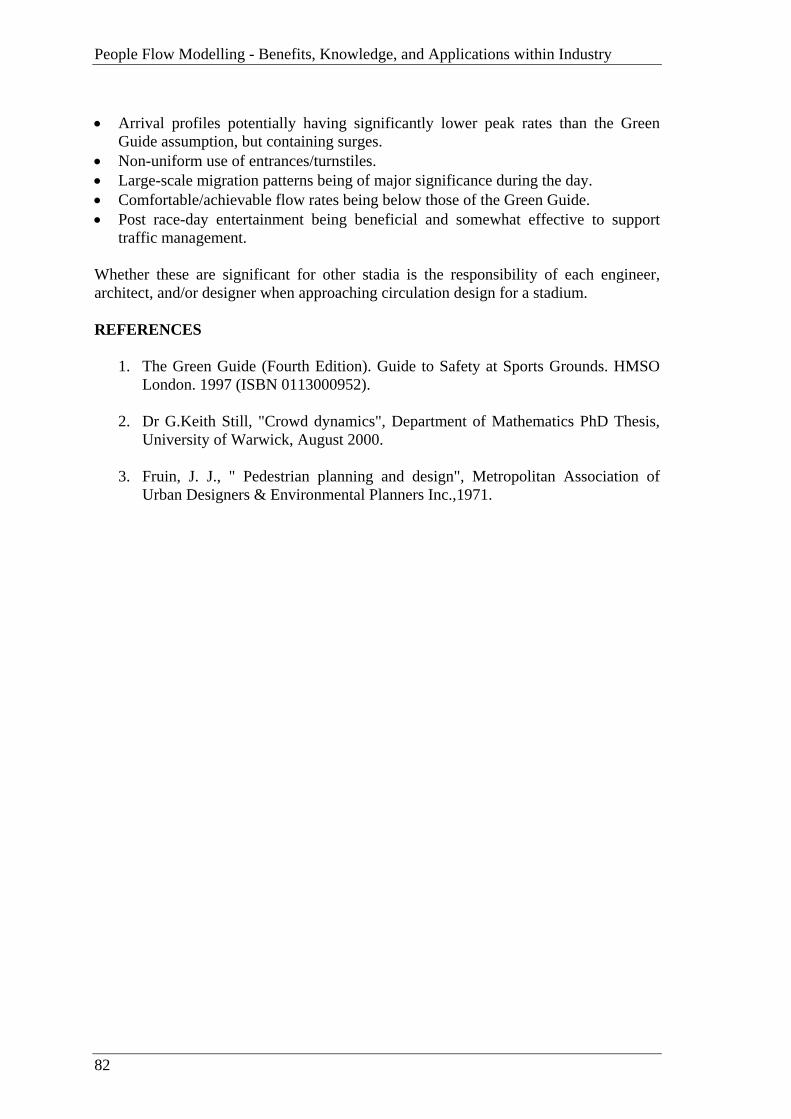
People Flow Modelling - Benefits, Knowledge, and Applications within Industry
82
• Arrival profiles potentially having significantly lower peak rates than the Green Guide assumption, but containing surges.
• Non-uniform use of entrances/turnstiles. • Large-scale migration patterns being of major significance during the day. • Comfortable/achievable flow rates being below those of the Green Guide. • Post race-day entertainment being beneficial and somewhat effective to support
traffic management. Whether these are significant for other stadia is the responsibility of each engineer, architect, and/or designer when approaching circulation design for a stadium. REFERENCES
1. The Green Guide (Fourth Edition). Guide to Safety at Sports Grounds. HMSO London. 1997 (ISBN 0113000952).
2. Dr G.Keith Still, "Crowd dynamics", Department of Mathematics PhD Thesis,
University of Warwick, August 2000. 3. Fruin, J. J., " Pedestrian planning and design", Metropolitan Association of
Urban Designers & Environmental Planners Inc.,1971.

Paper 2
83
APPENDIX B PAPER 2
David Brocklehurst, Prof Dino Bouchlaghem, Dr David Pitfield, Dr Garry Palmer, Dr Keith Still, 2005 ‘Crowd Circulation and Stadium Design; Low Flow Rate Systems’, published within Institution of Civil Engineers (ICE) ‘Structure and Buildings’ Journal, Thomas Telford Ltd, Thomas Telford House, 1 Heron Quay, London, E14 4JD, UK.
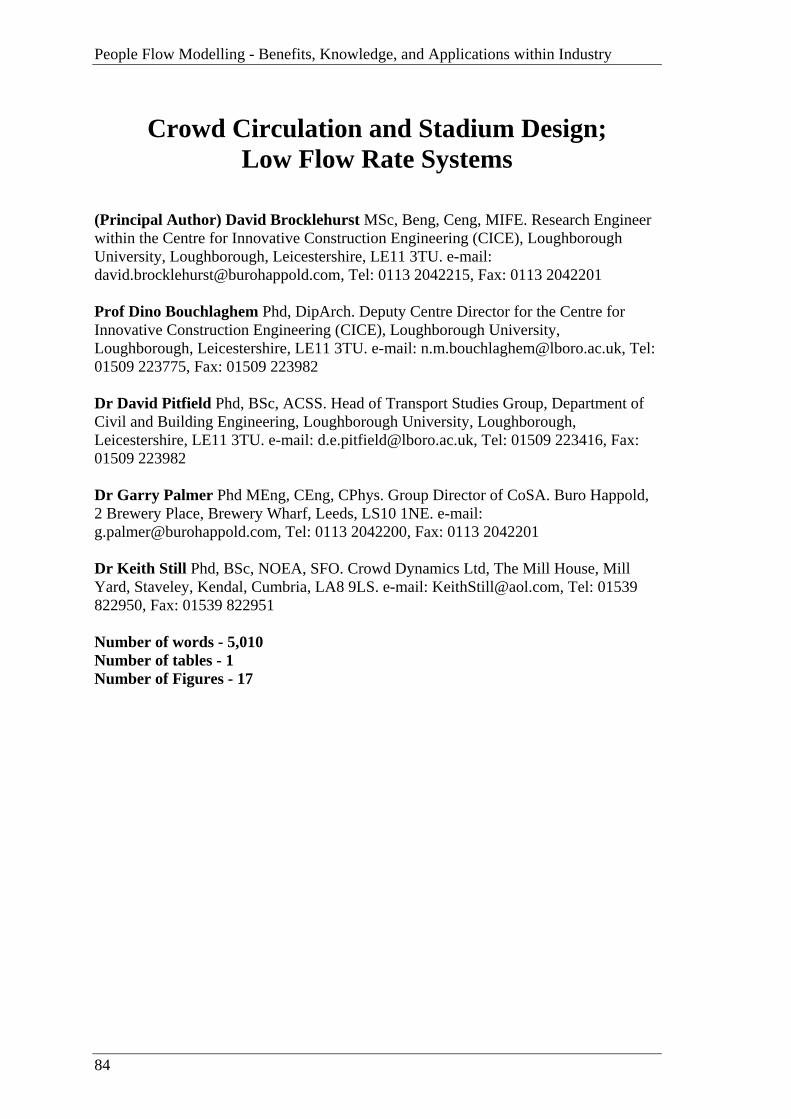
People Flow Modelling - Benefits, Knowledge, and Applications within Industry
84
Crowd Circulation and Stadium Design; Low Flow Rate Systems
(Principal Author) David Brocklehurst MSc, Beng, Ceng, MIFE. Research Engineer within the Centre for Innovative Construction Engineering (CICE), Loughborough University, Loughborough, Leicestershire, LE11 3TU. e-mail: [email protected], Tel: 0113 2042215, Fax: 0113 2042201 Prof Dino Bouchlaghem Phd, DipArch. Deputy Centre Director for the Centre for Innovative Construction Engineering (CICE), Loughborough University, Loughborough, Leicestershire, LE11 3TU. e-mail: [email protected], Tel: 01509 223775, Fax: 01509 223982 Dr David Pitfield Phd, BSc, ACSS. Head of Transport Studies Group, Department of Civil and Building Engineering, Loughborough University, Loughborough, Leicestershire, LE11 3TU. e-mail: [email protected], Tel: 01509 223416, Fax: 01509 223982 Dr Garry Palmer Phd MEng, CEng, CPhys. Group Director of CoSA. Buro Happold, 2 Brewery Place, Brewery Wharf, Leeds, LS10 1NE. e-mail: [email protected], Tel: 0113 2042200, Fax: 0113 2042201 Dr Keith Still Phd, BSc, NOEA, SFO. Crowd Dynamics Ltd, The Mill House, Mill Yard, Staveley, Kendal, Cumbria, LA8 9LS. e-mail: [email protected], Tel: 01539 822950, Fax: 01539 822951 Number of words - 5,010 Number of tables - 1 Number of Figures - 17
Paper 2
85
Abstract For the past 30 years, sports stadia design guides have contained generalised optimistic flow rates for the design of crowd evacuation and egress routes. Unfortunately, even though the guides recognise their own limitations and the fact that lower flow rates should be considered in certain situations, human nature, practical needs, and a lack of research leads to widespread use of guidance values that are sometimes inappropriate. It is imperative within risk assessment and circulation design that this phenomenon is better understood in order to limit the potential for under design at the risk of unwanted levels of queuing, congestion, and potentially unsafe conditions. This is especially important when considering the progressive move from prescriptive guidance to performance based design within the design industry. In recognition of this fact the new European Standard for the design of spectator facilities recommends design flow rates significantly lower than recommended in traditional sports guidance documents. This paper presents a significant contribution to this work by firstly providing supportive evidence for the new European Standard values when applied to football and rugby stadia, but secondly stating that the figures within traditional and new guidance should not be generally applied to what amounts to over 15 different stadia types. Case study evidence is provided to show that the new European Standard values still remain up to twice that observed in some stadia types. Reasoning is given to the occurrence of low capacity flow rates within these stadia and recommendations made for future work to ensure designers are using appropriate design flow rates for each stadium project. 1. Introduction In order to design pedestrian circulation routes within a sport stadium effectively, there must be an understanding of how people move under varying conditions. People movement behaviour can be considered to comprise of two basic elements. The first of these is the less constrained behaviour including time to move, destination choice and route choice. This is affected by personal needs and desires, learned behaviour in terms of the efficiency of obtaining those needs and social/environmental behaviour in terms of which routes will be most pleasant. The second is the more constrained side to behaviour that includes the maximum speeds people can/will obtain within different environments. For example, in a relatively high-density crowd, it is almost impossible for a person to move at a higher speed than dictated by the crowd. The second more constrained type of behaviour leads to the maximum flow rates or ‘capacities’ achievable by a crowd along a route. There are three fundamental components that combine together to provide the flow capacity within a route as shown in Equation 11,2,3. Eq.1 Flow rate (P/s) = mean speed (m/s) x mean density (P/m2) x width of route (m) The width and density within Equation 1 can be viewed as independent variables, with the speed having a substantially linear dependence upon density; except for the extremes of very high densities and near free flow 2,4,5. The ensuing flow-density relationship has been shown to take the form of a bell curve 6,8.
People Flow Modelling - Benefits, Knowledge, and Applications within Industry
86
For non-complex flows, Equation 1 is fundamentally correct. However, many factors can impact upon the three variables, leading to a variation in flow rates and capacities depending upon the environment and associated crowd profile 8,9. Even in a group of similar building types such as stadia, it is postulated that there can be a significant variation in flow rates. The main documented influences impacting on flow rate have been noted to be:
• Route/entrance type e.g. stairs, corridors, escalators, doors, gates, turnstiles 1,3,9,10,11
• Boundaries 2,12,13 • Obstacles 2,14 • Incline 2,14,15 • Route Length 14 • Corners 14,16,17 • Population Counter Flow 2,5,14,18 • Population Free speed (theorised to impact on flow capacity by Still19) • Population Skill/Drive/Experience 2
In relation to statutory documentation on flow rates, arguably the most prominent design guide for stadia within the UK is the Guide to Safety at Sports Grounds (Green Guide)20. This is a guide for general application to over 15 different stadia types but contains only two generalised design flow rates; one for level ground and one for stepped routes. In order to source these flow rates and determine their applicability, a review has been carried out using the preceding Green Guides23,24,25, the 1972 Report of the Enquiry into Crowd Safety at Sports Grounds (Wheatley Report)21, the SCICON16 report which was commissioned to form a support to the Wheatley Report21, and the 1991 Appraisal of Sports Grounds22 guide. It was concluded that the likely origin of the flow rates was the SCICON16 report into movement around football and rugby stadia. In relation to the validity of the values, we can refer directly back to the SCICON16 report. The peak flow rates gained at rugby and football stadia were 115 people/minute/metre and 82 people/minute/metre for gateways/portals and passageways respectively. The current flow rate within the Green Guide20 for level ground (109 people/metre/minute) was derived from the 115 people/metre/minute SCICON value through a process of rounding down and conversion of flow rate units. However, within the Green Guide, it became established not just for gateways and portals, but also for passageways and any other level routes. This is clearly optimistic when considering the value of 82 people/minute/metre for gateways/portals. Also, an important point made in the SCICON report is that once the whistle was blown for the end of the match, the flow rose almost immediately to capacity and remained constant for a period of 3-5 minutes. The graph for gateways and portals within the report show that the value of 115 people/minute/metre taken as a design value was an observed peak at one particular point in time within this capacity flow. Using a more appropriate 3 minute period as a basis for obtaining flow rates, the results would show an average flow rate for the fully loaded condition of between 89-106 people/minute/metre (average of 98 people/minute/metre) and 75 People/Minute/Metre for gateways/portals and passageways respectively. In assumed support of the
Paper 2
87
judgement that Green Guide20 level-ground flow rates are too high, the European Standard - Spectator Facilities Part 126 has provided a new flow rate of 83 people/minute/metre for level routes during egress and ingress. We now have a set of design flow rates that are more appropriate for use in a risk assessment when designing a football or rugby stadium; compared with the current Green Guide20 values. However, it needs to be recognised that there is no evidence that these flow rates are also applicable for the 13 other stadia types listed within the Green Guide20. In relation to this, it could be argued that the capacity flow rates of people from a football/rugby stadium with highly charged occupants would be very different from the capacity flow of people flowing out of such as a golf stand. This paper focuses on what we will refer to as ‘lower flow rate systems’ that may be present within the range of different sports stadia designed today and answers a number of questions in relation to the flow phenomena that exist. A case study is presented of a low flow rate system at Ascot Racecourse during Royal Week (2001/2002/2003). The questions to be answered within the paper are therefore:
• What are the capacity flow-rates at stadia like Ascot in relation to guidance values?
• What is the underlying phenomenon and what are the likely influences causing the low flow rate systems?
• How do we use the study to better understand and optimise the design of stadia? 2. Ascot Racecourse On each day of Royal Week, Ascot Racecourse has an attendance of over 70,000 spectators. There are 6 races each day and, following each race, there is a large-scale migration of people from viewing areas through the building to food/drink concessions, toilets, the Winner’s Enclosure, and to social lawn areas. An emphasis is given here to the main 8.6m wide vomitory leading from the grandstand viewing lawns into the main building (see Fig. 1). This route experiences long lasting capacity flow conditions.
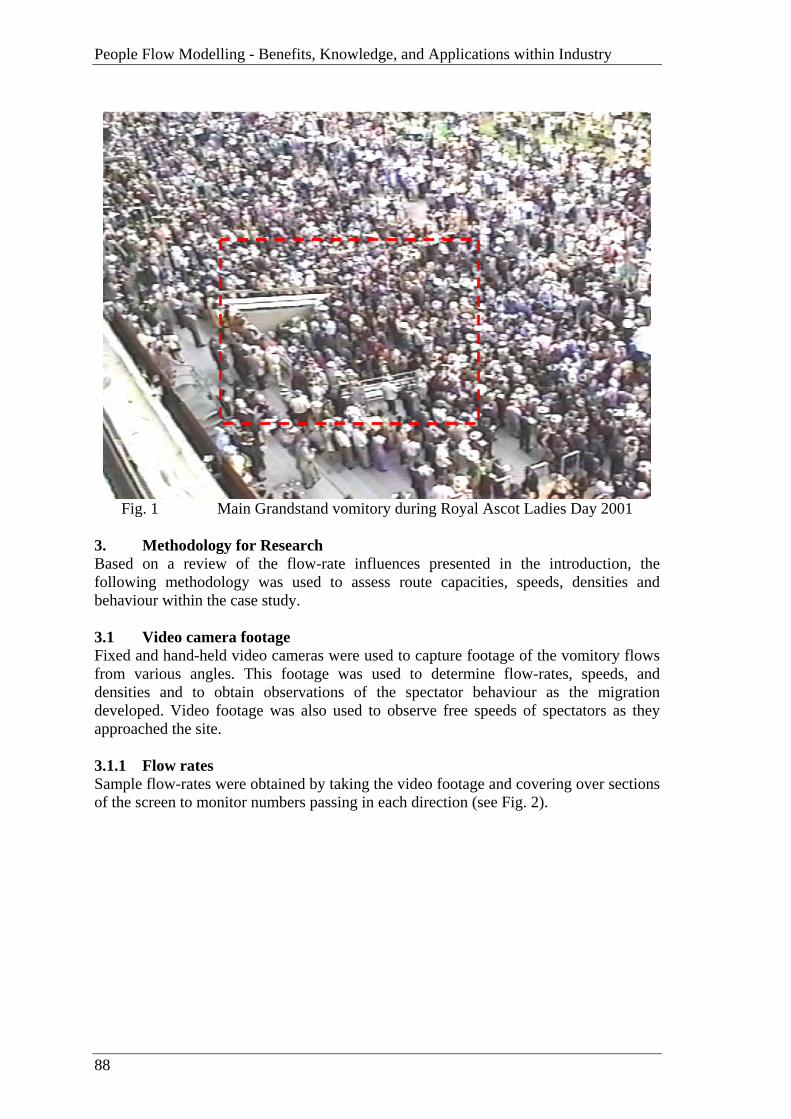
People Flow Modelling - Benefits, Knowledge, and Applications within Industry
88
Fig. 1 Main Grandstand vomitory during Royal Ascot Ladies Day 2001
3. Methodology for Research Based on a review of the flow-rate influences presented in the introduction, the following methodology was used to assess route capacities, speeds, densities and behaviour within the case study. 3.1 Video camera footage Fixed and hand-held video cameras were used to capture footage of the vomitory flows from various angles. This footage was used to determine flow-rates, speeds, and densities and to obtain observations of the spectator behaviour as the migration developed. Video footage was also used to observe free speeds of spectators as they approached the site. 3.1.1 Flow rates Sample flow-rates were obtained by taking the video footage and covering over sections of the screen to monitor numbers passing in each direction (see Fig. 2).
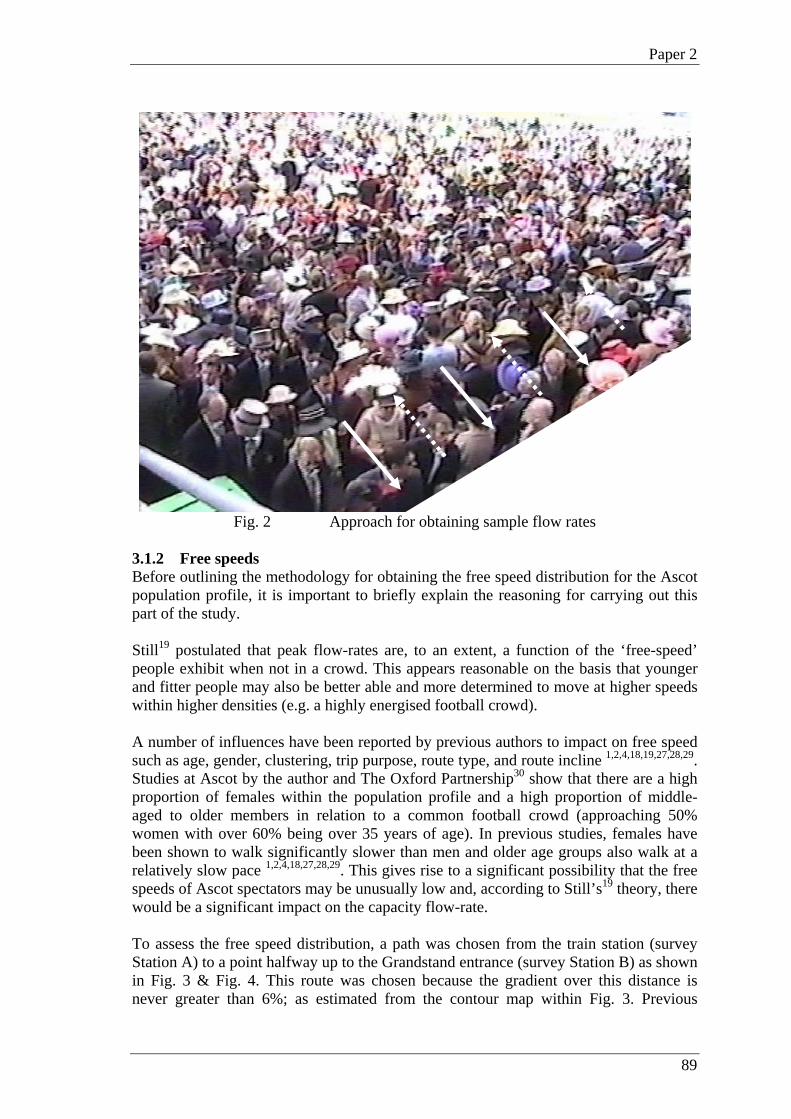
Paper 2
89
Fig. 2 Approach for obtaining sample flow rates
3.1.2 Free speeds Before outlining the methodology for obtaining the free speed distribution for the Ascot population profile, it is important to briefly explain the reasoning for carrying out this part of the study. Still19 postulated that peak flow-rates are, to an extent, a function of the ‘free-speed’ people exhibit when not in a crowd. This appears reasonable on the basis that younger and fitter people may also be better able and more determined to move at higher speeds within higher densities (e.g. a highly energised football crowd). A number of influences have been reported by previous authors to impact on free speed such as age, gender, clustering, trip purpose, route type, and route incline 1,2,4,18,19,27,28,29. Studies at Ascot by the author and The Oxford Partnership30 show that there are a high proportion of females within the population profile and a high proportion of middle-aged to older members in relation to a common football crowd (approaching 50% women with over 60% being over 35 years of age). In previous studies, females have been shown to walk significantly slower than men and older age groups also walk at a relatively slow pace 1,2,4,18,27,28,29. This gives rise to a significant possibility that the free speeds of Ascot spectators may be unusually low and, according to Still’s19 theory, there would be a significant impact on the capacity flow-rate. To assess the free speed distribution, a path was chosen from the train station (survey Station A) to a point halfway up to the Grandstand entrance (survey Station B) as shown in Fig. 3 & Fig. 4. This route was chosen because the gradient over this distance is never greater than 6%; as estimated from the contour map within Fig. 3. Previous

People Flow Modelling - Benefits, Knowledge, and Applications within Industry
90
research has shown this to have minimal effect on the free speeds 2,14,15. To carry out the experiment, 44 sampled times were taken of people moving from Station A to Station B at times when there was no congestion on the path. Also, the sample times were taken during the arrival period of the race day between 10 a.m. and 2 p.m, this was to ensure minimal effect of alcohol or tiredness. For each sample case, it was noted whether they were female (single or in a group of females), male (single or in a group of males), or in a group including females and males. The approximate ages of the people in the group were noted through observation and only groups were chosen where the ages were all similar. Therefore, the overall distance of 348m divided by the difference in times gives the person/group’s average free speed along the route.
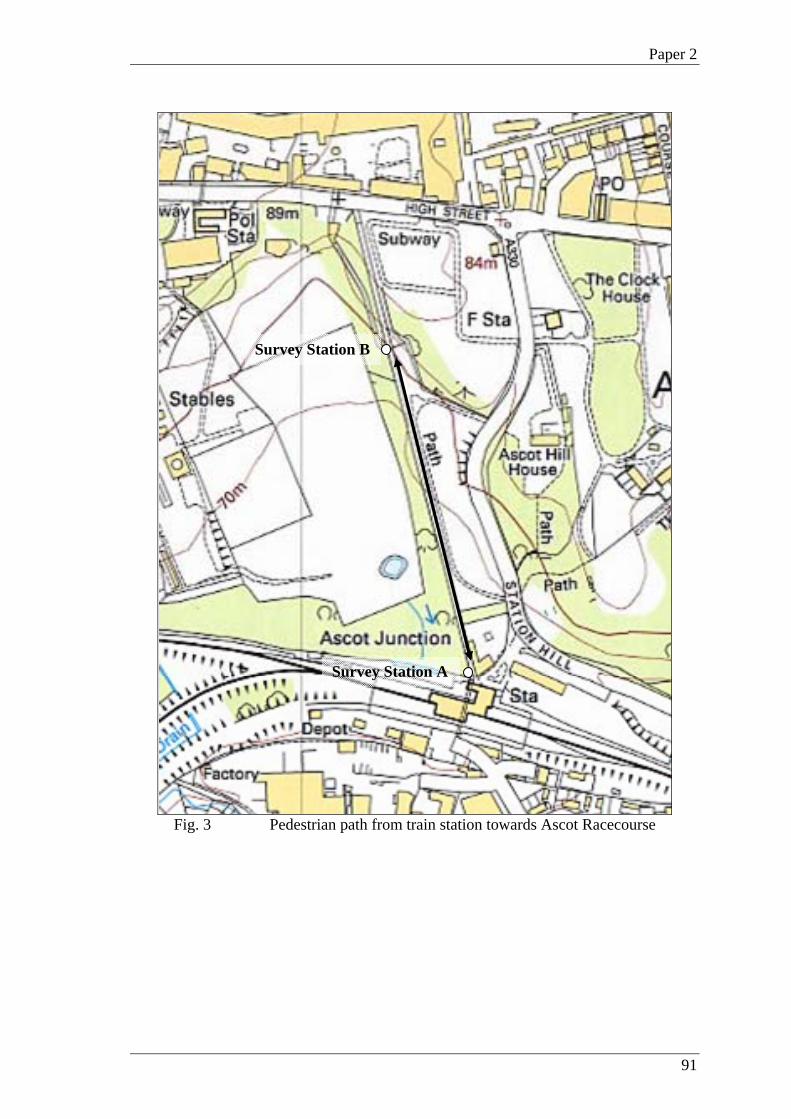
Paper 2
91
Fig. 3 Pedestrian path from train station towards Ascot Racecourse
Survey Station A
Survey Station B

People Flow Modelling - Benefits, Knowledge, and Applications within Industry
92
Fig. 4 Survey Station A (left) together with Survey Station B (right)
3.1.3 Density/speed measurements To assess the speed-density relationships for the main vomitory, video footage was taken from a high level box overlooking the route. Firstly, a time was found when the flagstones on the floor of the route could be clearly seen as shown in Fig. 5. Each flagstone has dimensions of 0.7m x 0.7m, giving the highlighted grid an area of 4.46m2. Overlaying this grid onto the capacity flow video footage and counting the people within a grid gave an approximate density of people per square metre (see Fig. 6).
Fig. 5 Area grid adopted for the study of crowd density within vomitory
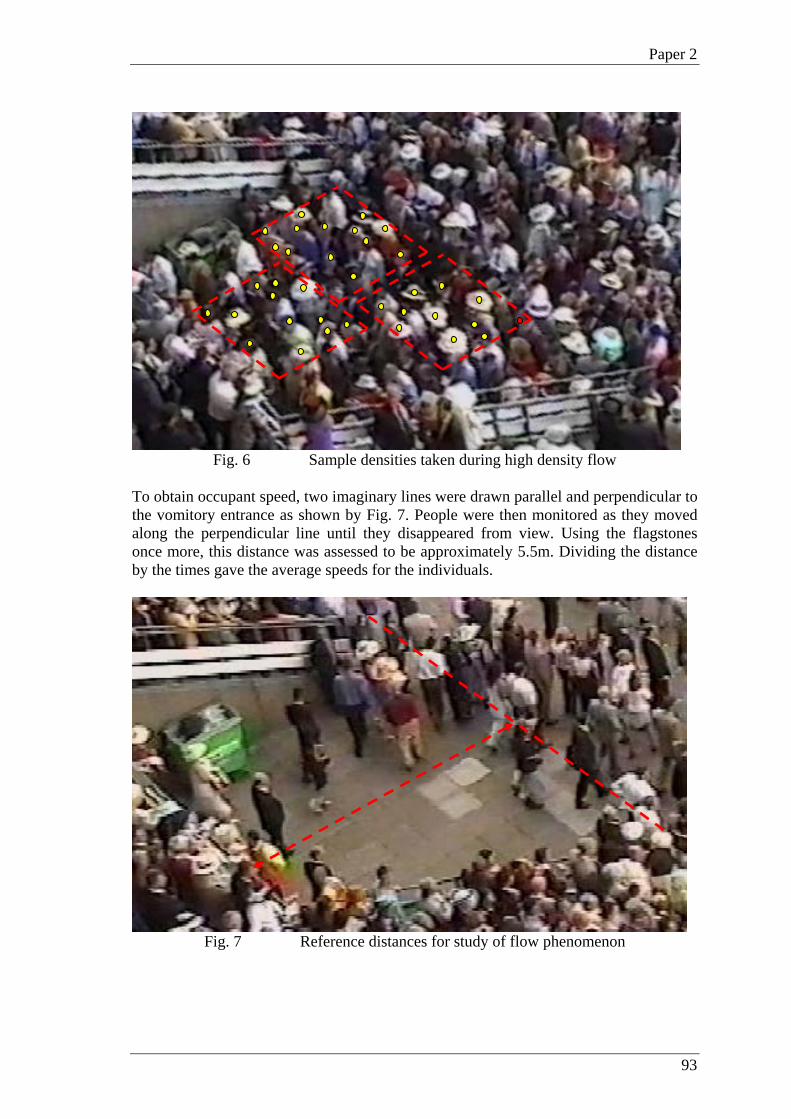
Paper 2
93
Fig. 6 Sample densities taken during high density flow
To obtain occupant speed, two imaginary lines were drawn parallel and perpendicular to the vomitory entrance as shown by Fig. 7. People were then monitored as they moved along the perpendicular line until they disappeared from view. Using the flagstones once more, this distance was assessed to be approximately 5.5m. Dividing the distance by the times gave the average speeds for the individuals.
Fig. 7 Reference distances for study of flow phenomenon
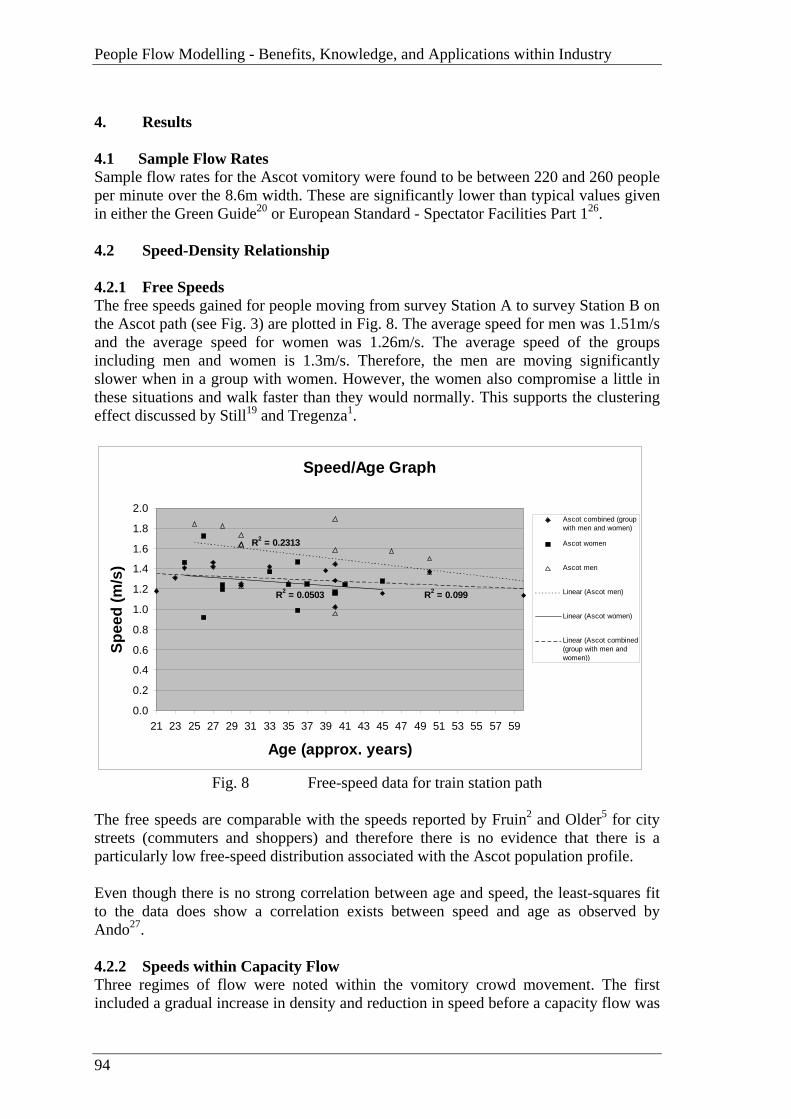
People Flow Modelling - Benefits, Knowledge, and Applications within Industry
94
4. Results 4.1 Sample Flow Rates Sample flow rates for the Ascot vomitory were found to be between 220 and 260 people per minute over the 8.6m width. These are significantly lower than typical values given in either the Green Guide20 or European Standard - Spectator Facilities Part 126. 4.2 Speed-Density Relationship 4.2.1 Free Speeds The free speeds gained for people moving from survey Station A to survey Station B on the Ascot path (see Fig. 3) are plotted in Fig. 8. The average speed for men was 1.51m/s and the average speed for women was 1.26m/s. The average speed of the groups including men and women is 1.3m/s. Therefore, the men are moving significantly slower when in a group with women. However, the women also compromise a little in these situations and walk faster than they would normally. This supports the clustering effect discussed by Still19 and Tregenza1.
Speed/Age Graph
R2 = 0.2313
R2 = 0.0503 R2 = 0.099
0.0
0.2
0.4
0.6
0.8
1.0
1.2
1.4
1.6
1.8
2.0
21 23 25 27 29 31 33 35 37 39 41 43 45 47 49 51 53 55 57 59
Age (approx. years)
Spee
d (m
/s)
Ascot combined (groupwith men and women)
Ascot women
Ascot men
Linear (Ascot men)
Linear (Ascot women)
Linear (Ascot combined(group with men andwomen))
Fig. 8 Free-speed data for train station path
The free speeds are comparable with the speeds reported by Fruin2 and Older5 for city streets (commuters and shoppers) and therefore there is no evidence that there is a particularly low free-speed distribution associated with the Ascot population profile. Even though there is no strong correlation between age and speed, the least-squares fit to the data does show a correlation exists between speed and age as observed by Ando27. 4.2.2 Speeds within Capacity Flow Three regimes of flow were noted within the vomitory crowd movement. The first included a gradual increase in density and reduction in speed before a capacity flow was
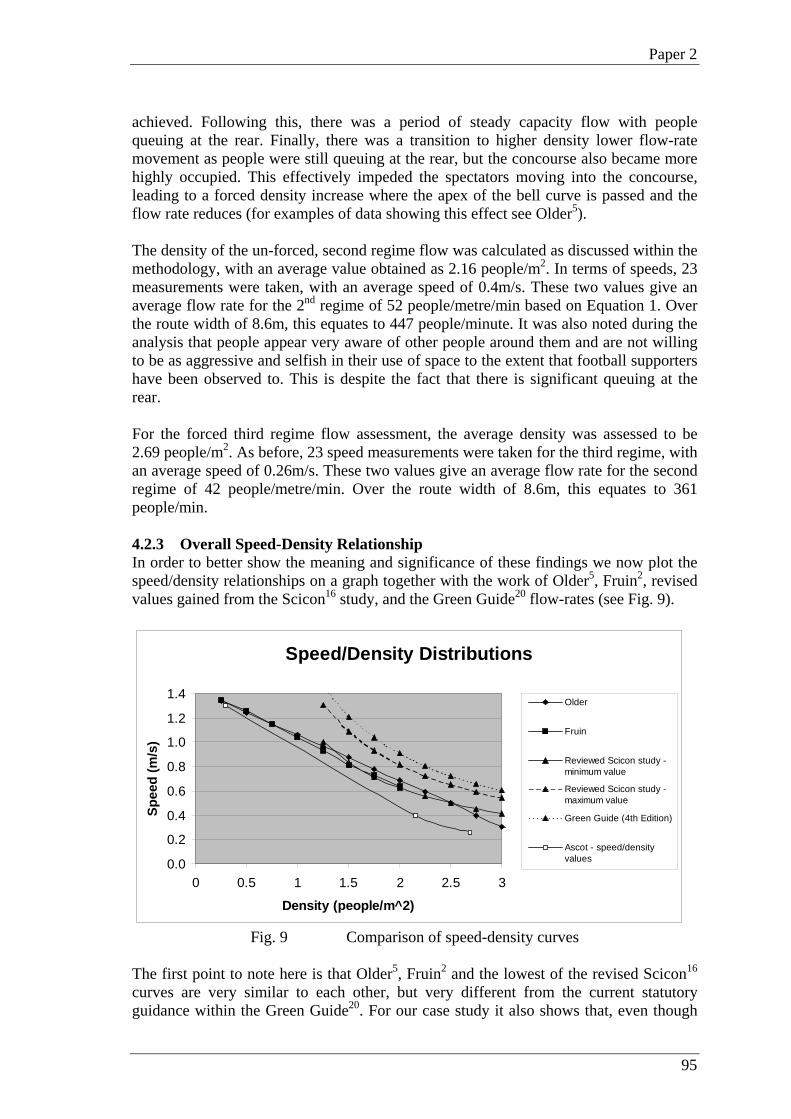
Paper 2
95
achieved. Following this, there was a period of steady capacity flow with people queuing at the rear. Finally, there was a transition to higher density lower flow-rate movement as people were still queuing at the rear, but the concourse also became more highly occupied. This effectively impeded the spectators moving into the concourse, leading to a forced density increase where the apex of the bell curve is passed and the flow rate reduces (for examples of data showing this effect see Older5). The density of the un-forced, second regime flow was calculated as discussed within the methodology, with an average value obtained as 2.16 people/m2. In terms of speeds, 23 measurements were taken, with an average speed of 0.4m/s. These two values give an average flow rate for the 2nd regime of 52 people/metre/min based on Equation 1. Over the route width of 8.6m, this equates to 447 people/minute. It was also noted during the analysis that people appear very aware of other people around them and are not willing to be as aggressive and selfish in their use of space to the extent that football supporters have been observed to. This is despite the fact that there is significant queuing at the rear. For the forced third regime flow assessment, the average density was assessed to be 2.69 people/m2. As before, 23 speed measurements were taken for the third regime, with an average speed of 0.26m/s. These two values give an average flow rate for the second regime of 42 people/metre/min. Over the route width of 8.6m, this equates to 361 people/min. 4.2.3 Overall Speed-Density Relationship In order to better show the meaning and significance of these findings we now plot the speed/density relationships on a graph together with the work of Older5, Fruin2, revised values gained from the Scicon16 study, and the Green Guide20 flow-rates (see Fig. 9).
Speed/Density Distributions
0.0
0.2
0.4
0.6
0.8
1.0
1.2
1.4
0 0.5 1 1.5 2 2.5 3
Density (people/m^2)
Spee
d (m
/s)
Older
Fruin
Reviewed Scicon study -minimum value
Reviewed Scicon study -maximum value
Green Guide (4th Edition)
Ascot - speed/densityvalues
Fig. 9 Comparison of speed-density curves
The first point to note here is that Older5, Fruin2 and the lowest of the revised Scicon16 curves are very similar to each other, but very different from the current statutory guidance within the Green Guide20. For our case study it also shows that, even though
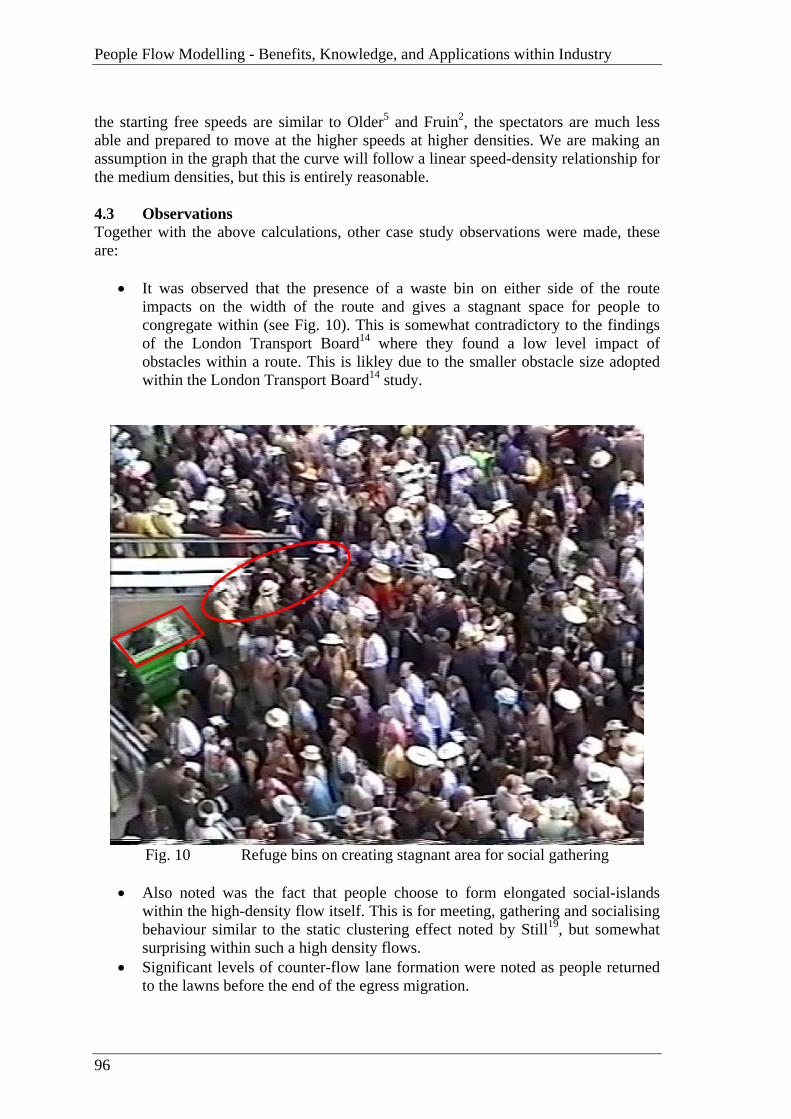
People Flow Modelling - Benefits, Knowledge, and Applications within Industry
96
the starting free speeds are similar to Older5 and Fruin2, the spectators are much less able and prepared to move at the higher speeds at higher densities. We are making an assumption in the graph that the curve will follow a linear speed-density relationship for the medium densities, but this is entirely reasonable. 4.3 Observations Together with the above calculations, other case study observations were made, these are:
• It was observed that the presence of a waste bin on either side of the route impacts on the width of the route and gives a stagnant space for people to congregate within (see Fig. 10). This is somewhat contradictory to the findings of the London Transport Board14 where they found a low level impact of obstacles within a route. This is likley due to the smaller obstacle size adopted within the London Transport Board14 study.
Fig. 10 Refuge bins on creating stagnant area for social gathering
• Also noted was the fact that people choose to form elongated social-islands
within the high-density flow itself. This is for meeting, gathering and socialising behaviour similar to the static clustering effect noted by Still19, but somewhat surprising within such a high density flows.
• Significant levels of counter-flow lane formation were noted as people returned to the lawns before the end of the egress migration.

Paper 2
97
• Higher densities were observed to occur at the corners of the vomitory entrance but these were not seen to impact on the density or speed within the main vomitory flow itself (see Fig. 11).
Fig. 11 Impact of corners on vomitory flows
5. Discussion 5.1 Observed Flow Rates To summarise the findings of the case study, the sample flow rates gained for Ascot are tabulated in Table 1 and compared with values from design guides.
Table 1 Flow rate comparisons Flow Rate (people/minute/metre)
Green Guide 20
Revised values based on Scicon16 graph data
European Standard - Spectator Facilities Part 1 26
Ascot sampled values
Ascot rates based on density and
speed (Equation 1)
Level Routes
109 75 - 98 83 26-30 (forced flow)
42 (forced flow) – 52 (unforced flow)
This table shows a difference of up to 300% between guidance values and measured flow rates.

People Flow Modelling - Benefits, Knowledge, and Applications within Industry
98
It is concluded from Section 4.2.3 that a substantial part of the low capacity-flow-rate phenomenon within the case study vomitory is due to the fact that people are not prepared to move at higher speeds at higher densities (see Fig. 9). The reasoning for this is postulated to be:
1. Inability/reluctance to move at high speed within high density due to social requirement not to offend others by bumping into them (lack of selfish/aggressive behaviour); especially in relatively expensive clothing
2. lack of experience in high density flows 3. high levels of spectators in higher age groups and a high proportions of females;
the clustering effect of mixed groups has been observed to reduce the average free speed from 1.51m/s to 1.3m/s
4. the presence of high levels of counter flow within the high density crowd Where a new stadium is likely to have similar differences in the population profile compared with a football/rugby stadium it is reasonable to say that the capacity flow rates achieved will also be significantly lower than traditional design guidance. It can be stated that factors 1 and 2 are of greatest importance compared to 3 and 4. This is justified firstly following a review of the work by Older5. In his study of shoppers on Oxford St (London) there were significantly higher flow rates obtained than within this study even though it can be assumed that there was a high proportion of females present. Secondly, a review of the work by Navin and Wheeler18 shows that the loss in overall capacity of a route due to counter-flow is a maximum of 4.5%. This is further supported by the fact that no significant reduction in flow rate due to counter-flow was noted within the surveys carried out by the London Transport Board14 and Older5. Consideration is now given to the forced flow regime of the case study and the difference between the sampled capacity flow rates and those obtained using the speed density relationship (Equation 1). The reasoning for the difference can be found from another observation made during the study in relation to the presence of obstacles (see Section 3.3). Fig. 12 and Fig. 13 give the snapshots from our sampling times with colour overlays to illustrate the various phenomenon involved (chequered pattern – flow into grandstand, horizontal lines – flow out of grandstand, diagonal lines – stationary groups and refuge bins). Both of the sample cases have approximately 2.4m of the route width reduced by refuge bins, but Sample Case 2 has an elongated social grouping reducing the width even further.

Paper 2
99
Fig. 12 Sample Case 1 at the main Ascot vomitory
(flow rate – 260 people/minute/metre)
Fig. 13 Sample Case 2 at the main Ascot vomitory
(flow rate – 220 people/minute/metre)
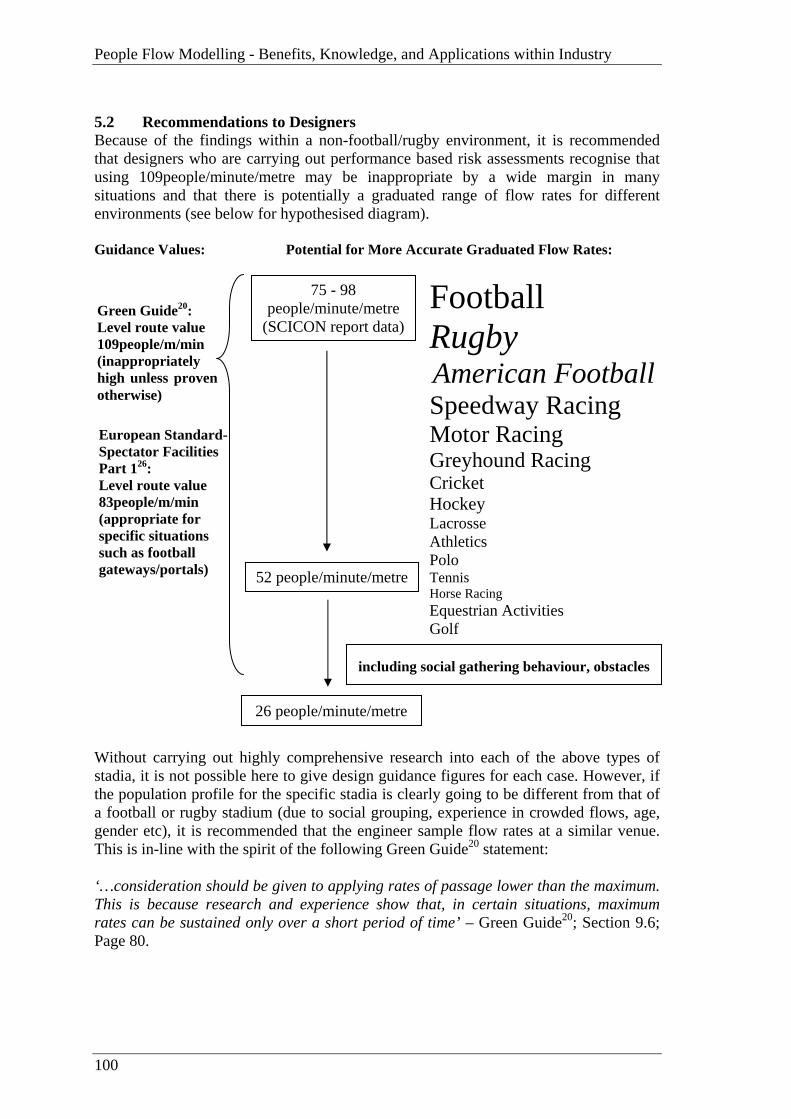
People Flow Modelling - Benefits, Knowledge, and Applications within Industry
100
5.2 Recommendations to Designers Because of the findings within a non-football/rugby environment, it is recommended that designers who are carrying out performance based risk assessments recognise that using 109people/minute/metre may be inappropriate by a wide margin in many situations and that there is potentially a graduated range of flow rates for different environments (see below for hypothesised diagram). Guidance Values: Potential for More Accurate Graduated Flow Rates:
Football Rugby
American Football Speedway Racing
Motor Racing Greyhound Racing Cricket Hockey Lacrosse Athletics Polo Tennis Horse Racing Equestrian Activities Golf Without carrying out highly comprehensive research into each of the above types of stadia, it is not possible here to give design guidance figures for each case. However, if the population profile for the specific stadia is clearly going to be different from that of a football or rugby stadium (due to social grouping, experience in crowded flows, age, gender etc), it is recommended that the engineer sample flow rates at a similar venue. This is in-line with the spirit of the following Green Guide20 statement: ‘…consideration should be given to applying rates of passage lower than the maximum. This is because research and experience show that, in certain situations, maximum rates can be sustained only over a short period of time’ – Green Guide20; Section 9.6; Page 80.
75 - 98 people/minute/metre
(SCICON report data)
52 people/minute/metre
26 people/minute/metre
including social gathering behaviour, obstacles
Green Guide20: Level route value 109people/m/min (inappropriately high unless proven otherwise)
European Standard- Spectator Facilities Part 126: Level route value 83people/m/min (appropriate for specific situations such as football gateways/portals)
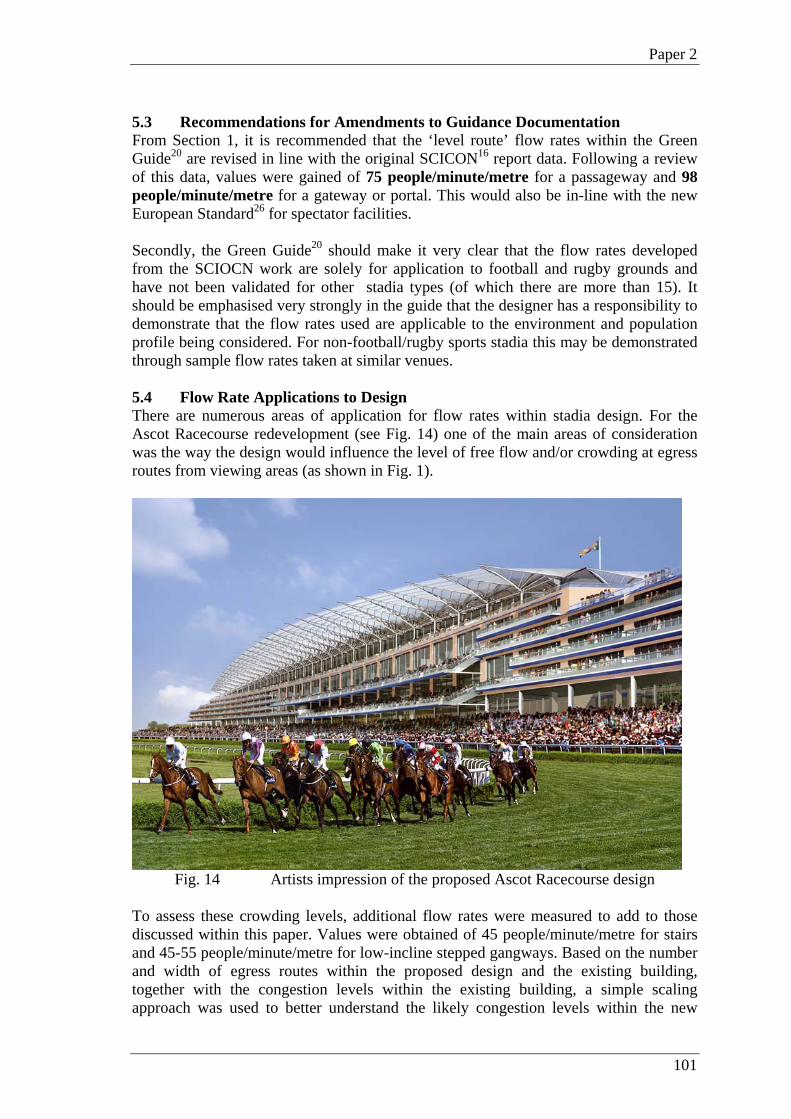
Paper 2
101
5.3 Recommendations for Amendments to Guidance Documentation From Section 1, it is recommended that the ‘level route’ flow rates within the Green Guide20 are revised in line with the original SCICON16 report data. Following a review of this data, values were gained of 75 people/minute/metre for a passageway and 98 people/minute/metre for a gateway or portal. This would also be in-line with the new European Standard26 for spectator facilities. Secondly, the Green Guide20 should make it very clear that the flow rates developed from the SCIOCN work are solely for application to football and rugby grounds and have not been validated for other stadia types (of which there are more than 15). It should be emphasised very strongly in the guide that the designer has a responsibility to demonstrate that the flow rates used are applicable to the environment and population profile being considered. For non-football/rugby sports stadia this may be demonstrated through sample flow rates taken at similar venues. 5.4 Flow Rate Applications to Design There are numerous areas of application for flow rates within stadia design. For the Ascot Racecourse redevelopment (see Fig. 14) one of the main areas of consideration was the way the design would influence the level of free flow and/or crowding at egress routes from viewing areas (as shown in Fig. 1).
Fig. 14 Artists impression of the proposed Ascot Racecourse design
To assess these crowding levels, additional flow rates were measured to add to those discussed within this paper. Values were obtained of 45 people/minute/metre for stairs and 45-55 people/minute/metre for low-incline stepped gangways. Based on the number and width of egress routes within the proposed design and the existing building, together with the congestion levels within the existing building, a simple scaling approach was used to better understand the likely congestion levels within the new

People Flow Modelling - Benefits, Knowledge, and Applications within Industry
102
design. Fig. 15 illustrates one of the outputs from the Ascot analysis, where the overall bar chart height indicates the time taken to move from the grandstand lawn to the parade ring, with the darker sectiona showing the time experienced within congested flow.
Grandstand Lawn - Parade Ring (average origin-destination times)
0
100
200
300
400
500
600
700
800
900
existing new
time incongestion
time infree flow
Fig. 15 Example congestion analysis output for proposed Ascot Racecourse design
This analysis is based on certain assumptions in relation to all-things-being-equal for the existing and new developments. Even though realistic for the Ascot problem, a new racecourse would require the flow rate data combined with design team judgements and further research on percentage use of viewing areas, post race movement profiles, and disproportionate use of routes. Once people leave the initial viewing egress routes, predicted destination profiles can be adopted to carry out flow rate assessments for down-stream regions within a stadium. Fig. 16 shows downstream congestion occurring within the existing Ascot racecourse (at the head of a tunnel) and a flow rate assessment made for the new Ascot development. In this case, destination profiles were agreed as appropriate with the design team and an analysis was made of the cumulative flow rates entering numerous pinch-points compared with the capacity of the pinch-points.

Paper 2
103
Fig. 16 Down-stream congestion analysis for Ascot racecourse
The flow rate based techniques presented above can be advanced further using agent based modelling, where the experience of each individual can be monitored as they move through the system from origin to destination (example illustration given in Fig. 17).
Fig. 17 Agent based modelling of flow through a 20m wide level route within
Ascot Racecourse Through the application of appropriate flow rates to the new design of Ascot racecourse, many areas have been influenced to optimise occupant comfort. These areas include:
• A major approach tunnel to the racecourse has been changed from having steep stepped access to level access (increasing flow capacity).
• It has been possible to choose and optimise the number of turnstiles being included within the scheme.
• The flow capacity of egress routes from viewing areas has been more than doubled compared with the original design proposals.
• Tote betting booths, bars and food concessions within the main Galleria have been rotated through 90 degrees to be away from high flow-rate spectator movement.
• A greater number of escalators have been included within the scheme, with escalator speeds increased from 0.5m/s to 0.65m/s (giving an appropriate level of escalator service for people travelling from above to such as the parade ring).

People Flow Modelling - Benefits, Knowledge, and Applications within Industry
104
6. Conclusions The main conclusions from this paper are:
• Designers carrying out a risk assessment for a football/rugby stadium should take into account that the Green Guide20 value of 109 people/minute/m is likely to be inappropriately high for evacuation, egress, or circulation (until it is shown that this value can occur). A better maximum value to be adopted for a football/rugby stadium would be between 75 people/minute/m for a passageway and 98 people/minute/metre for a gateway or portal. These values are developed from the original SCICON report data studying flows at rugby grounds and football stadia.
• When deciding upon appropriate flow rates to base a stadium design on, it is imperative that the designer accepts a potentially large range of flow rates at different stadia, for different population profiles, and for different events. There is an onus on the designer to review the spectators who will be present in order to qualitatively determine the following:
o level of determination o level of experience in high density flows o proportion of females o proportion of older aged occupants o potential for counter flow o potential for forced flow phenomenon
With these factors all working negatively in relation to the flow rate, it is possible for the flow rate to be reduced by as much as ½ (even before accounting for obstacles). Where it is clear that there may be a ‘low flow rate system’ present, the designer should carry out flow rate sampling at a similar venue to that being designed.
• Consideration must be given by the designer to the flow rate being reduced by the presence of obstacles such as refuge bins (unless this can be managed out of the design).
• Unless social environments can be sufficiently managed or areas can be provided for social interaction near to the entrances but away from the flow, it may be necessary to account for a reduced flow rate due to social gathering behaviour within the high-density flow.
It is not the intention here to say that all stadia designed to current guidance are unsafe. There are many design factors that impact on safety and comfort which all work together to give a level of performance. Also, most modern football and rugby stadium designs are multi-storey, with the constraining factor on flow being the stairs. In this instance, the 73people/minute/metre recommended by the Green Guide for stepped routes is relatively close to the SCICON data of 68people/minute/metre for stairs (even though this would be very high compared to a low flow rate system such as Ascot where 35people/minute/metre observations have been made for stairs). However, the fact that there are areas of stadia that do include flat routes and there are over 15 different types of stadia being designed, the responsible engineer should be clear as to the applicability of the data used within analysis or at least know that they are in the right ‘ball park’ for the venue and terrain. This applies to circulation, egress, and evacuation.

Paper 2
105
Further research recommended to support this work is seen to be:
• Consideration in greater detail of the quantified relative importance of age, gender, determination, experience (etc) on flow rates.
• Further sampling of flow rates for different stadia and population profiles. References: 1. Tregenza P. The Design of Interior Circulation: people and buildings, Crosby
Lockwood Staples, London, 1976, ISBN 025 8969 989. 2. Fruin, J. J. Pedestrian planning and design, Elevator World Inc. (Educational
Services Division), Alabama, 1987, LIB.CON 70-159312. 3. Society of Fire Protection Engineers/National Fire Protection Association, The
SFPE Handbook of Fire Protection Engineering; 2nd Edition (Chapter 14 Emergency Movement), National Fire Protection Association, Massachusetts, 1995, ISBN 0-87765-354-2.
4. Polus A., Joseph L. Schofer, and Ushpiz A., Pedetsrian Flow and Level of Service, Journal of Transportation Engineering, 1983, Vol. 109, January, pp. 46-56.
5. Older S.J., Movement of Pedestrians on Footways in Shopping Streets, Traffic Engineering and Control, 1968, August, pp. 160-163..
6. Blue V. and Adler J., Bi-Directional Emergent Fundamental Pedestrian Flows From Cellular Automata Microsimulation, Proceedings of the 14th International Symposium on Transportation and Traffic Theory. Israel, 1999, pp. 235-254.
7. Virkler, M.R. and S. Elayadath. Pedestrian Speed-Flow-Density Relationships. Transportation Research Record, 1994, Vol. 1438, pp. 51-58.
8. Stanton R.J.C. and Wanless G.K., Pedestrian Movement, Proceedings of the International Conference of Engineering for Crowd Safety, London, 1993, pp. 71-79.
9. Ministry of Works/Joint Committee of the Building Research Board of the Department of Scientific & Industrial Research and of the Fire Offices Committee, Post War Building Studies No. 29 Fire Grading of Buildings Parts II, III,and IV, H.M.S.O., London 1952.
10. The Chartered Institute of Building Services Engineers (CIBSE), CIBSE Guide E Fire Engineering, The Chartered Institute of Building Services Engineers, London, 1997, ISBN 0 900953 78 0.
11. The Chartered Institute of Building Services Engineers (CIBSE), CIBSE Guide D Transportation systems in buildings, The Chartered Institute of Building Services Engineers, London, 1993 ISBN 0 900953 57 8
12. Habicht T.A. and Braaksma J.P., Effective Width of Pedestrian Corridors, Journal of Transportation Engineering, 1984, Vol. 110, January, pp. 80-93.
13. Pauls J. L., Fires and Human Behaviour (Chapter14: Building Evacuation: Research Findings and Recommendations), John Wiley & Sons, Chichester/New York/Brisbane/Toronto,1980.
14. London Transport Board, Second Report of the Operational Research Team on the Capacity of Footways (Research Report No. 95), London Transport Board, London, 1958.
15. Department of scientific and industrial research; Road Research Laboratory (TRL), Research on Road Traffic, HMSO, London, 1965.

People Flow Modelling - Benefits, Knowledge, and Applications within Industry
106
16. SCICON, Safety in football stadia: a method of assessment [study condcucted by SCICON for the Wheatley enquiry into crowd safety at sports grounds], London: SCICON, 1972.
17. Tsuji Y., Numerical Simulation of Flow at High Densities, Proceedings of the Pedestrian and Evacuation Dynamics 2003 conference, London, 2003, pp. 27-38.
18. Navin F. P.D. and Wheeler R.J., Pedestrian Flow Characteristics, Traffic Engineering, 1969, Vol. 19, June, pp. 30-33.
19. Still K., Crowd dynamics [PhD thesis], University of Warwick; Department of Mathematics, Warwick, 2000.
20. The Scottish Office, Guide to Safety at Sports Grounds (Fourth Edition), The Stationary Office, London, 1997, ISBN 0 11 300095 2.
21. The Rt. Hon. Lord Wheatley, Report of the Inquiry into Crowd Safety at Sports Grounds, HMSO, London, 1972.
22. Institution of Structural Engineers (IStructE), Appraisal of sports grounds, Institution of Structural Engineers, London, 1991.
23. Home Office/Scottish Home and Health Department, Guide to Safety at Sports Grounds (First Edition), HMSO, 1973, ISBN 0 11 340558 8.
24. Home Office/Scottish Home and Health Department, Guide to Safety at Sports Grounds (Football) (Second Edition), HMSO, 1976, ISBN 0 11 340761 0.
25. Home Office/Scottish Home and Health Department, Guide to Safety at Sports Grounds (Football) (Third Edition), HMSO, 1985, ISBN 0 11 3407610.
26. British Standards Institute (BSI), BS EN 13200-1:2003 Spectator facilities; layout criteria for spectator viewing area; specification, British Standards Institute, London, 2003, ISBN 058043236X.
27. Ando K. Ota H. Oki T., Forecasting the Flow Of People, Railway Research Review, 1988, Vol. 45, August, pp. 8-14.
28. Peschl R., Untersuchungen uber die Leistangsfahigkeit ungeschutzter Fussgangeruberwege [Research into the capacity of unprotected pedestrian crossings] text in German, Strassertechnik, 1957, Vol. 5, pp. 63-7.
29. Henderson L. F. and Lyons D.J., Sexual Differences in Human crowd Motion, Nature, 1972, Vol. 240, December, P. 353 -355.
30. Understanding Demand for Blue Square Shergar Cup Day/Understanding Demand for De Beers Diamond [study conducted by The Oxford Partnership for Ascot Racecourse and data presented in power-point presentation format], Ascot, 2001.

Paper 3
107
APPENDIX C PAPER 3
David Brocklehurst, Prof Dino Bouchlaghem, Dr David Pitfield, M.G.Green, Dr Keith Still, 2004, ‘Capacity Flows on Stadia Stairs; Potential for Low Flow Rate Systems’, conference poster presentation at 3rd International Symposium on Human Behaviour in Fire, for proceedings contact Interscience Communications, University of Ulster.
People Flow Modelling - Benefits, Knowledge, and Applications within Industry
108
CAPACITY FLOWS ON STADIA STAIRS; POTENTIAL FOR LOW FLOW RATE SYSTEMS
David Brocklehurst*/**, M.G.Green*, Dr D.Bouchlaghem**, Dr D.E.Pitfield **, Dr K.Still ***
* Buro Happold
** CICE Department of Civil and Building Engineering, Loughborough University *** Crowd Dynamics Limited
ABSTRACT
The calculation of evacuation times within buildings has historically been broken down into pre-movement times and flow times. The pre-movement times include the time to fire detection and the time for occupants to respond to the warning that follows detection. The flow time is the time taken for occupants to move through the evacuation system. This includes a time when movement is uninhibited (often associated with the room of origin) and a time within congested flow (often associated with the exit from the room and on the subsequent stairs). The time taken within congested flow is dependent upon the flow rate achieved by that part of the system. This paper examines the second part of this and focuses on congested flow rates on sports stadia stairs. In doing this, it considers the design flow rates recommended within contemporary design guidance and investigates the occurrence and the causes for systems that exhibit significantly lower flow rates than the recommendations. 1. INTRODUCTION Due to a lack of in-depth research, a significant number of contemporary design guides still recommend generalised evacuation/egress flow rates i.e. one or two values to cater for a wide range of different situations. This is the case within the Guide to Safety at Sports Grounds1 (Green Guide) which contains only 2 design flow rates. In its favour, the guide does recognise this fact and recommends the following: ‘… consideration should be given to applying rates of passage lower than the maximum. This is due to the fact that the stated flow rates can not be sustained for long periods of time.’ However, no indication is made as to what may influence flow rates, there is a failure to show what the range of differences in flow rates may be, and no indication is given as to what the designer should do to determine appropriate values. The fact that this point is not made stronger within the document and the lack of further guidance in this area leads designers to generally use the Green Guide1 values for all sports stadia situations. This paper considers this issue in relation to stair flow rates in stadia and the potential for lower egress/evacuation rates to occur than those contained within guidance documentation. An assessment is made of the development and validity of the Green Guide1 design values. Following this, case study results are presented for stairs at Ascot Racecourse; one of over 15 stadia types covered by the Green Guide1.
Paper 3
109
2. GUIDANCE DOCUMENTATION REVIEW In relation to statutory documentation on flow rates, arguably the most
prominent design guide for stadia within the UK is the Guide to Safety at Sports Grounds (Green Guide)1. In order to examine the origins of this flow rate and determine it’s applicability, a review has been carried out using the preceding Green Guides2,3,4, the 1972 Report of the Enquiry into Crowd Safety at Sports Grounds (Wheatley Report)5, the SCICON6 report which was commissioned to form a support to the Wheatley Report5, and various fire guidance such as the Post War Building Studies7. Even though the current Green Guide1 references the Wheatley Report5 and hence the SCICON6 study as the origins for the earliest version of the guide, it is clear that the SCICON6 flow rate data was not used for stairs and stepped routes. Between the production of the Wheatley Report5 and the first Green Guide2, there was an adoption of 40 people/minute/unit width for stairs (unit width specified as 550mm). This converts directly to the 73 people/metre/minute within the current Green Guide1. The unit width criterion and value adopted give a strong indication that there was the change to the use of a fire evacuation guidance value specified in such as the Post War Building Studies7. Within this document, there is an evacuation flow rate adopted of 40 people/minute/unit width together with a unit width of 533mm. In relation to the validity of the Green Guide1,2,3,4 value to football/rugby stadia, it is firstly worth carrying out a critique of the SCICON6 report, for which data was gathered from football/rugby stadia environments. The flow rate noted as applicable for stairs within the SCICON6 report was 82people/metre/min. However, the graphs for stairways within the report show that the value of 82people/metre/min was an observed peak at one particular point in time and not a sustained value (as noted by the current Green Guide1). Also, an important point made in the SCICON6 report is that once the whistle was blown for the end of the match, the flow rose almost immediately to capacity and remained constant for a period of 3-5 minutes. Therefore, if the capacity is sustained at different rates over the longer period, it is more appropriate to use a mean of the capacity flow rates observed. Therefore, considering graph data over a more appropriate 2-3 minute period, the results would show an average flow rate for the fully loaded condition of between 62-75 people/metre/min (overall average of 68 people/metre/min). In apparent support of this judgement, the European Standard - Spectator Facilities Part 18 contains a new flow rate of 66 people/metre/min for stepped surfaces during egress. It is concluded that a flow rate of 68 people/metre/min or 66 people/metre/min is appropriate for the design of football and rugby stadium stairs and not the current Green Guide1 value or the original ‘peak’ SCICON6 value. However, it still needs to be recognised that there is no evidence that this flow rate is also applicable for the 13 other stadia types listed within the Green Guide1. 3. ASCOT RACECOURSE
Ascot Racecourse is a high capacity stadium having an attendance of over 70,000 spectators during each day of Royal Week. The Ascot location was chosen because it has a population profile assumed to be different than a football/rugby stadium, but which is still one of the stadium types covered by the Green Guide1. It also has a large-scale post-race migration from viewing areas to food/drink concessions, toilets, the Winner’s Enclosure (etc), and a large-scale egress following the end-of-day communal singing period. There is therefore the opportunity to study fully loaded
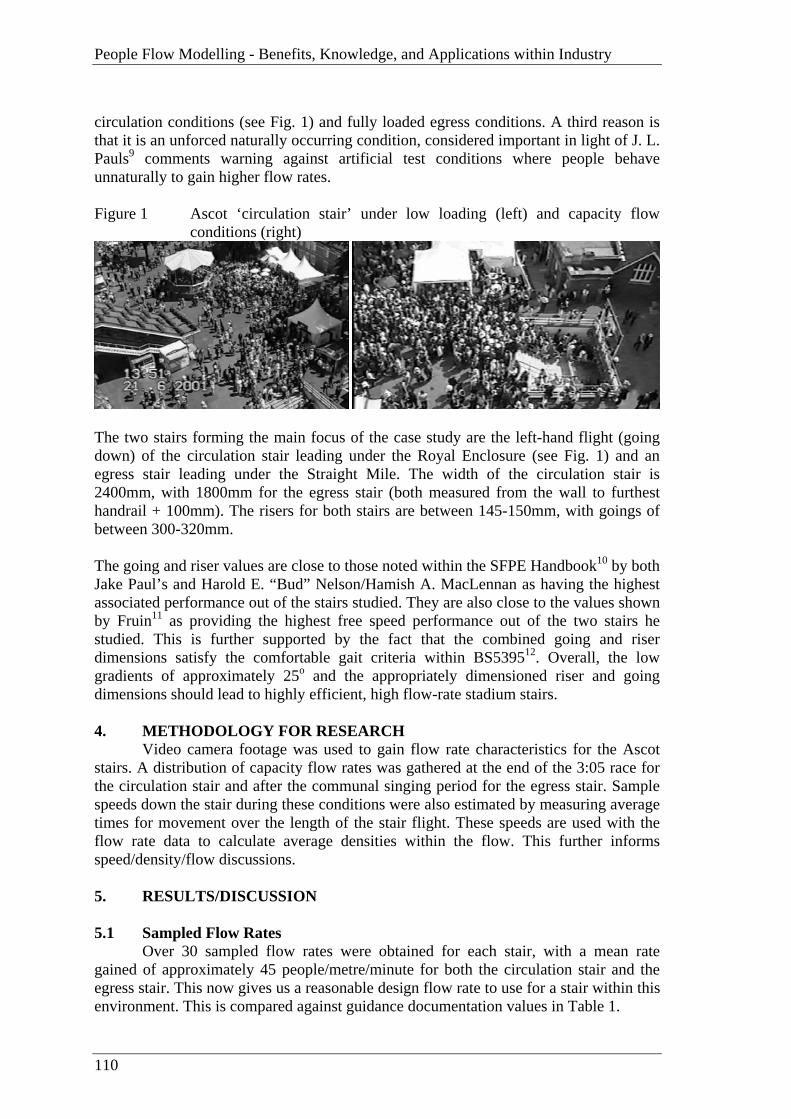
People Flow Modelling - Benefits, Knowledge, and Applications within Industry
110
circulation conditions (see Fig. 1) and fully loaded egress conditions. A third reason is that it is an unforced naturally occurring condition, considered important in light of J. L. Pauls9 comments warning against artificial test conditions where people behave unnaturally to gain higher flow rates. Figure 1 Ascot ‘circulation stair’ under low loading (left) and capacity flow
conditions (right)
The two stairs forming the main focus of the case study are the left-hand flight (going down) of the circulation stair leading under the Royal Enclosure (see Fig. 1) and an egress stair leading under the Straight Mile. The width of the circulation stair is 2400mm, with 1800mm for the egress stair (both measured from the wall to furthest handrail + 100mm). The risers for both stairs are between 145-150mm, with goings of between 300-320mm. The going and riser values are close to those noted within the SFPE Handbook10 by both Jake Paul’s and Harold E. “Bud” Nelson/Hamish A. MacLennan as having the highest associated performance out of the stairs studied. They are also close to the values shown by Fruin11 as providing the highest free speed performance out of the two stairs he studied. This is further supported by the fact that the combined going and riser dimensions satisfy the comfortable gait criteria within BS539512. Overall, the low gradients of approximately 25o and the appropriately dimensioned riser and going dimensions should lead to highly efficient, high flow-rate stadium stairs. 4. METHODOLOGY FOR RESEARCH
Video camera footage was used to gain flow rate characteristics for the Ascot stairs. A distribution of capacity flow rates was gathered at the end of the 3:05 race for the circulation stair and after the communal singing period for the egress stair. Sample speeds down the stair during these conditions were also estimated by measuring average times for movement over the length of the stair flight. These speeds are used with the flow rate data to calculate average densities within the flow. This further informs speed/density/flow discussions. 5. RESULTS/DISCUSSION 5.1 Sampled Flow Rates
Over 30 sampled flow rates were obtained for each stair, with a mean rate gained of approximately 45 people/metre/minute for both the circulation stair and the egress stair. This now gives us a reasonable design flow rate to use for a stair within this environment. This is compared against guidance documentation values in Table 1.
Paper 3
111
Table 1 Comparison between Ascot Racecourse flow rates and design guidance
Flow Rate Ascot Racecourse; Racecourse survey data
45 people/metre/minute % Increase Above Ascot
European Standard – Spectator Facilities Part 18; Guidance value from unknown origin
66 people/metre/minute 47%
SCICON6 (revised values); Football/rugby ground survey data
68 people/metre/minute 51%
Green Guide1; Generalised evacuation guidance data
73 people/metre/minute 62%
Table 1 shows that there is a significant difference between the Ascot Racecourse flow-rates during fully loaded conditions with significant queuing (both for circulation and egress) and sports stadia guidance documentation values. Taking average speeds down the stairs and calculating densities from a combination of the speeds and flow rates, it is clear that people are either not willing to or incapable of travelling at higher speeds at higher densities. The reasoning for this is postulated to be due to: 1 - Low level of experience in high density flows and a feeling of being
secure in such as high heeled shoes etc (during the Royal Meetings there are 40 - 50% female spectators).
2 - High proportion of females (during the Royal Meetings there are 40 – 50% of female spectators, who are shown by such as Fruin11 to have lower average free stair speeds than men and who arguably within Ascot tend to be wearing somewhat ‘difficult-to-walk-in’ high heeled shoes).
3 - High proportion of older aged occupants (during the Royal Meetings it is estimated that there are between 20 – 30% spectators who are 55+, age being shown by such as Fruin11 to have a significant impact on stair speeds).
4 - Inability/reluctance to move at high speed within high density due to social requirement not to offend others by bumping into them.
5 - High levels of alcohol consumption causing a feeling of insecurity at higher speeds. This is likely to be particularly influential towards the end of the racing day, but will also be important during the rest of the day due to over 50% of spectators arriving more than 2 hours before the first race in order to socialise.
A number of these points were supported by samples of free stair speeds for occupants leaving the stadium, which were consistent (and lower at times) with the speeds noted by Fruin11 for people over the age of 50.
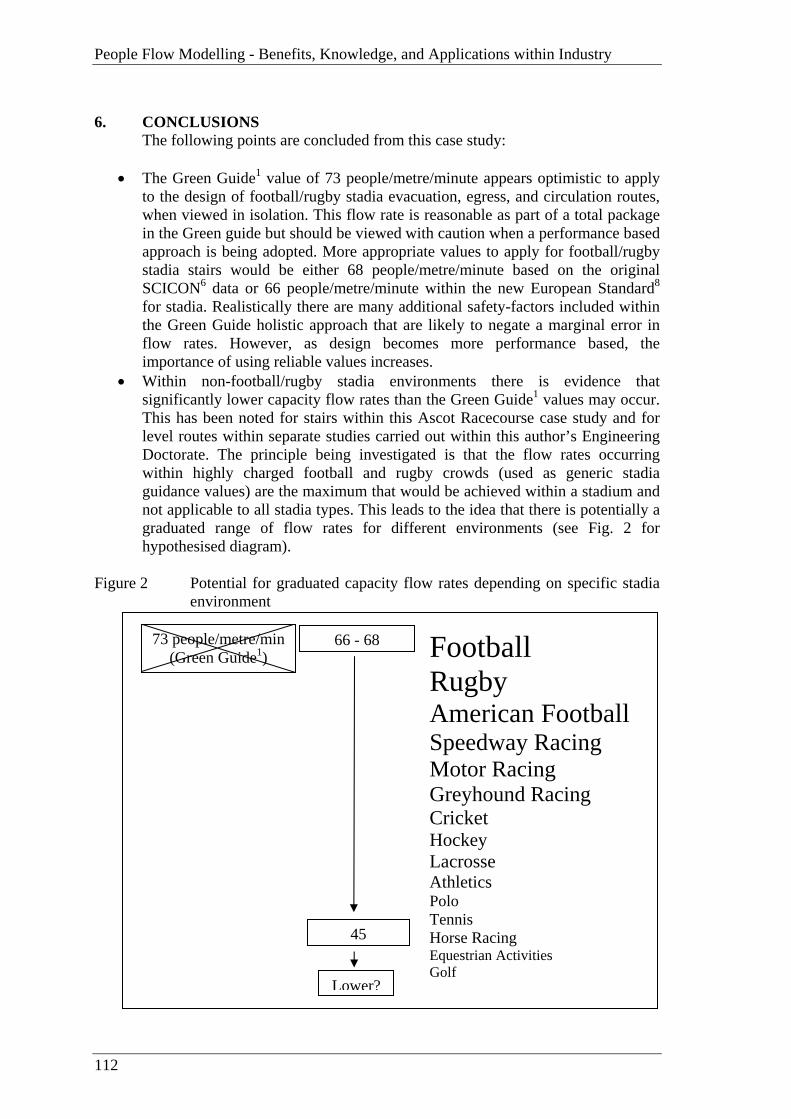
People Flow Modelling - Benefits, Knowledge, and Applications within Industry
112
6. CONCLUSIONS The following points are concluded from this case study:
• The Green Guide1 value of 73 people/metre/minute appears optimistic to apply
to the design of football/rugby stadia evacuation, egress, and circulation routes, when viewed in isolation. This flow rate is reasonable as part of a total package in the Green guide but should be viewed with caution when a performance based approach is being adopted. More appropriate values to apply for football/rugby stadia stairs would be either 68 people/metre/minute based on the original SCICON6 data or 66 people/metre/minute within the new European Standard8 for stadia. Realistically there are many additional safety-factors included within the Green Guide holistic approach that are likely to negate a marginal error in flow rates. However, as design becomes more performance based, the importance of using reliable values increases.
• Within non-football/rugby stadia environments there is evidence that significantly lower capacity flow rates than the Green Guide1 values may occur. This has been noted for stairs within this Ascot Racecourse case study and for level routes within separate studies carried out within this author’s Engineering Doctorate. The principle being investigated is that the flow rates occurring within highly charged football and rugby crowds (used as generic stadia guidance values) are the maximum that would be achieved within a stadium and not applicable to all stadia types. This leads to the idea that there is potentially a graduated range of flow rates for different environments (see Fig. 2 for hypothesised diagram).
Figure 2 Potential for graduated capacity flow rates depending on specific stadia
environment
Football Rugby
American Football Speedway Racing Motor Racing Greyhound Racing
Cricket Hockey Lacrosse
Athletics Polo Tennis
Horse Racing Equestrian Activities Golf
66 - 68
45
Lower?
73 people/metre/min (Green Guide1)
Paper 3
113
As proposed within the paper, the likely reasons for the reduced flow rates are:
- level of experience in high density flows - proportion of females - proportion of older aged occupants - social behaviour in relation to bumping into fellow spectators - alcohol consumption
Further studies are needed to gain detailed quantification of this phenomenon and more appropriate flow rates for stadia that are very different from football/rugby grounds. However, until appropriate research has been carried out, it is recommended that designers take into account the potential for significantly lower flow rates. One way of doing this would be to sample crowd movements at similar environments to the building they are designing before adopting any specific flow rate. It could be argued that an evacuation would cause more determination and higher flow rates than observed within this case study. However, this may not be the case when considering the potential reasoning for the reduction i.e. older age groups, female spectators wearing high-heeled shoes, alcohol consumption. REFERENCES: 1. The Scottish Office, Guide to Safety at Sports Grounds (Fourth Edition), The
Stationary Office, London, 1997, ISBN 0 11 300095 2. 2. Home Office/Scottish Home and Health Department, Guide to Safety at Sports
Grounds (First Edition), HMSO, 1973, ISBN 0 11 340558 8.
3. Home Office/Scottish Home and Health Department, Guide to Safety at Sports Grounds (Football) (Second Edition), HMSO, 1976, ISBN 0 11 340761 0.
4. Home Office/Scottish Home and Health Department, Guide to Safety at Sports
Grounds (Football) (Third Edition), HMSO, 1985, ISBN 0 11 3407610.
5. The Rt. Hon. Lord Wheatley, Report of the Inquiry into Crowd Safety at Sports Grounds, HMSO, London, 1972.
6. SCICON, Safety in football stadia: a method of assessment [study conducted by
SCICON for the Wheatley enquiry into crowd safety at sports grounds], London: SCICON, 1972.
7. Ministry of Works, Post War Building Studies No. 29, Fire Grading of
Buildings, Parts II, III, and IV (section 212-268). H.M.S.O., 1952. 8. British Standards Institute (BSI), BS EN 13200-1:2003 Spectator facilities;
layout criteria for spectator viewing area; specification, British Standards Institute, London, 2003, ISBN 058043236X.
9. J.L. Pauls (National Research Council Canada), "Building Evacuation: Research
Findings and Recommendations”, Fires and Human Behaviour, 1980

People Flow Modelling - Benefits, Knowledge, and Applications within Industry
114
10. Society of Fire Protection Engineers/National Fire Protection Association, The SFPE Handbook ‘Fire Protection Engineering’, Chapter 14 Emergency Movement, 1995, 2nd Edition.
11. J. J. Fruin, Pedestrian planning and design, Elevator World Inc. (Educational
Services Division), Alabama, 1987, LIB.CON 70-159312. 12. British Standards Institute (BSI), BS 5395-1:2000, Stairs, ladders and walkways
– Part 1: Code of practice for the design, construction and maintenance of straight stairs and winders, British Standards Institute, 389 Chiswick High Rd, London W4 4AL, 2000, ISBN 0 580 33175 X.
13. Office of the Deputy Prime Minister, Approved Document B (Fire Safety) to the
Building Regulations 2000, TSO (The Stationary Office), 2004.

Paper 4
115
APPENDIX D PAPER 4
David Brocklehurst, Prof Dino Bouchlaghem, Dr David Pitfield, Mick Green, Dr Keith Still, 2005 ‘Design and Space Planning for Secondary Schools; Considerations for Circulation Modelling’, accepted for publication within Institution of Civil Engineers (ICE) ‘Structure and Buildings’ Journal, Thomas Telford Ltd, Thomas Telford House, 1 Heron Quay, London, E14 4JD, UK.

People Flow Modelling - Benefits, Knowledge, and Applications within Industry
116
Design and Space Planning for Secondary Schools;
Considerations for Circulation Modelling
(Principal Author) David Brocklehurst MSc, BEng, Ceng, MIFE. Research Engineer within the Centre for Innovative Construction Engineering (CICE), Loughborough University, Loughborough, Leicestershire, LE11 3TU. e-mail: [email protected], Tel: 0113 2042215, Fax: 0870 7874144 Prof Dino Bouchlaghem Phd, DipArch. Deputy Centre Director for the Centre for Innovative Construction Engineering (CICE), Loughborough University, Loughborough, Leicestershire, LE11 3TU. e-mail: [email protected], Tel: 01509 223775, Fax: 01509 223982 Dr David Pitfield Phd, BSc, ACSS. Head of Transport Studies Group, Department of Civil and Building Engineering, Loughborough University, Loughborough, Leicestershire, LE11 3TU. e-mail: [email protected], Tel: 01509 223416, Fax: 01509 223982 Mick Green BEng, CEng. Group Director Multidiscipline. Buro Happold, 2 Brewery Place, Brewery Wharf, Leeds, LS10 1NE. e-mail: [email protected], Tel: 0113 2042200, Fax: 0113 2042201 Dr Keith Still Phd, BSc, NOEA, SFO. Crowd Dynamics Ltd, The Mill House, Mill Yard, Staveley, Kendal, Cumbria, LA8 9LS. e-mail: [email protected], Tel: 01539 822950, Fax: 01539 822951 Number of words – 5,436 Number of tables - 5 Number of Figures - 14
Paper 4
117
Abstract Even though there have been many reports of overcrowded and difficult-to-
manage circulation routes in secondary schools, there are still very few quantitative means used within the design industry for assessing circulation provisions. Arguably, school circulation design remains based on a combination of architect/stakeholder experience and minimum width/area recommendations contained within guidance documents. To make advances in this area, this paper proposes a valuable new modelling approach for school circulation using a combination of school survey data and computational modelling. The approach is successfully applied to predicting peak flow rates and congestion levels within an existing secondary school and is also shown to be a practical method for application on new-build projects. 1. Introduction
Due to the poor state of existing school premises within the UK, this building sector is now receiving major capital funding from the government. Within the Building Schools for the Future programme1, there is a plan for £2bn to be spent during 2005 and 2006 to ensure the rebuilding or renewal of every secondary school in England over the next ten to fifteen years. In relation to the design of these new schools, there are many elements for the designers and stake-holders to consider. These include architectural form, the curriculum and school specialisms, pupil management, evacuation and fire strategies, energy efficiency, structural design, services provisions, IT provisions, to name but a few. One of the areas of consideration relates to pupil movement around schools and the design and management required to avoid high levels of congestion and management/safety issues. However, this area is not always given sufficient consideration as shown by the following teacher’s comments: ‘As a teacher in an inner city comprehensive school in Sheffield I often had to perform tiring and stressful break duties. Management of the children was a particular problem at times of high congestion, especially the beginnings and ends of shorter breaks. It was necessary to police students to prevent some from being pushed over or hurt in the crush of children trying to move at the same time through thin corridors and up the narrow staircases, despite labelling stairs either ‘up’ or ‘down’.’ ‘Immanuel is a new school, construction having been completed approximately five years ago. Hence you would expect that corridor layout and sizing would have been thought through…However the minor corridors become seriously congested… This results in poor discipline as students are pushed into each other, which in turn leads to rowdiness leading to vandalism of fixtures (light switches, ceiling tiles etc)...’ The main guidance documents impacting on school design, together with what are arguably their most major recommendations are listed in Table 1. This is not meant to be exhaustive and there are clearly other documents with useful guidance such as

People Flow Modelling - Benefits, Knowledge, and Applications within Industry
118
BS5588: Part 82. However, the intention here is to highlight the fact that design guidance is given on a generic area basis together with providing non-specific minimum circulation widths. It is not possible for this guidance to provide specific input based on predicted pupil flow rates and therefore it can not capture specific areas where high levels of congestion can occur.
Table 1 Design guidance applicable to schools Guidance Document Main Design Recommendations; Relating to Circulation
Provisions Building Bulletin 98: Briefing Framework for Secondary School Projects3
- A net area provision is recommended (for teaching areas, halls, dining administration etc) based on a specific planned number of pupils. Significantly simplified here, the guide then recommends an additional 25%-30% to be provided for circulation space.
- Corridors leading to two or more teaching rooms are recommended to have minimum widths of 1.9m.
- Corridors leading to one room are recommended to have a minimum width of 1.2m.
Approved Document B; Fire safety4
- Minimum width of corridors in pupil areas to be 1.05m.
- Minimum width of dead-end corridors to be 1.6m.
- Minimum stair widths of 1.1m (depending on number of children)
Approved Document M; Access to and use of buildings5
- Minimum stair widths of 1.2m - Minimum corridor widths of 1.2m (plus
wheelchair passing places).
BS 8300: 2001; Design of buildings and their approaches to meet the needs of disabled people – Code of Practice6
- Minimum stair widths of 1.0m. - Minimum corridor widths of 1.2m (plus
wheelchairs passing places).
NB: All of the above documents provide guidance only, even though they can be used in developing a strategy to achieve compliance with such as the Building Regulations and the Disability Discriminations Act (DDA). Information has been gained for this table through discussions with the School Building and Design Unit, Seymour Harris Keppie Architects and consultants within Buro Happold Consulting Engineers. The fact that there can be problems with congestion in schools, coupled with an absence of specific design guidance, can lead to some confusion between stake-holders when determining appropriate dimensions in school design. Whilst advising on school circulation for two schools being re-built within Sheffield, it was noted by a headmaster that school circulation would be too congested if the design included corridors less than 3m wide. The architect for the project did not agree and originally provided widths significantly narrower, but neither body could quantifiably prove or support their viewpoint.
Paper 4
119
From the above, it is reasonable to conclude that there will be a number of areas in any school circulation design where there is either an under or over design. An over-design in circulation space may result in unnecessary additional costs and an inefficient use of space. An under-design could lead to high congestion levels, difficulties in pupil management and unsafe queues at the head of stairs. This paper presents a powerful generic modelling approach to respond to the need for circulation assessments on schools. The approach is developed to aid in the understanding of where school circulation space should be provided within design. The developed approach uses computational modelling and is tested in three ways. The first is to determine whether predicted peak flow rates are comparable with observed values. The second is to determine whether predicted stair queuing levels are comparable to observed values. The third is to show whether the approach is practical to use during the design process on a real school. 2. Methodology
The intention within this work is to test out a new generic modelling approach for quantitative assessments of school circulation. To test the approach we use the existing Deacons School within Peterborough. This school has approximately 1,000 pupils and is one of the three secondary schools to be combined into a large new academy within Peterborough. The existing building includes two storey teaching accommodation, organized around a library and courtyard. Following discussions with the assistant headmaster, it was agreed that the highest flow rates experienced within the school occur when all of the pupils move towards their tutor groups. The test case for the generic modelling approach is therefore chosen as the 11:20 tutor group change at Deacon’s Secondary School on 11th June 2004. Using rule-based people modelling software, comparisons are to be made between predicted peak flow rates and observed peak flow rates within the school corridors and on the circulation stairs. Even though tutor group changeover was chosen for these tests, other scenarios having similar high levels of movement would also have been valid to consider. These would include ‘movement to dining’ for schools that do not have a split lunch, ‘departure’ from schools where this is not staggered, and ‘class changeovers’ when there are no double periods. An evacuation scenario is also worthy of analysis, but would have different acceptance criteria than the assessment for normal circulation.
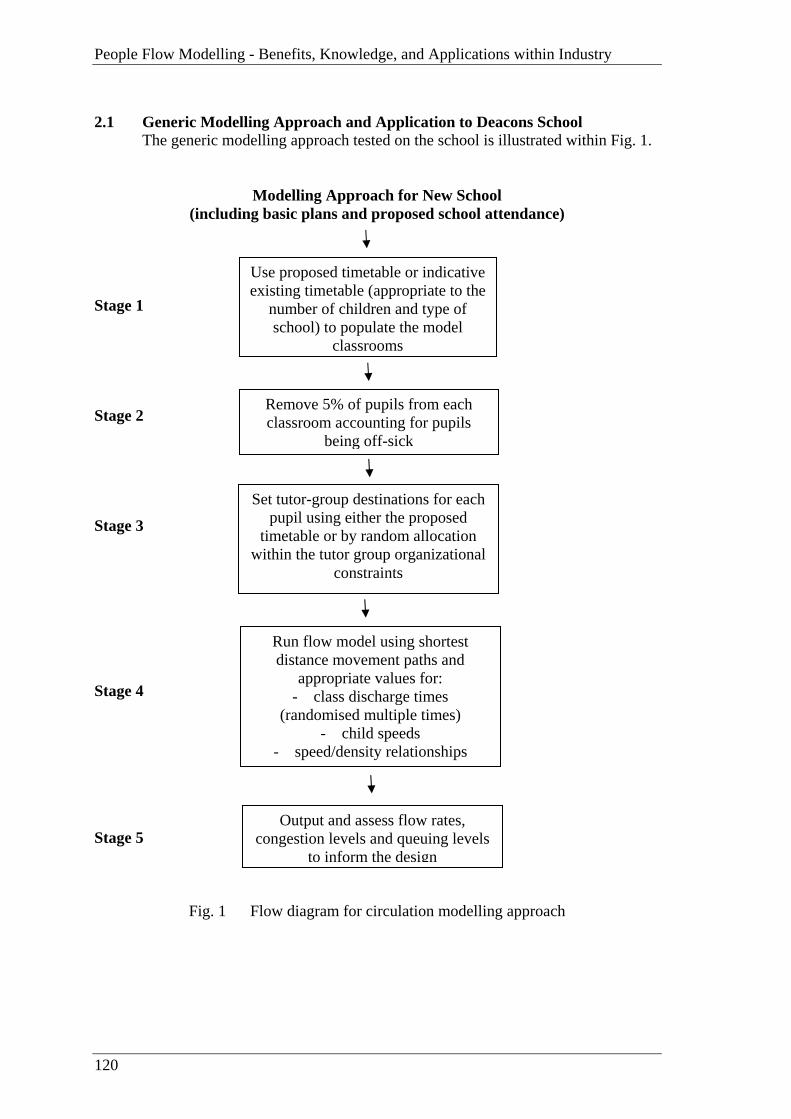
People Flow Modelling - Benefits, Knowledge, and Applications within Industry
120
2.1 Generic Modelling Approach and Application to Deacons School The generic modelling approach tested on the school is illustrated within Fig. 1.
Modelling Approach for New School (including basic plans and proposed school attendance)
Stage 1 Stage 2 Stage 3 Stage 4 Stage 5
Fig. 1 Flow diagram for circulation modelling approach
Use proposed timetable or indicative existing timetable (appropriate to the
number of children and type of school) to populate the model
classrooms
Remove 5% of pupils from each classroom accounting for pupils
being off-sick
Set tutor-group destinations for each pupil using either the proposed
timetable or by random allocation within the tutor group organizational
constraints
Run flow model using shortest distance movement paths and
appropriate values for: - class discharge times
(randomised multiple times) - child speeds
- speed/density relationships
Output and assess flow rates, congestion levels and queuing levels
to inform the design
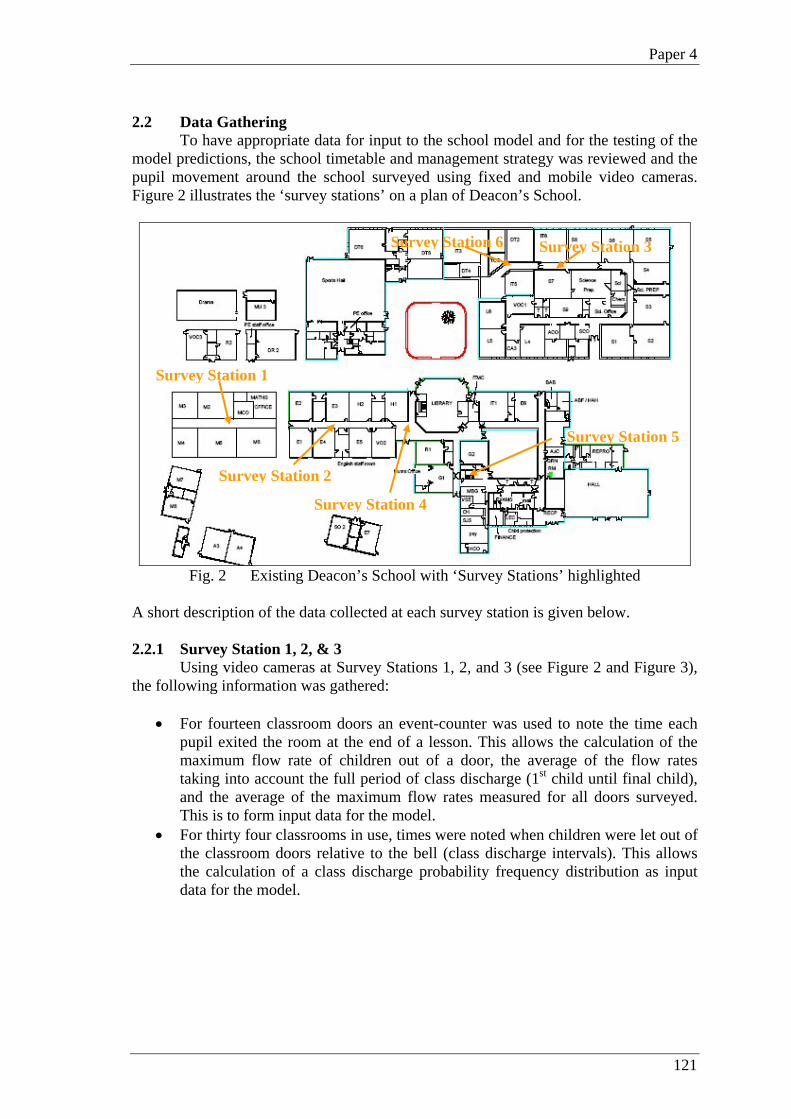
Paper 4
121
2.2 Data Gathering To have appropriate data for input to the school model and for the testing of the
model predictions, the school timetable and management strategy was reviewed and the pupil movement around the school surveyed using fixed and mobile video cameras. Figure 2 illustrates the ‘survey stations’ on a plan of Deacon’s School.
Fig. 2 Existing Deacon’s School with ‘Survey Stations’ highlighted
A short description of the data collected at each survey station is given below. 2.2.1 Survey Station 1, 2, & 3
Using video cameras at Survey Stations 1, 2, and 3 (see Figure 2 and Figure 3), the following information was gathered:
• For fourteen classroom doors an event-counter was used to note the time each
pupil exited the room at the end of a lesson. This allows the calculation of the maximum flow rate of children out of a door, the average of the flow rates taking into account the full period of class discharge (1st child until final child), and the average of the maximum flow rates measured for all doors surveyed. This is to form input data for the model.
• For thirty four classrooms in use, times were noted when children were let out of the classroom doors relative to the bell (class discharge intervals). This allows the calculation of a class discharge probability frequency distribution as input data for the model.
Survey Station 1
Survey Station 2
Survey Station 4
Survey Station 3
Survey Station 5
Survey Station 6
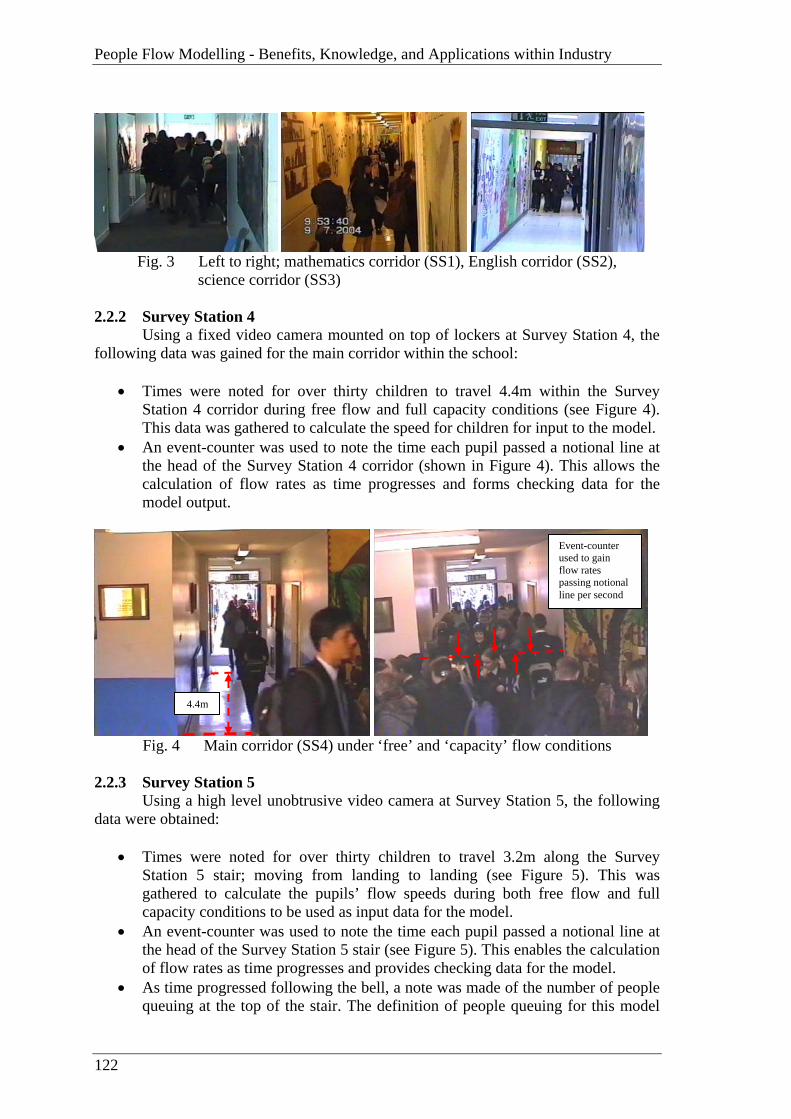
People Flow Modelling - Benefits, Knowledge, and Applications within Industry
122
Fig. 3 Left to right; mathematics corridor (SS1), English corridor (SS2),
science corridor (SS3) 2.2.2 Survey Station 4
Using a fixed video camera mounted on top of lockers at Survey Station 4, the following data was gained for the main corridor within the school:
• Times were noted for over thirty children to travel 4.4m within the Survey
Station 4 corridor during free flow and full capacity conditions (see Figure 4). This data was gathered to calculate the speed for children for input to the model.
• An event-counter was used to note the time each pupil passed a notional line at the head of the Survey Station 4 corridor (shown in Figure 4). This allows the calculation of flow rates as time progresses and forms checking data for the model output.
Fig. 4 Main corridor (SS4) under ‘free’ and ‘capacity’ flow conditions
2.2.3 Survey Station 5
Using a high level unobtrusive video camera at Survey Station 5, the following data were obtained:
• Times were noted for over thirty children to travel 3.2m along the Survey
Station 5 stair; moving from landing to landing (see Figure 5). This was gathered to calculate the pupils’ flow speeds during both free flow and full capacity conditions to be used as input data for the model.
• An event-counter was used to note the time each pupil passed a notional line at the head of the Survey Station 5 stair (see Figure 5). This enables the calculation of flow rates as time progresses and provides checking data for the model.
• As time progressed following the bell, a note was made of the number of people queuing at the top of the stair. The definition of people queuing for this model
4.4m
Event-counter used to gain flow rates passing notional line per second
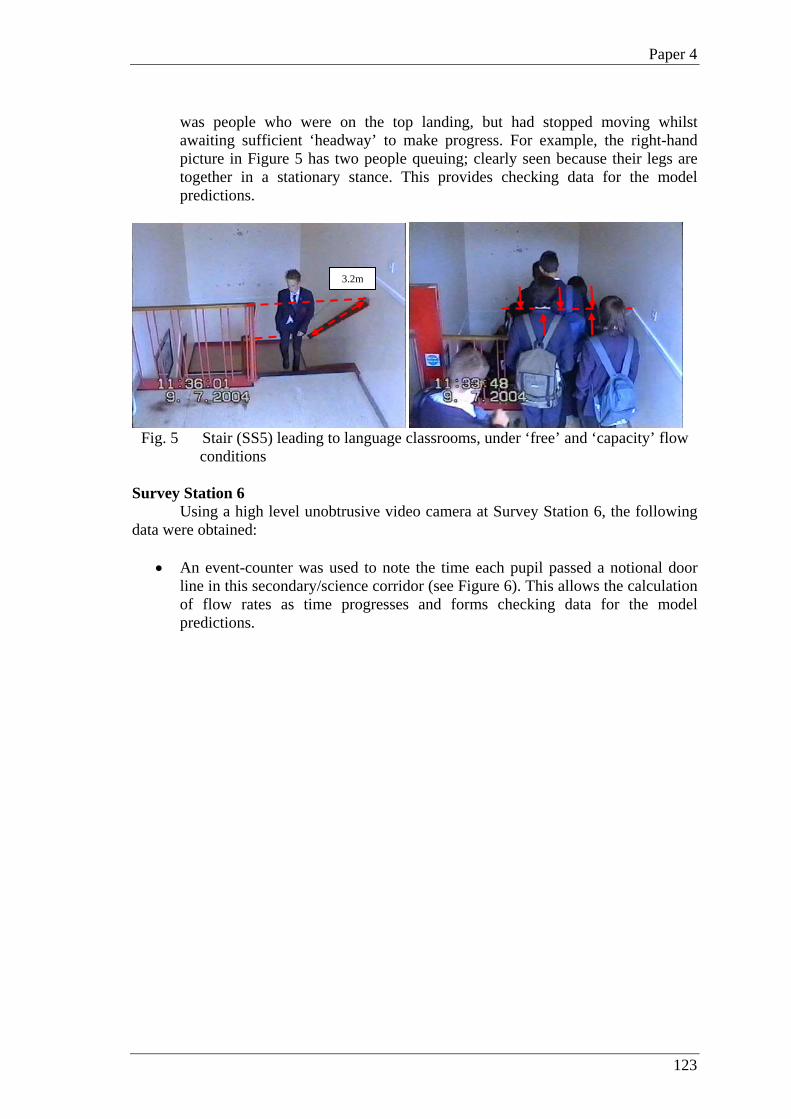
Paper 4
123
was people who were on the top landing, but had stopped moving whilst awaiting sufficient ‘headway’ to make progress. For example, the right-hand picture in Figure 5 has two people queuing; clearly seen because their legs are together in a stationary stance. This provides checking data for the model predictions.
Fig. 5 Stair (SS5) leading to language classrooms, under ‘free’ and ‘capacity’ flow
conditions Survey Station 6
Using a high level unobtrusive video camera at Survey Station 6, the following data were obtained:
• An event-counter was used to note the time each pupil passed a notional door
line in this secondary/science corridor (see Figure 6). This allows the calculation of flow rates as time progresses and forms checking data for the model predictions.
3.2m

People Flow Modelling - Benefits, Knowledge, and Applications within Industry
124
Fig. 6 Secondary corridor (SS6), during pupil movement to tutor groups
2.3 Modelling Software
The software used for modelling within this assessment is the buildingEXODUS7 agent-based software developed by the Fire Safety Engineering Group (FSEG) of University of Greenwich. This software is representative of a number of agent-based evacuation modelling products on the market (aiding in the reproduction of the approach by others). Even though built for evacuation assessments, the primary functionality of the software is to take multiple agents from multiple chosen origins to multiple chosen destinations via their shortest route. Therefore, with the flexibility to allow for variability of speeds, discharge times (etc), the technology is theoretically easily transferable to circulation assessments. Figure 7 illustrates how the software works. Globally, each object (or “agent”) has an origin (class-room) and a target destination (tutor room), both of these locations used in the pre-processing of an agent-specific potential map; the lowest potential being at the destination. Locally, this potential map is overlaid onto a grid of 0.5m x 0.5m nodes, where an agent is able to occupy one node at a time; i.e. space per pupil. This grid is not based upon sampling of pupil densities but ensures children will not pack to a greater extent than the upper level densities tabulated within Approved Document B4. Based on pre-specified speeds, each agent moves between nodes via arcs, always trying to lower the potential of the node they are standing on until finally reaching their target. Various additional rules are present within the software to account for such as conflict between agents wanting to occupy the same node. As an area becomes more congested, the
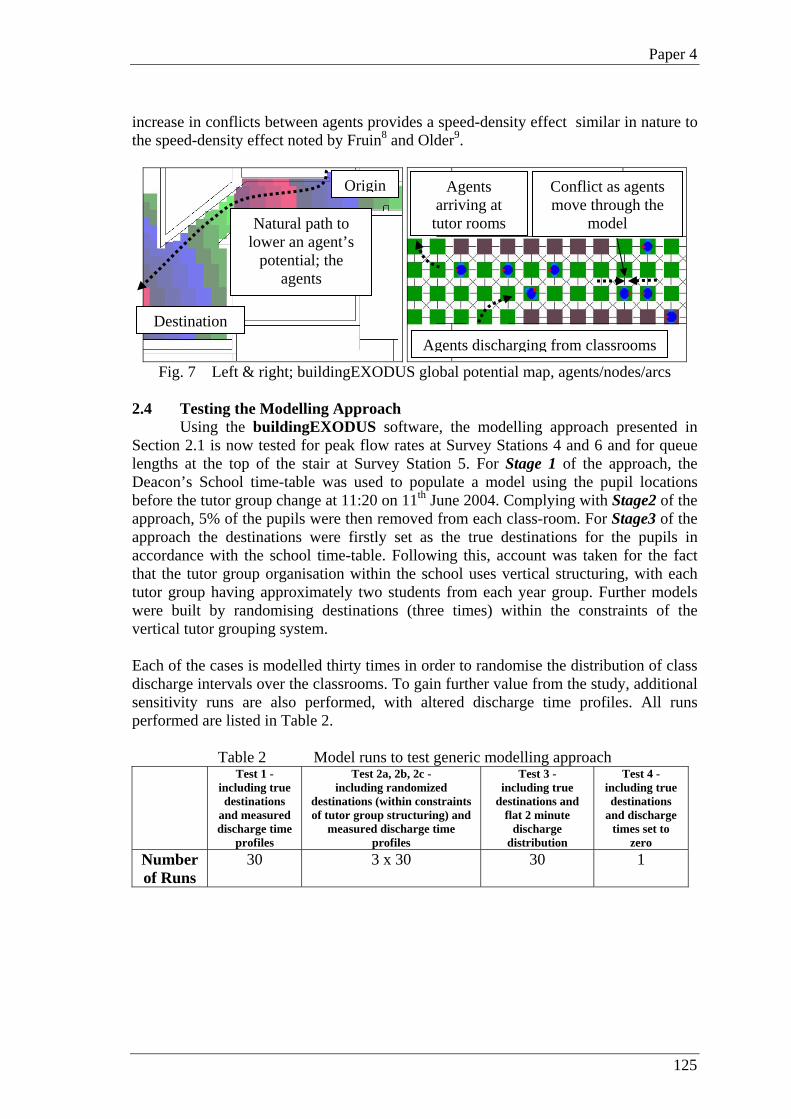
Paper 4
125
increase in conflicts between agents provides a speed-density effect similar in nature to the speed-density effect noted by Fruin8 and Older9.
Fig. 7 Left & right; buildingEXODUS global potential map, agents/nodes/arcs
2.4 Testing the Modelling Approach
Using the buildingEXODUS software, the modelling approach presented in Section 2.1 is now tested for peak flow rates at Survey Stations 4 and 6 and for queue lengths at the top of the stair at Survey Station 5. For Stage 1 of the approach, the Deacon’s School time-table was used to populate a model using the pupil locations before the tutor group change at 11:20 on 11th June 2004. Complying with Stage2 of the approach, 5% of the pupils were then removed from each class-room. For Stage3 of the approach the destinations were firstly set as the true destinations for the pupils in accordance with the school time-table. Following this, account was taken for the fact that the tutor group organisation within the school uses vertical structuring, with each tutor group having approximately two students from each year group. Further models were built by randomising destinations (three times) within the constraints of the vertical tutor grouping system. Each of the cases is modelled thirty times in order to randomise the distribution of class discharge intervals over the classrooms. To gain further value from the study, additional sensitivity runs are also performed, with altered discharge time profiles. All runs performed are listed in Table 2.
Table 2 Model runs to test generic modelling approach Test 1 -
including true destinations
and measured discharge time
profiles
Test 2a, 2b, 2c - including randomized
destinations (within constraints of tutor group structuring) and
measured discharge time profiles
Test 3 - including true
destinations and flat 2 minute
discharge distribution
Test 4 - including true destinations
and discharge times set to
zero Number of Runs
30 3 x 30 30 1
Conflict as agents move through the
model
Agents discharging from classrooms
Agents arriving at tutor roomsNatural path to
lower an agent’s potential; the
agents
Origin
Destination
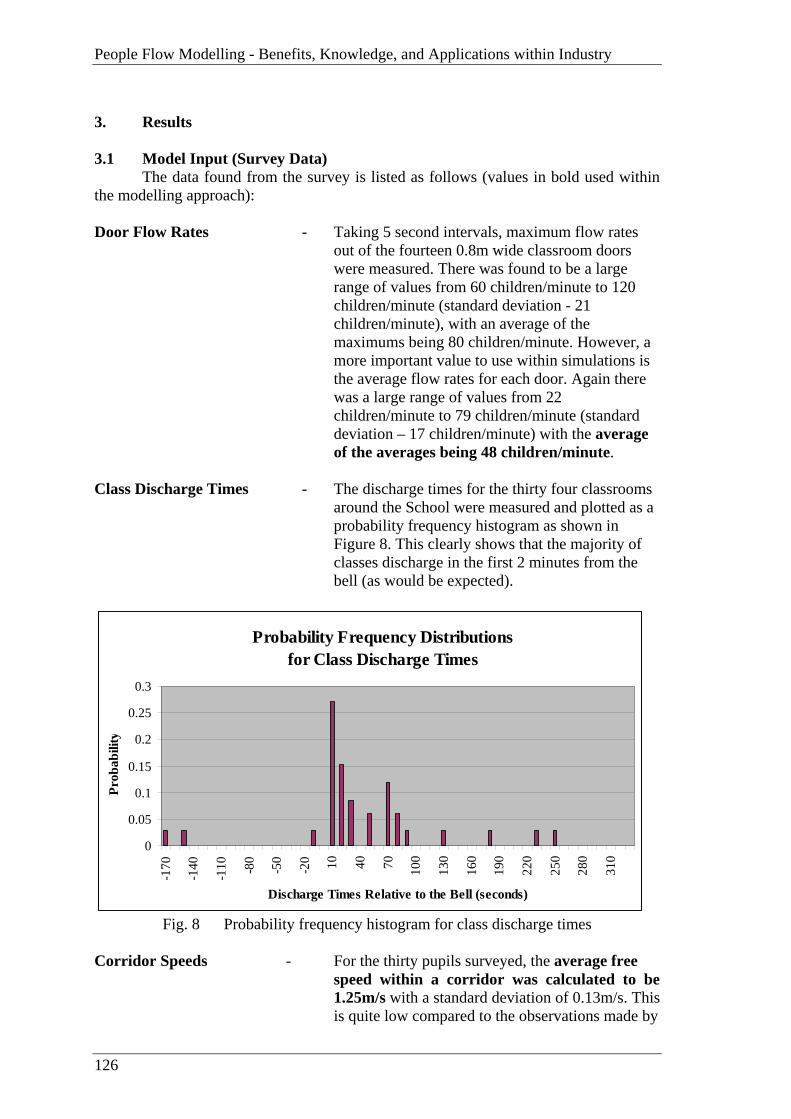
People Flow Modelling - Benefits, Knowledge, and Applications within Industry
126
3. Results 3.1 Model Input (Survey Data)
The data found from the survey is listed as follows (values in bold used within the modelling approach): Door Flow Rates - Taking 5 second intervals, maximum flow rates
out of the fourteen 0.8m wide classroom doors were measured. There was found to be a large range of values from 60 children/minute to 120 children/minute (standard deviation - 21 children/minute), with an average of the maximums being 80 children/minute. However, a more important value to use within simulations is the average flow rates for each door. Again there was a large range of values from 22 children/minute to 79 children/minute (standard deviation – 17 children/minute) with the average of the averages being 48 children/minute.
Class Discharge Times - The discharge times for the thirty four classrooms
around the School were measured and plotted as a probability frequency histogram as shown in Figure 8. This clearly shows that the majority of classes discharge in the first 2 minutes from the bell (as would be expected).
Probability Frequency Distributions for Class Discharge Times
0
0.05
0.1
0.15
0.2
0.25
0.3
-170
-140
-110 -8
0
-50
-20 10 40 70 100
130
160
190
220
250
280
310
Discharge Times Relative to the Bell (seconds)
Prob
abili
ty
Fig. 8 Probability frequency histogram for class discharge times
Corridor Speeds - For the thirty pupils surveyed, the average free
speed within a corridor was calculated to be 1.25m/s with a standard deviation of 0.13m/s. This is quite low compared to the observations made by
Paper 4
127
Ando10 and Hankin & Wright11 for children of a similar age. The reasoning for this will be partly due to location (Ando10 measured speeds in a transport terminal which will have differing behaviour than in a school environment) and research methodology (Hankin & Wright11 carried out simulations with the children being asked to perform a task and then monitored; potentially with a short-term increase in speed). Very few high congestion speeds were obtained due to the level routes not achieving capacity for long periods. Indications were that the speed reduced to values in the order of 0.38m/s for capacity flow in corridors. Once again this appears low compared with Hankin and Wright11.
Stair Speeds - For thirty pupils, the average free speed on a
stair was calculated to be 0.85m/s for the up direction (standard deviation – 0.23m/s) and 0.96m/s for the down direction (standard deviation – 0.24m/s). For the down-direction, eight speeds were recorded during uni-directional capacity conditions with an average capacity speed of 0.62m/s and a standard deviation of 0.06m/s. Very few high congestion speeds were obtained for the up direction due to the sample stair not achieving uni-directional capacity conditions for a long period. Indications are that the capacity speed reduced to values in the order of 0.57m/s.
Corridor Capacity - A capacity flow rate was observed a small number Flow Rates of times at Survey Station 4 where, on rare
occasions, the flow rate was observed to reach 168 children/minute (including a level of counter flow). The average corridor width at this location is 1.73m with two pinch-points within doors measured at 1.31m and 1.35m. However, because research shows that portals inherently have significantly higher capacity flow rates than corridors (see SCICON12), the corridor width is used to calculate the flow capacity per metre width as 97 children/metre/minute. This compares well with the flow rates for children observed within Hankin and Wright11.
Stair Capacity - Considering all of the observed flows during the Flow Rates surveys, the stair capacity was noted to be
Approximately 76 children/metre/minute.

People Flow Modelling - Benefits, Knowledge, and Applications within Industry
128
Almost all flows were predominantly in a downward direction with minimal counter flow.
3.2 Comparison of Model Output and Observed Values 3.2.1 Peak Flow Rates for Main and Secondary Corridor
For each of the modelled cases, time-based flow rate profiles were output for the chosen survey locations. Figure 9 shows a comparison between the observed flow profile within the main corridor and a sample of the Test 1 predicted profiles. The chosen Test 1 profile is the one with a peak flow rate equal to the average of the peak rates observed during the thirty randomizations. Also shown on the graph are the maximum and minimum of the peak rates achieved during the runs.
Main Corridor Flow Profile (Test 1)
0
20
40
60
80
100
120
140
160
180
200
11:1
9:06
11:1
9:24
11:1
9:41
11:1
9:58
11:2
0:15
11:2
0:33
11:2
0:50
11:2
1:07
11:2
1:24
11:2
1:42
11:2
1:59
11:2
2:16
11:2
2:34
Time
Flow
Rat
e (c
hild
ren/
min
ute)
Observed FlowsPredicted Flows
Fig. 9 Comparison of observed flow profile within main corridor and Test 1 flow
profile For comparison, Figure 10 illustrates the profile gained for a Test 2a run, once again selecting a profile where the peak flow rate is equal to the average of the peak rates observed during the thirty randomizations of class-room discharge times.
Bell sounded for tutor group change
Maximum and minimum of peak flow rates during 30
discharge time randomizations

Paper 4
129
Main Corridor Flow Profile (Test 2a)
0
20
40
60
80
100
120
140
160
180
20011
:19:
06
11:1
9:24
11:1
9:41
11:1
9:58
11:2
0:15
11:2
0:33
11:2
0:50
11:2
1:07
11:2
1:24
11:2
1:42
11:2
1:59
11:2
2:16
11:2
2:34
Time
Flow
Rat
e (c
hild
ren/
min
ute)
Observed FlowsPredicted Flows
Fig. 10 Comparison of observed flow profile within main corridor and Test 2 flow
profile As can be seen for these two cases, there is relatively good agreement between the predicted peak flow rates and the observed peak flow rates. Table 3 and Table 4 compare all cases for both the main and secondary corridors. Table 3 Comparison between observed and predicted flow rates for the main corridor
Mean of peak flow rates
(children/minute)
Standard deviation in peak
flow rates (children/minute)
Percentage difference between observed mean
peak flow rate and predicted mean peak
flow rate (children/minute)
Observed Flows
132 (single profile) -
Test 1 (true destinations)
137 19 + 4%
Test 2a (1st randomization
of destinations)
129 13 - 2%
Test 2b (2nd randomization
of destinations)
144 20 + 9%
Test 2c (3rd randomization
of destinations)
133 22 + 1%
Test 3 (true destinations and flat 2 minute
discharge distribution)
144 20 + 9%
Test 4 (true destinations
and discharge times all set to
zero)
192 (single profile) + 45%
Maximum and minimum of peak flow rates during 30
discharge time randomizations
Bell sounded for tutor group change
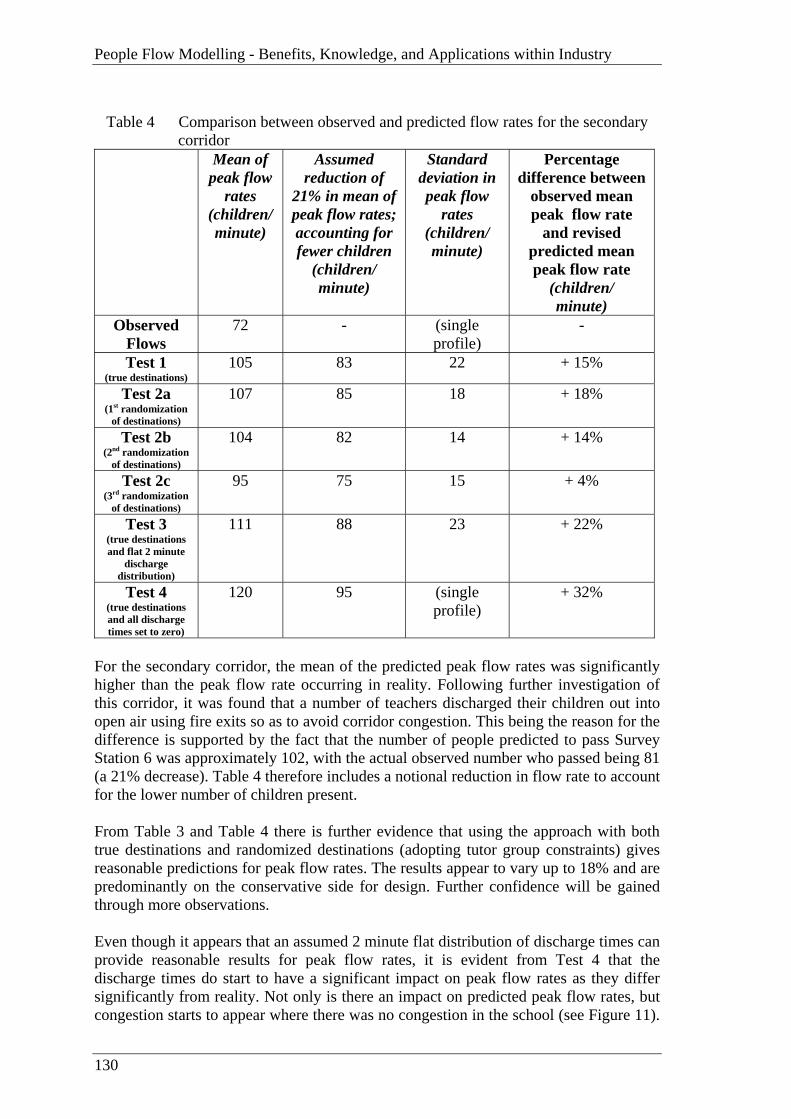
People Flow Modelling - Benefits, Knowledge, and Applications within Industry
130
Table 4 Comparison between observed and predicted flow rates for the secondary corridor Mean of
peak flow rates
(children/ minute)
Assumed reduction of
21% in mean of peak flow rates; accounting for fewer children
(children/ minute)
Standard deviation in peak flow
rates (children/ minute)
Percentage difference between
observed mean peak flow rate
and revised predicted mean peak flow rate
(children/ minute)
Observed Flows
72 - (single profile)
-
Test 1 (true destinations)
105 83 22 + 15%
Test 2a (1st randomization
of destinations)
107 85 18 + 18%
Test 2b (2nd randomization
of destinations)
104 82 14 + 14%
Test 2c (3rd randomization
of destinations)
95 75 15 + 4%
Test 3 (true destinations and flat 2 minute
discharge distribution)
111 88 23 + 22%
Test 4 (true destinations and all discharge times set to zero)
120 95 (single profile)
+ 32%
For the secondary corridor, the mean of the predicted peak flow rates was significantly higher than the peak flow rate occurring in reality. Following further investigation of this corridor, it was found that a number of teachers discharged their children out into open air using fire exits so as to avoid corridor congestion. This being the reason for the difference is supported by the fact that the number of people predicted to pass Survey Station 6 was approximately 102, with the actual observed number who passed being 81 (a 21% decrease). Table 4 therefore includes a notional reduction in flow rate to account for the lower number of children present. From Table 3 and Table 4 there is further evidence that using the approach with both true destinations and randomized destinations (adopting tutor group constraints) gives reasonable predictions for peak flow rates. The results appear to vary up to 18% and are predominantly on the conservative side for design. Further confidence will be gained through more observations. Even though it appears that an assumed 2 minute flat distribution of discharge times can provide reasonable results for peak flow rates, it is evident from Test 4 that the discharge times do start to have a significant impact on peak flow rates as they differ significantly from reality. Not only is there an impact on predicted peak flow rates, but congestion starts to appear where there was no congestion in the school (see Figure 11).

Paper 4
131
Replicated within a real design scenario, this could lead to an over-design of areas where congestion is predicted and under-design of areas where higher flow rates would have existed if it were not for the up-stream congestion (as seen at the census line in Figure 11; from Test 4).
Fig. 11 Probability frequency histogram for class discharge times
3.2.2 Queuing Levels at the Languages Stair
For Survey Station 5, the capacity of the stair was reached during all of the observations and within almost every modelled case. Therefore, the comparison made here is in relation to the levels of queuing at the head of the stair and not the flow rate profiles. Within the modelling predictions it was noted that queuing occurred either when three groups arrived at the stair at the same time or two groups arrived after a period of approximately 4minutes (when significant counter flow was experienced due to people arriving from lower levels). This is because the average door flow rate is 48children/minute and the modelled stair capacity was between 96children/minute and 132children/minute; varying within the software depending upon the level of counter-flow. The queuing level observed at the head of the stair during the survey was never greater than six people. It is estimated that this number would have been higher but for people choosing to slow down as they approached the queue. For comparison against the observed queue, Table 5 shows the percentage of times queuing occurred for each of the test cases.
Predicted congestion
Downstream census line
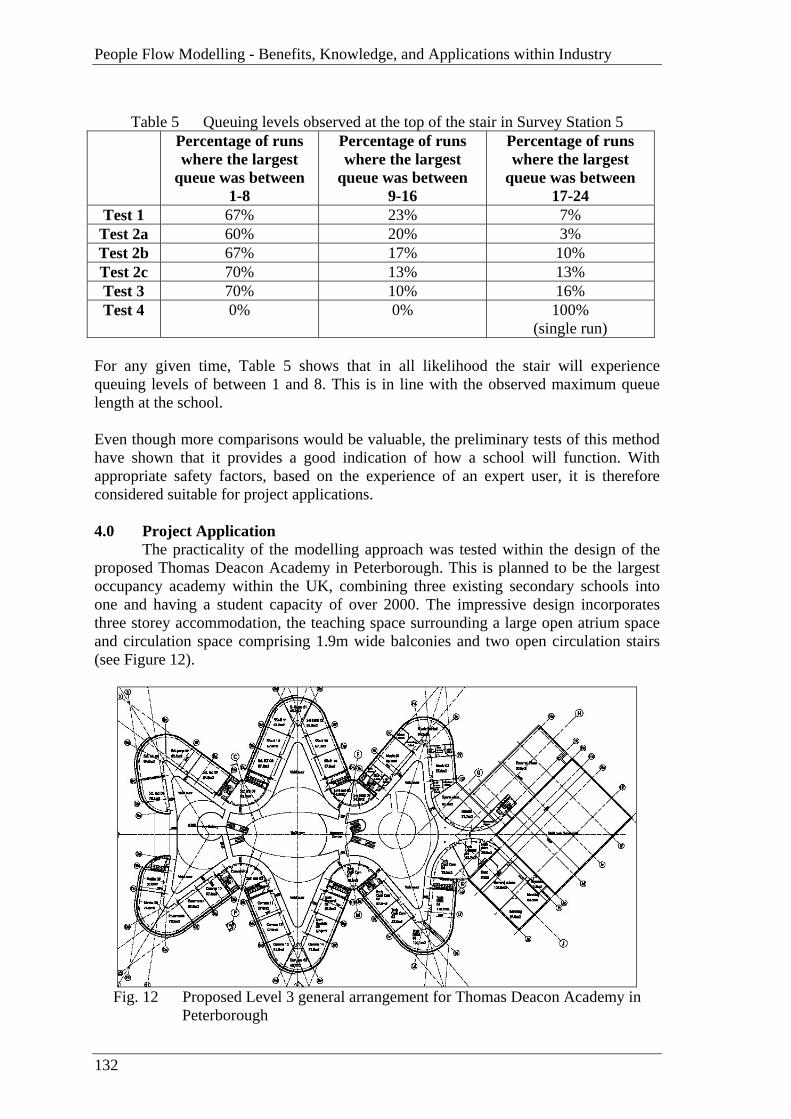
People Flow Modelling - Benefits, Knowledge, and Applications within Industry
132
Table 5 Queuing levels observed at the top of the stair in Survey Station 5 Percentage of runs
where the largest queue was between
1-8
Percentage of runs where the largest
queue was between 9-16
Percentage of runs where the largest
queue was between 17-24
Test 1 67% 23% 7% Test 2a 60% 20% 3% Test 2b 67% 17% 10% Test 2c 70% 13% 13% Test 3 70% 10% 16% Test 4 0%
0%
100%
(single run) For any given time, Table 5 shows that in all likelihood the stair will experience queuing levels of between 1 and 8. This is in line with the observed maximum queue length at the school. Even though more comparisons would be valuable, the preliminary tests of this method have shown that it provides a good indication of how a school will function. With appropriate safety factors, based on the experience of an expert user, it is therefore considered suitable for project applications. 4.0 Project Application
The practicality of the modelling approach was tested within the design of the proposed Thomas Deacon Academy in Peterborough. This is planned to be the largest occupancy academy within the UK, combining three existing secondary schools into one and having a student capacity of over 2000. The impressive design incorporates three storey accommodation, the teaching space surrounding a large open atrium space and circulation space comprising 1.9m wide balconies and two open circulation stairs (see Figure 12).
Fig. 12 Proposed Level 3 general arrangement for Thomas Deacon Academy in
Peterborough
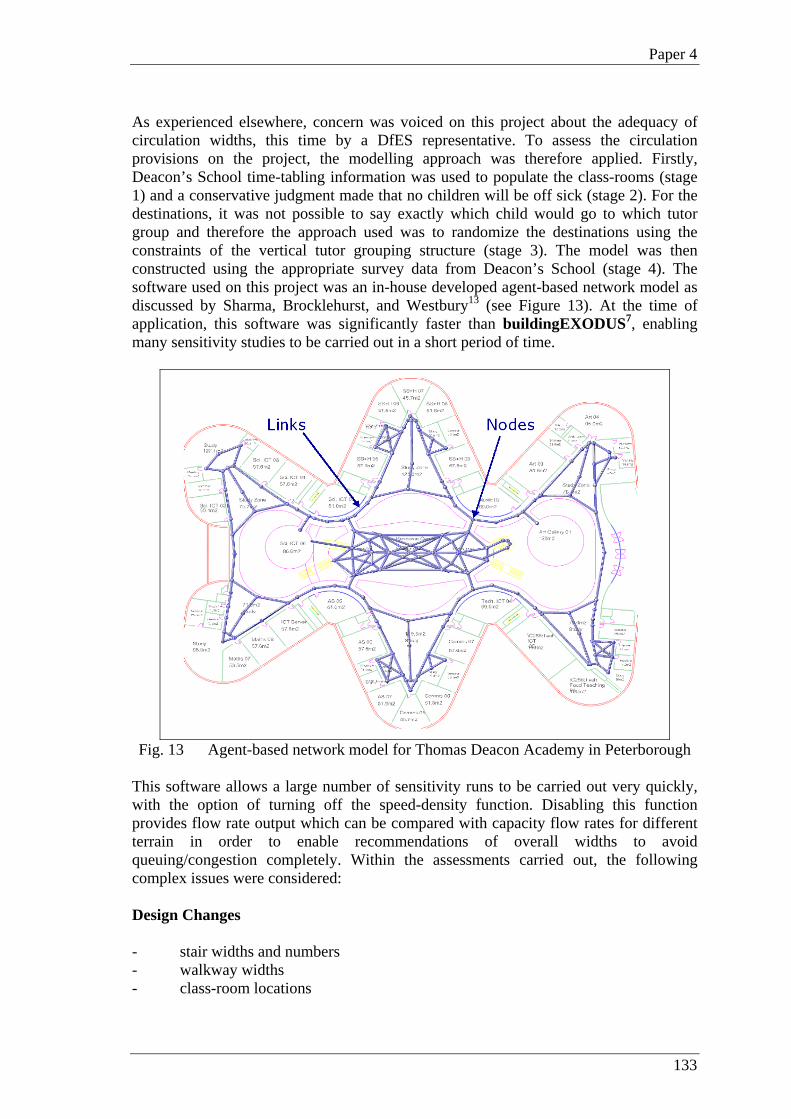
Paper 4
133
As experienced elsewhere, concern was voiced on this project about the adequacy of circulation widths, this time by a DfES representative. To assess the circulation provisions on the project, the modelling approach was therefore applied. Firstly, Deacon’s School time-tabling information was used to populate the class-rooms (stage 1) and a conservative judgment made that no children will be off sick (stage 2). For the destinations, it was not possible to say exactly which child would go to which tutor group and therefore the approach used was to randomize the destinations using the constraints of the vertical tutor grouping structure (stage 3). The model was then constructed using the appropriate survey data from Deacon’s School (stage 4). The software used on this project was an in-house developed agent-based network model as discussed by Sharma, Brocklehurst, and Westbury13 (see Figure 13). At the time of application, this software was significantly faster than buildingEXODUS7, enabling many sensitivity studies to be carried out in a short period of time.
Fig. 13 Agent-based network model for Thomas Deacon Academy in Peterborough
This software allows a large number of sensitivity runs to be carried out very quickly, with the option of turning off the speed-density function. Disabling this function provides flow rate output which can be compared with capacity flow rates for different terrain in order to enable recommendations of overall widths to avoid queuing/congestion completely. Within the assessments carried out, the following complex issues were considered: Design Changes - stair widths and numbers - walkway widths - class-room locations
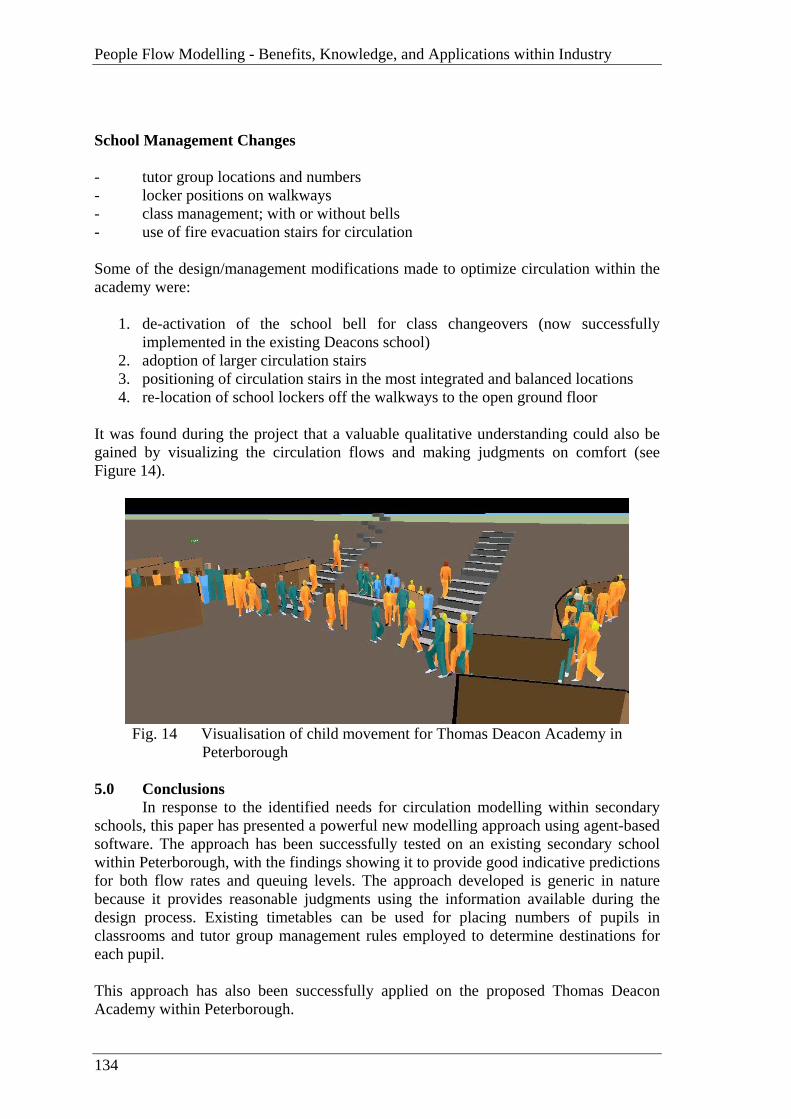
People Flow Modelling - Benefits, Knowledge, and Applications within Industry
134
School Management Changes - tutor group locations and numbers - locker positions on walkways - class management; with or without bells - use of fire evacuation stairs for circulation Some of the design/management modifications made to optimize circulation within the academy were:
1. de-activation of the school bell for class changeovers (now successfully implemented in the existing Deacons school)
2. adoption of larger circulation stairs 3. positioning of circulation stairs in the most integrated and balanced locations 4. re-location of school lockers off the walkways to the open ground floor
It was found during the project that a valuable qualitative understanding could also be gained by visualizing the circulation flows and making judgments on comfort (see Figure 14).
Fig. 14 Visualisation of child movement for Thomas Deacon Academy in
Peterborough 5.0 Conclusions
In response to the identified needs for circulation modelling within secondary schools, this paper has presented a powerful new modelling approach using agent-based software. The approach has been successfully tested on an existing secondary school within Peterborough, with the findings showing it to provide good indicative predictions for both flow rates and queuing levels. The approach developed is generic in nature because it provides reasonable judgments using the information available during the design process. Existing timetables can be used for placing numbers of pupils in classrooms and tutor group management rules employed to determine destinations for each pupil. This approach has also been successfully applied on the proposed Thomas Deacon Academy within Peterborough.

Paper 4
135
To build on this work, further valuable research can be carried out on:
• testing against further observed samples • developing the approach for applications to other scenarios (even though tutor-
group changeover was highlighted as critical for this school) • evacuation modeling specific to the school sector
Also, even though it is likely that all agent-based software will provide similar results (with the same input), it may be worth comparing various different software with the same methodology. This will give an added level of information on the sensitivity of the approach. Approaches like this will support the strong interest within the educational community in providing the appropriate and specific levels of circulation space, integrated with the management strategy for the building. References: 1. Schools Capital Enquiry Team, Department for Education and Skills, Sanctuary
Buildings Great Smith Street London SW1P 3BT. 2. British Standards Institute (BSI), BS 5588-8 Fire Precautions in the design,
construction and use of buildings - Part 8: Code of practice for means of escape for disabled people; 2nd Edition, British Standards Institute, London, 1999, ISBN 0 580 28262 7.
3. Department for Education and Skills, Building Bulletin 98: Briefing Framework
for Secondary School Projects, Castle View House, Runcorn, Castle View House, East Lane, Runcorn WA7 2GJ, http://www.teachernet.gov.uk.
4. Office of the Deputy Prime Minister, Approved Document B to the Building
Regulations 2000 edition consolidated with 200 & 2002 amendments, TSO (The Stationary Office), PO Box 29, Norwich, NR3 1GN, 2004.
5. Office of the Deputy Prime Minister, Approved Document M the Building
Regulations 2004 Edition, TSO (The Stationary Office), PO Box 29, Norwich, NR3 1GN, 2004.
6. British Standards Institute (BSI), BS 8300 Design of buildings and their
approaches to meet the needs of disabled people – Code of Practice, British Standards Institute, London, 2001.
7. Galea, E.R., Gwynne, S .,Lawrence, P.J., Filippids, L., Blachshields, D., and
Cooney, D., “buildingEXODUS User manual”, version 4.00, CMS Press, 2004. 8. Fruin, J. J. Pedestrian planning and design, Elevator World Inc. (Educational
Services Division), Alabama, 1987, LIB.CON 70-159312. 9. Older S.J., Movement of Pedestrians on Footways in Shopping Streets, Traffic
Engineering and Control, 1968, August, pp. 160-163.

People Flow Modelling - Benefits, Knowledge, and Applications within Industry
136
10. Ando K. Ota H. Oki T., Forecasting the Flow Of People, Railway Research Review, 1988, Vol. 45, August, pp. 8-14.
11. Hankin B. D. Wright R. A., 1958, Passenger Flow in Subways, Operational
Research Quarterly Vol. 9 pp81-88. 12. SCICON, Safety in football stadia: a method of assessment [study condcucted
by SCICON for the Wheatley enquiry into crowd safety at sports grounds], London: SCICON, 1972.
13. Shrikant B Sharma, D Brocklehurst, PS Westbury, 'A Dynamic Network Model
for Circulation and Evacuation' (poster), Human Behaviour in Fire - 3rd International Symposium, Interscience Communications, 2004.

Buro Happold Buro Happold Ltd 2 Brewery Place Brewery Wharf Leeds LS10 1NE
Centre for Innovative and Collaborative Engineering (CICE) Department of Civil & Building Engineering Loughborough University Loughborough Leics, LE11 3TU

Brocklehurst D
. People Flow
Modelling – B
enefits and A
pplications within Industry
2005 C
ICE
