performance 1 module contents overview data-rate throughput response times capacity power...
Post on 18-Dec-2015
227 views
TRANSCRIPT
Performance 1
Module contents
Overview
Data-rate
Throughput
Response times
Capacity
Power consumption
Performance 2
Overview
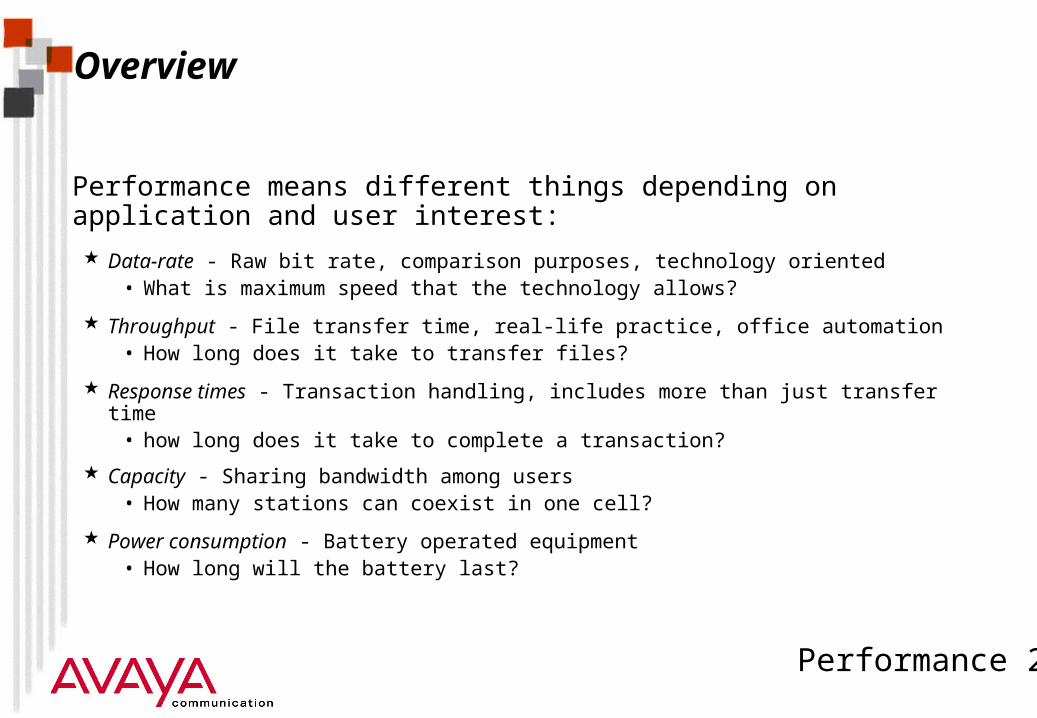
Performance means different things depending on application and user interest:
Data-rate - Raw bit rate, comparison purposes, technology oriented • What is maximum speed that the technology allows?
Throughput - File transfer time, real-life practice, office automation• How long does it take to transfer files?
Response times - Transaction handling, includes more than just transfer time• how long does it take to complete a transaction?
Capacity - Sharing bandwidth among users• How many stations can coexist in one cell?
Power consumption - Battery operated equipment • How long will the battery last?
Performance 3
Overview
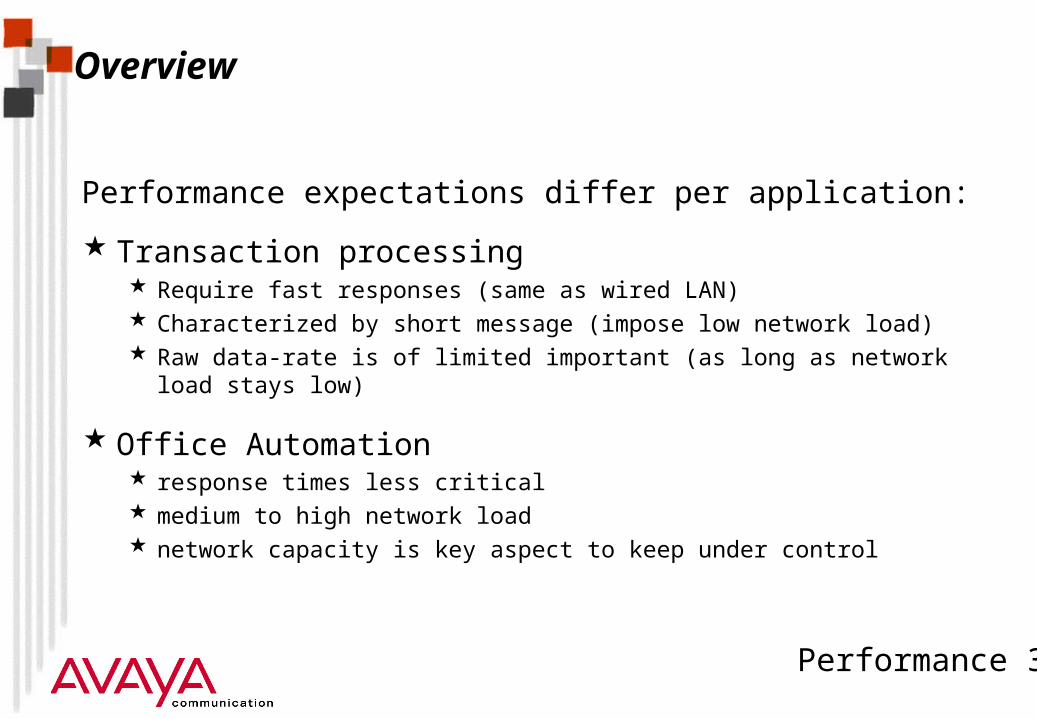
Performance expectations differ per application:
Transaction processing Require fast responses (same as wired LAN) Characterized by short message (impose low network load) Raw data-rate is of limited important (as long as network load stays low)
Office Automation response times less critical medium to high network load network capacity is key aspect to keep under control
Performance 4
Overview
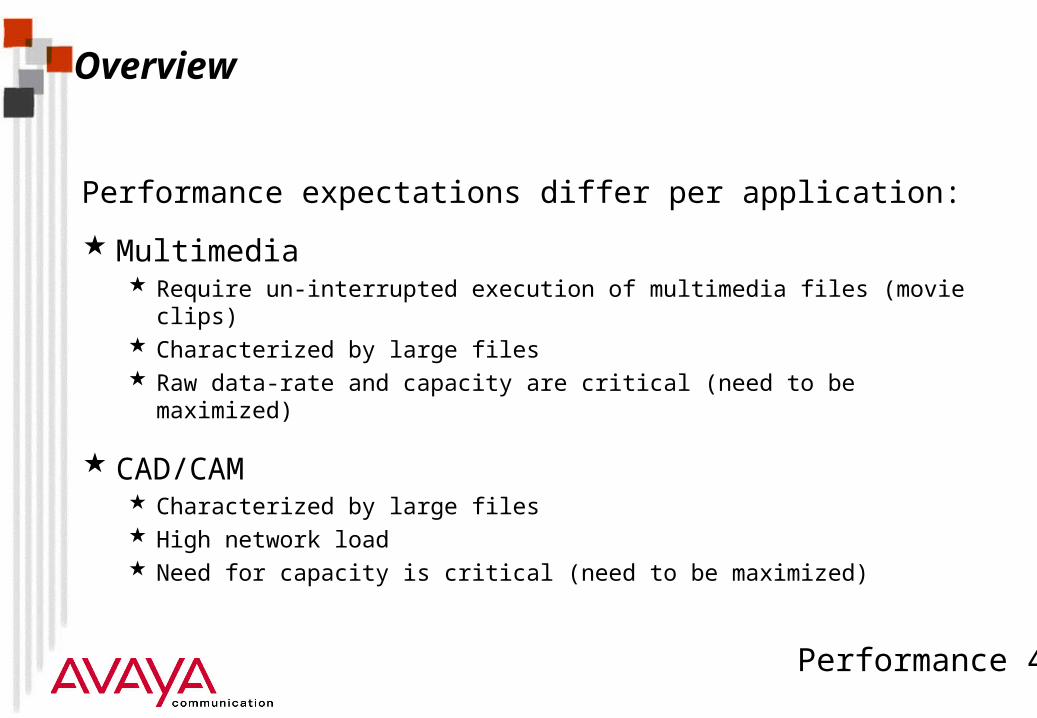
Performance expectations differ per application:
Multimedia Require un-interrupted execution of multimedia files (movie clips) Characterized by large files Raw data-rate and capacity are critical (need to be maximized)
CAD/CAM Characterized by large files High network load Need for capacity is critical (need to be maximized)
Performance 5
Module contents
Overview
Data-rate
Throughput
Response times
Capacity
Power consumption
Performance 6
Data-rate
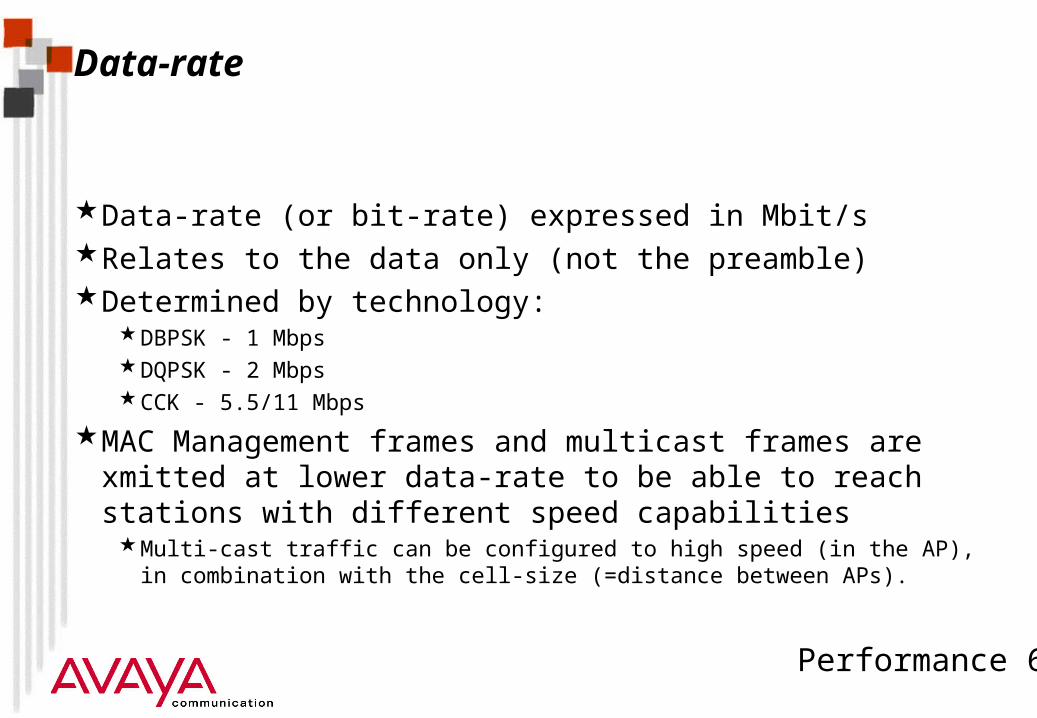
Data-rate (or bit-rate) expressed in Mbit/sRelates to the data only (not the preamble) Determined by technology:
DBPSK - 1 MbpsDQPSK - 2 MbpsCCK - 5.5/11 Mbps
MAC Management frames and multicast frames are xmitted at lower data-rate to be able to reach stations with different speed capabilities
Multi-cast traffic can be configured to high speed (in the AP), in combination with the cell-size (=distance between APs).
Performance 7
Data RateAuto fallback
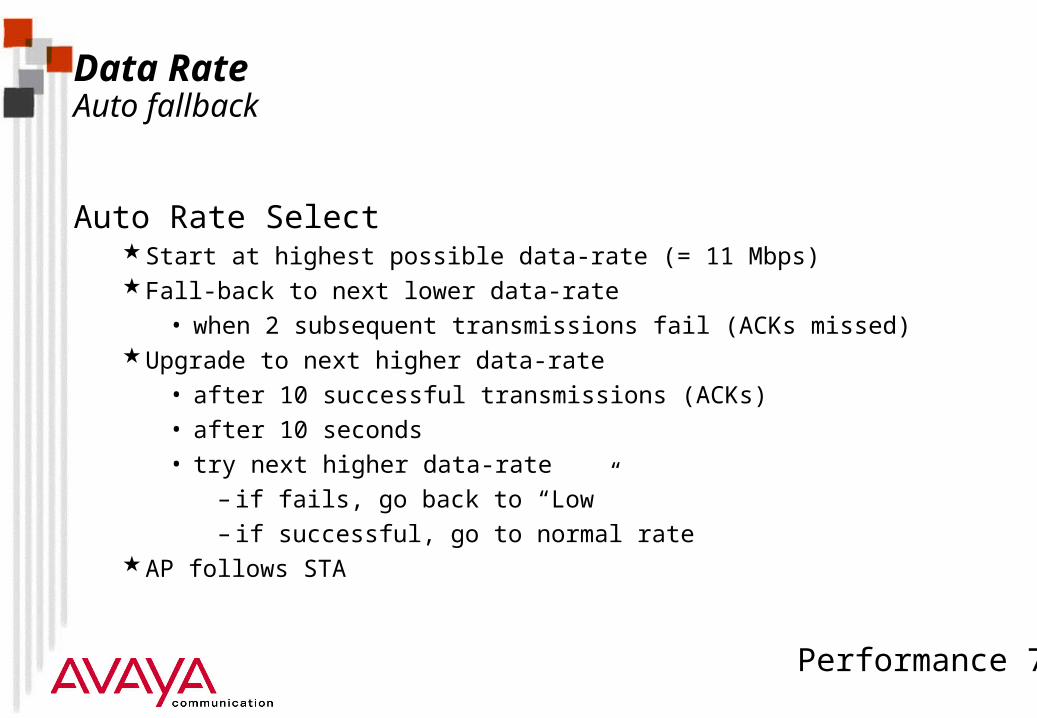
Auto Rate Select Start at highest possible data-rate (= 11 Mbps)Fall-back to next lower data-rate
• when 2 subsequent transmissions fail (ACKs missed)Upgrade to next higher data-rate
• after 10 successful transmissions (ACKs)
• after 10 seconds
• try next higher data-rate
– if fails, go back to “Low”
– if successful, go to normal rateAP follows STA
Performance 8
Module contents
Overview
Data-rate
Throughput
Response times
Capacity
Power consumption
Performance 9
Throughput
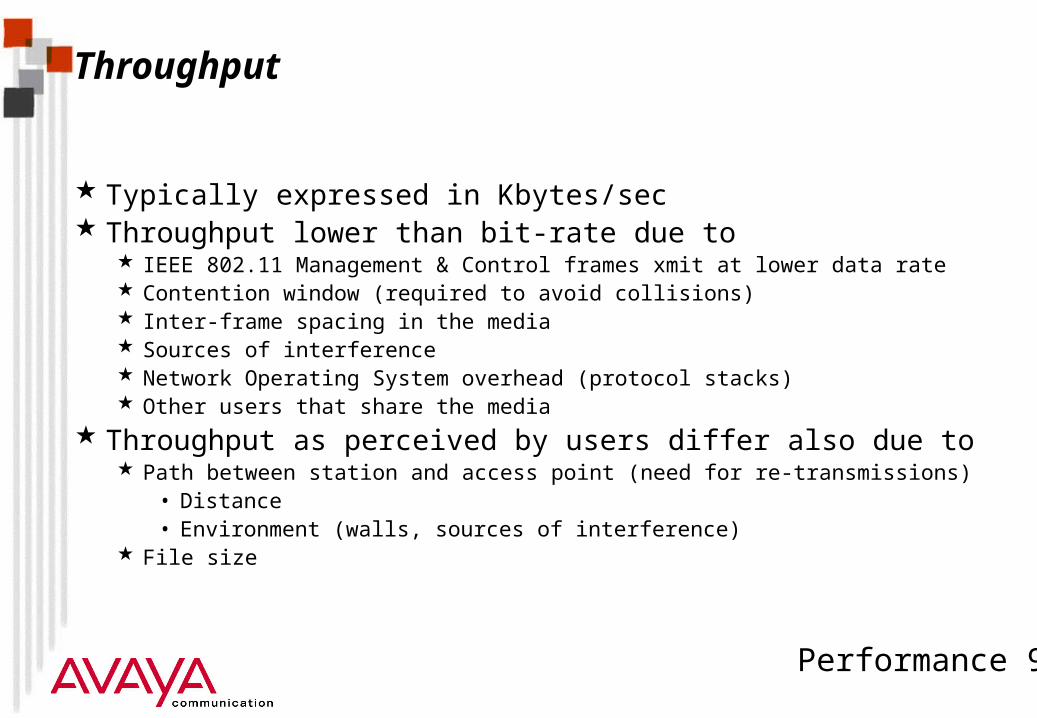
Typically expressed in Kbytes/sec Throughput lower than bit-rate due to
IEEE 802.11 Management & Control frames xmit at lower data rate Contention window (required to avoid collisions) Inter-frame spacing in the media Sources of interference Network Operating System overhead (protocol stacks) Other users that share the media
Throughput as perceived by users differ also due to Path between station and access point (need for re-transmissions)
• Distance• Environment (walls, sources of interference)
File size
Performance 10
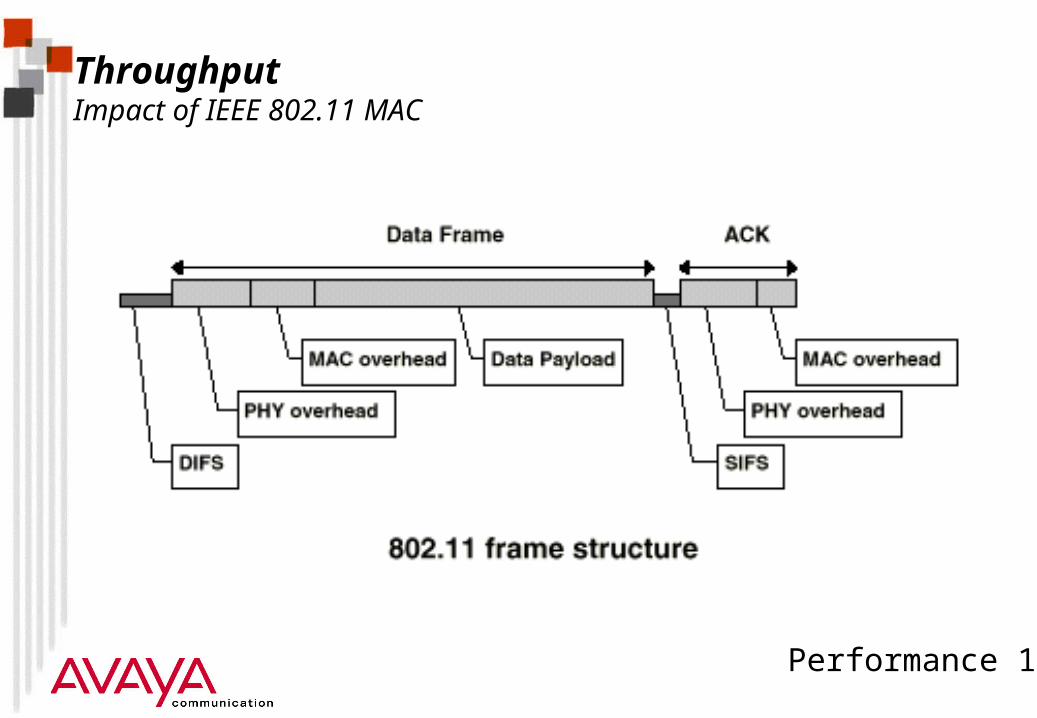
ThroughputImpact of IEEE 802.11 MAC
Performance 11
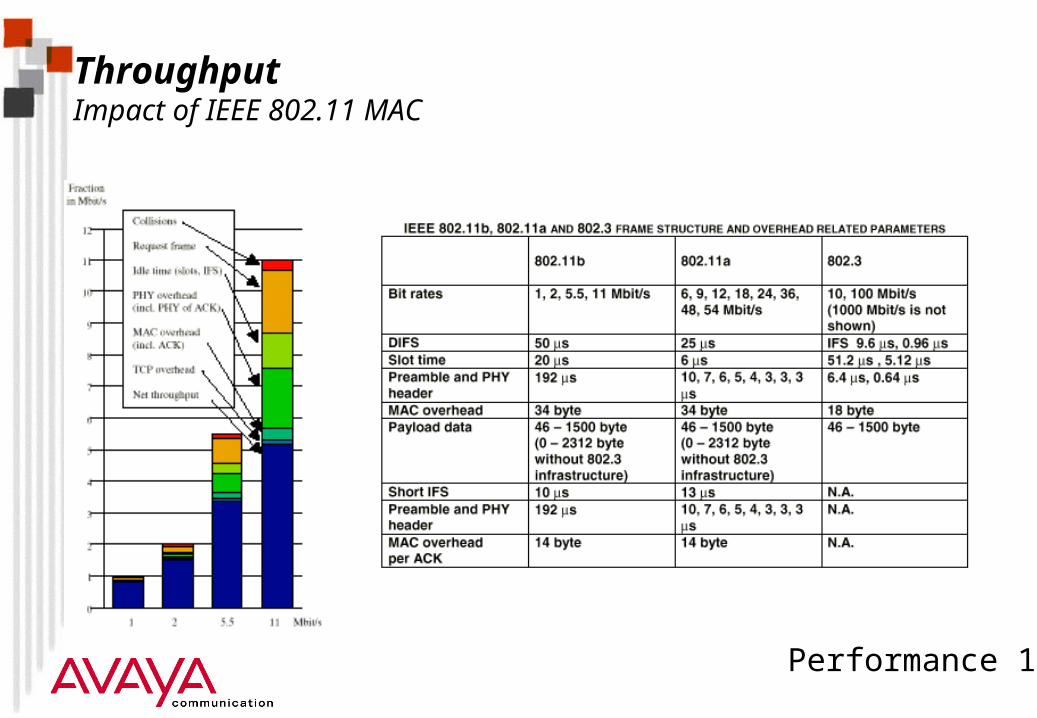
ThroughputImpact of IEEE 802.11 MAC
Performance 12
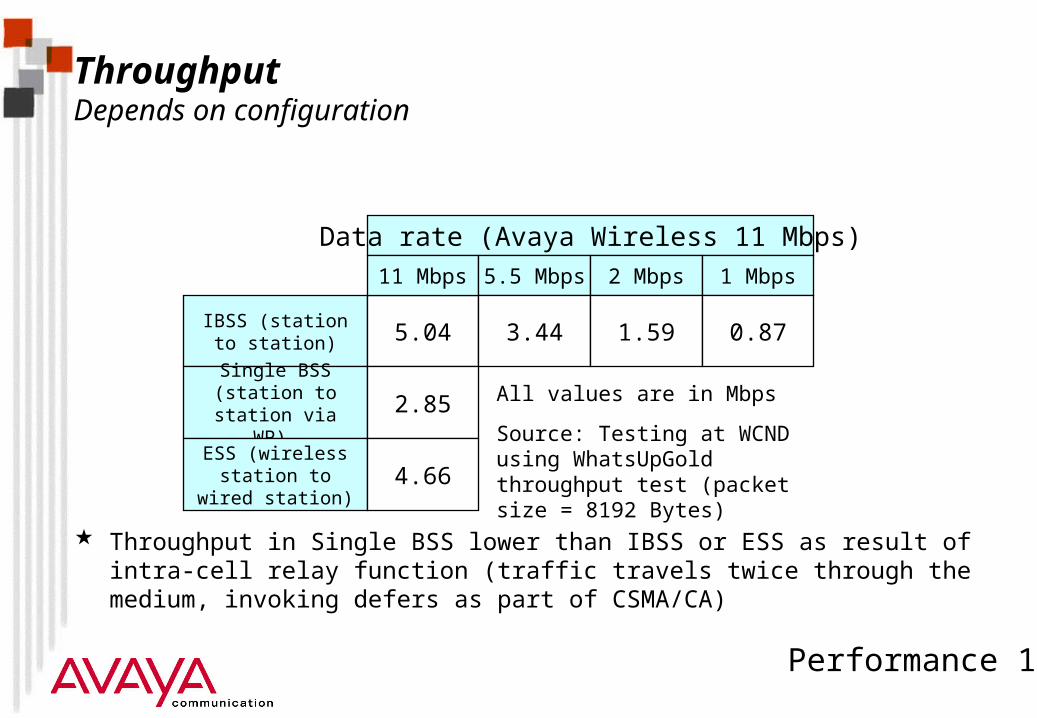
ThroughputDepends on configuration
Throughput in Single BSS lower than IBSS or ESS as result of intra-cell relay function (traffic travels twice through the medium, invoking defers as part of CSMA/CA)
Data rate (Avaya Wireless 11 Mbps)
IBSS (station to station) 5.04
Single BSS (station to station via WP)
ESS (wireless station to wired
station)
Source: Testing at WCND using WhatsUpGold throughput test (packet size = 8192 Bytes)
11 Mbps 5.5 Mbps 2 Mbps 1 Mbps
3.44 1.59 0.87
2.85
4.66
All values are in Mbps
Performance 13
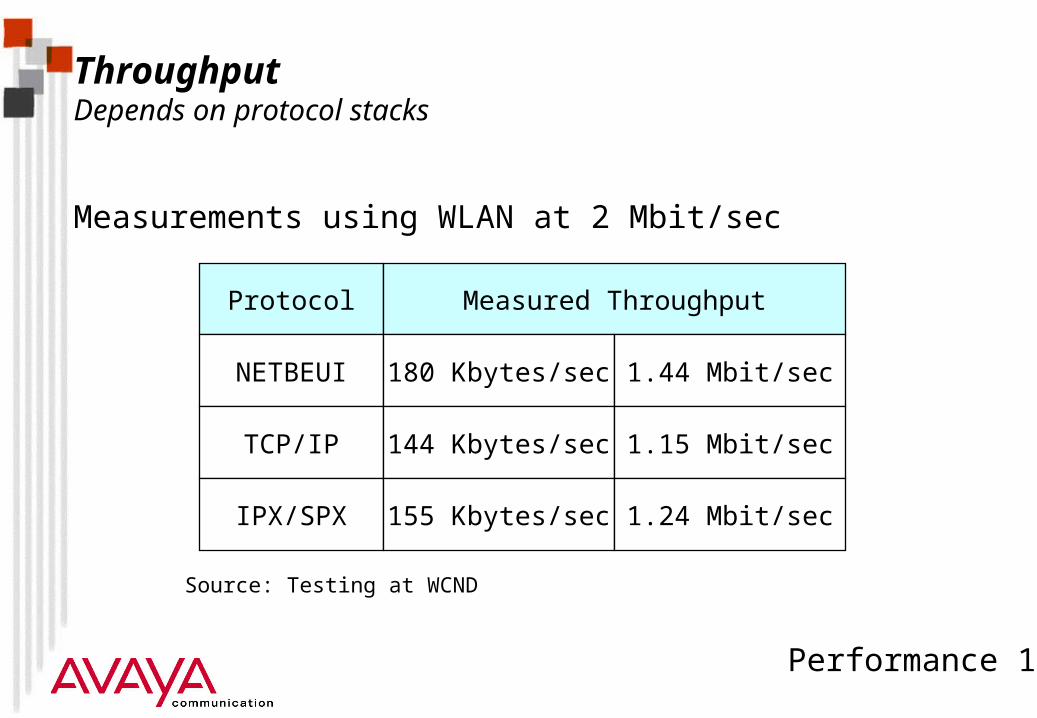
Protocol Measured Throughput
NETBEUI 180 Kbytes/sec
TCP/IP 144 Kbytes/sec
IPX/SPX 155 Kbytes/sec
1.44 Mbit/sec
1.15 Mbit/sec
1.24 Mbit/sec
ThroughputDepends on protocol stacks
Measurements using WLAN at 2 Mbit/sec
Source: Testing at WCND
Performance 14
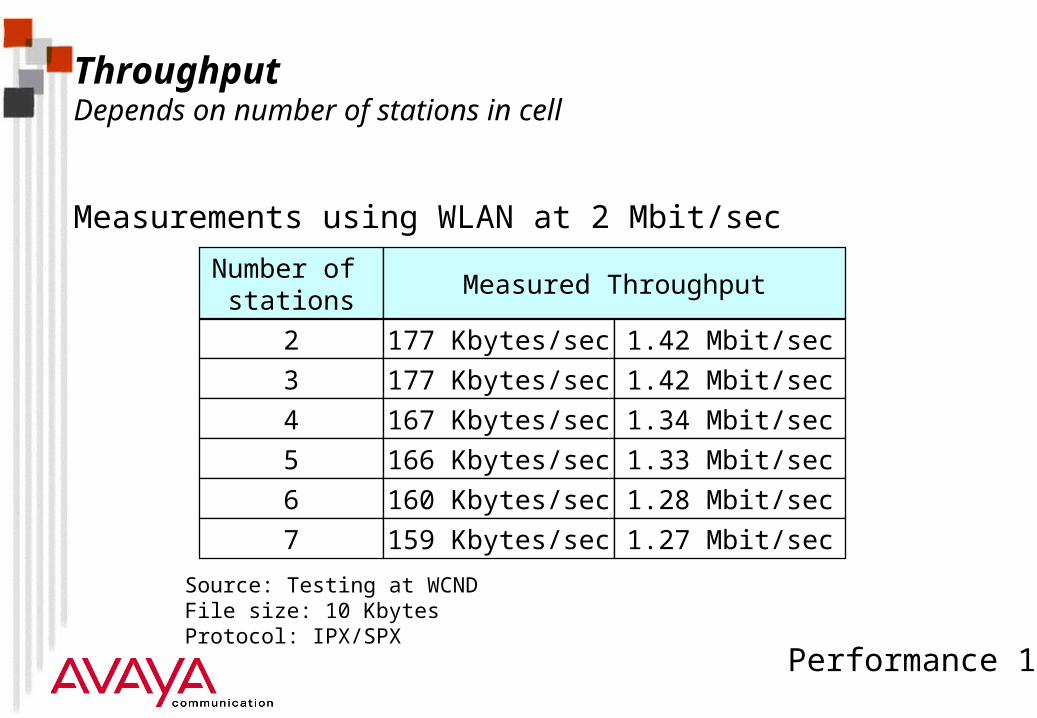
ThroughputDepends on number of stations in cell
Measurements using WLAN at 2 Mbit/sec
Number of stations
Measured Throughput
2 177 Kbytes/sec 1.42 Mbit/sec
3 177 Kbytes/sec 1.42 Mbit/sec
4 167 Kbytes/sec 1.34 Mbit/sec
5 166 Kbytes/sec 1.33 Mbit/sec
6 160 Kbytes/sec 1.28 Mbit/sec
7 159 Kbytes/sec 1.27 Mbit/sec
Source: Testing at WCNDFile size: 10 KbytesProtocol: IPX/SPX
Performance 15
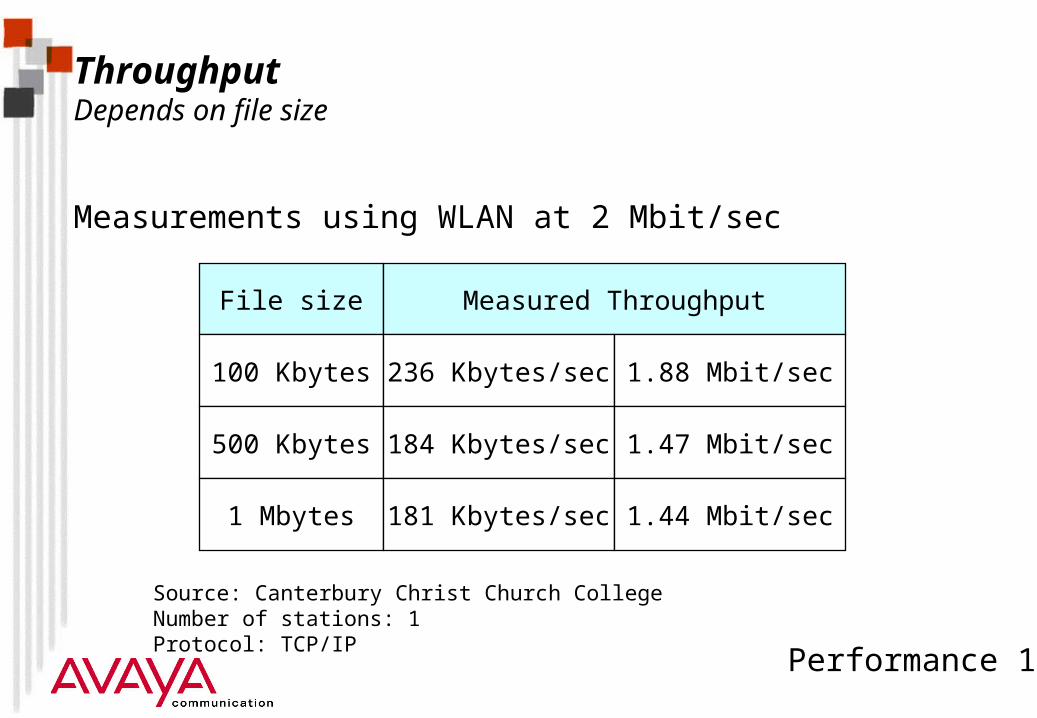
File size Measured Throughput
100 Kbytes 236 Kbytes/sec
500 Kbytes 184 Kbytes/sec
1 Mbytes 181 Kbytes/sec
1.88 Mbit/sec
1.47 Mbit/sec
1.44 Mbit/sec
ThroughputDepends on file size
Measurements using WLAN at 2 Mbit/sec
Source: Canterbury Christ Church CollegeNumber of stations: 1Protocol: TCP/IP
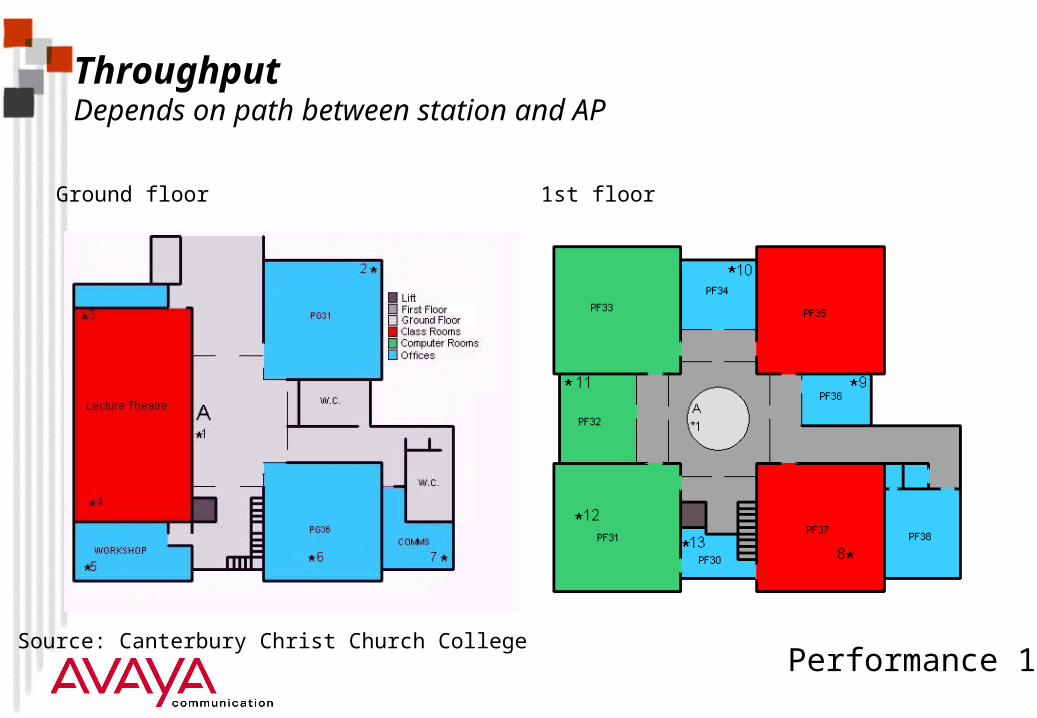
Performance 16Source: Canterbury Christ Church College
1st floorGround floor
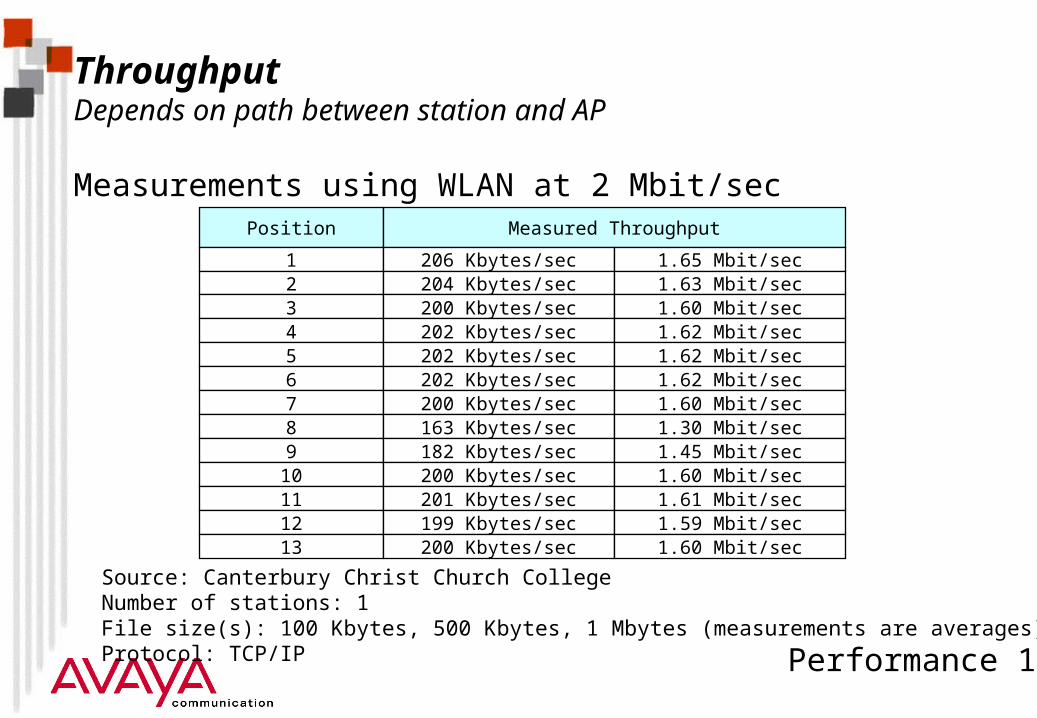
ThroughputDepends on path between station and AP
Performance 17
ThroughputDepends on path between station and AP
Measurements using WLAN at 2 Mbit/secPosition Measured Throughput
1 206 Kbytes/sec 1.65 Mbit/sec2 204 Kbytes/sec 1.63 Mbit/sec3 200 Kbytes/sec 1.60 Mbit/sec4 202 Kbytes/sec 1.62 Mbit/sec5 202 Kbytes/sec 1.62 Mbit/sec6 202 Kbytes/sec 1.62 Mbit/sec7 200 Kbytes/sec 1.60 Mbit/sec8 163 Kbytes/sec 1.30 Mbit/sec9 182 Kbytes/sec 1.45 Mbit/sec
10 200 Kbytes/sec 1.60 Mbit/sec11 201 Kbytes/sec 1.61 Mbit/sec12 199 Kbytes/sec 1.59 Mbit/sec13 200 Kbytes/sec 1.60 Mbit/sec
Source: Canterbury Christ Church CollegeNumber of stations: 1File size(s): 100 Kbytes, 500 Kbytes, 1 Mbytes (measurements are averages)Protocol: TCP/IP
Performance 18
Module contents
Overview
Data-rate
Throughput
Response times
Capacity
Power consumption
Performance 19
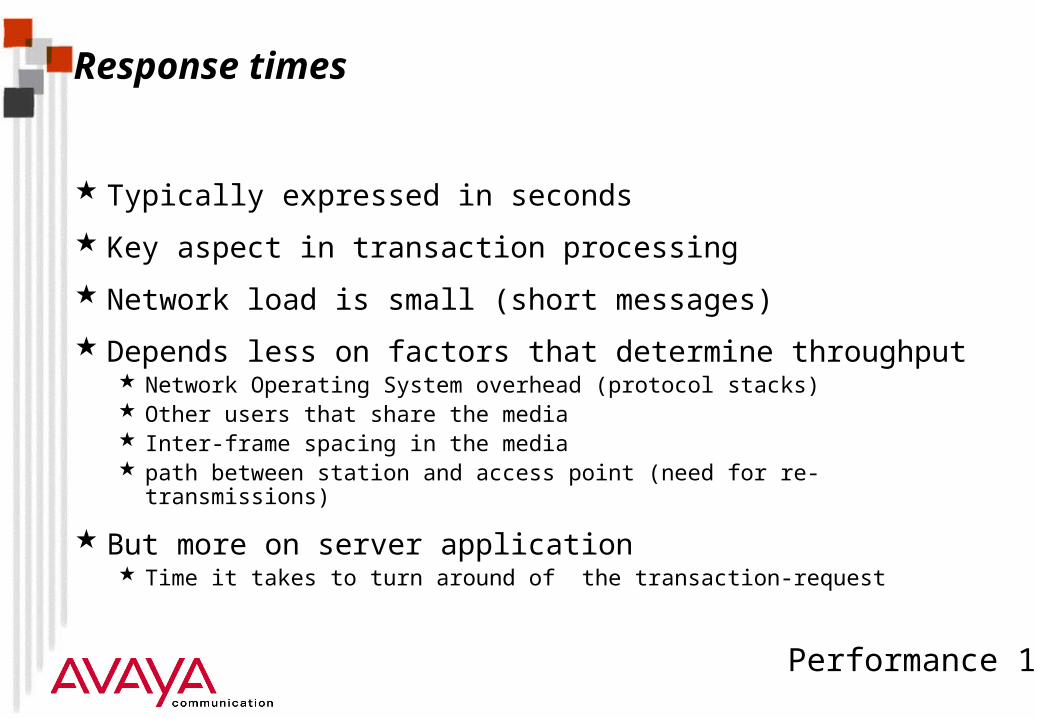
Response times
Typically expressed in seconds
Key aspect in transaction processing
Network load is small (short messages)
Depends less on factors that determine throughput Network Operating System overhead (protocol stacks) Other users that share the media Inter-frame spacing in the media path between station and access point (need for re-transmissions)
But more on server application Time it takes to turn around of the transaction-request
Performance 20
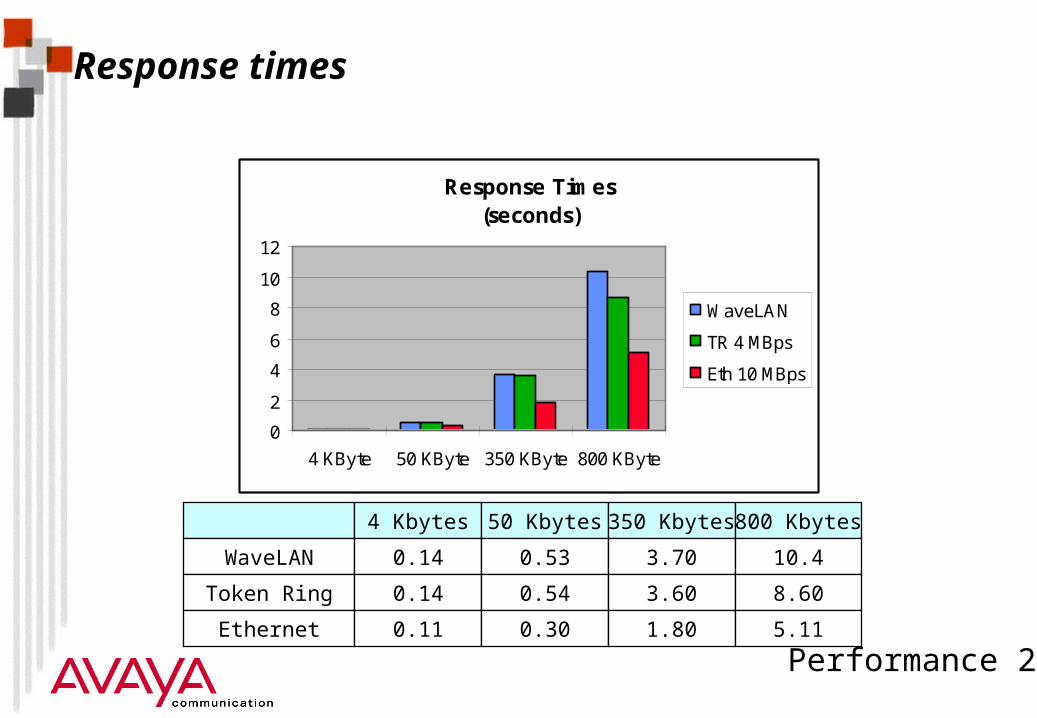
Response Times(seconds)
0
2
4
6
8
10
12
4 KByte 50 KByte 350 KByte 800 KByte
WaveLAN
TR 4 MBps
Eth 10 MBps
Response times
4 Kbytes
WaveLAN 0.14
Token Ring 0.14
Ethernet 0.11
50 Kbytes
0.53
0.54
0.30
350 Kbytes
3.70
3.60
1.80
800 Kbytes
10.4
8.60
5.11
Performance 21
Module contents
Overview
Data-rate
Throughput
Response times
Capacity
Power consumption
Performance 22
Capacity
Number of stations per “radio-cell” depends on
Bandwidth requirements per station user profile
Available bandwidth per cell net capacity per cell depending on protocol and path : 1.1 - 1.8 Mbit/sec (for a
2 Mbit/sec data rate) maximum data-rate (11 Mbit/sec maximum)
Dimension (coverage) of the cell
Number of co-located cells can be increased by using additional channels
Performance 23
CapacityBandwidth requirements
Differ per application:
Transaction processing < 8 Kbit/sec
Office Automation < 64 Kbit/sec (depending on user profile)
Multimedia 100-800 Kbit/sec
CAD/CAM >1.5 Mbit/sec
Performance 24
CapacityOffice automation user profiles
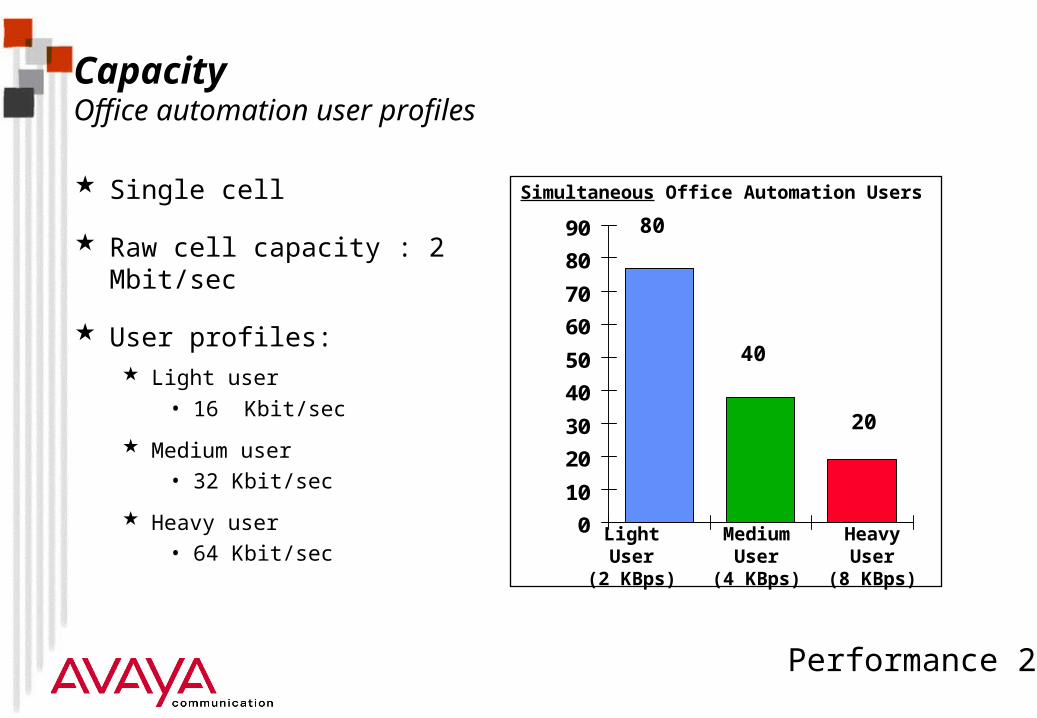
Single cell
Raw cell capacity : 2 Mbit/sec
User profiles: Light user
• 16 Kbit/sec
Medium user• 32 Kbit/sec
Heavy user• 64 Kbit/sec 0
10
20
30
40
50
60
70
80
90 80
40
20
LightUser
(2 KBps)
MediumUser
(4 KBps)
HeavyUser
(8 KBps)
Simultaneous Office Automation Users
Performance 25
CapacityDimension of the cell
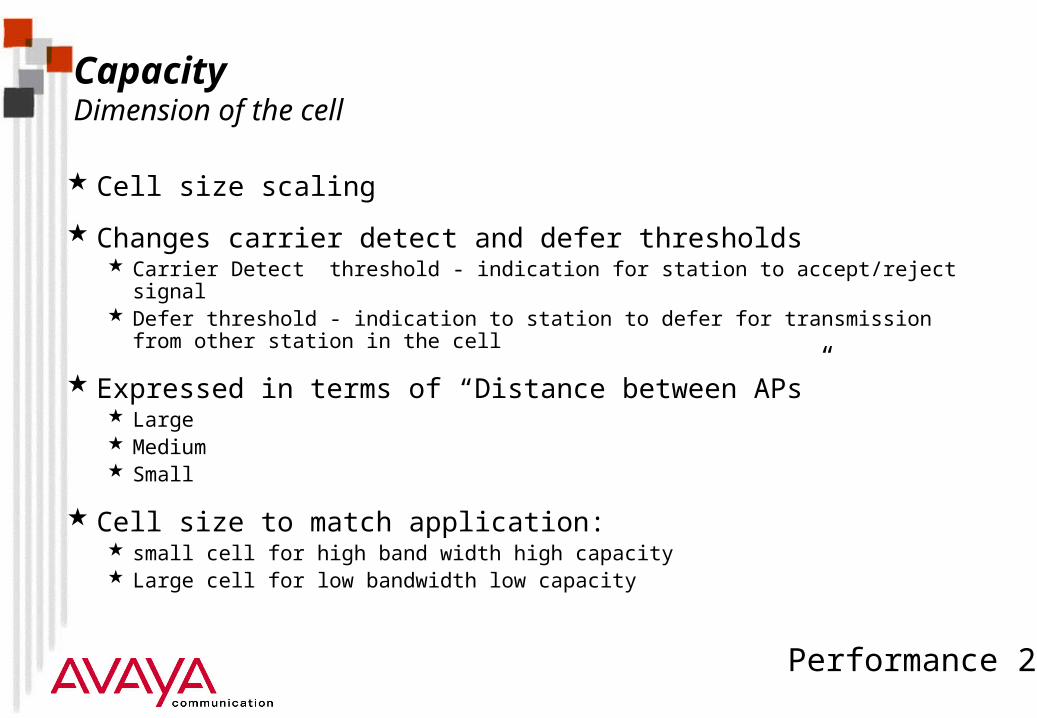
Cell size scaling
Changes carrier detect and defer thresholds Carrier Detect threshold - indication for station to accept/reject signal Defer threshold - indication to station to defer for transmission from other station in
the cell
Expressed in terms of “Distance between APs” Large Medium Small
Cell size to match application: small cell for high band width high capacity Large cell for low bandwidth low capacity
Performance 26
CapacityDimension of the cell
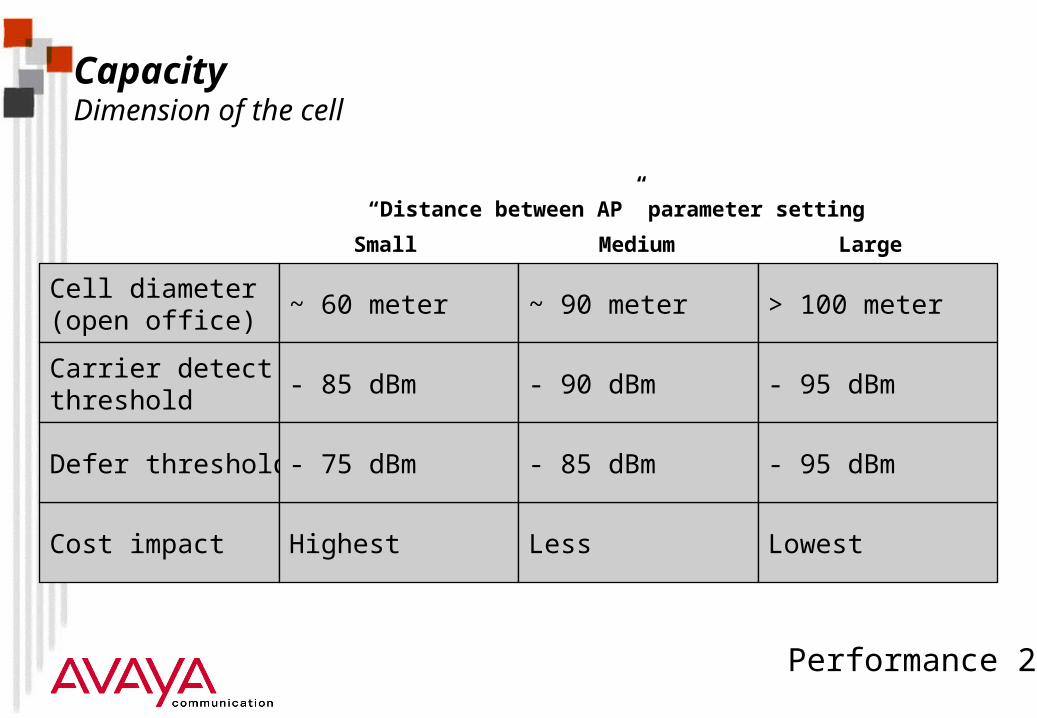
Cost impact
Cell diameter (open office)
Carrier detectthreshold
Defer threshold
Highest
~ 60 meter
- 85 dBm
- 75 dBm
Less
~ 90 meter
- 90 dBm
- 85 dBm
Lowest
> 100 meter
- 95 dBm
- 95 dBm
“Distance between AP” parameter setting
Medium LargeSmall
Performance 27
CapacityMulti-channel networks
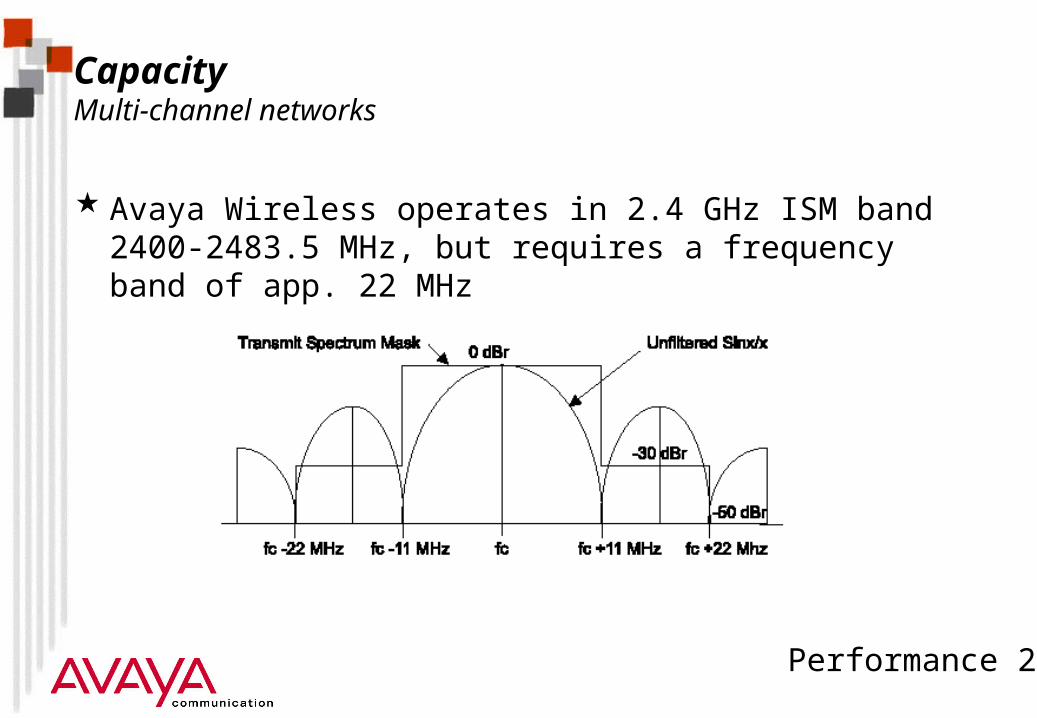
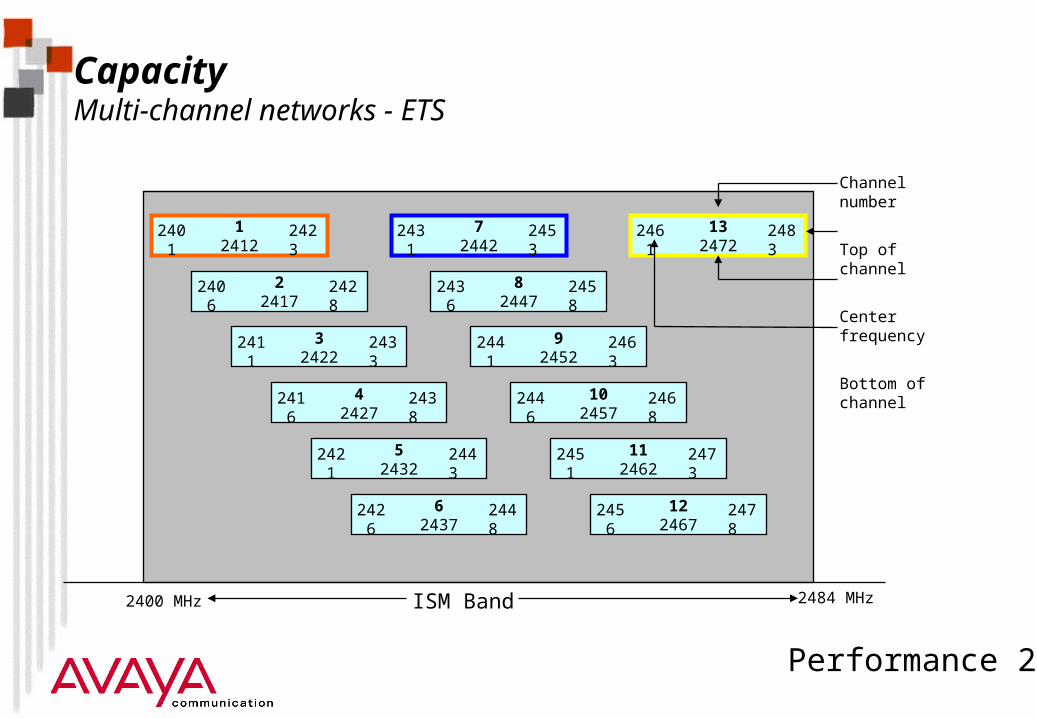
Avaya Wireless operates in 2.4 GHz ISM band 2400-2483.5 MHz, but requires a frequency band of app. 22 MHz
Performance 28
CapacityMulti-channel networks
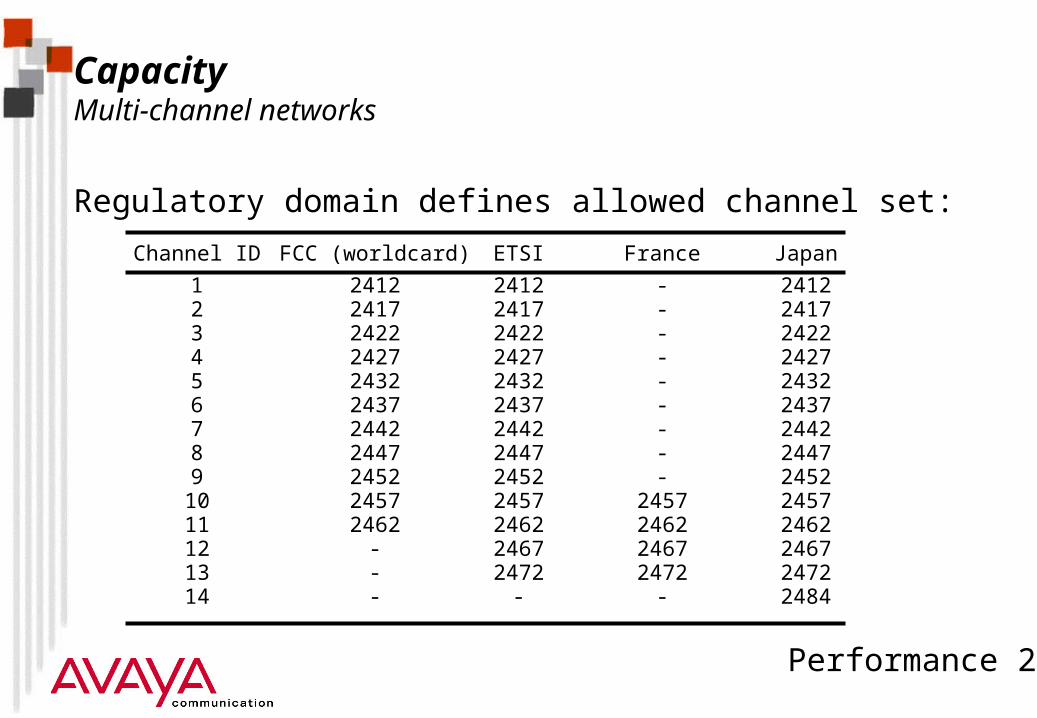
Regulatory domain defines allowed channel set:
Channel ID ETSIFCC (worldcard) France Japan
1 24122412 -2 24172417 -3 24222422 -4 24272427 -5 24322432 -6 24372437 -7 24422442 -8 24472447 -9 24522452 -
10 24572457 2457
12 2467- 246713 2472- 247214 -- - 2484
11 24622462 2462
2412241724222427243224372442244724522457
24672472
2462
Performance 29
1
24122401 242
3
22417
2406 2428
32422
2411 2433
42427
2416 2438
52432
2421 2443
62437
2426 2448
72442
2431 2453
82447
2436 2458
92452
2441 2463
102457
2446 2468
112462
2451 2473
122467
2456 2478
132472
2461 2483
2400 MHz 2484 MHzISM Band
Channel number
Top of channel
Center frequency
Bottom of channel
CapacityMulti-channel networks - ETS
Performance 30
1
24122401 242
3
22417
2406 2428
32422
2411 2433
42427
2416 2438
52432
2421 2443
62437
2426 2448
72442
2431 2453
82447
2436 2458
92452
2441 2463
102457
2446 2468
112462
2451 2473
2400 MHz 2484 MHzISM Band
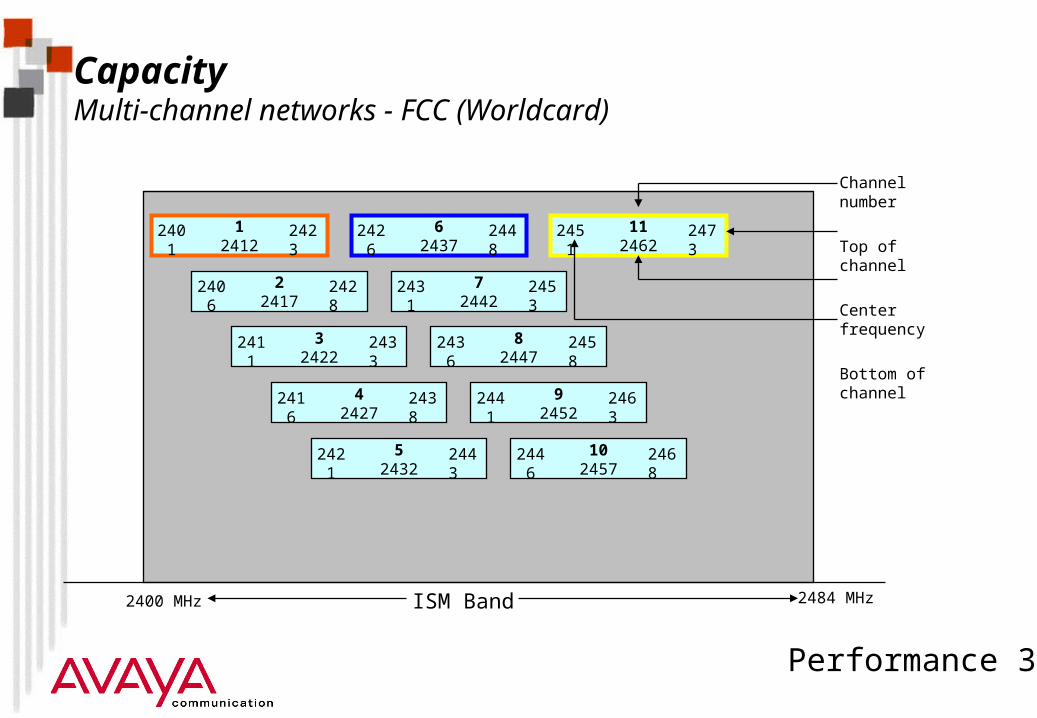
CapacityMulti-channel networks - FCC (Worldcard)
Channel number
Top of channel
Center frequency
Bottom of channel
Performance 31
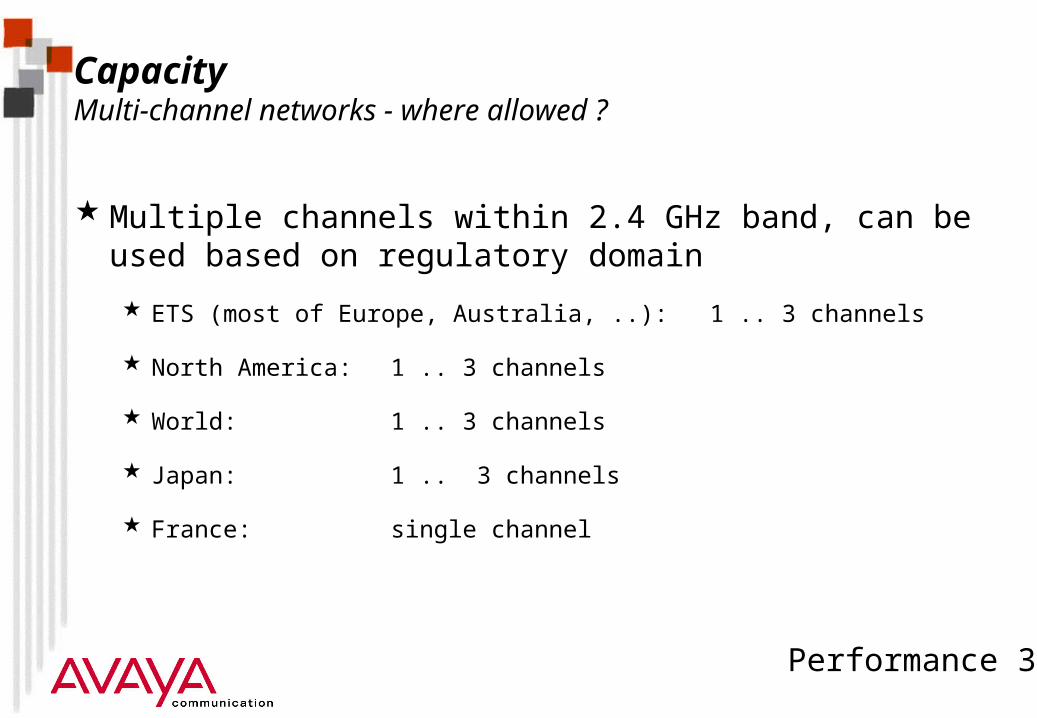
CapacityMulti-channel networks - where allowed ?
Multiple channels within 2.4 GHz band, can be used based on regulatory domain
ETS (most of Europe, Australia, ..): 1 .. 3 channels
North America:1 .. 3 channels
World: 1 .. 3 channels
Japan: 1 .. 3 channels
France: single channel
Performance 32
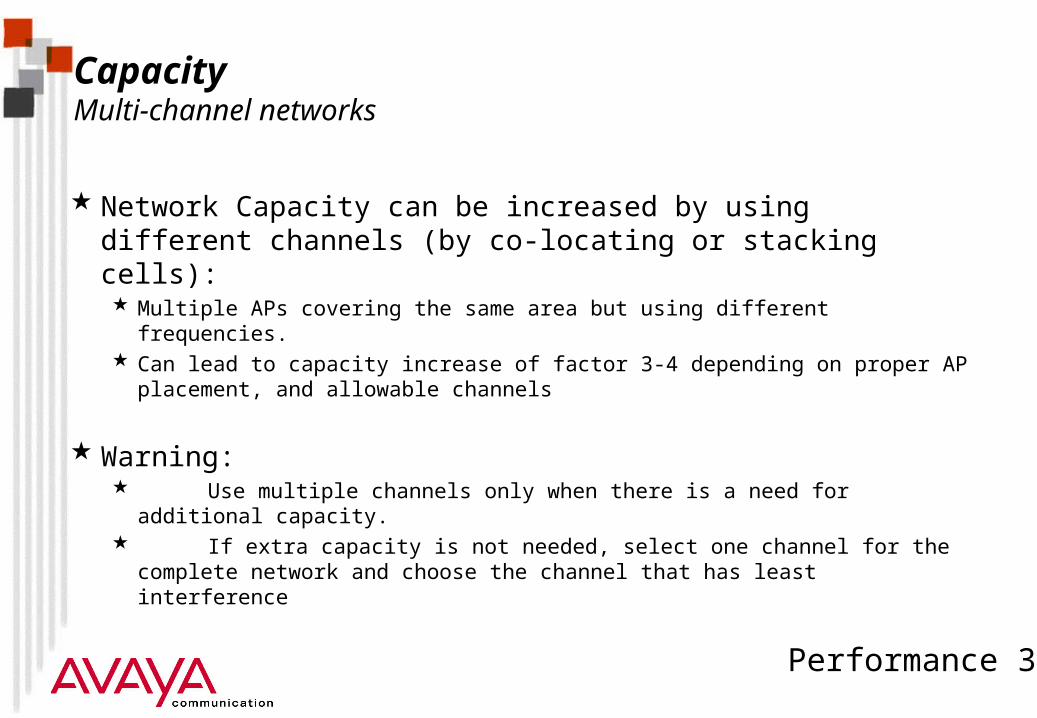
CapacityMulti-channel networks
Network Capacity can be increased by using different channels (by co-locating or stacking cells): Multiple APs covering the same area but using different frequencies. Can lead to capacity increase of factor 3-4 depending on proper AP
placement, and allowable channels
Warning: Use multiple channels only when there is a need for additional
capacity. If extra capacity is not needed, select one channel for the complete
network and choose the channel that has least interference
Performance 33
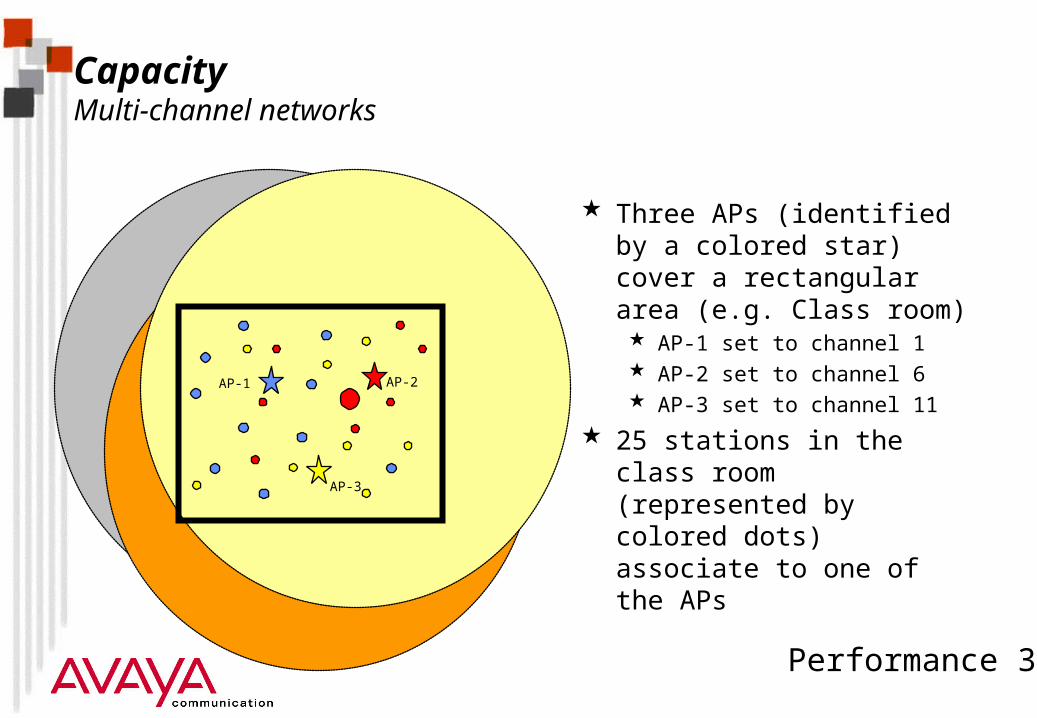
CapacityMulti-channel networks
AP-1 AP-2
AP-3
Three APs (identified by a colored star) cover a rectangular area (e.g. Class room) AP-1 set to channel 1 AP-2 set to channel 6 AP-3 set to channel 11
25 stations in the class room (represented by colored dots) associate to one of the APs
Performance 34
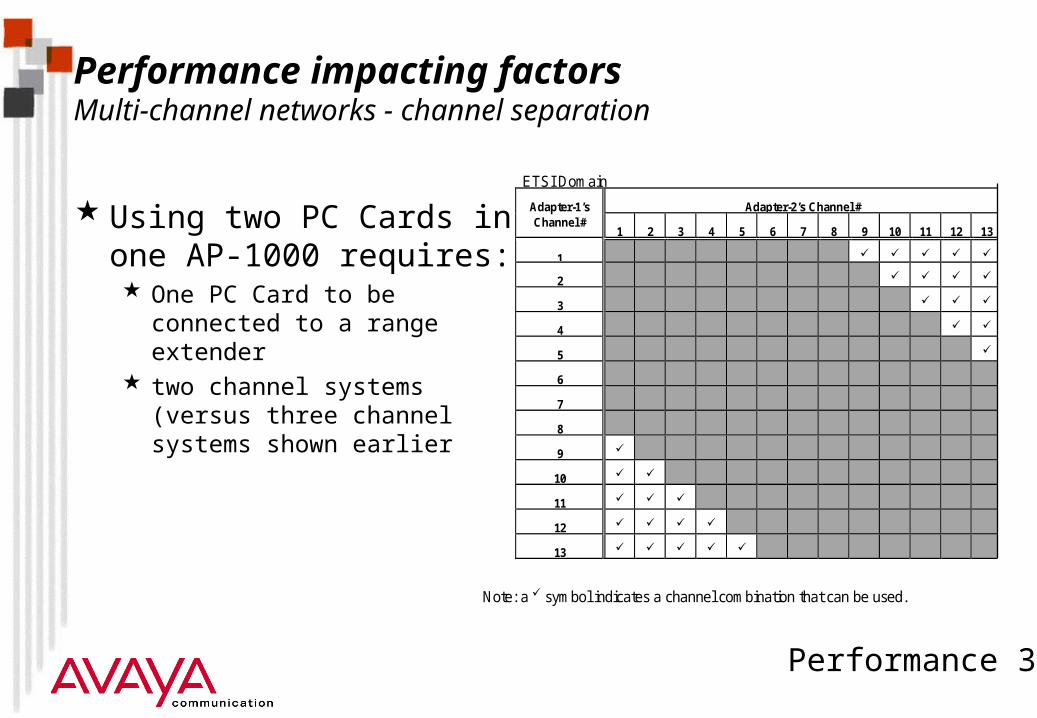
Performance impacting factorsMulti-channel networks - channel separation
Using two PC Cards in one AP-1000 requires: One PC Card to be connected to
a range extender two channel systems (versus
three channel systems shown earlier
ETSI Domain
Adapter-1’s Adapter-2’s Channel #Channel #
1 2 3 4 5 6 7 8 9 10 11 12 13
1
2
3
4
5
6
7
8
9
10
11
12
13
Note: a symbol indicates a channel combination that can be used.
Performance 35
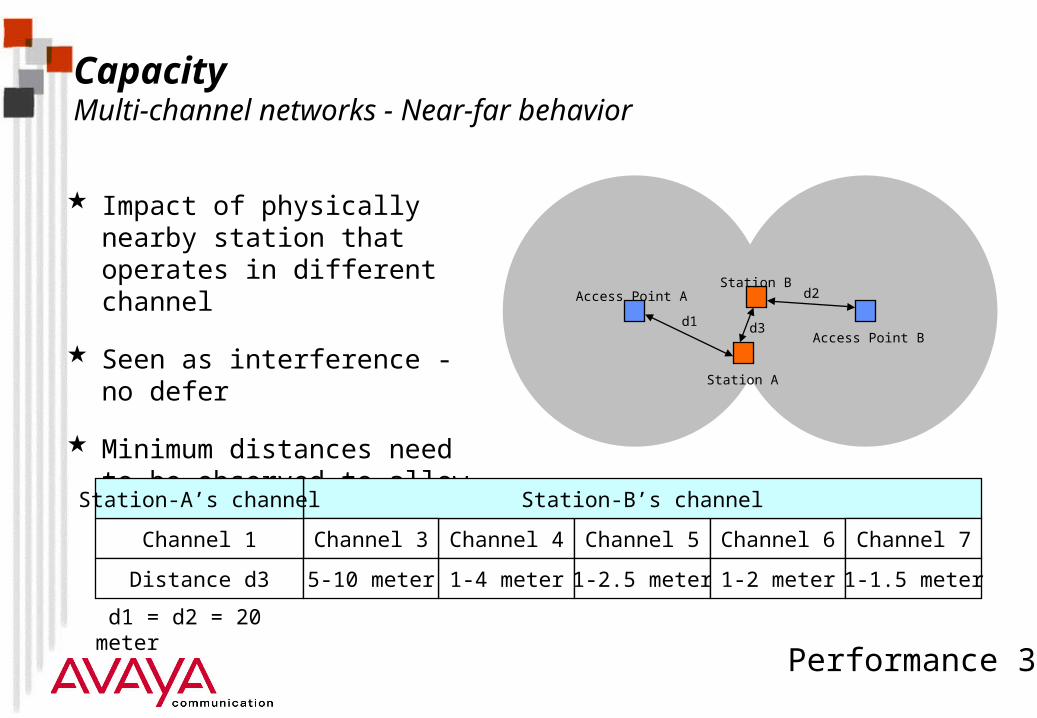
CapacityMulti-channel networks - Near-far behavior
Impact of physically nearby station that operates in different channel
Seen as interference - no defer
Minimum distances need to be observed to allow good operation
d3d1
d2Access Point A
Access Point B
Station A
Station B
Channel 4 Channel 5 Channel 6
Station-B’s channel
Channel 3 Channel 7Channel 1
Distance d3
Station-A’s channel
1-4 meter 1-2.5 meter 1-2 meter5-10 meter 1-1.5 meter
d1 = d2 = 20 meter
Performance 36
Module contents
Overview
Data-rate
Throughput
Response times
Capacity
Power consumption
Performance 37
Power consumption
Power consumption can be reduced by Standard 802.11 Power Save Mode:
Improves battery life
Impacts throughput
Not recommended for all applications
Performance 38
Power consumptionHow Power Management works
Station under Power Management can be in two states: Awake Doze (sleep)
Traffic to be transmitted to the station is buffered by the Access-Point, when station is in doze state
Station wakes for (nth) Beacon and examines TIM (TIM = Traffic Indication Map), which is inside Beacon
When traffic is present station polls the Access-Point for each buffered frame
When station needs to transmit it wakes up for transmission, and goes back to sleep immediately
Performance 39
Power consumptionHow Power Management works
Station can be configured to receive multi-cast messages
Access-Point will buffer multi-cast traffic and send it following a DTIM (=Delivery Traffic Information Message) inside the Beacon
DTIM interval can be configured at the Access-Point in terms of # of beacons between subsequent DTIM messages: e.g every nth beacon (where n is user configuration parameter)
Performance 40
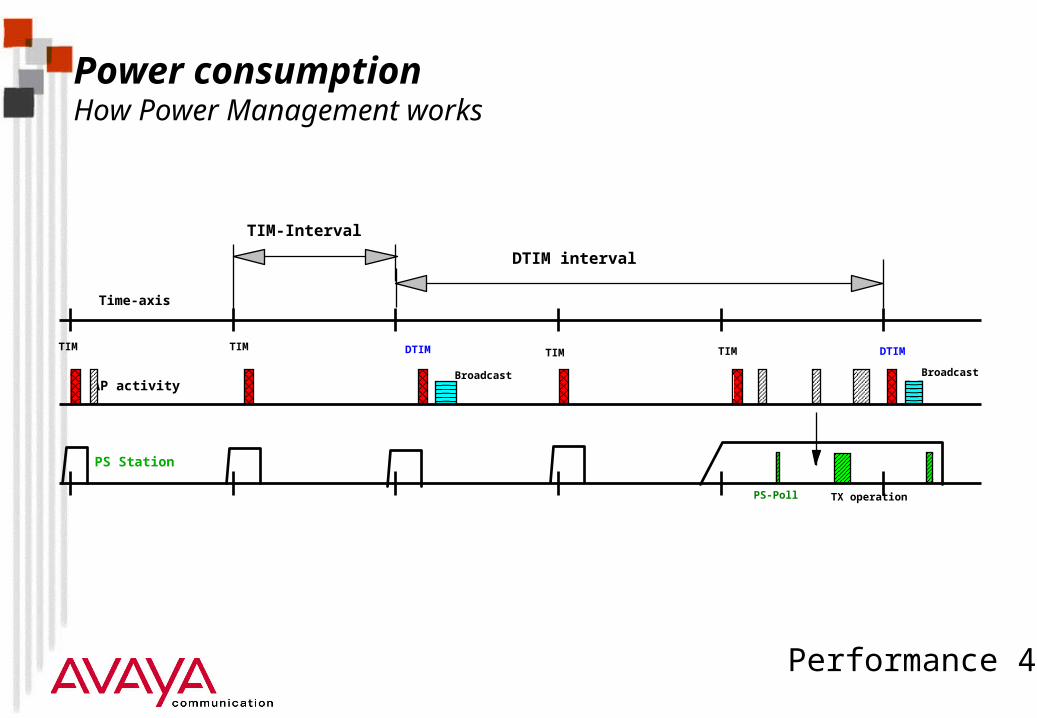
Power consumptionHow Power Management works
TIM-Interval
TX operation
PS Station
PS-Poll
TIM
Time-axis
AP activity
TIMTIM TIM DTIMDTIM
DTIM interval
BroadcastBroadcast

Performance 41
Power consumptionImpact of Power Management
Improves battery life
Reduced amount of power consumed by the network card Overall battery life improvement more significant when network card’s power
consumption represent large portion of total Overall battery life improvement insignificant when platform station consumes
substantial amount of power for non-network elements
Impacts throughput Transmission of large files will suffer from reduced performance Transaction oriented processing will not perceive performance impact
Performance 42
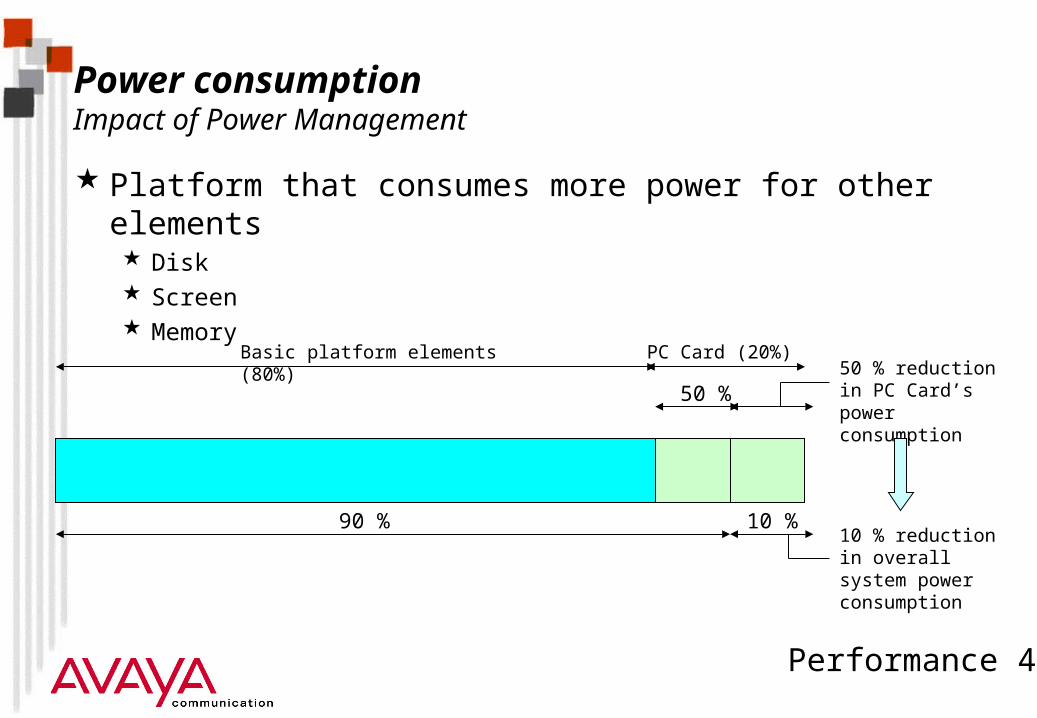
90 % 10 %
50 % reduction in PC Card’s power consumption
50 %
10 % reduction in overall system power consumption
Basic platform elements (80%) PC Card (20%)
Power consumptionImpact of Power Management
Platform that consumes more power for other elements Disk Screen Memory
Performance 43
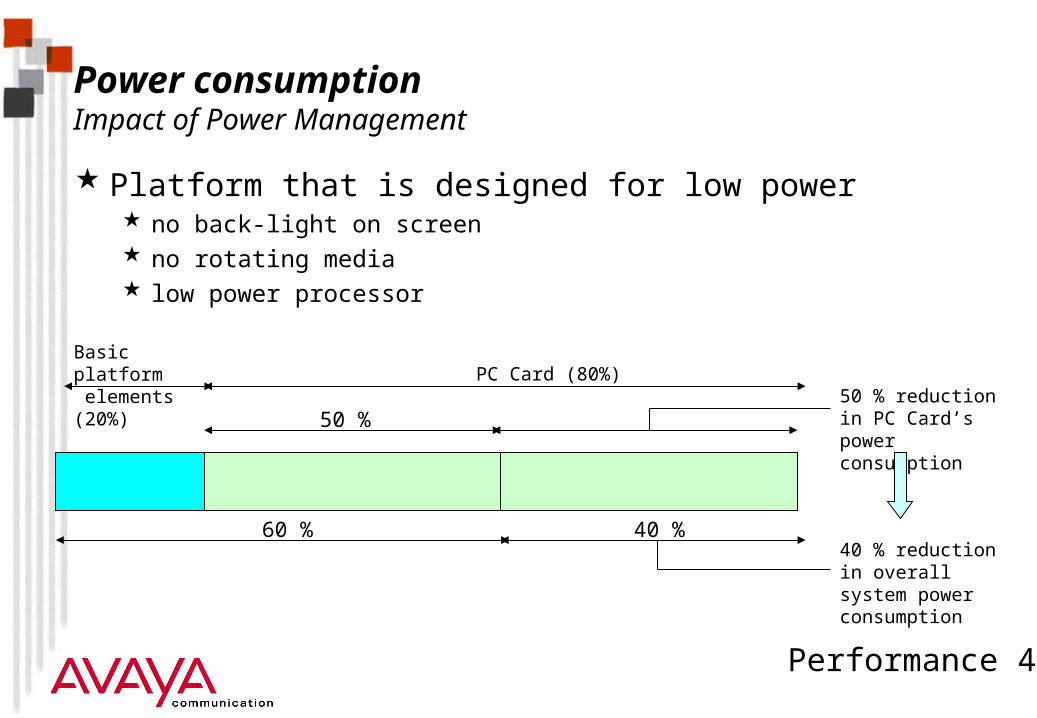
Power consumptionImpact of Power Management
Platform that is designed for low power no back-light on screen no rotating media low power processor
Basic platform elements (20%) PC Card (80%)
60 % 40 %
50 % reduction in PC Card’s power consumption
50 %
40 % reduction in overall system power consumption
Performance 44
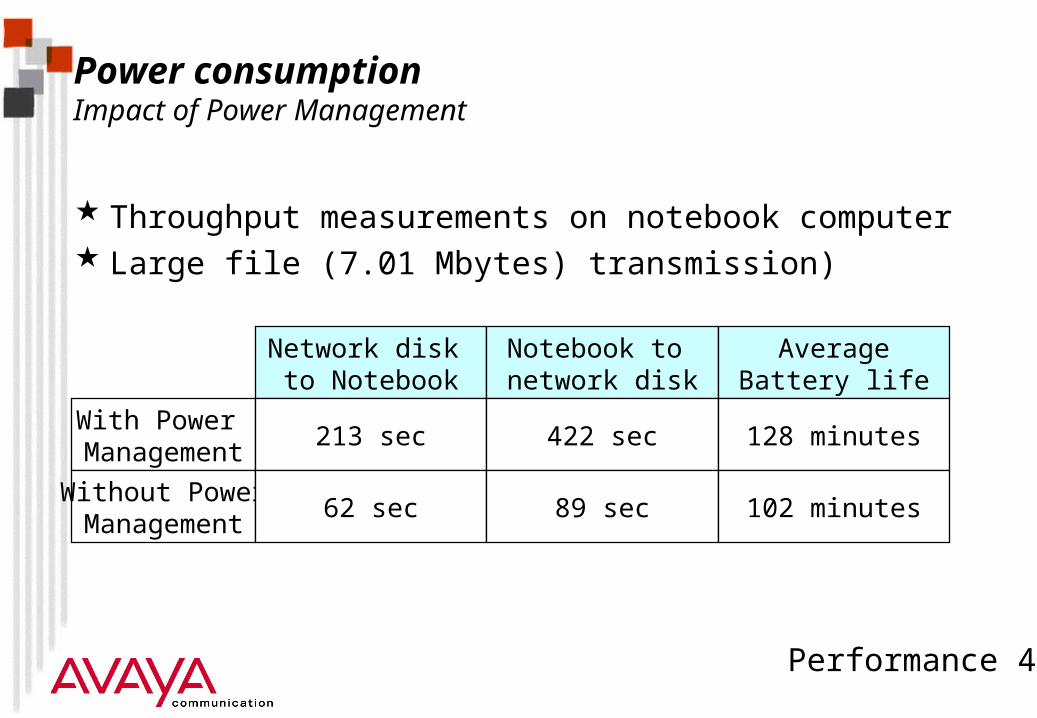
Power consumptionImpact of Power Management
Throughput measurements on notebook computer Large file (7.01 Mbytes) transmission)
Network disk to Notebook
Notebook to network disk
With Power Management
213 sec
Without PowerManagement
62 sec
422 sec
89 sec
AverageBattery life
128 minutes
102 minutes
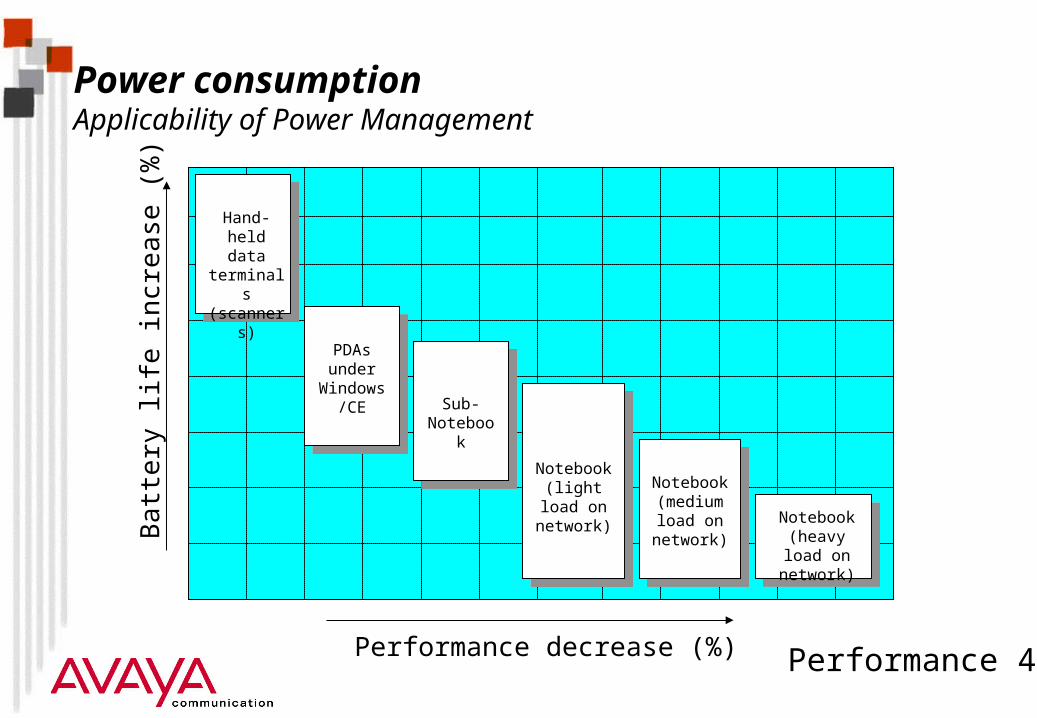
Performance 45Performance decrease (%)
Ba
ttery
life
incr
ease
(%
)
Hand-held data
terminals (scanners)
PDAs under
Windows/CE
Notebook (light load
on network)
Notebook (medium load on network)
Notebook (heavy load on network)
Sub-Notebook
Power consumptionApplicability of Power Management
Performance 46
Module summary
Overview
Data-rate
Throughput
Response times
Capacity
Power consumption