pesticide residues in food 2016: special session of the joint fao
TRANSCRIPT

FAOPLANT
PRODUCTIONAND PROTECTION
PAPER
227 227
ISSN 2070-2515227Pesticide residues in food 2016 –
Joint FAO/WHO Meeting on Pesticide Residues
FAO
Pesticide residuesin food 2016
REPORT2016
Special Session of the Joint FAO/WHO Meeting on Pesticide Residues
I5693E/1/05.16
8Biotecnología agrícola para países en desarrollo
FAO
Biotecnología agrícolapara países en desarrollo Resultados de un foro electrónico
ESTUDIO FAOINVESTIGACIÓNY TECNOLOGIA
En esta publicación se presenta un informe sobre las primeras seis conferencias mediante correo electrónico organizadas por el Foro electrónico de la FAO sobre la biotecnología en la alimentación y la agricultura,
celebradas entre marzo de 2000 y mayo de 2001. Todas las conferencias contaron con un moderador, duraron aproximadamente dos meses y se centraron en la biotecnología agrícola en los países en desarrollo. Las cuatro primeras conferencias trataron de la idoneidad para los países en desarrollo de las biotecnologías actualmente
disponibles en los sectores agrícola, pesquero, forestal y ganadero. Las otras dos conferencias trataron de las repercusiones de la biotecnología agrícola sobre el hambre y la seguridad alimentaria en los países en
desarrollo y las consecuencias de los derechos de propiedad intelectual en la alimentación y la agricultura en esos países.
8
ISSN 1020-055X
Etude prospective du secteur forestier en AfriqueRapport r gional Ð opportunit s et d �s ˆ l'horizon 2020
ƒTUDE FAOFORæTS
Ce rapport r gional de lÕEtude prospective du secteur forestier en Afrique fournit une vue dÕensemble des possibilit s o�ertes et des d �s ˆ relever pour renforcer la contribution du secteur forestier au d veloppement
durable de lÕAfrique, dans le contexte des changements politiques et institutionnels, d mographiques, conomiques, technologiques et environnementaux. Sur la base dÕun examen de lÕimpact des facteurs de changement et des sc narios probables, il donne une indication de ce qui pourrait arriver dÕici ˆ 2020, si les
tendances actuelles persistent. Les priorit s et les strat gies permettant de renforcer la contribution du secteur forestier au bien- tre social sont galement tudi es.
141
ISSN 1014-1197
412Title SPIN
EFAO
9 7 8 9 2 5 2 0 4 9 1 0 4TC/M/Y4521F/1/2.03/600
ISBN 92-5-204910-X ISSN 1014-2894
Title Spanishgdfgdfgdf sdJgfsdFFAO/WHO MeetingfSubtiltle
ESTUDIO FAOPRODUCCIîN
Y SANIDADANIMAL
Blurb TEXTHelvetica bold 8/12
412
ISSN 1014-1200
412Title SPIN
EFAO
A Joint Meeting of the FAO Panel of Experts on Pesticide Residues in Food and the Environment and the WHO Core Assessment Group on Pesticide Residues (JMPR) was held in Geneva, Switzerland, from 9 to 13 May 2016. The three pesticides evaluated at the meeting were placed on the agenda by the JMPR Secretariat following the recommendation of an electronic task force of the WHO Core Assessment Group that they be re-evaluated due to public health concerns identified by the
International Agency for Research on Cancer (IARC) and the availability of a significant number of new studies. During the meeting, the WHO Core Assessment Group was responsible for reviewing epidemiological, toxicological and related data in order to establish acceptable daily intakes (ADIs) and acute reference doses (ARfDs) of the pesticides for humans, where necessary. As no residue data
were requested, the FAO Expert was responsible for estimating the dietary exposures (both short-term and long-term) to the pesticides reveiewed and, on this basis, performed dietary risk assessments in relation to their ADIs or ARfDs. This report contains information on ADIs, ARfDs and general principles for the evaluation of pesticides. The recommendations of the Joint Meeting, including further research and information, are proposed for use by Member governments of the
respective agencies and other interested parties.


WORLD HEALTH ORGANIZATIONFOOD AND AGRICULTURE ORGANIZATION OF THE UNITED NATIONS
Pesticide residues in food 2016Joint FAO/WHO Meetingon Pesticide Residues
Report of the special session of the Joint Meeting of the FAO Panel of Experts on Pesticide Residues in Food and the Envi-ronment and the WHO Core Assessment Group on Pesticide Residues Geneva, Switzerland, 9–13 May 2016
Rome, 2016
FAOPLANT
PRODUCTIONAND PROTECTION
PAPER
227

The designations employed and the presentation of material in this publication do not imply the expression of any opinion whatsoever on the part of the Food and Agriculture Organization of the United Nations (FAO) or of the World Health Organization (WHO) concerning the legal status of any country, territory, city or area or of its authorities, or concerning the delimitation of its frontiers or boundaries. Dotted lines on maps represent approximate border lines for which there may not yet be full agreement. The mention of specific companies or products of manufacturers, whether or not these have been patented, does not imply that these are or have been endorsed or recommended by FAO or WHO in preference to others of a similar nature that are not mentioned. Errors and omissions excepted, the names of proprietary products are distinguished by initial capital letters. All reasonable precautions have been taken by FAO and WHO to verify the information contained in this publication. However, the published material is being distributed without warranty of any kind, either expressed or implied. The responsibility for the interpretation and use of the material lies with the reader. In no event shall FAO and WHO be liable for damages arising from its use. The views expressed herein are those of the authors and do not necessarily represent those of FAO or WHO. ISBN 978-92-5-109246-0 © FAO and WHO, 2016 FAO and WHO encourage the use, reproduction and dissemination of material in this information product. Except where otherwise indicated, material may be copied, downloaded and printed for private study, research and teaching purposes, provided that appropriate acknowledgement of FAO and WHO as the source and copyright holder is given and that FAO and WHO’s endorsement of users’ views, products or services is not implied in any way. All requests for translation and adaptation rights, and for resale and other commercial use rights should be made via www.fao.org/contact-us/licence-request or addressed to [email protected]. FAO information products are available on the FAO website (www.fao.org/publications) and can be purchased through

iii
iii
TABLE OF CONTENTS
List of participants ................................................................................................................................ v
Abbreviations ..................................................................................................................................... vii
Use of JMPR reports and evaluations by registration authorities .................................................. ix
1. Introduction .............................................................................................................................. 1
1.1 Declaration of interests ....................................................................................................... 1
2. General considerations ............................................................................................................ 3
2.1 General considerations on the evaluation of genotoxicity studies ...................................... 3
2.2 Methods for the evaluation of epidemiological evidence for risk assessment .................... 3
3. Evaluation of data for acceptable daily intake and acute reference dose for humans ..... 7
3.1 Diazinon (22) (T)** ............................................................................................................ 7
3.2 Glyphosate (158) (T)** ..................................................................................................... 19
3.3 Malathion (49) (T)** ........................................................................................................ 29
4. Recommendations .................................................................................................................. 43
Annex 1: Acceptable daily intakes and acute reference doses recorded by the May 2016 Meeting ...................................................................................................................... 45
Annex 2: Index of reports and evaluations of pesticides by the JMPR ............................... 47
Annex 3: International estimated daily intakes of pesticide residues .................................. 61
Annex 4: International estimates of short-term dietary intakes of pesticide residues ....... 91
Annex 5: Reports and other documents resulting from previous Joint Meetings of the FAO Panel of Experts on Pesticide Residues in Food and the Environment and the WHO Core Assessment Group on Pesticide Residues .......................... 101
T, toxicological evaluation
** Evaluated following the recommendation of an electronic task force of the WHO Core Assessment Group on Pesticide Residues that the compound be re-evaluated due to public health concerns identified by IARC and the availability of a significant number of new studies


v
v
LIST OF PARTICIPANTS
2016 Joint FAO/WHO Meeting on Pesticide Residues
Geneva, 9–13 May 2016
Professor Alan R. Boobis, Centre for Pharmacology & Therapeutics, Division of Experimental Medicine, Department of Medicine, Faculty of Medicine, Imperial College London, Hammersmith Campus, Ducane Road, London W12 0NN, United Kingdom (WHO Chairman)
Ms Marloes Busschers, Assessor of Human Toxicology, Board for the Authorisation of Plant Protection Products and Biocides, Bennekomseweg 41, 6717 LL Ede, PO Box 2030, 6710 AA Ede, the Netherlands (WHO Expert)
Dr Carl E. Cerniglia,1 Director, Division of Microbiology, National Center for Toxicological Research, HFT-250, Food and Drug Administration, 3900 NCTR Road, Jefferson, AR 72079, United States of America (USA) (WHO Expert)
Dr Sylvaine Cordier,2 Research Director Emeritus, French National Institute of Health and Medical Research (INSERM U1085), University of Rennes, 2 rue de Tabor, CS 46510, 35065 Rennes, France (WHO Expert)
Dr David Eastmond, Department of Cell Biology & Neuroscience, 2109 Biological Sciences Building, University of California, Riverside, CA 92521, USA (WHO Expert)
Professor Dr Andrea Hartwig,3 Karlsruher Institut für Technologie, Institut für Angewandte Biowissenschaften, Abteilung Lebensmittelchemie und Toxicologie, Adenauerring 20a, Gebäude 50.41 (AVG), Raum 103, Postanschrift: Kaiserstr. 12, 76131 Karlsruhe, Germany (WHO Expert)
Dr Miriam Jacobs, Toxicology Department, Centre for Radiation, Chemical and Environmental Hazards, Public Health England, Chilton, Oxfordshire, OX11 0RQ, United Kingdom (WHO
Expert)
Dr Virissa Lenters (assisting),1 Division of Environmental Epidemiology, Institute for Risk Assessment Sciences, Utrecht University, Yalelaan 2, PO Box 80178, Utrecht, the Netherlands (WHO Expert)
Dr Dugald MacLachlan, Australian Government Department of Agriculture and Water Resources, GPO Box 858, Canberra, ACT 2601, Australia (FAO Chairman)
Professor Angelo Moretto, Department of Biomedical and Clinical Sciences, University of Milan, International Centre for Pesticides and Health Risk Prevention (ICPS), ASST Fatebenefratelli Sacco, Luigi Sacco Hospital, Via GB Grassi 74, 20157 Milano, Italy (Rapporteur)
Dr Matthew Joseph O’Mullane, Director, Chemical Review, Australian Pesticides and Veterinary Medicines Authority (APVMA), PO Box 6182, Kingston, ACT 2604, Australia (WHO Expert)
Dr Aldert H. Piersma, Professor of Reproductive and Developmental Toxicology, Center for Health Protection, National Institute for Public Health and the Environment (RIVM), Antonie van Leeuwenhoeklaan 9, PO Box 1, 3720 BA Bilthoven, the Netherlands (WHO Expert)
1 Did not attend the meeting. 2 Did not attend the meeting, but her valuable contributions to the methodological setup of the epidemiological evaluation are gratefully acknowledged. 3 Attended part of the meeting only.

vi
Dr Prakashchandra V. Shah, Chief, Chemistry, Inerts and Toxicology Assessment Branch, Registration Division (MDTS 7505P), Office of Pesticide Programs, United States Environmental Protection Agency, 1200 Pennsylvania Avenue NW, Washington, DC 20460, USA (WHO Expert)
Dr Rachel B. Smith (assisting),1 Department of Epidemiology and Biostatistics, School of Public Health, Imperial College London, Norfolk Place, London W2 1PG, United Kingdom (WHO
Expert)
Dr Raymond Tice, Special Volunteer, Biomolecular Screening Branch, Division of the National Toxicology Program, National Institute of Environmental Health Sciences, Mail Code K2-17, PO Box 12233, Research Triangle Park, NC 27709, USA (WHO Expert)
Dr Mireille B. Toledano, Senior Lecturer in Epidemiology, MRC-PHE Centre for Environment and Health, Department of Epidemiology and Biostatistics, School of Public Health, Faculty of Medicine, Imperial College London, St Mary’s Campus, Norfolk Place, London W2 1PG, United Kingdom (WHO Expert)
Dr Midori Yoshida, Commissioner, Food Safety Commission, Cabinet Office, Akasaka Park Building, 22nd Floor, 5-2-20 Akasaka Minato-ku, Tokyo 107-6122, Japan (WHO Expert)
Dr Jürg Zarn, Federal Food Safety and Veterinary Office (FSVO), Risk Assessment Division, Schwarzenburgstrasse 155, CH-3003 Bern, Switzerland (WHO Expert)
Secretariat
Mr Enzo Armaroli, Intern, Department of Food Safety and Zoonoses, World Health Organization, 1211 Geneva 27, Switzerland
Dr Richard Brown, Evidence and Policy on Environmental Health, World Health Organization, 1211 Geneva 27, Switzerland
Mr Paul Garwood, Department of Communication, World Health Organization, 1211 Geneva 27, Switzerland
Dr Kathryn Guyton, International Agency for Research on Cancer, 150 Cours Albert Thomas, 69008 Lyon, France
Ms Marla Sheffer, 1553 Marcoux Drive, Orleans, Ontario, Canada K1E 2K5 (WHO Editor)
Dr Angelika Tritscher, Coordinator, Risk Assessment and Management, Department of Food Safety and Zoonoses, World Health Organization, 1211 Geneva 27, Switzerland
Dr Philippe Verger, Department of Food Safety and Zoonoses, World Health Organization, 1211 Geneva 27, Switzerland (WHO JMPR Secretary)
Ms Yong Zhen Yang, Plant Production and Protection Division, Food and Agriculture Organization of the United Nations, Viale delle Terme di Caracalla, 00153 Rome, Italy (FAO JMPR Secretary)
1 Did not attend the meeting.

vii
vii
ABBREVIATIONS
ADI acceptable daily intake
AHS Agricultural Health Study
AMPA aminomethylphosphonic acid
ARfD acute reference dose
BMD benchmark dose
bw body weight
CAS Chemical Abstracts Service
CCPR Codex Committee on Pesticide Residues
CI confidence interval
CYP cytochrome P450
DCF diet correction factor
DNA deoxyribonucleic acid
F0 parental generation
F1 first filial generation
FAO Food and Agriculture Organization of the United Nations
GEMS/Food Global Environment Monitoring System – Food Contamination Monitoring and Assessment Programme
GLP good laboratory practice
HR highest residue in the edible portion of a commodity found in trials used to estimate a maximum residue level in the commodity
HR-P highest residue in a processed commodity calculated by multiplying the HR of the raw commodity by the corresponding processing factor
IARC International Agency for Research on Cancer
IEDI international estimated daily intake
IESTI international estimate of short-term dietary intake
ISO International Organization for Standardization
IUPAC International Union of Pure and Applied Chemistry
JMPR Joint FAO/WHO Meeting on Pesticide Residues
LC50 median lethal concentration
LD50 median lethal dose
LOAEL lowest-observed-adverse-effect level
MDCA malathion dicarboxylic acid
MIC minimum inhibitory concentration
MMCA malathion monocarboxylic acid
MRL maximum residue limit
NC no national consumption data available

viii
NES not elsewhere specified
NHL non-Hodgkin lymphoma
NOAEC no-observed-adverse-effect concentration
NOAEL no-observed-adverse-effect level
OR odds ratio
PP processed product
ppm parts per million
RAC raw agricultural commodity
RR relative risk
STMR supervised trials median residue
STMR-P supervised trials median residue in a processed commodity calculated by multiplying the STMR of the raw commodity by the corresponding processing factor
TAF toxicity adjustment factor
WHO World Health Organization

ix
ix
USE OF JMPR REPORTS AND EVALUATIONS BY REGISTRATION AUTHORITIES
Most of the summaries and evaluations contained in this report are based on unpublished proprietary data submitted for use by JMPR in making its assessments. A registration authority should not grant a registration on the basis of an evaluation unless it has first received authorization for such use from the owner of the data submitted for the JMPR review or has received the data on which the summaries are based, either from the owner of the data or from a second party that has obtained permission from the owner of the data for this purpose.


Introduction 1
1
PESTICIDE RESIDUES IN FOOD
REPORT OF THE MAY 2016 JOINT FAO/WHO MEETING OF EXPERTS
1. INTRODUCTION
A Joint Meeting of the Food and Agriculture Organization of the United Nations (FAO) Panel of Experts on Pesticide Residues in Food and the Environment and the World Health Organization (WHO) Core Assessment Group on Pesticide Residues (JMPR) was held at WHO Headquarters, Geneva (Switzerland), from 9 to 13 May 2016.
The meeting was opened by Dr Kazuaki Miyagishima, Director of the Department of Food Safety and Zoonoses, WHO, who welcomed participants on behalf of the Directors General of WHO and FAO. Dr Miyagishima stated that the meeting was convened to re-evaluate three compounds for which new studies had become available since their last full assessments. He reminded the participants of the importance of the functional separation between risk assessment and risk management and of the role that JMPR plays as the expert risk assessment body providing scientific advice to Codex and to Member States. He urged the participants to be guided by JMPR’s standing rules and procedures based on the weight of evidence approach. Dr Miyagishima thanked the participants for devoting significant time and effort to the work of JMPR, including the preparatory work of paramount importance that had taken place in the past months. He reminded the experts that they were invited as independent experts acting in their own individual capacities and not as representatives of their countries or organizations. He also reminded the participants of the confidential nature of the meeting, in order to allow experts to freely express their opinions.
During the meeting, the WHO Core Assessment Group was responsible for reviewing epidemiological, toxicological and related data in order to establish acceptable daily intakes (ADIs) and acute reference doses (ARfDs), where necessary. As no residue data were requested, the FAO Expert was responsible for estimating the dietary exposures (both short-term and long-term) to the pesticides reviewed and, on this basis, performed dietary risk assessments in relation to their ADIs or ARfDs.
The Meeting re-evaluated three pesticides, established ADIs and ARfDs and recommended them for use by the Codex Committee on Pesticide Residues (CCPR). The Meeting also considered issues related to the evaluation of genotoxicity and epidemiological studies in relation to the risk assessment of chemicals.
1.1 DECLARATION OF INTERESTS
The Secretariat informed the Meeting that all experts participating in the May 2016 JMPR had completed declaration of interest forms and that no conflicts had been identified.


General considerations 3
3
2. GENERAL CONSIDERATIONS
2.1 GENERAL CONSIDERATIONS ON THE EVALUATION OF GENOTOXICITY STUDIES
A large number of genotoxicity studies were evaluated during the present meeting. These were identified through direct submission to JMPR, searches of the publicly available literature and requests to the International Agency for Research on Cancer (IARC) Monographs Secretariat and industry groups. The studies evaluated included unpublished (primarily guideline) studies submitted to support pesticide registration as well as peer-reviewed studies published in the scientific literature. The number, quality and relevance of studies differed widely for each chemical and necessitated that a somewhat different approach be used to evaluate each pesticide. As a general strategy, the studies were separated into categories based largely on phylogenetic relevance and significance of the genetic end-point measured. The categories used were human biomonitoring, in vivo mammals, in vitro mammalian cells, in vitro bacteria, phylogenetically distant organisms, metabolites in vivo and metabolites in vitro. The evaluation was conducted for the pesticide active ingredient, its formulation products and prominent metabolites, as data were available. For the three pesticides evaluated, the human biomonitoring studies were most often confounded by exposures to other pesticides or considered to have other limitations. Among the genotoxicity studies, in vivo studies in mammals were given the greatest weight, compared with cell culture studies or investigations in phylogenetically distant organisms. Studies of gene mutations and chromosomal alterations were also given more weight than studies measuring other less serious or transient types of genotoxic damage. With regard to route of exposure, studies in which chemicals were administered by the oral route were considered to be of most relevance for evaluating low-level dietary exposures.
Following an evaluation and weighting of the studies, taking the criteria described above and the quality of the studies into account, an overall weight of evidence approach was used to reach conclusions about the genotoxicity of the individual pesticides. An important aspect of the evaluation was whether the genotoxic effect would be likely to occur in humans exposed to low levels of the pesticide present as residues in food.
The Meeting recommended that a guidance document be developed for the evaluation of genotoxicity studies, taking the experience gained from this meeting into account.
2.2 METHODS FOR THE EVALUATION OF EPIDEMIOLOGICAL EVIDENCE FOR RISK ASSESSMENT
Identification of compound/cancer sites and screening of papers
There is a large body of literature regarding pesticide exposures and non-cancer outcomes (neurodevelopmental, neurodegenerative and reproductive outcomes, among other health outcomes), but the assessment of the epidemiological evidence on diazinon, glyphosate and malathion was restricted to studies of cancer outcomes. This restriction was partly driven by feasibility reasons: a clinically relevant adverse effect size (or an acceptable level of risk) for a non-cancer outcome must be defined, and the methodologies for hazard identification and characterization based on observational epidemiological findings of non-carcinogenic adverse effects are less well established than those for cancer.1
1 See, for example, Clewell HJ, Crump KS. Quantitative estimates of risk for noncancer endpoints. Risk Anal. 2005;25(2):285–9; and Nachman KE, Fox MA, Sheehan MC, Burke TA, Rodricks JV, Woodruff TJ. Leveraging epidemiology to improve risk assessment. Open Epidemiol J. 2011;4:3–29.

4 General considerations
4
The IARC Monographs on malathion, diazinon and glyphosate referred to a total of 45 epidemiological studies.1 Databases were searched for any relevant articles published after the studies cited in these Monographs using the following search terms: [(diazinon OR glyphosate OR malathion) AND cancer] and [(diazinon OR glyphosate OR malathion) AND (NHL OR lymphoma OR leukemia OR “lung cancer” OR “prostate cancer”)] in PubMed (limited to Humans; published in the last 5 years) and Scopus (limited to 2014–2016). Two studies published since the publication of the IARC Monographs that evaluated at least one of malathion, diazinon or glyphosate were identified in relation to cancer outcomes.2 An additional study on prostate cancer,3 which was not included in the IARC Monographs, was also identified.
The pre-agreed evaluation process shown in Fig. 1 was used to (1) select compound/cancer site combinations to include in this evaluation; (2) screen papers for inclusion/exclusion in this evaluation (Tier 1 screening criteria); and (3) evaluate the information available for risk assessment. In this process, it was noted that there were stand-alone analyses for specific subtypes of non-Hodgkin lymphoma (NHL). The risk for subtypes of NHL was not evaluated separately, as there was insufficient evidence (too few studies or small numbers of cases); the risk for other haematopoietic and lymphoid tumours was also not evaluated separately, as the positive associations identified by IARC were for total NHL.
Figure 1: Evaluation process for epidemiological evidence
The current effort is restricted cancer outcomes
Overall summary
Paper is not relevant to risk assessment for compound
Yes
No
Yes
Yes
No
No
Paper is relevant and can contribute to quantitative risk assessment (i.e. hazard
characterization) for compound/cancer site
Paper is relevant but cannot contribute information to a
quantitative risk assessment
Exclude compound /cancer site combination
from evaluation
Yes
No
Exclude paper from evaluation for given
compound/cancer site
1. Relevance - For each compound/cancer site combination - did IARC identify positive associations
from the body of epidemiological evidence?
2. For related papers that examined the same compound/cancer site is this:- the most recent publication with longest follow-up for this
compound/cancer site? (e.g. cohort studies)- the most complete and updated analysis with the greatest number of
participants for this compound/cancer site? (e.g. pooled case-control)
3. Is exposure assessment specific to compound of interest?
4. Quantitative exposure assessment (exposure expressed on a ratio scale)
ACTION - for each relevant compound/cancer site:• Identify all papers in IARC Monographs assessing relevant compound/cancer sites (positive and null
associations)• Identify any papers published since IARC Monograph which address relevant compound/cancer site• Search by hand (e.g. check reference lists of identified papers) for any papers potentially missed
ACTIONS - for each relevant paper: • Extract information on quantitative exposure units.• Describe magnitude of effect/uncertainty• Review quality of study based on IARC Monograph and evaluation
criteria.• Describe exposure assessment and how exposure levels compare
to/translate to pesticide residue levels/pathways.
ACTIONS – for each compound/cancer site: • Characterize hazard for each compound/cancer site from all studies
contributing to quantitative risk assessment, e.g. forest plot (or meta-regression, time-permitting).
• Summarize strength of evidence.
26 papers identified
6 compound/cancer site combinations
Malathion/NHL – 2 papers excludedDiazinon/NHL – 2 papers excludedDiazinon/Lung – 2 papers excludedGlyphosate/NHL – 2 papers excluded
Diazinon/NHL – 1 paper excluded
Tier 1 screening criteria
1 IARC. Some organophosphate insecticides and herbicides: tetrachlorvinphos, parathion, malathion, diazinon and glyphosate. Lyon: International Agency for Research on Cancer; 2015 (IARC Monographs on the Evaluation of Carcinogenic Risks to Humans, Volume 112).
2 Koutros S, Silverman DT, Alavanja MC, Andreotti G, Lerro CC, Heltshe S et al. Occupational exposure to pesticides and bladder cancer risk. Int J Epidemiol. 2015; pii: dyv195 [Epub ahead of print]; and Lerro CC, Koutros S, Andreotti G, Friesen MC, Alavanja MC, Blair A et al. Organophosphate insecticide use and cancer incidence among spouses of pesticide applicators in the Agricultural Health Study. Occup Environ Med. 2015; 72(10):736–44.
3 Mills PK, Yang R. Prostate cancer risk in California farm workers. J Occup Environ Med. 2003; 45(3):249–58.

General considerations 5
5
Evaluation of evidence for the compound/cancer site associations
Several aspects of each study and of all studies combined were considered in this evaluation, including factors that decrease the level of confidence in the body of evidence, such as risk of bias, unexplained inconsistency and imprecision; and factors that increase the level of confidence, such as large magnitude of effect, dose-response and consistency.1 The findings for each study were summarized in tables, and risk estimates for non-quantitative exposure assessment (predominantly ever versus never use) were summarized in forest plots.
Evaluation of information available for risk assessment/hazard characterization
To evaluate overall evidence for dose-response relationships, risk estimates were plotted against quantitative exposure measures (for studies that had used these). The most commonly used quantitative exposure metric was days of use per year. Where studies had used other quantitative exposure metrics (e.g. lifetime days of exposure), data were requested from the authors on median “days of use per year” for the participants in each of the original exposure categories, although this information was not always forthcoming. These additional data allowed the translation and plotting of risk estimates from different studies on the same exposure scale (days of use per year).
1 Guyatt GH, Oxman AD, Vist GE, Kunz R, Falck-Ytter Y, Alonso-Coello P et al. GRADE: an emerging consensus on rating quality of evidence and strength of recommendations. BMJ. 2008;336:924-6; and Morgan RL, Thayer KA, Bero L, Bruce N, Falck-Ytter Y, Ghersi D et al. GRADE: Assessing the quality of evidence in environmental and occupational health. Environ Int. 2016;doi: 10.1016/j.envint.2016.01.004 [Epub ahead of print].


Diazinon 7
7
3. EVALUATION OF DATA FOR ACCEPTABLE DAILY INTAKE AND ACUTE REFERENCE DOSE FOR HUMANS
3.1 DIAZINON (22)
TOXICOLOGY
Diazinon is the common name approved by the International Organization for Standardization (ISO) for O,O-diethyl O-2-isopropyl-6-methylpyrimidin-4-yl phosphorothioate (International Union of Pure and Applied Chemistry [IUPAC]), with the Chemical Abstracts Service (CAS) number 333-41-5.
Diazinon is a contact organophosphorus insecticide with a wide range of insecticidal activity. It is effective against adult and juvenile forms of flying insects, crawling insects, acarians and spiders. Diazoxon, the biologically active metabolite of diazinon, inhibits the activity of cholinesterases.
Diazinon is used mainly as a pesticide in agriculture and as a drug in veterinary medicine. Thus, the major source of diazinon residues in edible crops is from its use as an agricultural pesticide; residues in meat, offal and other animal products arise from its use as a veterinary drug containing active ingredient.
Diazinon has been evaluated by JMPR on several occasions since the first evaluation in 1963. In the most recent evaluation, in 2006, the Meeting established an ADI of 0–0.005 mg/kg body weight (bw), based on a no-observed-adverse-effect level (NOAEL) of 0.5 mg/kg bw per day for inhibition of erythrocyte acetylcholinesterase activity in a 92-day repeated-dose toxicity study in rats. The 2006 Meeting reaffirmed the ARfD of 0.03 mg/kg bw, established by the 2001 JMPR, based on a NOAEL of 2.5 mg/kg bw observed in a study of acute neurotoxicity in rats.
Diazinon was scheduled within the periodic review programme of CCPR for 2021. The compound was placed on the agenda by the JMPR Secretariat following the recommendation of an electronic task force of the WHO Core Assessment Group on Pesticide Residues that it be re-evaluated due to public health concerns identified by IARC and the availability of a significant number of new studies.
The current Meeting evaluated all previously considered toxicological data in addition to new published or unpublished toxicological studies and published epidemiological studies on cancer outcomes. Several study reports evaluated at previous JMPR meetings were not available to the present Meeting, as they were not submitted in the sponsor’s dossier; for these studies, the evaluations in this report were summarized from the 1993 JMPR monograph without further review.
All critical unpublished studies contained statements of compliance with good laboratory practice (GLP), unless otherwise specified. The studies on human volunteers were conducted in accordance with the principles expressed in the Declaration of Helsinki or equivalent ethical standards.
Biochemical aspects
Following oral administration to rats, diazinon was almost completely absorbed and rapidly eliminated, mainly in the urine. There was no evidence of accumulation.
Diazinon is metabolized by P450 to diazoxon, the active metabolite. The main degradative pathway includes the oxidase/hydrolase-mediated cleavage of the ester bond, leading to the pyrimidinol derivative 2-isopropyl-6-methyl-4(1H)-pyrimidinone, which is further oxidized to more polar metabolites.

8 Diazinon
8
Toxicological data
The oral median lethal dose (LD50) for diazinon in rats ranged from 300 to greater than 2150 mg/kg bw, whereas the dermal LD50 was greater than 2000 mg/kg bw. The inhalation median lethal concentration (LC50) was 3.1 mg/L in rats. Diazinon produced mild skin and eye irritation in rabbits. It caused skin sensitization in the guinea-pig Magnusson and Kligman maximization test.
The most sensitive end-point observed in all species given single and repeated doses of diazinon was inhibition of cholinesterase activity. Brain acetylcholinesterase activity was generally decreased at doses higher than those that inhibited erythrocyte acetylcholinesterase activity. Clinical signs of cholinergic toxicity occurred at doses causing more than 50% inhibition of brain acetylcholinesterase activity. Female rats were more sensitive than male rats.
Many repeated-dose toxicity studies are available. In both rats and dogs, no effects other than those related to cholinesterase inhibition have been observed at the lowest-observed-adverse-effect level (LOAEL); in general, effects observed at the highest doses can be considered secondary to the cholinergic toxicity. In these studies, NOAELs ranged from 0.02 to 0.5 mg/kg bw per day, and LOAELs ranged from 1 to 15 mg/kg bw per day, based on erythrocyte acetylcholinesterase inhibition (i.e. > 20%), with brain acetylcholinesterase inhibition (i.e. > 10%) generally appearing at the next higher dose and clinical cholinergic signs appearing at doses above 23 mg/kg bw per day.
In a 28-day acetylcholinesterase inhibition study, rats received diazinon by dietary administration at a concentration of 0, 0.3, 30, 300 or 3000 parts per million (ppm) (equal to 0, 0.02, 2.3, 23 and 213 mg/kg bw per day for males and 0, 0.02, 2.4, 23 and 210 mg/kg bw per day for females, respectively). The NOAEL was 0.3 ppm (equal to 0.02 mg/kg bw per day), on the basis of inhibition of erythrocyte acetylcholinesterase activity at 30 ppm (equal to 2.3 mg/kg bw per day).
In a short-term toxicity study, rats were fed diazinon at a concentration of 0 or 2 ppm (equivalent to 0 and 0.2 mg/kg bw per day, respectively) for 7 days or at a concentration of 0 or 25 ppm (equivalent to 0 and 2.5 mg/kg bw per day, respectively) for 30 days. The NOAEL was 2 ppm (equivalent to 0.2 mg/kg bw per day), based on inhibition of erythrocyte acetylcholinesterase activity at 25 ppm (equivalent to 2.5 mg/kg bw per day).
In a 3-month toxicity study, rats were given diets containing diazinon at a concentration of 0, 0.5, 5, 250 or 2500 ppm (equal to 0, 0.03, 0.3, 15 and 168 mg/kg bw per day for males and 0, 0.04, 0.4, 19 and 212 mg/kg bw per day for females, respectively). The NOAEL was 5 ppm (equal to 0.3 mg/kg bw per day), on the basis of inhibition of erythrocyte and brain acetylcholinesterase activities at 250 ppm (equal to 15 mg/kg bw per day).
In a second 3-month toxicity study, rats were fed diets containing diazinon at a concentration of 0, 0.3, 30, 300 or 3000 ppm (equal to 0, 0.017, 1.7, 17 and 177 mg/kg bw per day for males and 0, 0.019, 1.9, 19 and 196 mg/kg bw per day for females, respectively). The NOAEL was 0.3 ppm (equal to 0.017 mg/kg bw per day), on the basis of inhibition of erythrocyte acetylcholinesterase activity at 30 ppm (equal to 1.7 mg/kg bw per day).
In a third 3-month toxicity study, female rats were fed diets containing diazinon at a concentration of 0, 5, 10 or 15 ppm (equivalent to 0, 0.5, 1 and 1.5 mg/kg bw per day, respectively) for 92 days. In the second phase, female rats were fed diets containing diazinon at a concentration of 0, 1, 2, 3 or 4 ppm (equivalent to 0, 0.1, 0.2, 0.3 and 0.4 mg/kg bw per day, respectively) for 42 days. In the third phase, female rats were fed diets containing diazinon at a concentration of 0, 0.1, 0.5, 1 or 2 ppm (equivalent to 0, 0.01, 0.05, 0.1 and 0.2 mg/kg bw per day, respectively) for 35 days. The NOAEL in the first phase was 5 ppm (equivalent to 0.5 mg/kg bw per day), based on inhibition of erythrocyte acetylcholinesterase activity at 10 ppm (equivalent to 1 mg/kg bw per day) after dosing for 92 days. The NOAEL for females in the second and third phases were the highest tested doses of 4 ppm (equivalent to 0.4 mg/kg bw per day) and 2 ppm (equivalent to 0.2 mg/kg bw per day) after dosing for 42 and 35 days, respectively.

Diazinon 9
9
In a fourth 3-month toxicity study, rats were fed diets containing diazinon at a concentration of 0, 5, 125 or 2000 ppm (equal to 0, 0.3, 7.8 and 198 mg/kg bw per day for males and 0, 0.3, 8.9 and 247 mg/kg bw per day for females, respectively). The NOAEL was 5 ppm (equal to 0.3 mg/kg bw per day), on the basis of inhibition of erythrocyte acetylcholinesterase activity at 125 ppm (equal to 7.8 mg/kg bw per day).
In a 90-day repeated-dose neurotoxicity study, rats were dosed in the diet at 0, 25, 125 or 1000 ppm (equal to 0, 1.7, 8.4 and 69.1 mg/kg bw per day for males and 0, 1.8, 9.3 and 82.4 mg/kg bw per day for females, respectively). A NOAEL could not be identified, as erythrocyte acetylcholinesterase activity was inhibited at 1.7 mg/kg bw per day, the lowest dose tested.
In considering the NOAELs and LOAELs identified in the 28-day and 3-month (neuro)toxicity studies in rats measuring the inhibition of acetylcholinesterase activity, the Meeting concluded that the extent of acetylcholinesterase inhibition was not dependent on duration of dosing once steady state had been achieved (within 4 weeks). The overall NOAEL for the 28-day and 3-month (neuro)toxicity studies in rats was 5 ppm, based on inhibition of erythrocyte acetylcholinesterase activity at the overall LOAEL of 10 ppm. In studies where feed consumption data were used to calculate test substance intake, 5 ppm was equal to 0.3 mg/kg bw per day. These substance intake data are considered to be more accurate than those calculated using a default conversion factor, in which the NOAEL of 5 ppm is equivalent to 0.5 mg/kg bw per day.
In a 90-day toxicity study, dogs were given diets containing diazinon at a concentration of 0, 0.1, 0.5, 150 or 300 ppm (equal to 0, 0.0034, 0.020, 5.9 and 10.9 mg/kg bw per day for males and 0, 0.0037, 0.021, 5.6 and 11.6 mg/kg bw per day for females, respectively). The NOAEL was 0.5 ppm (equal to 0.020 mg/kg bw per day), on the basis of inhibition of erythrocyte and brain acetylcholinesterase activities at a dietary concentration of 150 ppm (equal to 5.6 mg/kg bw per day).
In a second 90-day toxicity study, dogs were given diazinon at 0, 0.3, 3 or 10 mg/kg bw per day by gelatine capsule. The NOAEL was 0.3 mg/kg bw per day, on the basis of inhibition of erythrocyte and brain acetylcholinesterase activities at 3 mg/kg bw per day.
In a 1-year toxicity study in dogs given diazinon in the diet at a concentration of 0, 0.1, 0.5, 150 or 300 ppm (equal to 0, 0.0032, 0.015, 4.7 and 7.7 mg/kg bw per day for males and 0, 0.0037, 0.020, 4.5 and 9.1 mg/kg bw per day for females, respectively), the NOAEL was 0.5 ppm (equal to 0.015 mg/kg bw per day), on the basis of inhibition of erythrocyte (males and females) and brain (females only) acetylcholinesterase activities at 150 ppm (equal to 4.5 mg/kg bw per day).
The overall NOAEL for the 90-day and 1-year toxicity studies in dogs was 0.3 mg/kg bw per day, based on inhibition of erythrocyte and brain acetylcholinesterase activities at 3 mg/kg bw per day.
In a pre-GLP carcinogenicity study in mice that was considered adequate to evaluate carcinogenicity but not chronic toxicity, diazinon was administered at a dietary concentration of 0, 100 or 200 ppm (equivalent to 0, 15 and 30 mg/kg bw per day, respectively) over 103 weeks. No treatment-related tumours were observed.
In another pre-GLP carcinogenicity study in mice, diazinon was administered at a dietary concentration of 0, 100, 200, 300 (males) or 400 (females) ppm (equal to 0, 16, 31 and 46 mg/kg bw per day for males and 0, 22, 43 and 86 mg/kg bw per day for females, respectively) for 104 weeks. Cholinesterase activity was not measured in this study. The NOAEL for chronic toxicity was 200 ppm (equal to 31 mg/kg bw per day), based on depression of body weight and lower feed consumption at 300 ppm (equal to 46 mg/kg bw per day). No treatment-related tumours were observed.
In a pre-GLP carcinogenicity study in rats that was considered adequate to evaluate carcinogenicity but not chronic toxicity, diazinon was administered at a dietary concentration of 0, 400 or 800 ppm (equivalent to 0, 20 and 40 mg/kg bw per day, respectively) over 103 weeks. No treatment-related tumours were observed.

10 Diazinon
10
In a chronic toxicity study, rats received diazinon in the diet at a concentration of 0 (untreated and vehicle controls), 0.1, 1.5, 125 or 250 ppm (equal to 0, 0.004, 0.06, 5 and 10 mg/kg bw per day for males and 0, 0.005, 0.07, 6 and 12 mg/kg bw per day for females, respectively) for 98/99 weeks. The NOAEL was 1.5 ppm (equal to 0.06 mg/kg bw per day), on the basis of inhibition of erythrocyte and brain acetylcholinesterase activities at 125 ppm (equal to 5 mg/kg bw per day). From the available data, there was no evidence of a tumorigenic response; however, the group size (N = 20) was too small to allow a conclusion to be reached on carcinogenicity.
In a combined chronic toxicity and carcinogenicity study in rats, diazinon was fed in the diet at concentrations adjusted to achieve target concentrations of 0, 0.025, 0.1, 1.5 and 22.5 mg/kg bw per day for 104 weeks. The NOAEL for long-term toxicity was 0.1 mg/kg bw per day, based on inhibition of erythrocyte acetylcholinesterase activity at 1.5 mg/kg bw per day. No treatment-related tumours were observed.
The overall NOAEL for chronic toxicity in rats was 0.1 mg/kg bw per day, based on inhibition of erythrocyte acetylcholinesterase activity at 1.5 mg/kg bw per day.
The Meeting concluded that diazinon is not carcinogenic in mice or rats.
Given the similarity of the sensitivities of mammalian species, an overall NOAEL in all studies of repeated-dose (neuro)toxicity in rats and dogs could be identified. The overall NOAEL was 0.3 mg/kg bw per day, on the basis of inhibition of acetylcholinesterase activity in erythrocytes at 1 mg/kg bw per day.
In studies submitted by the sponsors, diazinon was tested for genotoxicity in an adequate range of assays, both in vitro and in vivo. In addition, many studies with diazinon were described in the published literature, but most of these were considered by the Meeting as inappropriate to evaluate the genotoxicity of diazinon, as they had major deficiencies in study design or reliability (e.g. lack of statistical analysis, testing of mixtures of diazinon with other chemicals and similarity between negative and positive control values). Overall, these studies provided no convincing evidence of genotoxic effects.
The Meeting concluded that diazinon is unlikely to be genotoxic.
In the multigeneration and developmental toxicity studies, cholinesterase activity was not measured.
In a two-generation study on reproductive toxicity, rats received diazinon in the diet at a concentration of 0, 10, 100 or 500 ppm over the course of two generations (F0 and F1). Mean diazinon intakes for the F0 generation during the premating period were 0, 0.77, 7.48 and 32.85 mg/kg bw per day for males and 0, 0.77, 7.48 and 40.26 mg/kg bw per day for females, respectively. The NOAEL for reproductive effects was 100 ppm (equal to 7.48 mg/kg bw per day), based on prolonged gestation duration, decrease in the number of pregnancies, and reduced fertility and mating indices at 500 ppm (equal to 32.85 mg/kg bw per day). The NOAEL for parental effects was 10 ppm (equal to 0.77 mg/kg bw per day), based on reduced parental body weight gain at 100 ppm (equal to 7.48 mg/kg bw per day). The NOAEL for offspring toxicity was 10 ppm (equal to 0.77 mg/kg bw per day), based on reduced viability of pups and pup weights at 100 ppm (equal to 7.48 mg/kg bw per day).
In another two-generation study on reproductive toxicity, rats received diazinon in the diet at a concentration of 0, 0.1, 1.0 or 10 mg/kg (equivalent to 0, 0.0067, 0.067 and 0.67 mg/kg bw per day, assuming concentrations are in mg/kg feed or ppm) over the course of two generations (F0 and F1). A rationale for the dose selection was not provided. There were no treatment-related effects observed in F0 or F1 parental animals or pups. The NOAEL for reproductive, parental and offspring toxicity was 10 ppm (equivalent to 0.67 mg/kg bw per day), the highest dose tested.
In a range of studies on estrogenic and androgenic activities, no estrogenic, androgenic or anti-androgenic activity was observed at concentrations relevant to human exposure via the diet.

Diazinon 11
11
Overall NOAELs from the multigeneration studies in rats were identified. The overall NOAEL for reproductive effects was 100 ppm (equal to 7.48 mg/kg bw per day), based on effects at 500 ppm (equal to 32.85 mg/kg bw per day). The overall NOAEL for parental toxicity was 10 ppm (equal to 0.77 mg/kg bw per day), based on effects at 100 ppm (equal to 7.48 mg/kg bw per day). The overall NOAEL for offspring toxicity was 10 ppm (equal to 0.77 mg/kg bw per day), based on effects at 100 ppm (equal to 7.48 mg/kg bw per day).
In a study of developmental toxicity evaluated by the 1993 JMPR, rats were administered diazinon via gavage at a dose of 0, 15, 50 or 100 mg/kg bw per day. A marked decrease in maternal feed consumption correlating with weight loss at the beginning of the treatment period and a slightly higher incidence of incomplete ossification at different sites in the fetuses were observed at 100 mg/kg bw per day. As limited information was available from the previous JMPR monograph, the Meeting was unable to identify a NOAEL for this study.
In a study of developmental toxicity, rats were administered diazinon via gavage at a dose of 0, 10, 20 or 100 mg/kg bw per day. The NOAEL for maternal toxicity was 20 mg/kg bw per day, based on body weight loss on gestation days 6–10, reduced body weight/body weight gains throughout treatment and decreased feed consumption on gestation days 6–9 at 100 mg/kg bw per day. The NOAEL for embryo/fetal toxicity was 20 mg/kg bw per day, based on an increased incidence of rudimentary 14th ribs at 100 mg/kg bw per day.
In a study of developmental toxicity, rabbits were dosed with diazinon via gavage at 0, 7, 25 or 100 mg/kg bw per day. The NOAEL for maternal toxicity was 25 mg/kg bw per day, based on mortality, tremors, convulsions, hypoactivity, anorexia and reduced body weight gain observed at 100 mg/kg bw per day. The NOAEL for embryo/fetal toxicity was 100 mg/kg bw per day, the highest dose tested.
In another developmental toxicity study, diazinon was administered to pregnant rabbits by gavage at a dose level of 0, 2.5, 10 or 40 mg/kg bw per day. The NOAEL for maternal toxicity was 10 mg/kg bw per day, based on clinical signs, decreased body weight and reduced feed consumption. The NOAEL for embryo/fetal toxicity was 10 mg/kg bw per day, based on decreased fetal weight at 40 mg/kg bw per day.
The overall NOAEL for maternal toxicity in developmental toxicity studies in rabbits was 25 mg/kg bw per day, based on effects at 40 mg/kg bw per day, and the overall NOAEL for embryo/fetal toxicity was 10 mg/kg bw per day, based on effects at 40 mg/kg bw per day.
The Meeting concluded that diazinon is not teratogenic.
In a limited acute neurotoxicity study in which acetylcholinesterase activity was not measured, rats were dosed with diazinon at 0, 100, 300 or 500 mg/kg bw by gavage. The NOAEL was 100 mg/kg bw, based on systemic toxicity and clinical signs of neurotoxicity observed at 300 or 500 mg/kg bw. In another acute toxicity study, rats were administered a single dose of diazinon by gavage at 0, 2.5, 150, 300 or 600 mg/kg bw. The NOAEL was 2.5 mg/kg bw, on the basis of depressed erythrocyte acetylcholinesterase activity and behavioural changes at 150 mg/kg bw. In a third study, rats were administered a single dose of diazinon by gavage at 100, 250 or 500 mg/kg bw for males or 0, 0.05, 0.12, 0.25, 2.5, 25 or 250 mg/kg bw for females. The NOAEL was 2.5 mg/kg bw, on the basis of inhibition of brain and erythrocyte acetylcholinesterase activities in females at 25 mg/kg bw.
In a study that investigated the time course of acute inhibition of acetylcholinesterase activity, rats were given a single dose of diazinon by gavage at 0, 2.5, 150, 300 or 600 mg/kg bw, and brain and blood samples were collected at 3, 9 and 24 hours after dosing. The NOAEL was 2.5 mg/kg bw, based on inhibition of brain and erythrocyte acetylcholinesterase activities at 150 mg/kg bw. Inhibition was observed beginning at 3 hours post-dosing, with maximal inhibition at 9 hours post-dosing.

12 Diazinon
12
The overall NOAEL in all studies of acute toxicity was 2.5 mg/kg bw, on the basis of inhibition of acetylcholinesterase activity in erythrocytes and in the brain at 25 mg/kg bw in rats of both sexes.
Three studies were performed on delayed neurotoxicity in the hen. Oral doses of diazinon technical ranging from 10 to 100 mg/kg bw were administered to hens. Inhibition of cholinesterase activity was observed from 20 mg/kg bw, but there was no evidence that diazinon caused acute delayed neurotoxicity in the hen.
No specific studies on immunotoxicity were submitted. A study in the open literature with intraperitoneal injection of diazinon in mice was not informative. The submitted repeated-dose toxicity studies do not indicate an immunotoxic potential for diazinon after oral exposure.
Toxicological data on metabolites and/or degradates
No toxicological data were available on any metabolites of diazinon other than diazoxon, which is the active metabolite of diazinon. However, the Meeting concluded that none of the other metabolites would be of toxicological concern at the levels present in the diet.
Human data
In a study of acute toxicity in male volunteers given ascending doses of diazinon (seven volunteers per group given 0.03, 0.12, 0.20 or 0.21 mg/kg bw; one volunteer given 0.30 mg/kg bw), acetylcholinesterase activity was not inhibited in erythrocytes at 0.21 mg/kg bw, the second highest dose tested. The highest dose (0.30 mg/kg bw) was not informative, as it was tested in a single volunteer only. Plasma cholinesterase activity was inhibited by more than 20% at doses above 0.12 mg/kg bw.
Repeated-dose studies in four male volunteers given diazinon for 28–37 days showed that, although there was some inhibition of plasma cholinesterase activity at the highest tested dose of 0.03 mg/kg bw per day (actual administered doses varied slightly, i.e. 0.03, 0.027, 0.022/0.027 and 0.026 mg/kg bw per day), no inhibition of erythrocyte acetylcholinesterase activity was observed.
Diazinon was evaluated in four male volunteers who received diazinon in capsules at 0.025 mg/kg bw per day for 37–43 days. There were no consistent treatment-related effects on erythrocyte acetylcholinesterase activity, blood chemistry or urine analysis. No clinical effects were reported. The NOAEL was 0.025 mg/kg bw per day, the only dose tested.
The overall NOAEL from repeated-dose studies in humans was 0.03 mg/kg bw per day.
Several epidemiological studies on cancer outcomes following occupational exposure to diazinon were available. The review of these studies focused on the occurrence of three cancer types: NHL, leukaemia and lung cancer (see section 2.2). One prospective cohort study was available, the Agricultural Health Study (AHS), with a large sample size and detailed exposure assessment. Cohort studies are considered a powerful design, as recall bias is avoided. All other studies were case–control studies, usually retrospective, which are more prone to recall and selection biases.
There was no significant evidence of a positive association of NHL with diazinon exposure and no evidence of an exposure–response relationship in the AHS. In a large pooled case–control study, the unadjusted estimates showed a significant elevated risk of NHL (relative risk [RR] = 1.7; 95% confidence interval [CI] = 1.2–2.5) associated with ever versus never use of diazinon. However, these risks were attenuated and/or no longer significant when proxy respondents were excluded and analyses were mutually adjusted for other pesticides (malathion, fonofos). Although increasing risk across exposure duration categories was observed, which was suggestive of a duration–response pattern, confidence intervals were non-significant, wide and overlapping between categories. Two other studies reported elevated risks of NHL for ever versus never use of diazinon or high versus low

Diazinon 13
13
diazinon use, but confidence intervals were wide, reflecting uncertainty in the risk estimates, and chance could not be excluded as an explanation for the findings. Overall, there was no convincing evidence of a positive association between NHL and exposure to diazinon.
A significantly increased risk of leukaemia in the highest exposure category (> 38.8 lifetime days of diazinon exposure; RR = 3.36; 95% CI = 1.08–10.49) and a significant exposure–response relationship were observed in the AHS. Findings for intensity-weighted lifetime exposure days demonstrated a similar pattern, but did not reach significance. Two other studies reported non-significantly elevated risks of leukaemia for high versus low diazinon use and ever versus never use of diazinon, with a non-significant dose–response relationship observed using days of use per year. Overall, there is weak evidence of a positive association between leukaemia and exposure to diazinon from the AHS only. It is noted that the number of diazinon-exposed cases was low or not reported in all three available studies.
A significant 60% excess risk of lung cancer in the highest exposure category (> 38.8 lifetime days of diazinon exposure) and a significant trend across exposure categories were observed in the AHS. Findings for intensity-weighted lifetime exposure days demonstrated a similar pattern, but did not reach significance. A separate analysis of ever use of diazinon versus never use from the AHS found no evidence of elevated risk of lung cancer among spouses of farmers/pesticide applicators; however, there were only 15 exposed cases. One other study reported a non-significant elevated risk of lung cancer for ever versus never use of diazinon (based on 17 exposed cases). Overall, there is weak evidence of a positive association between lung cancer and exposure to diazinon from the AHS cohort study only.
In view of the lack of genotoxicity and the absence of carcinogenicity in mice and rats and considering the available epidemiological data from occupational exposure, the Meeting concluded that diazinon is unlikely to pose a carcinogenic risk to humans via exposure from the diet.
The Meeting concluded that the existing database on diazinon was adequate to characterize the potential hazards to the general population, including fetuses, infants and children.
Toxicological evaluation
The Meeting identified inhibition of acetylcholinesterase activity as the most sensitive end-point after single or repeated doses of diazinon in all species. After considering all previously evaluated data and the new studies, the Meeting established an ADI of 0–0.003 mg/kg bw, based on the overall NOAEL of 0.3 mg/kg bw per day from all repeated-dose toxicity studies, and using a safety factor of 100. This ADI was supported by the NOAEL of 0.03 mg/kg bw per day, the highest dose tested, identified in repeated-dose studies that involved a limited number of male volunteers, with application of a safety factor of 10.
In 2006, the Meeting established an ADI of 0–0.005 mg/kg bw, based on the highest NOAEL of 0.5 mg/kg bw per day for inhibition of erythrocyte acetylcholinesterase activity at 1 mg/kg bw per day in a 92-day repeated-dose toxicity study in rats and using a safety factor of 100. In this study, the dietary concentrations of diazinon were converted to units of milligrams per kilogram body weight per day using a default conversion factor; the present Meeting considers this less reliable than the conversion using feed consumption data.
The Meeting reaffirmed the ARfD of 0.03 mg/kg bw established by the 2006 JMPR. This ARfD was based on the NOAEL of 2.5 mg/kg bw identified in studies of acute (neuro)toxicity in rats, and using a safety factor of 100. This ARfD was supported by the NOAEL of 0.21 mg/kg bw, the highest dose tested, identified in the study in which a limited number of male volunteers were given a single dose of diazinon, with application of a safety factor of 10.

14 Diazinon
14
A toxicological monograph was prepared.
Levels relevant to risk assessment of diazinon
Species Study Effect NOAEL LOAEL
Mouse Two-year study of carcinogenicitya,b
Toxicity 200 ppm, equal to 31 mg/kg bw per day
300 ppm, equal to 46 mg/kg bw per day
Carcinogenicity 300 ppm, equal to 46 mg/kg bw per dayc
–
Rat Acute (neuro)toxicity studiesd,e (acetylcholin-esterase inhibition)
Toxicity
2.5 mg/kg bw 25 mg/kg bw
Four-week or 3-month studies of (neuro)toxicitya,e
Toxicity
5 ppm, equal to 0.3 mg/kg bw per dayf
10 ppm, equivalent to 1 mg/kg bw per day
Two-year studies of toxicity and carcinogenicitya,e
Toxicity 0.1 mg/kg bw per dayf 1.5 mg/kg bw per day
Carcinogenicity 800 ppm, equivalent to 40 mg/kg bw per dayc
–
Two-generation studies of reproductive toxicitya,b,e
Reproductive toxicity
100 ppm, equal to 7.48 mg/kg bw per day
500 ppm, equal to 32.85 mg/kg bw per day
Parental toxicity 10 ppm, equal to 0.77 mg/kg bw per day
100 ppm, equal to 7.48 mg/kg bw per day
Offspring toxicity 10 ppm, equal to 0.77 mg/kg bw per day
100 ppm, equal to 7.48 mg/kg bw per day
Developmental toxicity studyb,d
Maternal toxicity 20 mg/kg bw per day 100 mg/kg bw per day
Embryo and fetal toxicity
20 mg/kg bw per day 100 mg/kg bw per day
Rabbit Developmental toxicity studiesb,d,e
Maternal toxicity 25 mg/kg bw per day 40 mg/kg bw per day
Embryo and fetal toxicity
10 mg/kg bw per day 40 mg/kg bw per day
Dog Ninety-day and 1-year studies of toxicitya,e
Toxicity 0.3 mg/kg bw per dayf 3 mg/kg bw per day
Rat, dog Repeat-dose (neuro)toxicity studiese
Toxicity 5 ppm, equal to 0.3 mg/kg bw per day
10 ppm, equivalent to 1 mg/kg bw per day
Human Acute toxicity studyd Toxicity 0.21 mg/kg bwc –
Four/five-week studies of toxicityd,e
Toxicity 0.03 mg/kg bw per dayc –
a Dietary administration. b Acetylcholinesterase activity not measured. c Highest dose tested. d Gavage administration. e Two or more studies combined. f Included in the overall NOAEL for rats and dogs.

Diazinon 15
15
Estimate of acceptable daily intake (ADI)
0–0.003 mg/kg bw
Estimate of acute reference dose (ARfD)
0.03 mg/kg bw
Information that would be useful for the continued evaluation of the compound
Results from epidemiological, occupational health and other such observational studies of human exposure
Critical end-points for setting guidance values for exposure to diazinon
Absorption, distribution, excretion and metabolism in mammals
Rate and extent of oral absorption Nearly complete and rapid (~90% at 10 mg/kg bw within 24 h)
Dermal absorption No data
Distribution Widely distributed at low concentrations
Potential for accumulation No potential for accumulation
Rate and extent of excretion Predominantly in urine (86–93% at 10 mg/kg bw within 24 h)
Metabolism in animals Rapidly degraded to diazoxon and subsequently mainly via oxidase/hydrolase-mediated cleavage of the ester bond, and further oxidation at the isopropyl substituent to yield hydroxy pyrimidinols
Toxicologically significant compounds in animals and plants
Parent compound and diazoxon
Acute toxicity
Rat, LD50, oral 300 to > 2 150 mg/kg bw
Rat, LD50, dermal > 2 000 mg/kg bw
Rat, LC50, inhalation 3.1 mg/L
Rabbit, dermal irritation Mildly irritating
Rabbit, ocular irritation Mildly irritating
Guinea-pig, dermal sensitization Sensitizing (Magnusson and Kligman maximization test)
Repeat-dose studies of (neuro)toxicity
Target/critical effect Acetylcholinesterase inhibition
Overall oral NOAEL 0.3 mg/kg bw per day (rat, dog)
Lowest relevant dermal NOAEL 3 mg/kg bw per day (21 days; rat)
Lowest relevant inhalation NOAEC 0.46 mg/m3 (21 days; rat)
Long-term studies of carcinogenicity
Carcinogenicity Not carcinogenic in mice or ratsa
Genotoxicity
No evidence of genotoxicity by the oral routea

16 Diazinon
16
Reproductive toxicity
Target/critical effect Mortality, reduced parental body weight gain, reduced viability of pups and pup weights, prolonged gestation duration, decrease in number of pregnancies, and reduced fertility and mating indices
Lowest relevant parental NOAEL 0.77 mg/kg bw per day (rat)
Lowest relevant offspring NOAEL 0.77 mg/kg bw per day (rat)
Lowest relevant reproductive NOAEL 7.48 mg/kg bw per day (rat)
Developmental toxicity
Target/critical effect Clinical signs, reduced maternal body weight and feed consumption, and reduced fetal weight
Lowest relevant maternal NOAEL 25 mg/kg bw per day (rabbit)
Lowest relevant embryo/fetal NOAEL 10 mg/kg bw per day (rabbit)
Neurotoxicityb
Acute neurotoxicity NOAEL 2.5 mg/kg bw (acetylcholinesterase inhibition; rat)
Developmental neurotoxicity NOAEL No data
Acute delayed neurotoxicity No evidence (hens)
Human data Acetylcholinesterase inhibition:
Acute toxicity NOAEL: 0.21 mg/kg bw, highest dose tested
Subchronic toxicity NOAEL: 0.03 mg/kg bw per day, highest dose tested (4/5 weeks)
a Unlikely to pose a carcinogenic risk to humans via exposure from the diet. b Ninety-day neurotoxicity study in rats is covered by the overall NOAEL for repeated-dose studies of
(neuro)toxicity.
Summary
Value Study Safety factor
ADI 0–0.003 mg/kg bw Repeated-dose toxicity studies (rat, dog) 100
ARfD 0.03 mg/kg bw Acute (neuro)toxicity studies (rat) 100
DIETARY RISK ASSESSMENT
Long-term dietary exposure
The ADI for diazinon is 0–0.003 mg/kg bw. The international estimated daily intakes (IEDIs) for diazinon were estimated for the 17 Global Environment Monitoring System – Food Contamination Monitoring and Assessment Programme (GEMS/Food) cluster diets using the supervised trials median residue (STMR) or STMR in a processed commodity (STMR-P) values estimated by the 1996 (animal commodities), 1999 (pome fruit, cabbage head) and 2006 (cranberries) JMPRs. An STMR value for tomato was estimated using the data reported in the 1993 JMPR evaluation monograph. For all other commodities, the maximum residue limits (MRLs) were used, as STMR values were not available. The results are shown in Annex 3. The IEDI ranged from 3% to 50% of the

Diazinon 17
17
maximum ADI. The Meeting concluded that the long-term dietary exposure to residues of diazinon from uses that have been considered by JMPR is unlikely to present a public health concern.
Short-term dietary exposure
The ARfD for diazinon is 0.03 mg/kg bw. The international estimate of short-term dietary intake (IESTI) was calculated. The calculation employed highest residue (HR) values where these could be identified in the relevant JMPR reports; otherwise, the MRL was used. In the case of meat, the Meeting noted that residues in fat are approximately 15 times higher than those in muscle and used the MRL value of 2 mg/kg for fat and 0.1333 mg/kg for muscle. The results are shown in Annex 4. The IESTI represented a maximum of 100% of the ARfD for both children and the general population. The Meeting concluded that the short-term dietary exposure to diazinon residues from uses considered by JMPR was unlikely to present a public health concern.


Glyphosate 19
19
3.2 GLYPHOSATE (158)
TOXICOLOGY
Glyphosate is the ISO-approved common name for N-(phosphonomethyl)glycine (IUPAC), with CAS number 1071-83-6. It is a broad-spectrum systemic herbicide.
Glyphosate was previously evaluated by JMPR for toxicology in 1986, 1997 (evaluation of the metabolite aminomethylphosphonic acid, or AMPA), 2004 and 2011 (evaluation of new plant metabolites in genetically modified maize and soya beans).
Glyphosate was last re-evaluated for toxicology within the periodic review programme of CCPR in 2004. The compound was reviewed by the present Meeting following the recommendation of an electronic task force of the WHO Core Assessment Group on Pesticide Residues that it be re-evaluated due to public health concerns identified by IARC and the availability of a significant number of new studies.
The current Meeting evaluated all previously considered toxicological data in addition to new published or unpublished toxicological studies and published epidemiological studies on cancer outcomes. The evaluation of the biochemical aspects and systemic toxicity of glyphosate was based on previous JMPR evaluations, updated as necessary with additional information. The particular focus of the current meeting was on genotoxicity, carcinogenicity, reproductive and developmental toxicity and epidemiological studies on cancer outcomes. The scope was restricted to the active ingredient.
All critical unpublished studies contained statements of compliance with GLP, unless otherwise specified. The studies on human volunteers were conducted in accordance with the principles expressed in the Declaration of Helsinki or equivalent ethical standards.
Biochemical aspects
In studies with radiolabelled glyphosate in rats, glyphosate was rapidly absorbed from the gastrointestinal tract following oral intake, but only to a limited extent (about 20–30%). Elimination was fast and virtually complete within 72–168 hours, with the majority being excreted during the first 48 hours. Most of the excretion occurred in faeces, largely as unabsorbed dose, and in the urine. Biliary excretion of glyphosate was negligible. Less than 1% of the administered dose was retained in tissues 168 hours post-administration. Highest residues were detected in bone, followed by kidney and liver. This pattern of absorption, distribution and elimination was independent of dose, treatment regimen and sex of the test animals. Peak plasma concentrations of radiolabel were observed at 6 and 2 hours after administration in male and female rats, respectively. The estimated half-life for whole-body elimination of the radiolabel was about 5.9–8.3 hours.
There was very little biotransformation of glyphosate; the only metabolite, AMPA, accounted for 0.2–0.7% of the administered dose in excreta; the rest was unchanged glyphosate.
Toxicological data
Glyphosate has low acute oral toxicity in mice (LD50 > 2000 to > 10 000 mg/kg bw; no lethality at 2000 mg/kg bw) and rats (LD50 5600 mg/kg bw), low acute dermal toxicity in rats (LD50 > 2000 mg/kg bw) and rabbits (LD50 > 5000 mg/kg bw), and low acute inhalation toxicity in rats (LC50 > 5.48 mg/L). Glyphosate was not irritating to the skin of rabbits. Glyphosate produced moderate to severe eye irritation in rabbits, with irreversible corneal opacity in one study as a consequence of the low pH of the test material in solution. Glyphosate was not sensitizing in guinea-pigs or mice as determined by the Magnusson and Kligman maximization test, the Buehler test and the local lymph node assay.

20 Glyphosate
20
In short-term studies of toxicity in different species, the most notable effects were clinical signs related to gastrointestinal irritation, decreased body weight, salivary gland changes (hypertrophy and increase in basophilia of cytoplasm of acinar cells), histological findings in the caecum and hepatotoxicity.
In short-term studies in mice, reduced body weight was seen at a dietary concentration of 50 000 ppm (equal to 9710 mg/kg bw per day). The NOAEL for decreased body weight was 10 000 ppm (equal to 1221 mg/kg bw per day). Effects on the salivary glands were observed in mice in only one study out of four at 6250 ppm (equal to 1065 mg/kg bw per day). The NOAEL for the salivary gland effects in mice was 3125 ppm (equal to 507 mg/kg bw per day). The overall NOAEL in short-term studies in mice was 3125 ppm (equal to 507 mg/kg bw per day), and the overall LOAEL was 6250 ppm (equal to 1065 mg/kg bw per day).
In 90-day toxicity studies in rats, common findings included soft faeces, diarrhoea, reduced body weight gain and decreased food utilization at dietary concentrations of 20 000 ppm (equal to 1262.1 mg/kg bw per day) and above. The lowest NOAEL was 371.9 mg/kg bw per day. A decrease in urine pH was frequently noted owing to the acidic nature of the compound and excretion as glyphosate in the urine. In two 90-day dietary toxicity studies, an increase in caecum weight (at 10 000 ppm, equal to 569 mg/kg bw per day) and histological findings in the caecum (at 50 000 ppm, equal to 3706 mg/kg bw per day) were observed. In rats, effects on the salivary gland were seen in two out of seven 90-day studies starting at 12 500 ppm (equal to 811 mg/kg bw per day). The NOAELs for effects on the salivary gland were 300 and 410 mg/kg bw per day. The overall NOAEL in short-term studies in rats was 300 mg/kg bw per day, and the overall LOAEL was 10 000 ppm (equal to 569 mg/kg bw per day).
In four 90-day toxicity studies in dogs, the most notable effects were loose stools, decreased body weight and reduced feed consumption. In one study, there were no treatment-related effects at doses up to 40 000 ppm (equal to 1015 mg/kg bw per day). The lowest NOAEL and LOAEL were 300 mg/kg bw per day and 1000 mg/kg bw per day, respectively.
Seven 1-year toxicity studies in dogs are available. In one study, changes in faeces were observed at 100 mg/kg bw per day and above. The NOAEL was 30 mg/kg bw per day. However, these results were not reproduced in four other studies with administration via capsules at 300 or 500 mg/kg bw per day. In the remaining six studies, the NOAELs ranged from 8000 ppm (equal to 182 mg/kg bw per day) to 500 mg/kg bw per day, and the LOAELs ranged from 30 000 ppm (equal to 926 mg/kg bw per day) to 1000 mg/kg bw per day.
The overall NOAEL in the 90-day and 1-year toxicity studies in dogs was 15 000 ppm (equal to 448 mg/kg bw per day), and the overall LOAEL was 30 000 ppm (equal to 926 mg/kg bw per day).
The Meeting compiled the tumour incidence data for all relevant mouse and rat studies in order to undertake statistical analysis and investigate any potential pattern of occurrence across studies. In addition, incidences of tumours of lymphatic tissues were summarized, as these were identified as possible targets of relevance from the review of epidemiological cancer studies. However, the Meeting recognized that the relationship between tumours of lymphatic tissues in rodents and humans has not been clearly established.
Nine carcinogenicity studies in mice were available. Two studies were considered to be of insufficient quality to be included in the assessment. Effects such as loose stools, reduced body weights and decreased feed consumption were noted in most of the studies. The overall NOAEL for systemic toxicity in mice was 1600 ppm (equal to 153 mg/kg bw per day), and the overall LOAEL was 8000 ppm (equal to 787 mg/kg bw per day).
The Meeting concluded that there is equivocal evidence of induction of lymphomas in male mice in three out of seven studies and in female mice in one out of seven studies at high doses (5000–40 000 ppm, equal to 814–4348 mg/kg bw per day). The Meeting also noted that in the other three studies in which even higher doses (up to 50 000 ppm, equal to 7470 mg/kg bw per day) had been used, no effect was observed.

Glyphosate 21
21
The Meeting concluded that there is some indication, by a trend test, and not by pairwise comparison, of induction of kidney adenomas in male mice in four out of seven studies. The Meeting noted that the increases were marginal and occurred at the highest dose only and that other studies that used appreciably higher doses did not find any excess. However, the Meeting noted that kidney adenomas are uncommon in male mice.
Eleven combined chronic toxicity and carcinogenicity studies in rats were available. One study was considered to be inadequate for carcinogenicity assessment due to its exposure duration (12 months). Toxicities variously reported in some of these studies included increased incidences of clinical signs, reduced body weights, degenerative lens changes (cataracts) in males, microscopic findings in the salivary gland, increased incidence of basophilia of parotid acinar cells, and microscopic findings in liver, prostate and kidneys. The overall NOAEL for systemic toxicity in rats was 100 mg/kg bw per day, and the overall LOAEL was 300 mg/kg bw per day.
The Meeting discussed the increased incidence of a variety of tumours observed in one or, in one case, two of the 10 studies in rats. The Meeting concluded that these findings were incidental, based on the following considerations:
interstitial cell tumours of the testes: occurred in only one study; and other studies that used appreciably higher doses did not find any excess;
pancreatic islet cell adenoma: occurred in only one study in males only; other studies that used appreciably higher doses did not find any excess; there was no dose–response relationship; and the incidence in controls was unusually low (less than the lower bound of the historical control data); the Meeting also noted that there was a negative dose–response relationship in females;
thyroid C-cell tumours: occurred in only one study; other studies that used appreciably higher doses did not find any excess; and these tumours are considered not to be relevant for humans;
skin keratoma: occurred in two studies in males only; other studies that used appreciably higher doses did not find any excess; in one study, there was no dose–response relationship; and in the other study, only the test for trend was statistically significant, not the pairwise test at any dose;
lymphoma (in spleen and kidney): no evidence of induction in any of the studies.
The Meeting concluded that there is no reliable evidence for treatment-related tumours in rats at doses up to 32 000 ppm (equal to 1750 mg/kg bw per day).
The Meeting concluded that glyphosate is not carcinogenic in rats but could not exclude the possibility that it is carcinogenic in mice at very high doses.
Glyphosate and its formulation products have been extensively tested for genotoxic effects using a variety of tests in a wide range of organisms. While no mutational effects have been detected in bacterial test systems, DNA damage and chromosomal effects have commonly been seen in cell culture models and in organisms that are phylogenetically distant from humans. However, these effects have not been seen in vivo in orally treated mammalian models. The overall weight of evidence indicates that administration of glyphosate and its formulation products at doses as high as 2000 mg/kg bw by the oral route, the route most relevant to human dietary exposure, was not associated with genotoxic effects in an overwhelming majority of studies conducted in mammals, a model considered to be appropriate for assessing genotoxic risks to humans.
The Meeting concluded that glyphosate is unlikely to be genotoxic at anticipated dietary exposures.
Seven reproductive toxicity studies in rats were available. No evidence of reproductive toxicity was observed at doses up to 30 000 ppm (equal to 1983 mg/kg bw per day). In one study, an
22 Glyphosate
22
increased incidence of histopathological findings in the parotid (males) and submaxillary salivary glands in females was observed in both generations at 10 000 ppm (equal to 668 mg/kg bw per day). The NOAEL was 3000 ppm (equal to 197 mg/kg bw per day). In a separate study, an increased incidence of loose stools and caecum distension was observed in both generations at 30 000 ppm (equal to 2150 mg/kg bw per day), and the NOAEL was 6000 ppm (equal to 417 mg/kg bw per day). Slight reductions in pup weight or weight gain were observed in most studies, but were confined to very high, parentally toxic dose levels. In addition, a significant delay in sexual maturation in male pups (F1) was seen at 15 000 ppm (equal to 1063 mg/kg bw per day). The overall NOAEL for parental toxicity was 6000 ppm (equal to 417 mg/kg bw per day), and the overall LOAEL was 10 000 ppm (equal to 668 mg/kg bw per day). The overall NOAEL for offspring toxicity was 6000 ppm (equal to 417 mg/kg bw per day), and the overall LOAEL was 10 000 ppm (equal to 985 mg/kg bw per day).
No evidence of teratogenicity was observed in four developmental toxicity studies in rats at doses up to 3500 mg/kg bw per day. There was some variation in the extent of toxicity observed in the four studies. The lowest NOAEL for maternal toxicity was 300 mg/kg bw per day, based on loose stools and reduced body weights seen at 1000 mg/kg bw per day. The lowest NOAEL for embryo and fetal toxicity was 300 mg/kg bw per day, based on delayed ossification and an increased incidence of fetuses with skeletal anomalies observed at 1000 mg/kg bw per day.
Seven developmental toxicity studies in the rabbit were available. Maternal toxicity was primarily manifested as an increased incidence of soft stools and diarrhoea at doses of 175 mg/kg bw per day and above. The overall NOAEL for maternal toxicity was 100 mg/kg bw per day. In three studies, the occurrences of a variety of low-incidence fetal effects (e.g. cardiac malformation, absent kidney) were slightly increased at higher dose levels. These increases are considered secondary to maternal toxicity. The overall NOAEL for embryo and fetal toxicity was 250 mg/kg bw per day, based on effects at 450 mg/kg bw per day. The Meeting considered that these effects were secondary to local irritation from unabsorbed glyphosate in the colon administered by gavage dosing and concluded that they were not relevant for establishing health-based guidance values.
The Meeting concluded that glyphosate is not teratogenic.
Glyphosate was tested in a range of validated in vivo and in vitro assays for its potential to interact with the endocrine system. The studies that the Meeting considered adequate for the evaluation clearly demonstrate that there is no interaction with estrogen or androgen receptor pathways or thyroid pathways.
There was no evidence of neurotoxicity in an acute neurotoxicity study in rats at doses up to 2000 mg/kg bw. The NOAEL for systemic toxicity was 1000 mg/kg bw, based on a single death and general signs of toxicity at 2000 mg/kg bw. In a 90-day neurotoxicity study in rats, no evidence of neurotoxicity or systemic toxicity was seen at doses up to 20 000 ppm (equal to 1546.5 mg/kg bw per day).
No evidence of immunotoxicity was seen in a 28-day dietary study in female mice at doses up to 5000 ppm (equal to 1448 mg/kg bw per day).
Effects on the salivary glands were observed in several repeated-dose toxicity studies in rats. The pH of glyphosate in solution is low, and it has been shown that exposure to organic acids can cause such changes in salivary glands. Therefore, the changes are likely secondary to the effects caused by the pH of the test compound in solution.
In many of the long-term repeated-dose studies reviewed, glyphosate was reported to have an impact on the gastrointestinal tract at high doses. Although this is not uncommon with high-dose chemical substance administration, this was investigated further, as glyphosate is known to be poorly absorbed in mammalian models, and alterations in gut microbiota profiles, specifically reductions in the beneficial microbiota and increases in pathogenic bacteria, are known to have impacts on carcinogenesis. There is evidence from livestock species that pathogenic bacteria are more resistant to glyphosate, whereas beneficial microbiota are more sensitive, and thus more vulnerable.

Glyphosate 23
23
This is an emerging area of scientific investigation. The extent to which glyphosate adversely affects the normal functioning of the microbiota in the human gastrointestinal tract or the gastrointestinal tract of mammalian models is unclear. However, it is unlikely, given the available information on minimum inhibitory concentration (MIC) values, that this would occur from glyphosate residues in the diet.
Toxicological data on metabolites and/or degradates
AMPA is the only identified metabolite found in the urine and faeces of orally treated rats. AMPA was of low acute oral and dermal toxicity in rats (LD50 > 5000 and > 2000 mg/kg bw, respectively) and was not sensitizing in guinea-pigs, as determined by the Magnusson and Kligman maximization test. In a 90-day study of toxicity in rats, the NOAEL was 1000 mg/kg bw per day, the highest dose tested. AMPA administered orally in mammalian test systems showed no evidence of genotoxicity. Largely negative results were seen in studies in vitro. The Meeting concluded that AMPA is unlikely to be genotoxic in vivo by the oral route. In a study of developmental toxicity in rats, no evidence for embryo or fetal toxicity was observed; the NOAEL for maternal and embryo/fetal toxicity was 1000 mg/kg bw per day, the highest dose tested.
Following single gavage administration of radiolabelled N-acetyl-glyphosate, a plant-specific metabolite, at 15 mg/kg bw in rats, about 66.1% of the administered dose was excreted in urine (61.3% within 12 hours post-dosing), 26.4% in faeces (25.8% within 48 hours post-dosing), 2.79% in cage wash and wipe, and 0.23% in residual carcass. Radioactivity was eliminated rapidly from blood and plasma, with half-life values of 20.1 and 15.6 hours, respectively. Unchanged [14C]N-acetyl-glyphosate recovered in urine and faeces represented over 99% of the administered radioactivity. Glyphosate, a metabolite of N-acetyl-glyphosate, was detected in faeces and represented less than 1% of the total radioactivity.
The acute oral toxicity LD50 of N-acetyl-glyphosate in rats is greater than 5000 mg/kg bw, expressed as the free acid. In a 90-day toxicity study in rats, the NOAEL was 18 000 ppm (equal to 1157 mg/kg bw per day).
N-Acetyl-glyphosate was tested for genotoxicity in vitro and in vivo in an adequate range of assays; it was not found to be genotoxic in mammalian or microbial test systems.
The Meeting concluded that N-acetyl-glyphosate is unlikely to be genotoxic.
N-Acetyl-AMPA, another plant-specific metabolite, was of low acute oral toxicity; the LD50 was greater than 5000 mg/kg bw in rats.
N-Acetyl-AMPA was tested for genotoxicity in vitro and in vivo in an adequate range of assays; it was not found to be genotoxic in mammalian or microbial test systems.
The Meeting concluded that N-acetyl-AMPA is unlikely to be genotoxic.
Human data
Routine medical surveillance of workers in production and formulation plants revealed no adverse health effects attributable to glyphosate. In operators applying glyphosate products, cases of eye, skin and/or respiratory tract irritation have been reported. Acute intoxication was reported in humans after accidental or intentional ingestion of concentrated glyphosate formulations, resulting in gastrointestinal, cardiovascular, pulmonary and renal effects and, occasionally, death. The acute toxicity of glyphosate formulations was likely caused by the surfactant in these products.
Several epidemiological studies on cancer outcomes following occupational exposure to glyphosate were available. The evaluation of these studies focused on the occurrence of NHL, as outlined in section 2.2. One meta-analysis and one prospective cohort study, the AHS, with a large sample size and detailed exposure assessment, were available. Cohort studies are considered a
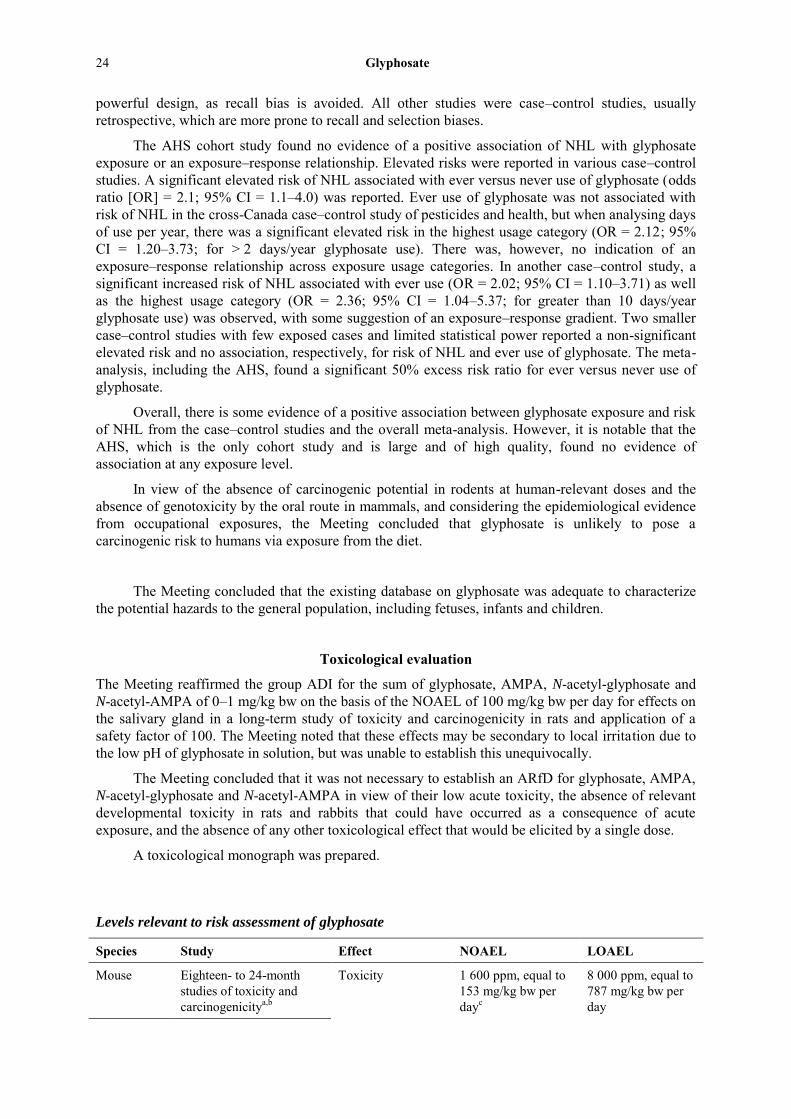
24 Glyphosate
24
powerful design, as recall bias is avoided. All other studies were case–control studies, usually retrospective, which are more prone to recall and selection biases.
The AHS cohort study found no evidence of a positive association of NHL with glyphosate exposure or an exposure–response relationship. Elevated risks were reported in various case–control studies. A significant elevated risk of NHL associated with ever versus never use of glyphosate (odds ratio [OR] = 2.1; 95% CI = 1.1–4.0) was reported. Ever use of glyphosate was not associated with risk of NHL in the cross-Canada case–control study of pesticides and health, but when analysing days of use per year, there was a significant elevated risk in the highest usage category (OR = 2.12; 95% CI = 1.20–3.73; for > 2 days/year glyphosate use). There was, however, no indication of an exposure–response relationship across exposure usage categories. In another case–control study, a significant increased risk of NHL associated with ever use (OR = 2.02; 95% CI = 1.10–3.71) as well as the highest usage category (OR = 2.36; 95% CI = 1.04–5.37; for greater than 10 days/year glyphosate use) was observed, with some suggestion of an exposure–response gradient. Two smaller case–control studies with few exposed cases and limited statistical power reported a non-significant elevated risk and no association, respectively, for risk of NHL and ever use of glyphosate. The meta-analysis, including the AHS, found a significant 50% excess risk ratio for ever versus never use of glyphosate.
Overall, there is some evidence of a positive association between glyphosate exposure and risk of NHL from the case–control studies and the overall meta-analysis. However, it is notable that the AHS, which is the only cohort study and is large and of high quality, found no evidence of association at any exposure level.
In view of the absence of carcinogenic potential in rodents at human-relevant doses and the absence of genotoxicity by the oral route in mammals, and considering the epidemiological evidence from occupational exposures, the Meeting concluded that glyphosate is unlikely to pose a carcinogenic risk to humans via exposure from the diet.
The Meeting concluded that the existing database on glyphosate was adequate to characterize the potential hazards to the general population, including fetuses, infants and children.
Toxicological evaluation
The Meeting reaffirmed the group ADI for the sum of glyphosate, AMPA, N-acetyl-glyphosate and N-acetyl-AMPA of 0–1 mg/kg bw on the basis of the NOAEL of 100 mg/kg bw per day for effects on the salivary gland in a long-term study of toxicity and carcinogenicity in rats and application of a safety factor of 100. The Meeting noted that these effects may be secondary to local irritation due to the low pH of glyphosate in solution, but was unable to establish this unequivocally.
The Meeting concluded that it was not necessary to establish an ARfD for glyphosate, AMPA, N-acetyl-glyphosate and N-acetyl-AMPA in view of their low acute toxicity, the absence of relevant developmental toxicity in rats and rabbits that could have occurred as a consequence of acute exposure, and the absence of any other toxicological effect that would be elicited by a single dose.
A toxicological monograph was prepared.
Levels relevant to risk assessment of glyphosate
Species Study Effect NOAEL LOAEL
Mouse Eighteen- to 24-month studies of toxicity and carcinogenicitya,b
Toxicity 1 600 ppm, equal to 153 mg/kg bw per dayc
8 000 ppm, equal to 787 mg/kg bw per day

Glyphosate 25
25
Species Study Effect NOAEL LOAEL
Carcinogenicity The Meeting could not exclude the possibility that glyphosate is carcinogenic in mice at very high doses.
Rat Acute neurotoxicity studya Neurotoxicity 2 000 mg/kg bwc –
Two-year studies of toxicity and carcinogenicityb
Toxicity 100 mg/kg bw per day
300 mg/kg bw per day
Carcinogenicity 32 000 ppm, equal to 1 750 mg/kg bw per dayc
–
Two-generation studies of reproductive toxicitya,b
Reproductive toxicity
30 000 ppm, equal to 1 983 mg/kg bw per dayc
–
Parental toxicity 6 000 ppm, equal to 417 mg/kg bw per day
10 000 ppm, equal to 668 mg/kg bw per day
Offspring toxicity 6 000 ppm, equal to 417 mg/kg bw per day
10 000 ppm, equal to 985 mg/kg bw per day
Developmental toxicity studiesb,d
Maternal toxicity 300 mg/kg bw per day
1 000 mg/kg bw per day
Embryo and fetal toxicity
300 mg/kg bw per day
1 000 mg/kg bw per day
Rabbit Developmental toxicity studiesb,d
Maternal toxicitye 100 mg/kg bw per day
175 mg/kg bw per day
Embryo and fetal toxicitye
250 mg/kg bw per day
450 mg/kg bw per day
Dog Thirteen-week and 1-year studies of toxicityb,f
Toxicity 15 000 ppm, equal to 448 mg/kg bw per day
30 000 ppm, equal to 926 mg/kg bw per day
AMPA
Rat Thirteen-week study of toxicityd
Toxicity 1 000 mg/kg bw per dayc
–
Developmental toxicity studyd
Maternal toxicity 1 000 mg/kg bw per dayc
–
Embryo and fetal toxicity
1 000 mg/kg bw per dayc
–
a Dietary administration. b Two or more studies combined. c Highest dose tested. d Gavage administration. e Secondary to local irritation of the colon. f Capsule administration. Estimate of acceptable daily intake (ADI)
0–1 mg/kg bw (for sum of glyphosate, N-acetyl-glyphosate, AMPA and N-acetyl-AMPA)
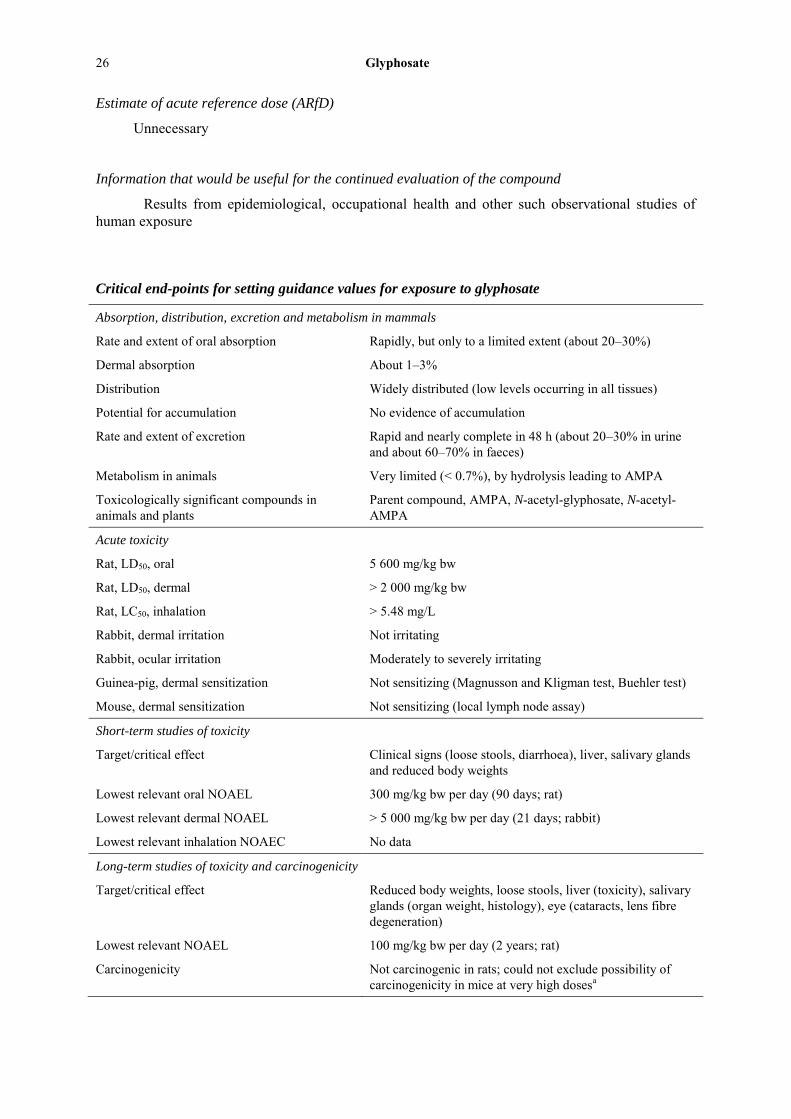
26 Glyphosate
26
Estimate of acute reference dose (ARfD)
Unnecessary
Information that would be useful for the continued evaluation of the compound
Results from epidemiological, occupational health and other such observational studies of human exposure
Critical end-points for setting guidance values for exposure to glyphosate
Absorption, distribution, excretion and metabolism in mammals
Rate and extent of oral absorption Rapidly, but only to a limited extent (about 20–30%)
Dermal absorption About 1–3%
Distribution Widely distributed (low levels occurring in all tissues)
Potential for accumulation No evidence of accumulation
Rate and extent of excretion Rapid and nearly complete in 48 h (about 20–30% in urine and about 60–70% in faeces)
Metabolism in animals Very limited (< 0.7%), by hydrolysis leading to AMPA
Toxicologically significant compounds in animals and plants
Parent compound, AMPA, N-acetyl-glyphosate, N-acetyl-AMPA
Acute toxicity
Rat, LD50, oral 5 600 mg/kg bw
Rat, LD50, dermal > 2 000 mg/kg bw
Rat, LC50, inhalation > 5.48 mg/L
Rabbit, dermal irritation Not irritating
Rabbit, ocular irritation Moderately to severely irritating
Guinea-pig, dermal sensitization Not sensitizing (Magnusson and Kligman test, Buehler test)
Mouse, dermal sensitization Not sensitizing (local lymph node assay)
Short-term studies of toxicity
Target/critical effect Clinical signs (loose stools, diarrhoea), liver, salivary glands and reduced body weights
Lowest relevant oral NOAEL 300 mg/kg bw per day (90 days; rat)
Lowest relevant dermal NOAEL > 5 000 mg/kg bw per day (21 days; rabbit)
Lowest relevant inhalation NOAEC No data
Long-term studies of toxicity and carcinogenicity
Target/critical effect Reduced body weights, loose stools, liver (toxicity), salivary glands (organ weight, histology), eye (cataracts, lens fibre degeneration)
Lowest relevant NOAEL 100 mg/kg bw per day (2 years; rat)
Carcinogenicity Not carcinogenic in rats; could not exclude possibility of carcinogenicity in mice at very high dosesa

Glyphosate 27
27
Genotoxicity
No genotoxic potential via oral route in mammalsa
Reproductive toxicity
Target/critical effect Reduced body weights and delayed development (absence of maternal toxicity)
Lowest relevant parental NOAEL 417 mg/kg bw per day (rat)
Lowest relevant offspring NOAEL 417 mg/kg bw per day (rat)
Lowest relevant reproductive NOAEL 1 983 mg/kg bw per day (rat)
Developmental toxicity
Target/critical effect Slight increase in malformations at maternally toxic doses
Lowest relevant maternal NOAEL 100 mg/kg bw per day (rabbit)b
Lowest relevant embryo/fetal NOAEL 250 mg/kg bw per day (rabbit)b
Neurotoxicity
Acute neurotoxicity NOAEL 2 000 mg/kg bw, highest dose tested
Subchronic neurotoxicity NOAEL 1 547 mg/kg bw per day, highest dose tested
Developmental neurotoxicity NOAEL No data
Other toxicological studies
Immunotoxicity No immunotoxicity; NOAEL 1 448 mg/kg bw per day, highest dose tested (28 days; mouse)
Studies on toxicologically relevant metabolites Toxicological studies on AMPA, N-acetyl-glyphosate and N-acetyl-AMPA reveal the metabolites to be less toxic than the parent compound
Human data
Medical surveillance of workers in plants producing and formulating glyphosate did not reveal any adverse health effects. In operators applying glyphosate products, cases of eye, skin and/or respiratory irritation have been reported. Cases of acute intoxication have been observed after accidental or intentional ingestion of glyphosate formulation.
a Unlikely to pose a carcinogenic risk to humans via exposure from the diet. b Secondary to local irritation of the colon.
Summary
Value Study Safety factor
ADI 0–1 mg/kg bw Two-year studies of toxicity (rat) 100
ARfD Unnecessary – –
DIETARY RISK ASSESSMENT
Long-term dietary exposure
The ADI for glyphosate is 0–1 mg/kg bw. The IEDIs for glyphosate were estimated for the 17 GEMS/Food cluster diets using the STMR or STMR-P values estimated by JMPR. The results are

28 Glyphosate
28
shown in Annex 3. The IEDI ranged from 0% to 1% of the maximum ADI. The Meeting concluded that the long-term dietary exposure to residues of glyphosate from uses that have been considered by JMPR is unlikely to present a public health concern.
Short-term dietary exposure
The Meeting concluded that it was unnecessary to establish an ARfD for glyphosate, and therefore an IESTI for glyphosate was not calculated. The Meeting therefore concluded that short-term dietary exposure to glyphosate residues is unlikely to present a risk to consumers.

Malathion 29
29
3.3 MALATHION (49)
TOXICOLOGY
Malathion is the ISO-approved common name for S-1,2-bis(ethoxycarbonyl)ethyl O,O-dimethyl phosphorothioate (IUPAC), with the CAS number 121-75-5.
Malathion is a non-systemic organophosphorus insecticide whose mode of pesticidal action is the inhibition of cholinesterase activity. It is used to control insects on agricultural crops and stored commodities and for vector control.
The toxicity of malathion was evaluated by JMPR in 1963, 1965, 1966, 1997 and 2003. Malathion was listed in the periodic review programme of CCPR but was not yet scheduled for review. The compound was reviewed by the present Meeting following the recommendation of an electronic task force of the WHO Core Assessment Group on Pesticide Residues that it be re-evaluated due to public health concerns identified by IARC and the availability of a significant number of new studies.
The current Meeting evaluated all previously submitted toxicological data in addition to new published and unpublished toxicological studies and published epidemiological studies on cancer outcomes. All critical unpublished studies contained certificates of compliance with GLP, unless otherwise specified. Human volunteer studies were conducted according to the Declaration of Helsinki or equivalent ethical standards.
Biochemical aspects
In a study conducted in rats using [14C]malathion, gastrointestinal absorption was at least 77% in males and 86% in females. The majority (up to 90%) of radioactivity was excreted in urine within 24 hours. Less than 1% of radioactivity was detected in tissues, with the highest proportions in the liver, skin, fat and gastrointestinal tract. There was no evidence that malathion or its metabolites accumulated in any tissue.
Malathion is extensively metabolized via desulfuration, oxidation, hydrolysis, dealkylation and demethylation reactions. In particular, the oxidative desulfuration of malathion in the liver generates malaoxon, which is a more potent inhibitor of acetylcholinesterase compared with malathion. The major metabolites detected in rat urine (> 80% of urinary radioactivity) were α- and β-monocarboxylic acids (MMCA) and the dicarboxylic acid (MDCA) of malathion. Other urinary metabolites include desmethyl malathion, O,O-dimethyl phosphorothioic acid, fumaric acid, 2-mercaptosuccinic acid, O,O-dimethyl phosphorodithioic acid, monoethyl fumarate and malaoxon. Malaoxon was observed only in urine samples and accounted for less than 2% of total urinary radioactivity. Similar metabolites were detected in human studies.
Published in vitro studies have further investigated the metabolism of malathion. In human liver microsomes, the metabolism of malathion to malaoxon was catalysed by CYP1A2, CYP2B6 or CYP3A4, their respective contributions depending on the concentration of malathion. Isomalathion, a storage impurity, was a potent non-competitive inhibitor of hepatic carboxylesterase activity, important for the formation of MMCA by human liver microsomes.
Estimates of in vitro dermal absorption through human skin ranged from 1.44% to 8.74% and from 8% to 20.7%. In a volunteer study, dermal absorption was 4.48% following a single application and 3.53% following a second application.
Toxicological data
Consistent with other organophosphorus insecticides, the most sensitive toxicological effect following acute and repeated exposures to malathion is the inhibition of acetylcholinesterase activity in erythrocytes and brain. At higher doses, cholinergic signs become evident.

30 Malathion
30
In rats, the oral LD50 ranged from 1539 to 8227 mg/kg bw, the dermal LD50 was greater than 2000 mg/kg bw and the inhalation LC50 was greater than 5.2 mg/L. The dermal LD50 in rabbits was 8790 mg/kg bw. Malathion was slightly irritating to rabbit skin and eyes. In a Buehler test conducted in guinea-pigs, malathion did not cause skin sensitization, whereas malathion caused skin sensitization in the guinea-pig maximization test. Malathion was not sensitizing in the mouse local lymph node assay.
In a 14-day range-finding study conducted in juvenile rats, which tested gavage malathion doses of 0, 250, 450 and 600 mg/kg bw per day, salivation occurred at 450 and 600 mg/kg bw per day. In males, erythrocyte and brain acetylcholinesterase activities were reduced at every dose, whereas in females, erythrocyte and brain acetylcholinesterase activities were reduced at 450 and 600 mg/kg bw per day.
In a 28-day repeated-dose toxicity study in rats, which tested dietary malathion concentrations of 0, 100, 500, 5000 and 10 000 ppm (equal to 0, 9.2, 46.1, 457.5 and 947.8 mg/kg bw per day for males and 0, 9.4, 47.4, 461.3 and 910.1 mg/kg bw per day for females, respectively), the NOAEL was 500 ppm (equal to 46.1 mg/kg bw per day) for the inhibition of erythrocyte and brain acetylcholinesterase activities at 5000 ppm (equal to 457.5 mg/kg bw per day). Nasal toxicity, consisting of goblet cell depletion and hyperplasia of the olfactory epithelium, was noted at the highest dose.
In a 30-day repeated-dose toxicity study in rats, which tested dietary malathion concentrations of 0, 50, 100, 500, 10 000 and 20 000 ppm (equal to 0, 5.1, 10.4, 51.9, 1036 and 2008 mg/kg bw per day for males and 0, 5.7, 11.6, 57.6, 1134 and 2193 mg/kg bw per day for females, respectively), the NOAEL was 500 ppm (equal to 51.9 mg/kg bw per day) for the inhibition of brain acetylcholinesterase activity at 10 000 ppm (equal to 1036 mg/kg bw per day).
The overall NOAEL from these two 1-month repeated-dose toxicity studies in rats was 500 ppm (equal to 51.9 mg/kg bw per day), with an overall LOAEL of 5000 ppm (equal to 457.5 mg/kg bw per day).
In a 90-day repeated-dose toxicity study in rats, which tested dietary malathion concentrations of 0, 100, 500, 5000, 10 000 and 20 000 ppm (equal to 0, 7, 34, 340, 680 and 1390 mg/kg bw per day for males and 0, 8, 39, 384, 784 and 1597 mg/kg bw per day for females, respectively), the NOAEL was 500 ppm (equal to 34 mg/kg bw per day) for the inhibition of brain acetylcholinesterase activity at 5000 ppm (equal to 340 mg/kg bw per day).
In a second 90-day repeated-dose toxicity study in rats, which tested dietary malathion concentrations of 0, 100, 500, 5000 and 10 000 ppm (equal to 0, 7.2, 35.0, 353.6 and 733.8 mg/kg bw per day for males and 0, 7.5, 35.9, 363.1 and 719.0 mg/kg bw per day for females, respectively), the NOAEL was 100 ppm (equal to 7.2 mg/kg bw per day) for goblet cell depletion at 500 ppm (equal to 35.0 mg/kg bw per day). This is considered to be an atypical result, as the effect is likely to have arisen through non-dietary exposure.
In a 13-week neurotoxicity study in rats, which tested dietary malathion concentrations of 0, 50, 5000 and 20 000 ppm (equal to 0, 4, 352 and 1486 mg/kg bw per day for males and 0, 4, 395 and 1575 mg/kg bw per day for females, respectively), the NOAEL was 50 ppm (equal to 4 mg/kg bw per day), based on the inhibition of erythrocyte acetylcholinesterase activity at 5000 ppm (equal to 352 mg/kg bw per day).
The overall NOAEL for the 90-day (neuro)toxicity studies in rats was 500 ppm (equal to 34 mg/kg bw per day) for effects at 5000 ppm (equal to 340 mg/kg bw per day).
In a 28-day range-finding study in dogs in which malathion was administered orally in capsules at doses of 0, 125, 250 and 500 mg/kg bw per day, inhibition of erythrocyte acetylcholinesterase occurred at 250 and 500 mg/kg bw per day, with deaths, cholinergic signs and reduced body weight and feed consumption occurring at the highest dose.

Malathion 31
31
In a 12-month repeated-dose toxicity study in dogs in which malathion was administered orally in capsules at doses of 0, 62.5, 125 and 250 mg/kg bw per day, the NOAEL was 125 mg/kg bw per day for reduced body weight and haematological changes at 250 mg/kg bw per day. Inhibition of erythrocyte acetylcholinesterase activity occurred at every dose but was of marginal toxicological significance in the absence of brain acetylcholinesterase inhibition.
In a 3-week repeated-dose dermal toxicity study in rabbits, which tested malathion doses of 0, 50, 300 and 1000 mg/kg bw per day, the NOAEL was 300 mg/kg bw per day for the inhibition of brain acetylcholinesterase activity at 1000 mg/kg bw per day.
In a 21-day repeated-dose dermal toxicity study in rabbits, which tested malathion doses of 0, 75, 100, 150 and 500 mg/kg bw per day, the NOAEL was 150 mg/kg bw per day for the inhibition of brain acetylcholinesterase activity at 500 mg/kg bw per day.
In a 13-week repeated-dose inhalational toxicity study in which rats were exposed whole body to an aerosol malathion concentration of 0, 0.1, 0.45 or 2.0 mg/L, a no-observed-adverse-effect concentration (NOAEC) was not determined, as laryngeal hyperplasia and degeneration and/or hyperplasia of the olfactory epithelium occurred at every concentration.
In an 18-month pre-GLP study conducted in mice, which tested dietary malathion concentrations of 0, 8000 and 16 000 ppm (equivalent to 0, 1200 and 2400 mg/kg bw per day, respectively), a NOAEL for chronic toxicity was not identified, because clinical signs during the second year of exposure and reduced body weight occurred at both doses. Although no treatment-related tumours were observed, this study was considered unreliable for assessing carcinogenicity because of the small number of concurrent control mice (n = 10) compared with the treated groups (n = 50).
In a second 18-month study conducted in mice, which tested dietary malathion concentrations of 0, 100, 800, 8000 and 16 000 ppm (equal to 0, 17, 143, 1476 and 2978 mg/kg bw per day for males and 0, 21, 167, 1707 and 3448 mg/kg bw per day for females, respectively), the NOAEL for chronic toxicity was 800 ppm (equal to 143 mg/kg bw per day) for the inhibition of brain acetylcholinesterase activity at 8000 ppm (equal to 1476 mg/kg bw per day). Increases in liver carcinomas in males at the low dose and second highest dose were not considered treatment related because of the lack of a dose–response relationship, the lack of corroboration in females and the fact that liver carcinomas are a common age-related tumour in this strain of mouse (B6C3F1). The NOAEL for carcinogenicity was 800 ppm (equal to 143 mg/kg bw per day) for an increased incidence of liver adenomas at 8000 ppm (equal to 1476 mg/kg bw per day).
In an 80-week pre-GLP study conducted in rats, which tested dietary malathion concentrations of 0, 4700 and 8150 ppm (equivalent to 0, 1200 and 2400 mg/kg bw per day, respectively), it was not possible to identify a NOAEL for chronic toxicity because of the lack of reporting detail. While there was an increase in proliferative lesions of the thyroid in both sexes at both doses, these increases were not statistically significant in males and were significant in females only in a trend test and not by pairwise comparison when compared with groups of pooled controls. Overall, this study is not considered acceptable for the assessment of carcinogenicity because of the small number of rats in the concurrent control group (15 versus 50 in the treated groups) and the short duration of exposure.
In a subsequent 24-month pre-GLP study conducted in rats, which tested dietary malathion concentrations of 0, 100, 1000 and 5000 ppm (equivalent to 0, 5, 50 and 250 mg/kg bw per day, respectively, as calculated by a previous Meeting), the NOAEL was 100 ppm (equivalent to 5 mg/kg bw per day) for the inhibition of erythrocyte acetylcholinesterase activity at 1000 ppm (equivalent to 50 mg/kg bw per day). The NOAEL for carcinogenicity was 5000 ppm (equivalent to 250 mg/kg bw per day), the highest dose tested.
In a 24-month chronic toxicity and carcinogenicity study in rats, which tested dietary malathion concentrations of 0, 100, 500, 6000 and 12 000 ppm (equal to 0, 7, 29, 359 and 729 mg/kg bw per day for males and 0, 8, 35, 415 and 868 mg/kg bw per day for females, respectively), the NOAEL for

32 Malathion
32
chronic toxicity was 500 ppm (equal to 29 mg/kg bw per day) for reduced red cell parameters, inhibition of brain acetylcholinesterase activity and the occurrence of nasal toxicity at 6000 ppm (equal to 359 mg/kg bw per day). The nasal toxicity was characterized by olfactory epithelial degeneration, hyperplasia and cyst formation, goblet cell hyperplasia, congestion, oedema and inflammation. Four nasal adenomas were observed, one in each sex at the two highest doses. In females, but not males, the incidence of liver adenomas was increased slightly at 6000 and 12 000 ppm, but the incidences were within the performing laboratory’s historical control range. A NOAEL of 500 ppm (equal to 29 mg/kg bw per day) was identified for carcinogenicity, based on the increase in nasal adenomas at 6000 ppm (equal to 359 mg/kg bw per day).
The Meeting concluded that there is some evidence that malathion is carcinogenic in rats and mice.
The Meeting noted that the mouse liver adenomas observed in the second 18-month study occurred at doses exceeding the maximum tolerated dose and were not replicated in other mouse studies. The increases in liver adenomas in rats observed in the 24-month chronic toxicity and carcinogenicity study occurred only in females and were within the performing laboratory’s historical control range. Whereas the rodent liver adenomas were co-incident with liver hypertrophy, there were no findings in these or other studies to suggest a possible mode of action, such as liver enzyme induction or cytotoxicity. Malathion showed no peroxisome proliferator–activated receptor alpha or gamma activity and also showed no aryl hydrocarbon receptor activity. Overall, the Meeting considered that there was equivocal evidence to suggest a tumorigenic response in the liver, but this had a clear threshold and was likely to be secondary to the effects on the liver of prolonged exposure to very high dietary concentrations of malathion.
Based on consistent observations of nasal toxicity in dietary studies of various durations ranging from 28 days to 2 years and in a short-term inhalational toxicity study, the Meeting concluded that the formation of nasal adenomas in rats was due to a local mechanism of irritancy and cytotoxicity caused by prolonged exposure of the nasal epithelium to high concentrations of malathion absorbed via inhaled food particles or as a vapour arising from food. This produces a state of reactive hyperplasia, a causative factor in tumour formation. Scenarios of prolonged, direct and excessive exposure of human nasal tissue to malathion or malathion metabolites following ingestion of residues is unlikely, and therefore these tumours would not occur in humans following exposure to malathion in the diet.
Malathion has been extensively tested for genotoxicity using a broad range of in vitro and in vivo assays. In 1997, the Meeting evaluated the available unpublished and published genotoxicity studies and noted that the majority of studies indicated that malathion is not genotoxic, although a small number of studies indicated that it can induce chromosomal aberrations and sister chromatid exchanges in vitro. However, there was no evidence that malathion induced chromosomal aberrations in vivo. Therefore, the 1997 Meeting concluded that malathion does not induce genotoxic damage in vivo. The 2003 Meeting evaluated supplementary genotoxicity studies and found that malathion caused chromosomal aberrations in cultured human lymphocytes and gene mutations in the mouse lymphoma assay at cytotoxic concentrations, but did not cause unscheduled DNA synthesis in vivo in male rats. The 2003 Meeting reaffirmed its previous conclusion that although the results of some in vitro tests were positive, malathion was not considered to induce genotoxic damage in vivo.
In addition to the studies considered at previous meetings, the current Meeting considered a number of new published and unpublished genotoxicity studies, including studies that involved the assessment of genotoxic damage in exposed workers. Many of the published studies do not provide adequate experimental detail, do not specify the purity of the malathion tested or were conducted on commercial formulations, or used in vivo test systems or exposure routes less relevant to the risk assessment of dietary residues of pesticides. The following discussion is limited to studies that evaluated technical malathion or malathion at purities above 90% and provided adequate experimental and data analysis details to allow interpretation of the findings.

Malathion 33
33
Using standard genotoxicity test systems, malathion was not mutagenic in assays using prokaryotes or lower eukaryotes when tested with or without metabolic activation. In contrast, in in vitro assays using either human or non-human cells, malathion was generally positive for the induction of (1) chromosomal damage, as measured by increased frequencies of chromosomal aberrations or micronuclei; (2) mutations; and (3) DNA damage, as measured by increases in DNA migration in the alkaline comet assay and increased frequencies of sister chromatid exchanges. Negative findings were reported for the induction of micronuclei in Molt-4 T-lymphocytes, unscheduled DNA synthesis in WI-38 cells and primary rat liver hepatocytes, and mutations in a mouse lymphoma assay (reported to be equivocal without metabolic activation and negative with metabolic activation).
Using in vivo non-mammalian systems, malathion was active for micronucleus induction in a bird model and for induction of reciprocal translocations and sex-linked recessive lethals in one Drosophila melanogaster study, but not for sex-linked recessive lethals, sex chromosome loss or wing spot mutations in another study.
Based on the criteria mentioned in section 2.1, very few of the 34 in vivo mammalian study/end-point combinations were considered adequate for this review. In reports submitted by the sponsor, malathion was negative in a rat liver unscheduled DNA synthesis study when administered by gavage, in a rat bone marrow chromosomal aberration study when administered by gavage and in a mouse bone marrow erythrocyte micronucleus assay when administered intraperitoneally. However, the unscheduled DNA synthesis assay is insensitive for detecting genotoxic compounds; the micronucleus assay, as conducted, suffers from concerns about scoring criteria; and the chromosomal aberration test appears to be significantly underpowered, based on the frequency of chromosomal aberrations detected among control and treated animals. A negative mouse dominant lethal test was also reported when malathion was administered in feed for 7 weeks, and a negative mouse bone marrow chromosomal aberration study was reported in intraperitoneally treated mice. In contrast, malathion-induced micronuclei and chromosomal aberrations were reported in bone marrow immature erythrocytes and proliferating cells, respectively. A positive alkaline comet assay using blood leukocytes sampled from rats treated intraperitoneally once a day for 5 days was reported.
The Meeting evaluated a number of human studies that examined genotoxicity end-points. Patients treated for acute intoxication with a malathion-based product exhibited increased levels of chromosomal damage in lymphocytes. The frequency of micronuclei and glycophorin A mutations in erythrocytes or micronuclei in lymphocytes was not increased in workers exposed selectively to malathion. However, DNA damage and chromosomal aberrations have been reported in workers exposed to a mixture of pesticides, including malathion. These studies are of limited value for examining the specific effect of malathion on genotoxicity end-points in humans.
The Meeting noted that malathion has been reported to have genotoxic activity in multiple assay systems at multiple genetic end-points. In several studies where evaluated, reactive oxygen species appear to have been responsible for the increased damage, as demonstrated by the detection of malathion-induced 8-hydroxy-2′-deoxyguanosine and increased malondialdehyde concentrations in isolated human peripheral blood mononuclear cells treated in vitro, an effect attenuated by co-treatment with N-acetylcysteine or curcumin; by increased intracellular levels of reactive oxygen species and reduced levels of catalase, superoxide dismutase and glutathione in rat PC12 cells treated in vitro, an effect ameliorated by co-treatment with vitamin E; and by the detection of oxidative damage using the comet assay in isolated rat lymphocytes treated in vitro with malathion. Supportive of this hypothesis, malathion appears to selectively induce markers of oxidative stress in Tox21/ToxCast high-throughput screening assays. The Meeting concluded that the observed genotoxic effects occur secondary to the formation of reactive oxygen species, which will exhibit a threshold.
The Meeting concluded that malathion is unlikely to be genotoxic at anticipated dietary exposures.

34 Malathion
34
In the multigeneration and developmental toxicity studies, cholinesterase activity was not measured.
In a two-generation reproductive toxicity study conducted in rats, which tested dietary malathion concentrations of 0, 550, 1700, 5000 and 7500 ppm (equal to 0, 43, 130, 393 and 595 mg/kg bw per day for males and 0, 50, 152, 438 and 655 mg/kg bw per day for females, respectively), the NOAEL for both reproductive toxicity and parental toxicity was 7500 ppm (equal to 595 mg/kg bw per day), the highest dose tested. The NOAEL for offspring toxicity was 1700 ppm (equal to 130 mg/kg bw per day) for reduced pup weights at 5000 ppm (equal to 393 mg/kg bw per day).
Two published studies reported potential testicular toxicity in rats exposed to malathion orally, but these studies had a number of methodological limitations that reduced their utility. Further, the reported observations are not corroborated by the preceding GLP-compliant multigenerational rat study in which no effects on the testes were observed.
A variety of in vivo and in vitro assays in mammalian and non-mammalian models indicated that malathion is unlikely to affect the endocrine system.
In a pilot developmental toxicity study in rats, which tested gavage malathion doses of 0, 300, 600, 800 and 1000 mg/kg bw per day from days 6 to 15 of gestation, no embryo or fetal toxicity occurred, whereas maternal toxicity occurred at and above 600 mg/kg bw per day. In the main developmental toxicity study in rats, which tested gavage doses of 0, 200, 400 and 800 mg/kg bw per day from days 6 to 15 of gestation, the NOAEL for maternal toxicity was 400 mg/kg bw per day for clinical signs and reduced body weight gain and feed consumption at 800 mg/kg bw per day. The NOAEL for embryo and fetal toxicity was 800 mg/kg bw per day, the highest dose tested.
In a range-finding developmental toxicity study in rabbits, which tested gavage malathion doses of 0, 25, 50, 100, 200 and 400 mg/kg bw per day from days 6 to 18 of gestation, no embryo or fetal toxicity occurred, whereas maternal toxicity occurred at 200 and 400 mg/kg bw per day. In the main study, which tested malathion doses of 0, 25, 50 and 100 mg/kg bw per day from days 6 to 18 of gestation, the NOAEL for maternal toxicity was 25 mg/kg bw per day for a marginal effect on body weight gain at 50 mg/kg bw per day. The NOAEL for embryo and fetal toxicity was 100 mg/kg bw per day, the highest dose tested.
The Meeting concluded that malathion is not teratogenic.
In a study conducted in hens, there was no evidence that malathion caused delayed peripheral neuropathy.
In an acute neurotoxicity study in rats, which tested gavage malathion doses of 0, 500, 1000 and 2000 mg/kg bw, the NOAEL was 1000 mg/kg bw for reduced erythrocyte acetylcholinesterase activity in females and reduced ambulatory activity in males at 2000 mg/kg bw.
A 13-week neurotoxicity study in rats is described above together with the other 13-week toxicity studies in rats, and an overall NOAEL is identified for these studies.
In a developmental neurotoxicity study in rats, which tested gavage malathion doses of 0, 5, 50 and 150 mg/kg bw per day from day 6 of gestation to day 10 of lactation, the NOAEL for both maternal toxicity and offspring toxicity was 50 mg/kg bw per day for clinical signs at 150 mg/kg bw per day.
Administration of malathion from day 6 of gestation to day 21 of lactation had no effect on the thickness of the corpus callosum in rat pups at doses up to 150 mg/kg bw per day.
The Meeting concluded that malathion is neurotoxic.
Studies in rats have examined the time to peak effect and compared the effects of malathion and malaoxon on the inhibition of acetylcholinesterase activity. The time to peak effect in juvenile rats following dosing with malathion ranged from 30 to 90 minutes for the inhibition of erythrocyte acetylcholinesterase activity and from 60 to 90 minutes for the inhibition of brain

Malathion 35
35
acetylcholinesterase activity. Malaoxon was a more potent inhibitor of acetylcholinesterase activity compared with malathion. Comparison of benchmark doses (BMDs) following acute oral dosing indicated that the toxicity adjustment factor (TAF) for malaoxon was 21.5 in males and 17.4 in females for the inhibition of erythrocyte acetylcholinesterase activity and 14.8 in males and 11.0 in females for the inhibition of brain acetylcholinesterase activity. Comparison of BMDs for the inhibition of erythrocyte acetylcholinesterase activity from chronic toxicity studies indicated that TAFs for malaoxon ranged from 37 to 38 in males and from 65 to 69 in females.
In a 6-week immunotoxicity study in female rats, which tested dietary malathion concentrations of 0, 50, 100, 700 and 7000 ppm (equal to 0, 8.9, 17.6, 126.8 and 1215.8 mg/kg bw per day, respectively), the NOAEL for immunotoxicity was 7000 ppm (equal to 1215.8 mg/kg bw per day), the highest dose tested.
The Meeting concluded that malathion is not immunotoxic.
An extensive literature search did not identify any potential adverse effects on intestinal microbiota or any evidence that intestinal microbiota can metabolize malathion.
Toxicological data on metabolites, degradates and/or impurities
Current FAO specifications for malathion prescribe maximum limits for isomalathion (CAS No. 3344-12-5), malaoxon (CAS No. 152-20-05), O,O,S-trimethyl phosphorothioate (CAS No. 2953-29-9) and O,S,S-trimethyl phosphorodithoate (CAS No. 152-18-1).
Toxicity tests were conducted on malaoxon, isomalathion, desmethyl malathion, desmethyl malathion monocarboxylic acid, MMCA, MDCA and desmethyl malaoxon dicarboxylic acid.
Malaoxon
The oral LD50 in rats for malaoxon was 50 mg/kg bw.
In a 14-day range-finding study in rats, which tested malaoxon at dietary concentrations of 0, 10, 25, 100, 2500 and 3500 ppm (equal to 0, 1.1, 3.0, 12.1, 293 and 387 mg/kg bw per day for males and 0, 1.1, 3.1, 12.5, 281.6 and 294.7 mg/kg bw per day for females, respectively), inhibition of erythrocyte acetylcholinesterase activity occurred at and above 100 ppm (equal to 12.1 mg/kg bw per day). At the two highest doses, inhibition of brain acetylcholinesterase activity and reduced body weight gain and feed consumption occurred.
In a 103-week carcinogenicity study conducted in mice, which tested dietary malaoxon concentrations of 0, 500 and 1000 ppm (estimated by a previous Meeting to be equal to 0, 75 and 150 mg/kg bw per day, respectively), survival and body weight were reduced at the highest dose. There were no treatment-related neoplastic or non-neoplastic lesions. In a parallel study conducted in rats, which tested the same dietary concentrations of malathion (equal to 0, 25 and 50 mg/kg bw per day, respectively), the combined incidence of C-cell adenomas and carcinomas of the thyroid in females was increased, although this was comparable to historical control values. The incidence of gastric ulcers, commonly observed in the forestomach, was increased in treated rats.
In a 24-month toxicity study in rats, which tested malaoxon at dietary concentrations of 0, 20, 1000 and 2000 ppm (equal to 0, 1, 57 and 110 mg/kg bw per day for males and 0, 1, 68 and 140 mg/kg bw per day for females, respectively), the NOAEL for chronic toxicity was 20 ppm (equal to 1 mg/kg bw per day), based on mortality and the inhibition of brain acetylcholinesterase activity at 1000 ppm (equal to 57 mg/kg bw per day). The NOAEL for carcinogenicity was 2000 ppm (equal to 110 mg/kg bw per day), the highest dose tested. Similar to studies conducted on malathion, inflammatory changes in the nasal mucosa occurred at 1000 and 2000 ppm; these changes were likely attributable to inhaled food particles containing malaoxon, resulting in tissue injury and inflammation of the nasal cavity, with secondary effects on the lungs and middle ear.

36 Malathion
36
The Meeting concluded that malaoxon is not carcinogenic in mice or rats.
Malaoxon was negative for mutagenicity in bacterial assays and in lower eukaryotes, both with and without metabolic activation. Malaoxon was reported to be active for induction of sister chromatid exchanges but not chromosomal aberrations in Chinese hamster ovary cells, with or without metabolic activation. An increase in sister chromatid exchanges when tested in the absence of metabolic activation only was also reported; it was also reported that malaoxon was more potent than malathion in this assay. Malaoxon was also reported to induce DNA damage as measured by the comet assay in rat adrenal gland PC12 cells when tested in the absence of metabolic activation only and was mutagenic in mouse lymphoma (L5178Y) cells in the absence but not the presence of metabolic activation. In this study, there seemed to be a preference for the induction of small colonies, generally considered to be indicative of chromosomal damage rather than gene mutations.
Malaoxon induced DNA damage in isolated lymphocytes in the absence of metabolic activation, as measured by the alkaline comet assay; studies with metabolic activation were not conducted. Further, a follow-up study concluded that the malaoxon-mediated damage was likely induced by reactive oxygen species. Also, malaoxon is more potent than malathion in inducing intracellular levels of reactive oxygen species and reducing levels of catalase, superoxide dismutase and glutathione in rat PC12 cells treated in vitro, an effect ameliorated by co-treatment with vitamin E. Also, similar to malathion, malaoxon appears to selectively induce markers of oxidative stress in Tox21/ToxCast high-throughput screening assays. When provided in food, malaoxon induced an increase in reciprocal translocations and sex-linked recessive lethals in D. melanogaster, but not for sex-linked recessive lethals when administered by injection. Malaoxon was reported negative for the induction of chromosomal aberrations and sister chromatid exchanges in the bone marrow cells of male mice following a single intraperitoneal injection.
The Meeting concluded that the observed genotoxic effects occur secondary to the formation of reactive oxygen species, which will exhibit a threshold.
The Meeting concluded that malaoxon is unlikely to be genotoxic at anticipated dietary exposures.
Other metabolites
The oral LD50 in rats was greater than 2000 mg/kg bw for desmethyl malathion, desmethyl malathion monocarboxylic acid, MMCA, MDCA and desmethyl malaoxon dicarboxylic acid. The oral LD50 in rats for desmethyl malaoxon dicarboxylic acid, trisodium salt, was greater than 2000 mg/kg bw.
There are a limited number of genotoxicity studies on other metabolites of malathion. MDCA, MMCA, desmethyl malathion monocarboxylic acid, potassium salt, and desmethyl malaoxon dicarboxylic acid, trisodium salt, as well as isomalathion, O,O,O-trimethyl phosphorothioate, O,O,S-trimethyl phosphorothioate and O,S,S-trimethyl phosphorodithioate, were reported negative for bacterial mutagenicity, with and without metabolic activation. Isomalathion induced DNA damage in isolated lymphocytes in the absence of metabolic activation, as measured by the alkaline comet assay; studies with metabolic activation were not conducted. Isomalathion was also reported to induce micronuclei in the human liver–derived HepaRG cell line.
Using quantitative structure–activity relationships, the storage impurity, 2-mercaptosuccinic acid diethyl ester, was determined to have no greater toxicity than malathion.
The potential of malathion metabolites to inhibit acetylcholinesterase activity has been studied in rats. Comparisons of erythrocyte acetylcholinesterase activities indicated that desmethyl malathion, MMCA and MDCA are at least 2.75-, 1.9- and 4.6-fold less potent than malathion.
Based on a comparison of the inhibitions of acetylcholinesterase activities over acute and chronic exposure durations and a comparison of BMDs (see above), the Meeting concluded that malaoxon is approximately 30-fold more potent than malathion.

Malathion 37
37
Human data
As in laboratory animals, the inhibition of acetylcholinesterase activity is the most sensitive adverse effect in humans exposed to malathion, mediated through the metabolite malaoxon, which is a more potent inhibitor of acetylcholinesterase activity compared with malathion. A comparative in vitro study indicated that malaoxon was a slightly less potent inhibitor (< 2-fold) of human compared with rat acetylcholinesterase activity.
In a study conducted in male and female volunteers, which tested single oral doses of malathion at 0, 0.5, 1.5, 5, 10 and 15 mg/kg bw, the NOAEL was 15 mg/kg bw, the highest dose tested, based on the absence of any adverse effects, including the inhibition of erythrocyte acetylcholinesterase activity. In a subsequent study conducted in male and female volunteers, which tested single oral doses of malathion of 0, 0.5, 1.5, 5.0, 10.0 and 15.0 mg/kg bw, there were no treatment-related adverse events or effects on erythrocyte acetylcholinesterase activity.
In a published study, application of malathion to the forearm of human volunteers increased blood flow, mediated via the inhibition of acetylcholinesterase activity.
In a published non-blinded study, slight inhibition of erythrocyte acetylcholinesterase activity occurred in children following two applications of a 1% malathion shampoo used to treat head lice.
In a 1994 summary report, there were no poisoning incidents and no inhibition of plasma cholinesterase activity in workers involved in the manufacture of malathion over a 20-year period. In a subsequent (1999) summary report, biological monitoring of workers employed at dimethoate and malathion manufacturing plants from 1994 to 1999 detected no reduction in plasma cholinesterase activity.
Several epidemiological studies on cancer outcomes in relation to occupational exposure to malathion were available. The evaluation of these studies focused on the occurrence of NHL and prostate cancer, as outlined in section 2.2. One meta-analysis was available, as well as one prospective cohort study, the AHS, with a large sample size and detailed exposure assessment. Cohort studies are considered a powerful design, as recall bias is avoided. All other studies were case–control studies, usually retrospective, which are more prone to recall and selection biases.
The AHS found no evidence of a positive association of NHL with malathion exposure or of an exposure–response relationship. In contrast, various case–control studies reported excess risks of NHL associated with use of malathion. In a large pooled case–control study, the unadjusted estimates showed a significant increased risk of NHL (RR = 1.6; 95% CI = 1.2–2.2) associated with ever versus never use of malathion. However, these were attenuated and/or no longer significant when proxy respondents were excluded and analyses were mutually adjusted for other pesticides. Significant elevated risks of NHL were reported from the cross-Canada case–control study of pesticides and health for ever versus never use of malathion (OR = 1.96; 95% CI = 1.42–2.70) and when examining annual days of use, although there was no clear exposure–response relationship across exposure categories. Non-significant increased risks of NHL were reported by two other case–control studies, one of which had limited statistical power based on only five exposed cases. The meta-analysis, which did not include the AHS, found a significant 80% excess risk ratio for ever versus never use of malathion.
Overall, there is some very weak evidence of a positive association between malathion exposure and NHL from the case–control studies and the overall meta-analysis. However, it is notable that the AHS, which is the only cohort study and is large and of high quality, found no evidence of an association at any exposure level.
There was no evidence of an association with all prostate cancers and malathion exposure in the AHS. However, a significant excess risk of aggressive prostate cancer (RR = 1.43; 95% CI = 1.08–1.88) in the highest exposure category (highest quintile of intensity-weighted lifetime days of malathion exposure), along with a significant exposure–response relationship (P for trend = 0.04), was observed. A significant elevated risk of all prostate cancer was observed in a case–control study

38 Malathion
38
for ever use (OR = 1.34; 95% CI = 1.01–1.78) and for highest lifetime cumulative exposure versus those unexposed (OR = 1.49; 95% CI = 1.02–2.18). A significant trend across exposure categories (P = 0.03) was also reported. However, interpretation of results from this study is limited by potential for exposure misclassification in the job–exposure matrix used for exposure assessment and by the potential for residual confounding from lack of adjustment for other pesticide exposures. There was no evidence of an association between prostate cancer and malathion exposure in the United Farm Workers of America study, which was limited by the use of ecological rather than individual-level exposure assessment.
Overall, the evidence is suggestive of a positive association between malathion exposure and risk of aggressive prostate cancer; however, the evidence base is limited to the one large AHS cohort study.
Based on a consideration of the results of animal bioassays, genotoxicity assays and epidemiological data from occupational exposures, the Meeting concluded that malathion and its metabolites are unlikely to pose a carcinogenic risk to humans from exposure via the diet.
The Meeting concluded that the existing database on malathion was adequate to characterize the potential hazards to the general population, including fetuses, infants and children.
Toxicological evaluation
The current Meeting reaffirmed the ADI of 0–0.3 mg/kg bw, based on the NOAEL of 500 ppm (equal to 29 mg/kg bw per day) in the 2-year study of toxicity and carcinogenicity in rats for the inhibition of brain acetylcholinesterase and using a 100-fold safety factor, established by the 1997 Meeting. The margins of exposure between this ADI and the doses causing liver adenomas in mice and nasal adenomas in rats are 5000-fold and 1200-fold, respectively.
The current Meeting reaffirmed the ARfD of 2 mg/kg bw, based on the NOAEL of 15 mg/kg bw for the inhibition of erythrocyte acetylcholinesterase activity in a study conducted in male and female volunteers with the application of a 10-fold safety factor, established by the 2003 Meeting. This ARfD is supported by the NOAEL of 15 mg/kg bw in a second study conducted in male and female volunteers. The ARfD is considered to be a conservative value, because human acetylcholinesterase is slightly less sensitive (< 2-fold) than rat acetylcholinesterase to malaoxon.
The Meeting concluded that the metabolite malaoxon is approximately 30-fold more toxic than malathion. On this basis, a 30-fold potency factor should be applied to the residue levels for use in both the acute and chronic dietary exposure estimates for malaoxon, and these should be added to the dietary exposures for malathion and compared with the ARfD and ADI for malathion, respectively.
Both the ADI and ARfD are established for the sum of malathion and malaoxon (corrected for its potency), expressed as parent malathion. The other metabolites of malathion considered by the present Meeting are less potent than the parent compound and therefore would be covered by the ADI and ARfD for malathion. The impurity isomalathion may need to be taken into consideration in the risk assessment depending on its concentration in food commodities.
A toxicological monograph was prepared.
Levels relevant to risk assessment of malathion
Species Study Effect NOAEL LOAEL
Mouse Two-year study of toxicity and carcinogenicitya
Toxicity 800 ppm, equal to 143 mg/kg bw per day
8 000 ppm, equal to 1 476 mg/kg bw per day

Malathion 39
39
Species Study Effect NOAEL LOAEL
Carcinogenicity 800 ppm, equal to 143 mg/kg bw per day
8 000 ppm, equal to 1 476 mg/kg bw per day
Rat Acute neurotoxicity studyb Toxicity 1 000 mg/kg bw per day
2 000 mg/kg bw per day
One-month studies of toxicitya,c
Toxicity 500 ppm, equal to 51.9 mg/kg bw per day
5 000 ppm, equal to 457.5 mg/kg bw per day
Thirteen-week studies of toxicity and neurotoxicitya,c
Toxicity 500 ppm, equal to 34 mg/kg bw per day
5 000 ppm, equal to 340 mg/kg bw per day
Two-year study of toxicity and carcinogenicitya
Toxicity 500 ppm, equal to 29 mg/kg bw per day
6 000 ppm, equal to 359 mg/kg bw per day
Carcinogenicity 500 ppm, equal to 29 mg/kg bw per day
6 000 ppm, equal to 359 mg/kg bw per day
Two-generation study of reproductive toxicitya,e
Reproductive toxicity
7 500 ppm, equal to 595 mg/kg bw per dayd
–
Parental toxicity 7 500 ppm, equal to 595 mg/kg bw per dayd
–
Offspring toxicity 1 700 ppm, equal to 130 mg/kg bw per day
5 000 ppm, equal to 393 mg/kg bw per day
Developmental toxicity studyb,e
Maternal toxicity 400 mg/kg bw per day
800 mg/kg bw per day
Embryo and fetal toxicity
800 mg/kg bw per dayd
–
Developmental neurotoxicity studyb,e
Maternal toxicity 50 mg/kg bw per day 150 mg/kg bw per day
Offspring toxicity 50 mg/kg bw per day 150 mg/kg bw per day
Rabbit Developmental toxicity studyb,e
Maternal toxicity 25 mg/kg bw per day 50 mg/kg bw per day
Embryo and fetal toxicity
100 mg/kg bw per dayd
–
Dog One-year study of toxicityf Toxicity 125 mg/kg bw per day
250 mg/kg bw per day
Human Acute volunteer studiesc,f Cholinesterase inhibition
15 mg/kg bwd –
a Dietary administration. b Gavage administration. c Two or more studies combined. d Highest dose tested. e Acetylcholinesterase activity not measured. f Capsule administration.

40 Malathion
40
Estimate of acceptable daily intake (ADI)
0–0.3 mg/kg bw (for sum of malathion and malaoxon, adjusted for its potency, and expressed as malathion)
Estimate of acute reference dose (ARfD)
2 mg/kg bw (for sum of malathion and malaoxon, adjusted for its potency, and expressed as malathion)
Information that would be useful for the continued evaluation of the compound
Results from epidemiological, occupational health and other such observational studies of human exposure
Results from in vivo genotoxicity studies investigating oral dosing, because malathion genotoxicity data are highly variable and inconsistent and there is a lack of robust in vivo rodent studies using the oral route of exposure
Critical end-points for setting guidance values for exposure to malathion
Absorption, distribution, excretion and metabolism in mammals
Rate and extent of oral absorption Rapid; > 77%
Dermal absorption Estimates vary (1.44–20.7% in human skin)
Distribution Rapid tissue distribution
Potential for accumulation No potential for accumulation
Rate and extent of excretion Rapid and complete
Metabolism in animals Extensive; oxidation, hydrolysis, dealkylation and demethylation reactions
Toxicologically significant compounds in animals and plants
Malathion, malaoxon, desmethyl malathion, desmethyl malaoxon, MMCA, MDCA, isomalathion
Acute toxicity
Rat, LD50, oral > 1 539 to < 8 227 mg/kg bw
Rat, LD50, dermal > 2 000 mg/kg bw
Rat, LC50, inhalation > 5.2 mg/L
Rabbit, dermal irritation Slightly irritating
Rabbit, ocular irritation Slightly irritating
Guinea-pig, dermal sensitization Not sensitizing (Buehler assay)
Sensitizing (maximization assay)
Mouse, dermal sensitization Not sensitizing (local lymph node assay)
Short-term studies of toxicity
Target/critical effect Acetylcholinesterase inhibition
Lowest relevant oral NOAEL 51.9 mg/kg bw per day (28 days; rat)
Lowest relevant dermal NOAEL 150 mg/kg bw per day (21 days; rabbit)
Lowest relevant inhalation NOAEC < 0.1 mg/L (13 weeks; rat)
Long-term studies of toxicity and carcinogenicity
Target/critical effect Acetylcholinesterase inhibition

Malathion 41
41
Lowest relevant NOAEL 29 mg/kg bw per day (rat)
Carcinogenicity Some evidence of carcinogenicity in mice and ratsa
Genotoxicity
Genotoxic, possibly due to the generation of reactive oxygen speciesa
Reproductive toxicity
Reproduction target/critical effect No effect on reproduction
Lowest relevant parental NOAEL 595 mg/kg bw per day (rat; highest dose tested)b
Lowest relevant offspring NOAEL 130 mg/kg bw per day (rat)b
Lowest relevant reproduction NOAEL 595 mg/kg bw per day (rat; highest dose tested)b
Developmental toxicity
Developmental target/critical effect Marginally reduced maternal body weight gain
Lowest maternal NOAEL 25 mg/kg bw per day (rabbit)b
Lowest embryo/fetal NOAEL 100 mg/kg bw per day (rabbit; highest dose tested)b
Neurotoxicity
Acute neurotoxicity NOAEL 1 000 mg/kg bw
Subchronic neurotoxicity NOAEL 4 mg/kg bw per dayc
Developmental neurotoxicity NOAEL 50 mg/kg bw per dayb
Delayed neurotoxicity No evidence
Other toxicological studies
Immunotoxicity NOAEL 1 216 mg/kg bw per day (rat; highest dose tested)
Not immunotoxic
Toxicological studies on malaoxon
Rat, LD50, oral 50 mg/kg bw
Lowest relevant long-term NOAEL 1 mg/kg bw per day (rat)
Carcinogenicity No evidence of carcinogenicity (mouse, rat)
Genotoxicity Some evidence of genotoxicity, secondary to the formation of reactive oxygen species
Toxicological studies on desmethyl malathion,
sodium salt
Rat, LD50, oral > 2 000 mg/kg bw
Genotoxicity Not mutagenic in prokaryotic assays
Toxicological studies on desmethyl malathion
monocarboxylic acid, potassium salt
Rat, LD50, oral > 2 000 mg/kg bw
Genotoxicity Not mutagenic in prokaryotic assays
Toxicological studies on MMCA
Rat, LD50, oral > 2 000 mg/kg bw
Genotoxicity Not mutagenic in prokaryotic assays

42 Malathion
42
Toxicological studies on MDCA
Rat, LD50, oral > 2 000 mg/kg bw
Genotoxicity Not mutagenic in prokaryotic assays
Toxicological studies on desmethyl malaoxon
dicarboxylic acid
Rat, LD50, oral > 2 000 mg/kg bw
Genotoxicity Not mutagenic in prokaryotic assays
Human data Acetylcholinesterase inhibition:
Acute NOAEL: 15 mg/kg bw, highest dose tested
No adverse effects in manufacturing personnel a Unlikely to pose a carcinogenic risk to humans via exposure from the diet. b Acetylcholinesterase activity not measured. c Ninety-day neurotoxicity study in rats is covered by the overall oral NOAEL for repeated-dose studies of toxicity.
Summary
Value Studies Safety factor
ADI 0–0.3 mg/kg bw Two-year chronic toxicity and carcinogenicity study (rat)
100
ARfD 2 mg/kg bw Single-dose studies (humans) 10
DIETARY RISK ASSESSMENT
The current residue definition for the estimation of dietary exposure is malathion. The Meeting identified that malaoxon is approximately 30 times more potent than malathion based on the end-point (acetylcholinesterase inhibition) on which the ADI and ARfD have been established. Malaoxon is generally present in food at concentrations that are approximately 3% of the malathion concentration. If malaoxon were included in the residue definition for dietary risk assessment, the exposures calculated below for comparison with the health-based guidance values would be approximately double.
Long-term dietary exposure
The ADI for malathion is 0–0.3 mg/kg bw. The IEDIs for malathion were estimated for the 17 GEMS/Food cluster diets using the STMR or STMR-P values estimated by JMPR. The results are shown in Annex 3. The IEDI ranged from 0.1% to 0.5% of the maximum ADI. The Meeting concluded that the long-term dietary exposure to residues of malathion from uses that have been considered by JMPR is unlikely to present a public health concern.
Short-term dietary exposure
The ARfD for malathion is 2 mg/kg bw. The IESTI for malathion was calculated for the plant commodities for which STMR and HR levels were estimated by the 1999, 2004 and 2008 JMPRs and for which consumption data were available. The results are shown in Annex 4. The calculated IESTIs were 0–5% of the ARfD for the general population and 0–9% of the ARfD for children. The Meeting concluded that the short-term dietary exposure to malathion residues from uses considered by the Meeting was unlikely to present a public health concern.

Recommendations 43
43
6. RECOMMENDATIONS
The Meeting recommended that a guidance document be developed for the evaluation of genotoxicity studies, taking the experience gained from this meeting into account.


Annex 1 45
45
ANNEX 1: ACCEPTABLE DAILY INTAKES AND ACUTE REFERENCE DOSES RECORDED BY THE MAY 2016 MEETING
Pesticide (Codex reference number)
Acceptable daily intake (ADI) (mg/kg bw)
Acute reference dose (ARfD) (mg/kg bw)
Diazinon (22) 0–0.003 0.03
Glyphosate (158) 0–1a Unnecessary
Malathion (49) 0–0.3b 2b
a Group ADI for the sum of glyphosate, AMPA, N-acetyl-glyphosate and N-acetyl-AMPA. b Established for the sum of malathion and malaoxon (corrected for its potency), expressed as parent malathion.


Annex 2 47
47
ANNEX 2: INDEX OF REPORTS AND EVALUATIONS OF PESTICIDES BY THE JMPR
Numbers in parentheses after the names of pesticides are Codex classification numbers. The abbreviations used are:
T, evaluation of toxicology
R, evaluation of residue and analytical aspects
E, evaluation of effects on the environment
Abamectin (177) 1992 (T,R), 1994 (T,R), 1995 (T), 1997 (T,R), 2000 (R), 2015 (R)
Acephate (095) 1976 (T,R), 1979 (R), 1981 (R), 1982 (T), 1984 (T,R), 1987 (T), 1988 (T), 1990 (T,R), 1991 (corr. to 1990 R evaluation), 1994 (R), 1996 (R), 2002 (T), 2003 (R), 2004 (corr. to 2003 report), 2005 (T), 2006 (R), 2011 (R)
Acetamiprid (246) 2011 (T,R), 2012 (R), 2015 (R)
Acetochlor (280) 2015 (T,R)
Acrylonitrile 1965 (T,R)
Aldicarb (117) 1979 (T,R), 1982 (T,R), 1985 (R), 1988 (R), 1990 (R), 1991 (corr. to 1990 evaluation), 1992 (T), 1993 (R), 1994 (R), 1996 (R), 2001 (R), 2002 (R), 2006 (R)
Aldrin (001) 1965 (T), 1966 (T,R), 1967 (R), 1974 (R), 1975 (R), 1977 (T), 1990 (R), 1992 (R)
Allethrin 1965 (T,R)
Ametoctradin (253) 2012 (T,R)
Aminocarb (134) 1978 (T,R), 1979 (T,R)
Aminocyclopyrachlor (272) 2014 (T,R)
Aminomethylphosphonic acid (AMPA, 198) 1997 (T,R)
Aminopyralid (220) 2006 (T,R), 2007 (T,R)
Amitraz (122) 1980 (T,R), 1983 (R), 1984 (T,R), 1985 (R), 1986 (R), 1989 (R), 1990 (T,R), 1991 (R & corr. to 1990 R evaluation), 1998 (T)
Amitrole (079) 1974 (T,R), 1977 (T), 1993 (T,R), 1997 (T), 1998 (R)
Anilazine (163) 1989 (T,R), 1992 (R)
Atrazine 2007 (T)
Azinphos-ethyl (068) 1973 (T,R), 1983 (R)
Azinphos-methyl (002) 1965 (T), 1968 (T,R), 1972 (R), 1973 (T), 1974 (R), 1991 (T,R), 1992 (corr. to 1991 report), 1993 (R), 1995 (R), 2007 (T)

48 Annex 2
48
Azocyclotin (129) 1979 (R), 1981 (T), 1982 (R), 1983 (R), 1985 (R), 1989 (T,R), 1991 (R), 1994 (T), 2005 (T,R)
Azoxystrobin (229) 2008 (T,R), 2011 (R), 2012 (R), 2013 (R)
Benalaxyl (155) 1986 (R), 1987 (T), 1988 (R), 1992 (R), 1993 (R), 2005 (T), 2009 (R)
Bendiocarb (137) 1982 (T,R), 1984 (T,R), 1989 (R), 1990 (R)
Benomyl (069) 1973 (T,R), 1975 (T,R), 1978 (T,R), 1983 (T,R), 1988 (R), 1990 (R), 1994 (R), 1995 (T,E), 1998 (R)
Bentazone (172) 1991 (T,R), 1992 (corr. to 1991 report, Annex I), 1994 (R), 1995 (R), 1998 (T,R), 1999 (corr. to 1998 report), 2004 (T), 2012 (T), 2013 (R)
Benzovinfiflupyr (261) 2013 (T), 2014 (R)
BHC (technical-grade) 1965 (T), 1968 (T,R), 1973 (T,R) (see also Lindane)
Bifenazate (219) 2006 (T,R), 2008 (R), 2010 (R)
Bifenthrin (178) 1992 (T,R), 1995 (R), 1996 (R), 1997 (R), 2009 (T), 2010 (R), 2015 (R)
Binapacryl (003) 1969 (T,R), 1974 (R), 1982 (T), 1984 (R), 1985 (T,R)
Bioresmethrin (093) 1975 (R), 1976 (T,R), 1991 (T,R)
Biphenyl See Diphenyl
Bitertanol (144) 1983 (T), 1984 (R), 1986 (R), 1987 (T), 1988 (R), 1989 (R), 1991 (R), 1998 (T), 1999 (R), 2002 (R)
Bixafen (262) 2013 (T,R)
Boscalid (221) 2006 (T,R), 2008 (R), 2010 (R)
Bromide ion (047) 1968 (R), 1969 (T,R), 1971 (R), 1979 (R), 1981 (R), 1983 (R), 1988 (T,R), 1989 (R), 1992 (R)
Bromomethane (052) 1965 (T,R), 1966 (T,R), 1967 (R), 1968 (T,R), 1971 (R), 1979 (R), 1985 (R), 1992 (R)
Bromophos (004) 1972 (T,R), 1975 (R), 1977 (T,R), 1982 (R), 1984 (R), 1985 (R)
Bromophos-ethyl (005) 1972 (T,R), 1975 (T,R), 1977 (R)
Bromopropylate (070) 1973 (T,R), 1993 (T,R)
Butocarboxim (139) 1983 (R), 1984 (T), 1985 (T), 1986 (R)
Buprofezin (173) 1991 (T,R), 1995 (R), 1996 (corr. to 1995 report.), 1999 (R), 2008 (T,R), 2009 (R), 2012 (R), 2014 (R)
sec-Butylamine (089) 1975 (T,R), 1977 (R), 1978 (T,R), 1979 (R), 1980 (R), 1981 (T), 1984 (T,R: withdrawal of temporary ADI, but no evaluation)
Cadusafos (174) 1991 (T,R), 1992 (R), 1992 (R), 2009 (R), 2010 (R)
Campheclor (071) 1968 (T,R), 1973 (T,R)

Annex 2 49
49
Captafol (006) 1969 (T,R), 1973 (T,R), 1974 (R), 1976 (R), 1977 (T,R), 1982 (T), 1985 (T,R), 1986 (corr. to 1985 report), 1990 (R), 1999 (ARfD)
Captan (007) 1965 (T), 1969 (T,R), 1973 (T), 1974 (R), 1977 (T,R), 1978 (T,R), 1980 (R), 1982 (T), 1984 (T,R), 1986 (R), 1987 (R and corr. to 1986 R evaluation), 1990 (T,R), 1991 (corr. to 1990 R evaluation), 1994 (R), 1995 (T), 1997 (R), 2000 (R), 2004 (T), 2007 (T)
Carbaryl (008) 1965 (T), 1966 (T,R), 1967 (T,R), 1968 (R), 1969 (T,R), 1970 (R), 1973 (T,R), 1975 (R), 1976 (R), 1977 (R), 1979 (R), 1984 (R), 1996 (T), 2001 (T), 2002 (R), 2007 (R)
Carbendazim (072) 1973 (T,R), 1976 (R), 1977 (T), 1978 (R), 1983 (T,R), 1985 (T,R), 1987 (R), 1988 (R), 1990 (R), 1994 (R), 1995 (T,E), 1998 (T,R), 2003 (R), 2005 (T), 2012 (R)
Carbofuran (096) 1976 (T,R), 1979 (T,R), 1980 (T), 1982 (T), 1991 (R), 1993 (R), 1996 (T), 1997 (R), 1999 (corr. to 1997 report), 2002 (T,R), 2003 (R) (See also carbosulfan), 2004 (R), 2008 (T), 2009 (R)
Carbon disulfide (009) 1965 (T,R), 1967 (R), 1968 (R), 1971 (R), 1985 (R)
Carbon tetrachloride (010) 1965 (T,R), 1967 (R), 1968 (T,R), 1971 (R), 1979 (R), 1985 (R)
Carbophenothion (011) 1972 (T,R), 1976 (T,R), 1977 (T,R), 1979 (T,R), 1980 (T,R), 1983 (R)
Carbosulfan (145) 1984 (T,R), 1986 (T), 1991 (R), 1992 (corr. to 1991 report), 1993 (R), 1997 (R), 1999 (R), 2002 (R), 2003 (T,R), 2004 (R, corr. to 2003 report)
Cartap (097) 1976 (T,R), 1978 (T,R), 1995 (T,R)
Chinomethionat (080) 1968 (T,R) (as oxythioquinox), 1974 (T,R), 1977 (T,R), 1981 (T,R), 1983 (R), 1984 (T,R), 1987 (T)
Chlorantraniliprole (230) 2008 (T,R), 2010 (R), 2013 (R), 2014 (R)
Chlorbenside 1965 (T)
Chlordane (012) 1965 (T), 1967 (T,R), 1969 (R), 1970 (T,R), 1972 (R), 1974 (R), 1977 (T,R), 1982 (T), 1984 (T,R), 1986 (T)
Chlordimeform (013) 1971 (T,R), 1975 (T,R), 1977 (T), 1978 (T,R), 1979 (T), 1980 (T), 1985 (T), 1986 (R), 1987 (T)
Chlorfenapyr (254) 2013 (T)
Chlorfenson 1965 (T)
Chlorfenvinphos (014) 1971 (T,R), 1984 (R), 1994 (T), 1996 (R)
Chlormequat (015) 1970 (T,R), 1972 (T,R), 1976 (R), 1985 (R), 1994 (T,R), 1997 (T), 1999 (ARfD), 2000 (R)

50 Annex 2
50
Chlorobenzilate (016) 1965 (T), 1968 (T,R), 1972 (R), 1975 (R), 1977 (R), 1980 (T)
Chloropicrin 1965 (T,R)
Chloropropylate 1968 (T,R), 1972 (R)
Chlorothalonil (081) 1974 (T,R), 1977 (T,R), 1978 (R), 1979 (T,R), 1981 (T,R), 1983 (T,R), 1984 (corr. to 1983 report and T evaluation), 1985 (T,R), 1987 (T), 1988 (R), 1990 (T,R), 1991 (corr. to 1990 evaluation), 1992 (T), 1993 (R), 1997 (R), 2009 (T), 2010 (R), 2012 (R), 2015 (R)
Chlorpropham (201) 1965 (T), 2000 (T), 2001 (R), 2005 (T), 2008 (R)
Chlorpyrifos (017) 1972 (T,R), 1974 (R), 1975 (R), 1977 (T,R), 1981 (R), 1982 (T,R), 1983 (R), 1989 (R), 1995 (R), 1999 (T), 2000 (R), 2004 (R), 2006 (R)
Chlorpyrifos-methyl (090) 1975 (T,R), 1976 (R, Annex I only), 1979 (R), 1990 (R), 1991 (T,R), 1992 (T and corr. to 1991 report), 1993 (R), 1994 (R), 2001 (T), 2009 (R)
Chlorthion 1965 (T)
Clethodim (187) 1994 (T,R), 1997 (R), 1999 (R), 2002 (R)
Clofentezine (156) 1986 (T,R), 1987 (R), 1989 (R), 1990 (R), 1992 (R), 2005 (T), 2007 (R)
Clothianidin (238) 2010 (T,R), 2011 (R), 2014 (R)
Coumaphos (018) 1968 (T,R), 1972 (R), 1975 (R), 1978 (R), 1980 (T,R), 1983 (R), 1987 (T), 1990 (T,R)
Crufomate (019) 1968 (T,R), 1972 (R)
Cyanophenfos (091) 1975 (T,R), 1978 (T: ADI extended, but no evaluation), 1980 (T), 1982 (R), 1983 (T)
Cyantraniliprole (263) 2013 (T,R), 2015 (R)
Cyazofamid (281) 2015 (T, R)
Cycloxydim (179) 1992 (T,R), 1993 (R), 2009 (T), 2012 (R)
Cyflumetofen (273) 2014 (T,R)
Cyfluthrin (157) 1986 (R), 1987 (T and corr. to 1986 report), 1989 (R), 1990 (R), 1992 (R), 2006 (T), 2007 (R)
Cyhalothrin (146) 1984 (T,R), 1986 (R), 1988 (R), 2007 (T), 2008 (R), 2015 (R)
Cyhexatin (067) 1970 (T,R), 1973 (T,R), 1974 (R), 1975 (R), 1977 (T), 1978 (T,R), 1980 (T), 1981 (T), 1982 (R), 1983 (R), 1985 (R), 1988 (T), 1989 (T), 1991 (T,R), 1992 (R), 1994 (T), 2005 (T,R)
Cypermethrin (118) 1979 (T,R), 1981 (T,R), 1982 (R), 1983 (R), 1984 (R), 1985 (R), 1986 (R), 1987 (corr. to 1986 evaluation), 1988 (R), 1990 (R), 2006 (T), 2008 (R), 2009 (R), 2011 (R)

Annex 2 51
51
Cyproconazole (239) 2010 (T,R), 2013 (R)
Cyprodinil (207) 2003 (T,R), 2004 (corr. to 2003 report), 2013 (R), 2015 (R)
Cyromazine (169) 1990 (T,R), 1991 (corr. to 1990 R evaluation), 1992 (R), 2006 (T), 2007 (R), 2012 (R)
2,4-D (020) 1970 (T,R), 1971 (T,R), 1974 (T,R), 1975 (T,R), 1980 (R), 1985 (R), 1986 (R), 1987 (corr. to 1986 report, Annex I), 1996 (T), 1997 (E), 1998 (R), 2001 (R)
Daminozide (104) 1977 (T,R), 1983 (T), 1989 (T,R), 1991 (T)
DDT (021) 1965 (T), 1966 (T,R), 1967 (T,R), 1968 (T,R), 1969 (T,R), 1978 (R), 1979 (T), 1980 (T), 1983 (T), 1984 (T), 1993 (R), 1994 (R), 1996 (R)
Deltamethrin (135) 1980 (T,R), 1981 (T,R), 1982 (T,R), 1984 (R), 1985 (R), 1986 (R), 1987 (R), 1988 (R), 1990 (R), 1992 (R), 2000 (T), 2002 (R)
Demeton (092) 1965 (T), 1967 (R), 1975 (R), 1982 (T)
Demeton-S-methyl (073) 1973 (T,R), 1979 (R), 1982 (T), 1984 (T,R), 1989 (T,R), 1992 (R), 1998 (R)
Demeton-S-methylsulfon (164) 1973 (T,R), 1982 (T), 1984 (T,R), 1989 (T,R), 1992 (R)
Dialifos (098) 1976 (T,R), 1982 (T), 1985 (R)
Diazinon (022) 1965 (T), 1966 (T), 1967 (R), 1968 (T,R), 1970 (T,R), 1975 (R), 1979 (R), 1993 (T,R), 1994 (R), 1996 (R), 1999 (R), 2001 (T), 2006 (T,R), 2016 (T)
1,2-Dibromoethane (023) 1965 (T,R), 1966 (T,R), 1967 (R), 1968 (R), 1971 (R), 1979 (R), 1985 (R)
Dicamba (240) 2010 (T,R), 2011 (R), 2012 (R), 2013 (R)
Dichlobenil (274) 2014 (T,R)
Dicloran (083) 2003 (R)
Dichlorfluanid (082) 1969 (T,R), 1974 (T,R), 1977 (T,R), 1979 (T,R), 1981 (R), 1982 (R), 1983 (T,R), 1985 (R)
1,2-Dichloroethane (024) 1965 (T,R), 1967 (R), 1971 (R), 1979 (R), 1985 (R)
Dichlorvos (025) 1965 (T,R), 1966 (T,R), 1967 (T,R), 1969 (R), 1970 (T,R), 1974 (R), 1977 (T), 1993 (T,R), 2011 (T), 2012 (R)
Dicloran (083) 1974 (T,R), 1977 (T,R), 1998 (T,R)
Dicofol (026) 1968 (T,R), 1970 (R), 1974 (R), 1992 (T,R), 1994 (R), 2011 (T), 2012 (R)
Dieldrin (001) 1965 (T), 1966 (T,R), 1967 (T,R), 1968 (R), 1969 (R), 1970 (T,R), 1974 (R), 1975 (R), 1977 (T), 1990 (R), 1992 (R)

52 Annex 2
52
Difenoconazole (224) 2007 (T,R), 2010 (R), 2013 (R), 2015 (R)
Diflubenzuron (130) 1981 (T,R), 1983 (R), 1984 (T,R), 1985 (T,R), 1988 (R), 2001 (T), 2002 (R), 2011 (R)
Dimethenamid-P (214) 2005 (T,R)
Dimethipin (151) 1985 (T,R), 1987 (T,R), 1988 (T,R), 1999 (T), 2001 (R), 2004 (T)
Dimethoate (027) 1965 (T), 1966 (T), 1967 (T,R), 1970 (R), 1973 (R in evaluation of formothion), 1977 (R), 1978 (R), 1983 (R) 1984 (T,R), 1986 (R), 1987 (T,R), 1988 (R), 1990 (R), 1991 (corr. to 1990 evaluation), 1994 (R), 1996 (T), 1998 (R), 2003 (T,R), 2004 (corr. to 2003 report), 2006 (R), 2008 (R)
Dimethomorph (225) 2007 (T,R), 2014 (R)
Dimethrin 1965 (T)
Dinocap (087) 1969 (T,R), 1974 (T,R), 1989 (T,R), 1992 (R), 1998 (R), 1999 (R), 2000 (T), 2001 (R)
Dinotefuran (255) 2012 (T,R)
Dioxathion (028) 1968 (T,R), 1972 (R)
Diphenyl (029) 1966 (T,R), 1967 (T)
Diphenylamine (030) 1969 (T,R), 1976 (T,R), 1979 (R), 1982 (T), 1984 (T,R), 1998 (T), 2001 (R), 2003 (R), 2008 (R)
Diquat (031) 1970 (T,R), 1972 (T,R), 1976 (R), 1977 (T,R), 1978 (R), 1994 (R), 2013 (T,R)
Disulfoton (074) 1973 (T,R), 1975 (T,R), 1979 (R), 1981 (R), 1984 (R), 1991 (T,R), 1992 (corr. to 1991 report, Annex I), 1994 (R), 1996 (T), 1998 (R), 2006 (R)
Dithianon (180) 1992 (T,R), 1995 (R), 1996 (corr. to 1995 report), 2010 (T), 2013 (T,R)
Dithiocarbamates (105) 1965 (T), 1967 (T,R), 1970 (T,R), 1983 (R propineb, thiram), 1984 (R propineb), 1985 (R), 1987 (T thiram), 1988 (R thiram), 1990 (R), 1991 (corr. to 1990 evaluation), 1992 (T thiram), 1993 (T,R), 1995 (R), 1996 (T,R ferbam, ziram; R thiram), 2004 (R), 2012 (R), 2014 (R)
4,6-Dinitro-ortho-cresol (DNOC) 1965 (T)
Dodine (084) 1974 (T,R), 1976 (T,R), 1977 (R), 2000 (T), 2003 (R), 2004 (corr. to 2003 report)
Edifenphos (099) 1976 (T,R), 1979 (T,R), 1981 (T,R)
Emamectin benzoate (247) 2011 (T,R), 2014 (R)
Endosulfan (032) 1965 (T), 1967 (T,R), 1968 (T,R), 1971 (R), 1974 (R), 1975 (R), 1982 (T), 1985 (T,R), 1989 (T,R), 1993 (R), 1998 (T), 2006 (R), 2010 (R)
Endrin (033) 1965 (T), 1970 (T,R), 1974 (R), 1975 (R), 1990 (R), 1992 (R)

Annex 2 53
53
Esfenvalerate (204) 2002 (T,R)
Ethephon (106) 1977 (T,R), 1978 (T,R), 1983 (R), 1985 (R), 1993 (T), 1994 (R), 1995 (T), 1997 (T), 2002 (T), 2015 (T, R)
Ethiofencarb (107) 1977 (T,R), 1978 (R), 1981 (R), 1982 (T,R), 1983 (R)
Ethion (034) 1968 (T,R), 1969 (R), 1970 (R), 1972 (T,R), 1975 (R), 1982 (T), 1983 (R), 1985 (T), 1986 (T), 1989 (T), 1990 (T), 1994 (R)
Ethoprophos (149) 1983 (T), 1984 (R), 1987 (T), 1999 (T), 2004 (R)
Ethoxyquin (035) 1969 (T,R), 1998 (T), 1999 (R), 2005 (T), 2008 (R)
Ethylene dibromide See 1,2-Dibromoethane
Ethylene dichloride See 1,2-Dichloroethane
Ethylene oxide 1965 (T,R), 1968 (T,R), 1971 (R)
Ethylenethiourea (ETU) (108) 1974 (R), 1977 (T,R), 1986 (T,R), 1987 (R), 1988 (T,R), 1990 (R), 1993 (T,R)
Etofenprox (184) 1993 (T,R), 2011 (T,R)
Etoxazole (241) 2010 (T,R), 2011 (R)
Etrimfos (123) 1980 (T,R), 1982 (T,R), 1986 (T,R), 1987 (R), 1988 (R), 1989 (R), 1990 (R)
Famoxadone (208) 2003 (T,R)
Fenamidone (264) 2013 (T), 2014 (T,R)
Fenamiphos (085) 1974 (T,R), 1977 (R), 1978 (R), 1980 (R), 1985 (T), 1987 (T), 1997 (T), 1999 (R), 2002 (T), 2006 (R)
Fenarimol (192) 1995 (T,R,E), 1996 (R and corr. to 1995 report)
Fenbuconazole (197) 1997 (T,R), 2009 (R), 2012 (T), 2013 (R)
Fenbutatin oxide (109) 1977 (T,R), 1979 (R), 1992 (T), 1993 (R)
Fenchlorfos (036) 1968 (T,R), 1972 (R), 1983 (R)
Fenhexamid (215) 2005 (T,R)
Fenitrothion (037) 1969 (T,R), 1974 (T,R), 1976 (R), 1977 (T,R), 1979 (R), 1982 (T), 1983 (R), 1984 (T,R), 1986 (T,R), 1987 (R and corr. to 1986 R evaluation), 1988 (T), 1989 (R), 2000 (T), 2003 (R), 2004 (R, corr. to 2003 report), 2007 (T,R)
Fenpropathrin (185) 1993 (T,R), 2006 (R), 2012 (T), 2014 (R)
Fenpropimorph (188) 1994 (T), 1995 (R), 1999 (R), 2001 (T), 2004 (T)
Fenpyroximate (193) 1995 (T,R), 1996 (corr. to 1995 report), 1999 (R), 2004 (T), 2007 (T), 2010 (R), 2013 (R)
Fensulfothion (038) 1972 (T,R), 1982 (T), 1983 (R)
Fenthion (039) 1971 (T,R), 1975 (T,R), 1977 (R), 1978 (T,R), 1979 (T), 1980 (T), 1983 (R), 1989 (R),

54 Annex 2
54
1995 (T,R,E), 1996 (corr. to 1995 report), 1997 (T), 2000 (R)
Fentin compounds (040) 1965 (T), 1970 (T,R), 1972 (R), 1986 (R), 1991 (T,R), 1993 (R), 1994 (R)
Fenvalerate (119) 1979 (T,R), 1981 (T,R), 1982 (T), 1984 (T,R), 1985 (R), 1986 (T,R), 1987 (R and corr. to 1986 report), 1988 (R), 1990 (R), 1991 (corr. to 1990 R evaluation), 2012 (T,R)
Ferbam See Dithiocarbamates, 1965 (T), 1967 (T,R), 1996 (T,R)
Fipronil (202) 1997 (T), 2000 (T), 2001 (R)
Fipronil-desulfinyl 1997 (T)
Flonicamid (282) 2015 (T,R)
Flubendiamide (242) 2010 (T,R)
Flucythrinate (152) 1985 (T,R), 1987 (R), 1988 (R), 1989 (R), 1990 (R), 1993 (R)
Fludioxonil (211) 2004 (T,R), 2006 (R), 2010 (R), 2012 (R), 2013 (R)
Fluensulfone (265) 2013 (T), 2014 (T,R)
Flufenoxuron (275) 2014 (T,R)
Flumethrin (195) 1996 (T,R)
Fluopicolide (235) 2009 (T,R), 2014 (R)
Fluopyram (243) 2010 (T,R), 2012 (R), 2014 (R), 2015 (R)
Flupyradifurone (285) 2015 (T)
Flusilazole (165) 1989 (T,R), 1990 (R), 1991 (R), 1993 (R), 1995 (T), 2007 (T,R)
Flutolanil (205) 2002 (T,R), 2013 (R)
Flutriafol (248) 2011 (T,R), 2015 (R)
Fluxapyroxad (256) 2012 (T,R), 2015 (R)
Folpet (041) 1969 (T,R), 1973 (T), 1974 (R), 1982 (T), 1984 (T,R), 1986 (T), 1987 (R), 1990 (T,R), 1991 (corr. to 1990 R evaluation), 1993 (T,R), 1994 (R), 1995 (T), 1997 (R), 1998 (R), 1999 (R) , 2002 (T), 2004 (T), 2007 (T)
Formothion (042) 1969 (T,R), 1972 (R), 1973 (T,R), 1978 (R), 1998 (R)
Glufosinate-ammonium (175) 1991 (T,R), 1992 (corr. to 1991 report, Annex I), 1994 (R), 1998 (R), 1999 (T,R), 2012 (T,R), 2014 (R)
Glyphosate (158) 1986 (T,R), 1987 (R and corr. to 1986 report), 1988 (R), 1994 (R), 1997 (T,R), 2004 (T), 2005 (R), 2011 (T,R), 2013 (R), 2016 (T)
Guazatine (114) 1978 (T,R), 1980 (R), 1997 (T,R)

Annex 2 55
55
Haloxyfop (194) 1995 (T,R), 1996 (R and corr. to 1995 report), 2001 (R), 2006 (T), 2009 (R)
Heptachlor (043) 1965 (T), 1966 (T,R), 1967 (R), 1968 (R), 1969 (R), 1970 (T,R), 1974 (R), 1975 (R), 1977 (R), 1987 (R), 1991 (T,R), 1992 (corr. to 1991 report, Annex I), 1993 (R), 1994 (R)
Hexachlorobenzene (044) 1969 (T,R), 1973 (T,R), 1974 (T,R), 1978 (T), 1985 (R)
Hexaconazole (170) 1990 (T,R), 1991 (R and corr. to 1990 R evaluation), 1993 (R)
Hexythiazox (176) 1991 (T,R), 1994 (R), 1998 (R), 2008 (T), 2009 (R)
Hydrogen cyanide (045) 1965 (T,R)
Hydrogen phosphide (046) 1965 (T,R), 1966 (T,R), 1967 (R), 1969 (R), 1971 (R)
Imazalil (110) 1977 (T,R), 1980 (T,R), 1984 (T,R), 1985 (T,R), 1986 (T), 1988 (R), 1989 (R), 1991 (T), 1994 (R), 2000 (T), 2001 (T), 2005 (T)
Imazamox (276) 2014 (T,R)
Imazapic (266) 2013 (T,R), 2015 (R)
Imazapyr (267) 2013 (T,R), 2015 (R)
Imidacloprid (206) 2001 (T), 2002 (R), 2006 (R), 2008 (R), 2012 (R), 2015 (R)
Indoxacarb (216) 2005 (T,R), 2007 (R), 2009 (R), 2012 (R), 2013 (R)
Iprodione (111) 1977 (T,R), 1980 (R), 1992 (T), 1994 (R), 1995 (T), 2001 (R)
Isofenphos (131) 1981 (T,R), 1982 (T,R), 1984 (R), 1985 (R), 1986 (T,R), 1988 (R), 1992 (R)
Isopyrazam (249) 2011 (T,R)
Isoxaflutole (268) 2013 (T,R)
Kresoxim-methyl (199) 1998 (T,R), 2001 (R)
Lead arsenate 1965 (T), 1968 (T,R)
Leptophos (088) 1974 (T,R), 1975 (T,R), 1978 (T,R)
Lindane (048) 1965 (T), 1966 (T,R), 1967 (R), 1968 (R), 1969 (R), 1970 (T,R, published as Annex VI to 1971 evaluations), 1973 (T,R), 1974 (R), 1975 (R), 1977 (T,R), 1978 (R), 1979 (R), 1989 (T,R), 1997 (T), 2002 (T), 2003 (R), 2004 (corr. to 2003 report), 2015 (R)
Lufenuron (286) 2015 (T, R)
Malathion (049) 1965 (T), 1966 (T,R), 1967 (corr. to 1966 R evaluation), 1968 (R), 1969 (R), 1970 (R), 1973 (R), 1975 (R), 1977 (R), 1984 (R), 1997 (T), 1999 (R),

56 Annex 2
56
2000 (R), 2003 (T), 2004 (R), 2005 (R), 2008 (R), 2013 (R), 2016 (T)
Maleic hydrazide (102) 1976 (T,R), 1977 (T,R), 1980 (T), 1984 (T,R), 1996 (T), 1998 (R)
Mancozeb (050) 1967 (T,R), 1970 (T,R), 1974 (R), 1977 (R), 1980 (T,R), 1993 (T,R)
Mandipropamid (231) 2008 (T,R), 2013 (R)
Maneb See Dithiocarbamates, 1965 (T), 1967 (T,R), 1987 (T), 1993 (T,R)
MCPA (257) 2012 (T,R)
Mecarbam (124) 1980 (T,R), 1983 (T,R), 1985 (T,R), 1986 (T,R), 1987 (R)
Meptyldinocap (244) 2010 (T,R)
Mesotrione (277) 2014 (T,R)
Metaflumizone (236) 2009 (T,R)
Metalaxyl (138) 1982 (T,R), 1984 (R), 1985 (R), 1986 (R), 1987 (R), 1989 (R), 1990 (R), 1992 (R), 1995 (R)
Metalaxyl –M (212) 2002 (T), 2004 (R)
Methacrifos (125) 1980 (T,R), 1982 (T), 1986 (T), 1988 (T), 1990 (T,R), 1992 (R)
Methamidophos (100) 1976 (T,R), 1979 (R), 1981 (R), 1982 (T,R), 1984 (R), 1985 (T), 1989 (R), 1990 (T,R), 1994 (R), 1996 (R), 1997 (R), 2002 (T), 2003 (R), 2004 (R, corr. to 2003 report)
Methidathion (051) 1972 (T,R), 1975 (T,R), 1979 (R), 1992 (T,R), 1994 (R), 1997 (T)
Methiocarb (132) 1981 (T,R), 1983 (T,R), 1984 (T), 1985 (T), 1986 (R), 1987 (T,R), 1988 (R), 1998 (T), 1999 (R), 2005 (R)
Methomyl (094) 1975 (R), 1976 (R), 1977 (R), 1978 (R), 1986 (T,R), 1987 (R), 1988 (R), 1989 (T,R), 1990 (R), 1991 (R), 2001 (T,R), 2004 (R), 2008 (R)
Methoprene (147) 1984 (T,R), 1986 (R), 1987 (T and corr. to 1986 report), 1988 (R), 1989 (R), 2001 (T), 2005 (R)
Methoxychlor 1965 (T), 1977 (T)
Methoxyfenozide (209) 2003 (T,R), 2004 (corr. to 2003 report), 2006 (R), 2009 (R), 2012 (R)
Methyl bromide (052) See Bromomethane
Metrafenone (278) 2014 (T,R)
Metiram (186) 1993 (T), 1995 (R)
Mevinphos (053) 1965 (T), 1972 (T,R), 1996 (T), 1997 (E,R), 2000 (R)
MGK 264 1967 (T,R)

Annex 2 57
57
Monocrotophos (054) 1972 (T,R), 1975 (T,R), 1991 (T,R), 1993 (T), 1994 (R)
Myclobutanil (181) 1992 (T,R), 1997 (R), 1998 (R), (2001 (R)), 2014 (T,R)
Nabam See Dithiocarbamates, 1965 (T), 1976 (T,R)
Nitrofen (140) 1983 (T,R)
Novaluron (217) 2005 (T,R), 2010 (R)
Omethoate (055) 1971 (T,R), 1975 (T,R), 1978 (T,R), 1979 (T), 1981 (T,R), 1984 (R), 1985 (T), 1986 (R), 1987 (R), 1988 (R), 1990 (R), 1998 (R)
Organomercury compounds 1965 (T), 1966 (T,R), 1967 (T,R)
Oxamyl (126) 1980 (T,R), 1983 (R), 1984 (T), 1985 (T,R), 1986 (R), 2002 (T,R)
Oxydemeton-methyl (166) 1965 (T, as demeton-S-methyl sulfoxide), 1967 (T), 1968 (R), 1973 (T,R), 1982 (T), 1984 (T,R), 1989 (T,R), 1992 (R), 1998 (R), 1999 (corr. to 1992 report), 2002 (T), 2004 (R)
Oxythioquinox See Chinomethionat
Paclobutrazol (161) 1988 (T,R), 1989 (R)
Paraquat (057) 1970 (T,R), 1972 (T,R), 1976 (T,R), 1978 (R), 1981 (R), 1982 (T), 1985 (T), 1986 (T), 2003 (T), 2004 (R), 2009 (R)
Parathion (058) 1965 (T), 1967 (T,R), 1969 (R), 1970 (R), 1984 (R), 1991 (R), 1995 (T,R), 1997 (R), 2000 (R)
Parathion-methyl (059) 1965 (T), 1968 (T,R), 1972 (R), 1975 (T,R), 1978 (T,R), 1979 (T), 1980 (T), 1982 (T), 1984 (T,R), 1991 (R), 1992 (R), 1994 (R), 1995 (T), 2000 (R), 2003 (R)
Penconazole (182) 1992 (T,R), 1995 (R), 2015 (T)
Penthiopyrad (253) 2011 (T), 2012 (R), 2013 (R)
Permethrin (120) 1979 (T,R), 1980 (R), 1981 (T,R), 1982 (R), 1983 (R), 1984 (R), 1985 (R), 1986 (T,R), 1987 (T), 1988 (R), 1989 (R), 1991 (R), 1992 (corr. to 1991 report), 1999 (T)
2-Phenylphenol (056) 1969 (T,R), 1975 (R), 1983 (T), 1985 (T,R), 1989 (T), 1990 (T,R), 1999 (T,R), 2002 (R)
Phenothrin (127) 1979 (R), 1980 (T,R), 1982 (T), 1984 (T), 1987 (R), 1988 (T,R)
Phenthoate (128) 1980 (T,R), 1981 (R), 1984 (T)
Phorate (112) 1977 (T,R), 1982 (T), 1983 (T), 1984 (R), 1985 (T), 1990 (R), 1991 (R), 1992 (R), 1993 (T), 1994 (T), 1996 (T), 2004 (T), 2005 (R), 2012 (R), 2014 (R)
Phosalone (060) 1972 (T,R), 1975 (R), 1976 (R), 1993 (T), 1994 (R), 1997 (T), 1999 (R), 2001 (T)

58 Annex 2
58
Phosmet (103) 1976 (R), 1977 (corr. to 1976 R evaluation), 1978 (T,R), 1979 (T,R), 1981 (R), 1984 (R), 1985 (R), 1986 (R), 1987 (R and corr. to 1986 R evaluation), 1988 (R), 1994 (T), 1997 (R), 1998 (T), 2002 (R), 2003 (R), 2007 (R)
Phosphine See Hydrogen phosphide
Phosphamidon (061) 1965 (T), 1966 (T), 1968 (T,R), 1969 (R), 1972 (R), 1974 (R), 1982 (T), 1985 (T), 1986 (T)
Phoxim (141) 1982 (T), 1983 (R), 1984 (T,R), 1986 (R), 1987 (R), 1988 (R)
Picoxystrobin (258) 2012 (T,R), 2013 (R)
Piperonyl butoxide (062) 1965 (T,R), 1966 (T,R), 1967 (R), 1969 (R), 1972 (T,R), 1992 (T,R), 1995 (T), 2001 (R), 2002 (R)
Pirimicarb (101) 1976 (T,R), 1978 (T,R), 1979 (R), 1981 (T,R), 1982 (T), 1985 (R), 2004 (T), 2006 (R)
Pirimiphos-methyl (086) 1974 (T,R), 1976 (T,R), 1977 (R), 1979 (R), 1983 (R), 1985 (R), 1992 (T), 1994 (R), 2003 (R), 2004 (R, corr. to 2003 report), 2006 (T)
Prochloraz (142) 1983 (T,R), 1985 (R), 1987 (R), 1988 (R), 1989 (R), 1990 (R), 1991 (corr. to 1990 report, Annex I, and R evaluation), 1992 (R), 2001 (T), 2004 (R), 2009 (R)
Procymidone(136) 1981 (R), 1982 (T), 1989 (T,R), 1990 (R), 1991 (corr. to 1990 Annex I), 1993 (R), 1998 (R), 2007 (T)
Profenofos (171) 1990 (T,R), 1992 (R), 1994 (R), 1995 (R), 2007 (T), 2008 (R), 2011 (R)
Propamocarb (148) 1984 (T,R), 1986 (T,R), 1987 (R), 2005 (T), 2006 (R), 2014 (R)
Propargite (113) 1977 (T,R), 1978 (R), 1979 (R), 1980 (T,R), 1982 (T,R), 1999 (T), 2002 (R), 2006 (R)
Propham (183) 1965 (T), 1992 (T,R)
Propiconazole (160) 1987 (T,R), 1991 (R), 1994 (R), 2004 (T), 2006 (R), 2007 (R), 2013 (R), 2014 (R), 2015 (R)
Propineb 1977 (T,R), 1980 (T), 1983 (T), 1984 (R), 1985 (T,R), 1993 (T,R), 2004 (R)
Propoxur (075) 1973 (T,R), 1977 (R), 1981 (R), 1983 (R), 1989 (T), 1991 (R), 1996 (R)
Propylene oxide (250) 2011 (T,R)
Propylenethiourea (PTU, 150) 1993 (T,R), 1994 (R), 1999 (T)
Prothioconazole (232) 2008 (T,R), 2009 (R), 2014 (R)
Pymetrozine (279) 2014 (T,R)
Pyraclostrobin (210) 2003 (T), 2004 (R), 2006 (R), 2011 (R), 2012 (R), 2014 (R)
Pyrazophos (153) 1985 (T,R), 1987 (R), 1992 (T,R), 1993 (R)

Annex 2 59
59
Pyrethrins (063) 1965 (T), 1966 (T,R), 1967 (R), 1968 (R), 1969 (R), 1970 (T), 1972 (T,R), 1974 (R), 1999 (T), 2000 (R), 2003 (T,R), 2005 (R)
Pyrimethanil (226) 2007 (T,R), 2013 (R)
Pyriproxyfen (200) 1999 (R,T), 2000 (R), 2001 (T)
Quinclorac (287) 2015 (T, R)
Quinoxyfen (223) 2006 (T,R)
Quintozene (064) 1969 (T,R), 1973 (T,R), 1974 (R), 1975 (T,R), 1976 (Annex I, corr. to 1975 R evaluation), 1977 (T,R), 1995 (T,R), 1998 (R)
Saflufenacil (251) 2011 (T,R)
Sedaxane (259) 2012 (T,R), 2014 (R)
Spices 2004 (R), 2005 (R), 2007 (R), 2010 (R), 2015 (R)
Spinetoram (233) 2008 (T,R), 2012 (R)
Spinosad (203) 2001 (T,R), 2004 (R), 2008 (R), 2011 (R)
Spirodiclofen (237) 2009 (T,R)
Spirotetramat (234) 2008 (T,R), 2011 (R), 2012 (R), 2013 (R), 2015 (R)
Sulfoxaflor (252) 2011 (T,R), 2013 (R), 2014 (R)
Sulfuryl fluoride (218) 2005 (T,R)
2,4,5-T (121) 1970 (T,R), 1979 (T,R), 1981 (T)
Tebuconazole (189) 1994 (T,R), 1996 (corr. to Annex II of 1995 report), 1997 (R), 2008 (R), 2010 (T), 2011 (R), 2015 (R)
Tebufenozide (196) 1996 (T,R), 1997 (R), 1999 (R), 2001 (T,R), 2003 (T)
Tecnazine (115) 1974 (T,R), 1978 (T,R), 1981 (R), 1983 (T), 1987 (R), 1989 (R), 1994 (T,R)
Teflubenzuron (190) 1994 (T), 1996 (R)
Temephos 2006 (T)
Terbufos (167) 1989 (T,R), 1990 (T,R), 2003 (T), 2005 (R)
Thiabendazole (065) 1970 (T,R), 1971 (R), 1972 (R), 1975 (R), 1977 (T,R), 1979 (R), 1981 (R), 1997 (R), 2000 (R), 2006 (T,R)
Thiacloprid (223) 2006 (T,R)
Thiamethoxam (245) 2010 (T,R), 2011 (R), 2012 (R), 2014 (R)
Thiodicarb (154) 1985 (T,R), 1986 (T), 1987 (R), 1988 (R), 2000 (T),
2001 (R)
Thiometon (076) 1969 (T,R), 1973 (T,R), 1976 (R), 1979 (T,R), 1988 (R)

60 Annex 2
60
Thiophanate-methyl (077) 1973 (T,R), 1975 (T,R), 1977 (T), 1978 (R), 1988 (R), 2002 (R), 1990 (R), 1994 (R), 1995 (T,E), 1998 (T,R), 2006 (T)
Thiram (105) See Dithiocarbamates, 1965 (T), 1967 (T,R), 1970 (T,R), 1974 (T), 1977 (T), 1983 (R), 1984 (R), 1985 (T,R), 1987 (T), 1988 (R), 1989 (R), 1992 (T), 1996 (R)
Tolclofos-methyl (191) 1994 (T,R), 1996 (corr. to Annex II of 1995 report)
Tolfenpyrad (269) 2013 (T)
Tolylfluanid (162) 1988 (T,R), 1990 (R), 1991 (corr. to 1990 report), 2002 (T,R), 2003 (R)
Toxaphene See Camphechlor
Triadimefon (133) 1979 (R), 1981 (T,R), 1983 (T,R), 1984 (R), 1985 (T,R), 1986 (R), 1987 (R and corr. to 1986 R evaluation), 1988 (R), 1989 (R), 1992 (R), 1995 (R), 2004 (T), 2007 (R)
Triadimenol (168) 1989 (T,R), 1992 (R), 1995 (R), 2004 (T), 2007 (R), 2014 (R)
Triazolylalanine 1989 (T,R)
Triazophos (143) 1982 (T), 1983 (R), 1984 (corr. to 1983 report, Annex I), 1986 (T,R), 1990 (R), 1991 (T and corr. to 1990 R evaluation), 1992 (R), 1993 (T,R), 2002 (T), 2007 (R), 2010 (R), 2013 (R)
Trichlorfon (066) 1971 (T,R), 1975 (T,R), 1978 (T,R), 1987 (R)
Trichloronat 1971 (T,R)
Trichloroethylene 1968 (R)
Tricyclohexyltin hydroxide See Cyhexatin
Trifloxystrobin (213) 2004 (T,R), 2012 (R), 2015 (R)
Triflumizole (270) 2013 (T,R)
Triforine (116) 1977 (T), 1978 (T,R), 1997 (T), 2004 (R), 2014 (T,R)
Trinexapac-ethyl (271) 2013 (T,R)
Triphenyltin compounds See Fentin compounds
Vamidothion (078) 1973 (T,R), 1982 (T), 1985 (T,R), 1987 (R), 1988 (T), 1990 (R), 1992 (R)
Vinclozolin (159) 1986 (T,R), 1987 (R and corr. to 1986 report and R evaluation), 1988 (T,R), 1989 (R), 1990 (R), 1992 (R), 1995 (T)
Zineb (105) See Dithiocarbamates, 1965 (T), 1967 (T,R), 1993 (T)
Ziram (105) See Dithiocarbamates, 1965 (T), 1967 (T,R), 1996 (T,R)
Zoxamide (227) 2007 (T,R), 2009 (R)

Annex 3
61 ANNEX 3: INTERNATIONAL ESTIMATED DAILY INTAKES OF PESTICIDE RESIDUES
DIAZINON
DIAZINON (22)
International Estimated Daily Intake (IEDI) ADI = 0–0.003 mg/kg bw
STMR
mg/kg
Diets as g/person/day Intake as µg/person/day
Codex code Commodity description
Expr as
G01 diet
G01 intake
G02 diet
G02 intake
G03 diet
G03 intake
G04 diet
G04 intake
G05 diet
G05 intake
G06 diet
G06 intake
FP 0009
Pome fruit, raw (incl apple juice, excl cider)
RAC 0.04 19.69 0.79 38.08 1.52 3.43 0.14 32.35 1.29 7.98 0.32 64.35 2.57
JF 0226
Apple juice, single strength (incl concentrated)
PP 0.0004 0.32 0.00 3.07 0.00 0.10 0.00 5.00 0.00 0.29 0.00 5.57 0.00
FS 0013
Cherries, raw RAC 1 0.92 0.92 9.15 9.15 0.10 0.10 0.61 0.61 0.10 0.10 6.64 6.64
FS 0014
Plums, raw (incl dried plums, incl Chinese jujube)
RAC 1 2.67 2.67 8.77 8.77 0.10 0.10 3.03 3.03 0.70 0.70 4.34 4.34
DF 0014
Plum, dried (prunes) PP 2 0.10 0.20 0.10 0.20 0.10 0.20 0.18 0.36 0.10 0.20 0.10 0.20
- Peaches and nectarines, raw RAC 0.2 2.87 0.57 2.21 0.44 0.15 0.03 5.94 1.19 1.47 0.29 15.66 3.13
FB 0264
Blackberries, raw RAC 0.1 0.35 0.04 0.11 0.01 0.10 0.01 0.10 0.01 0.10 0.01 1.23 0.12
FB 0266
Dewberries, incl boysen- & loganberry, raw
RAC 0.1 0.10 0.01 0.10 0.01 0.10 0.01 0.10 0.01 0.10 0.01 0.10 0.01
FB 0272
Raspberries, red, black, raw RAC 0.2 0.10 0.02 0.93 0.19 0.10 0.02 0.10 0.02 0.10 0.02 0.10 0.02
FB 0021
Currants, red, black, white, raw RAC 0.2 0.10 0.02 0.74 0.15 0.10 0.02 0.10 0.02 0.10 0.02 0.10 0.02
FB 0265
Cranberries, raw RAC 0.05 0.10 0.01 0.10 0.01 NC - 0.10 0.01 0.10 0.01 0.10 0.01
FB Strawberry, raw RAC 0.1 0.70 0.07 2.01 0.20 0.10 0.01 1.36 0.14 0.37 0.04 2.53 0.25

Annex 3
62
DIAZINON (22)
International Estimated Daily Intake (IEDI) ADI = 0–0.003 mg/kg bw
STMR
mg/kg
Diets as g/person/day Intake as µg/person/day
Codex code Commodity description
Expr as
G01 diet
G01 intake
G02 diet
G02 intake
G03 diet
G03 intake
G04 diet
G04 intake
G05 diet
G05 intake
G06 diet
G06 intake
0275
FI 0353
Pineapple, raw (incl canned pineapple, incl pineapple juice, incl dried pineapple)
RAC 0.1 0.61 0.06 1.56 0.16 7.89 0.79 9.36 0.94 8.76 0.88 1.30 0.13
FI 0341
Kiwi fruit, raw RAC 0.2 0.10 0.02 0.36 0.07 0.10 0.02 1.17 0.23 0.10 0.02 0.69 0.14
- Onions, mature bulbs, dry RAC 0.05 29.36 1.47 37.50 1.88 3.56 0.18 34.78 1.74 18.81 0.94 43.38 2.17
- Onions, green, raw RAC 1 2.45 2.45 1.49 1.49 1.02 1.02 2.60 2.60 0.60 0.60 2.03 2.03
VB 0041
Cabbages, head, raw RAC 0.01 2.73 0.03 27.92 0.28 0.55 0.01 4.47 0.04 4.27 0.04 10.25 0.10
VB 0400
Broccoli, raw RAC 0.5 0.88 0.44 0.17 0.09 0.10 0.05 1.25 0.63 3.00 1.50 1.09 0.55
VB 0405
Kohlrabi, raw RAC 0.2 0.10 0.02 0.89 0.18 0.10 0.02 0.14 0.03 NC - 0.33 0.07
VC 0046
Melons, raw (excl watermelons) RAC 0.2 8.90 1.78 8.64 1.73 0.80 0.16 17.90 3.58 2.80 0.56 29.17 5.83
VC 0424
Cucumber, raw RAC 0.1 8.01 0.80 30.66 3.07 1.45 0.15 19.84 1.98 0.27 0.03 34.92 3.49
VC 0431
Squash, summer, raw (= courgette, zucchini)
RAC 0.05 0.78 0.04 2.06 0.10 0.30 0.02 1.61 0.08 2.25 0.11 2.36 0.12
VO 0445
Peppers, sweet, raw (incl dried) RAC 0.05 4.49 0.22 6.44 0.32 7.21 0.36 5.68 0.28 9.52 0.48 8.92 0.45
VO 0447
Sweet corn on the cob, raw (incl frozen, incl canned) (i.e. kernels plus cob without husks)
RAC 0.02 0.14 0.00 0.94 0.02 5.70 0.11 2.61 0.05 1.94 0.04 0.22 0.00
VO 0448
Tomato, raw (incl juice, incl paste, incl canned)
RAC 0.12 51.75 6.21 81.80 9.82 16.99 2.04 102.02 12.24 26.32 3.16 214.77 25.77
VL 0480
Kale, raw (i.e. collards) (i.e. Brassica) RAC 0.05 0.57 0.03 5.77 0.29 0.11 0.01 0.92 0.05 5.25 0.26 2.12 0.11

Annex 3
63
DIAZINON (22)
International Estimated Daily Intake (IEDI) ADI = 0–0.003 mg/kg bw
STMR
mg/kg
Diets as g/person/day Intake as µg/person/day
Codex code Commodity description
Expr as
G01 diet
G01 intake
G02 diet
G02 intake
G03 diet
G03 intake
G04 diet
G04 intake
G05 diet
G05 intake
G06 diet
G06 intake
VL 0482
Lettuce, head, raw RAC 0.5 NC - NC - NC - NC - NC - NC -
VL 0483
Lettuce, leaf, raw RAC 0.5 0.53 0.27 0.36 0.18 0.16 0.08 6.21 3.11 1.90 0.95 6.05 3.03
VL 0502
Spinach, raw RAC 0.5 0.74 0.37 0.22 0.11 0.10 0.05 0.91 0.46 0.10 0.05 2.92 1.46
- Chinese cabbage flowering stalk, raw RAC 0.05 NC - NC - NC - NC - NC - NC -
VP 0062
Beans, green, without pods, raw: beans except broad bean & soya bean (i.e. immature seeds only) (Phaseolus spp)
RAC 0.2 1.56 0.31 0.60 0.12 0.49 0.10 1.18 0.24 0.90 0.18 7.79 1.56
VP 0064
Peas, green, without pods, raw (i.e. immature seeds only) (Pisum spp)
RAC 0.2 1.97 0.39 0.51 0.10 0.10 0.02 0.79 0.16 3.68 0.74 3.80 0.76
VR 0494
Radish roots, raw RAC 0.1 2.31 0.23 4.09 0.41 2.53 0.25 6.15 0.62 5.88 0.59 2.97 0.30
VR 0577
Carrots, raw RAC 0.5 9.51 4.76 30.78 15.39 0.37 0.19 8.75 4.38 2.80 1.40 6.10 3.05
VR 0589
Potato, raw (incl flour, incl frozen, incl starch, incl tapioca)
RAC 0.01 59.74 0.60 316.14 3.16 9.78 0.10 60.26 0.60 54.12 0.54 119.82 1.20
VR 0589
Potato, raw (incl flour, incl frozen, incl tapioca, excl starch)
RAC 0 59.60 0.00 316.10 0.00 9.77 0.00 59.59 0.00 54.12 0.00 119.82 0.00
VR 0596
Sugar beet, raw (incl sugar) RAC 0.1 0.13 0.01 NC - 0.10 0.01 0.66 0.07 0.47 0.05 88.94 8.89
GC 0645
Maize, raw (incl glucose & dextrose & isoglucose, incl flour, incl oil, incl beer, incl germ, incl starch)
RAC 0 29.81 0.00 44.77 0.00 108.95 0.00 52.37 0.00 60.28 0.00 75.69 0.00
TN 0660
Almonds, nutmeat RAC 0.05 1.38 0.07 0.10 0.01 0.10 0.01 1.00 0.05 0.10 0.01 0.81 0.04
TN 0678
Walnuts, nutmeat RAC 0 0.23 0.00 1.49 0.00 0.10 0.00 0.33 0.00 0.10 0.00 2.06 0.00

Annex 3
64
DIAZINON (22)
International Estimated Daily Intake (IEDI) ADI = 0–0.003 mg/kg bw
STMR
mg/kg
Diets as g/person/day Intake as µg/person/day
Codex code Commodity description
Expr as
G01 diet
G01 intake
G02 diet
G02 intake
G03 diet
G03 intake
G04 diet
G04 intake
G05 diet
G05 intake
G06 diet
G06 intake
DH 1100
Hops, dry RAC 0.5 0.10 0.05 0.10 0.05 0.10 0.05 0.10 0.05 NC - 0.10 0.05
MM 0095
MEAT FROM MAMMALS other than marine mammals, raw (incl prepared meat) - 80% as muscle
RAC 0.02 24.96 0.50 57.95 1.16 16.70 0.33 38.38 0.77 26.46 0.53 29.00 0.58
MM 0095
MEAT FROM MAMMALS other than marine mammals, raw (incl prepared meat) - 20% as fat
RAC 0.3 6.24 1.87 14.49 4.35 4.18 1.25 9.60 2.88 6.62 1.98 7.25 2.18
MO 0105
Edible offal (mammalian), raw RAC 0.01 4.79 0.05 9.68 0.10 2.97 0.03 5.49 0.05 3.84 0.04 5.03 0.05
ML 0106
Milks, raw or skimmed (incl dairy products)
RAC 0.02 289.65 5.79 485.88 9.72 26.92 0.54 239.03 4.78 199.91 4.00 180.53 3.61
PM 0110
Poultry meat, raw (incl prepared) RAC 0.02 14.63 0.29 29.76 0.60 8.04 0.16 129.68 2.59 25.04 0.50 35.66 0.71
PO 0111
Poultry edible offal, raw (incl prepared)
RAC 0.02 0.12 0.00 0.12 0.00 0.11 0.00 5.37 0.11 0.24 0.00 0.10 0.00
PE 0840
Chicken eggs, raw (incl dried) RAC 0.02 7.78 0.16 22.75 0.46 2.84 0.06 14.86 0.30 9.70 0.19 14.82 0.30
Total intake (µg/person) =
34.6
76.0
8.8 52.4 22.1 86.0
Body weight per region (kg bw) =
60
60
60
60
60
60
ADI (µg/person) =
180
180
180
180
180
180
%ADI =
19.2%
42.2%
4.9%
29.1%
12.3%
47.8%
Rounded %ADI =
20%
40%
5%
30%
10%
50%

Annex 3
65
DIAZINON (22)
International Estimated Daily Intake (IEDI) ADI = 0–0.003 mg/kg bw
STMR
mg/kg
Diets as g/person/day Intake as µg/person/day
Codex code Commodity description
Expr as
G07 diet
G07 intake
G08 diet
G08 intake
G09 diet
G09 intake
G10 diet
G10 intake
G11 diet
G11 intake
G12 diet
G12 intake
FP 0009
Pome fruit, raw (incl apple juice, excl cider)
RAC 0.04 57.68 2.31 74.45 2.98 37.84 1.51 58.40 2.34 103.51 4.14 11.20 0.45
JF 0226
Apple juice, single strength (incl concentrated)
PP 0.0004 14.88 0.01 11.98 0.00 0.15 0.00 9.98 0.00 30.32 0.01 3.47 0.00
FS 0013
Cherries, raw RAC 1 1.40 1.40 4.21 4.21 0.10 0.10 2.93 2.93 1.50 1.50 NC -
FS 0014
Plums, raw (incl dried plums, incl Chinese jujube)
RAC 1 5.55 5.55 4.37 4.37 6.08 6.08 3.66 3.66 3.93 3.93 0.46 0.46
DF 0014
Plum, dried (prunes) PP 2 0.61 1.22 0.35 0.70 0.10 0.20 0.35 0.70 0.49 0.98 0.13 0.26
- Peaches and nectarines, raw RAC 0.2 8.76 1.75 12.98 2.60 8.23 1.65 10.09 2.02 3.64 0.73 0.10 0.02
FB 0264
Blackberries, raw RAC 0.1 0.10 0.01 0.52 0.05 0.14 0.01 0.24 0.02 NC - 0.10 0.01
FB 0266
Dewberries, incl boysen- & loganberry, raw
RAC 0.1 0.10 0.01 NC - 0.10 0.01 0.10 0.01 NC - 0.10 0.01
FB 0272
Raspberries, red, black, raw RAC 0.2 0.47 0.09 0.91 0.18 0.10 0.02 0.99 0.20 1.14 0.23 NC -
FB 0021
Currants, red, black, white, raw RAC 0.2 0.48 0.10 4.23 0.85 NC - 1.51 0.30 0.49 0.10 NC -
FB 0265
Cranberries, raw RAC 0.05 0.10 0.01 0.10 0.01 0.10 0.01 1.22 0.06 0.11 0.01 NC -
FB 0275
Strawberry, raw RAC 0.1 4.49 0.45 5.66 0.57 0.10 0.01 6.63 0.66 5.75 0.58 0.10 0.01
FI 0353 Pineapple, raw (incl canned pineapple, incl pineapple juice, incl dried pineapple)
RAC 0.1 13.13 1.31 11.13 1.11 6.94 0.69 14.36 1.44 36.74 3.67 18.81 1.88
FI 0341 Kiwi fruit, raw RAC 0.2 2.46 0.49 3.62 0.72 0.10 0.02 1.48 0.30 7.43 1.49 0.10 0.02
- Onions, mature bulbs, dry RAC 0.05 19.69 0.98 29.83 1.49 24.64 1.23 31.35 1.57 9.72 0.49 12.59 0.63
- Onions, green, raw RAC 1 1.55 1.55 0.74 0.74 1.05 1.05 3.74 3.74 0.94 0.94 6.45 6.45

Annex 3
66 DIAZINON (22)
International Estimated Daily Intake (IEDI) ADI = 0–0.003 mg/kg bw
STMR
mg/kg
Diets as g/person/day Intake as µg/person/day
Codex code Commodity description
Expr as
G07 diet
G07 intake
G08 diet
G08 intake
G09 diet
G09 intake
G10 diet
G10 intake
G11 diet
G11 intake
G12 diet
G12 intake
VB 0041
Cabbages, head, raw RAC 0.01 8.97 0.09 27.12 0.27 1.44 0.01 24.96 0.25 4.55 0.05 11.23 0.11
VB 0400
Broccoli, raw RAC 0.5 4.24 2.12 1.76 0.88 NC - 0.51 0.26 3.79 1.90 0.26 0.13
VB 0405
Kohlrabi, raw RAC 0.2 NC - 3.25 0.65 NC - NC - 0.10 0.02 0.36 0.07
VC 0046
Melons, raw (excl watermelons) RAC 0.2 9.20 1.84 11.95 2.39 14.63 2.93 8.99 1.80 7.86 1.57 2.46 0.49
VC 0424
Cucumber, raw RAC 0.1 6.72 0.67 11.03 1.10 32.10 3.21 15.10 1.51 4.05 0.41 9.57 0.96
VC 0431
Squash, summer, raw (= courgette, zucchini)
RAC 0.05 NC - NC - 5.48 0.27 NC - NC - 1.03 0.05
VO 0445
Peppers, sweet, raw (incl dried) RAC 0.05 0.82 0.04 1.53 0.08 10.85 0.54 4.59 0.23 1.84 0.09 2.00 0.10
VO 0447
Sweet corn on the cob, raw (incl frozen, incl canned) (i.e. kernels plus cob without husks)
RAC 0.02 11.43 0.23 3.71 0.07 0.74 0.01 13.63 0.27 3.07 0.06 1.50 0.03
VO 0448
Tomato, raw (incl juice, incl paste, incl canned)
RAC 0.12 64.74 7.77 68.31 8.20 36.05 4.33 82.09 9.85 54.50 6.54 11.69 1.40
VL 0480
Kale, raw (i.e. collards) (i.e. Brassica) RAC 0.05 NC - NC - 14.54 0.73 NC - NC - 2.32 0.12
VL 0482
Lettuce, head, raw RAC 0.5 NC - NC - NC - NC - NC - NC -
VL 0483
Lettuce, leaf, raw RAC 0.5 14.50 7.25 11.76 5.88 13.14 6.57 19.50 9.75 4.81 2.41 2.23 1.12
VL 0502
Spinach, raw RAC 0.5 2.20 1.10 1.76 0.88 13.38 6.69 2.94 1.47 5.53 2.77 0.10 0.05
- Chinese cabbage flowering stalk, raw RAC 0.05 NC - NC - NC - NC - NC - NC -
VP Beans, green, without pods, raw: beans RAC 0.2 2.21 0.44 5.25 1.05 4.17 0.83 1.61 0.32 16.95 3.39 0.17 0.03

Annex 3
67 DIAZINON (22)
International Estimated Daily Intake (IEDI) ADI = 0–0.003 mg/kg bw
STMR
mg/kg
Diets as g/person/day Intake as µg/person/day
Codex code Commodity description
Expr as
G07 diet
G07 intake
G08 diet
G08 intake
G09 diet
G09 intake
G10 diet
G10 intake
G11 diet
G11 intake
G12 diet
G12 intake
0062 except broad bean & soya bean (i.e. immature seeds only) (Phaseolus spp)
VP 0064
Peas, green, without pods, raw (i.e. immature seeds only) (Pisum spp)
RAC 0.2 10.72 2.14 1.99 0.40 2.72 0.54 4.26 0.85 4.23 0.85 NC -
VR 0494
Radish roots, raw RAC 0.1 3.83 0.38 11.99 1.20 NC - 5.26 0.53 2.19 0.22 4.37 0.44
VR 0577
Carrots, raw RAC 0.5 26.26 13.13 27.13 13.57 10.07 5.04 16.49 8.25 44.69 22.35 8.75 4.38
VR 0589
Potato, raw (incl flour, incl frozen, incl starch, incl tapioca)
RAC 0.01 225.03 2.25 234.24 2.34 71.48 0.71 177.55 1.78 234.55 2.35 37.71 0.38
VR 0589
Potato, raw (incl flour, incl frozen, incl tapioca, excl starch)
RAC 0 225.03 0.00 226.35 0.00 71.26 0.00 173.36 0.00 234.55 0.00 37.71 0.00
VR 0596
Sugar beet, raw (incl sugar) RAC 0.1 0.10 0.01 NC - 0.10 0.01 0.10 0.01 NC - NC -
GC 0645
Maize, raw (incl glucose & dextrose & isoglucose, incl flour, incl oil, incl beer, incl germ, incl starch)
RAC 0 18.51 0.00 26.18 0.00 26.04 0.00 39.99 0.00 7.36 0.00 64.58 0.00
TN 0660
Almonds, nutmeat RAC 0.05 0.81 0.04 2.21 0.11 0.10 0.01 1.02 0.05 1.47 0.07 NC -
TN 0678
Walnuts, nutmeat RAC 0 0.34 0.00 0.84 0.00 0.28 0.00 0.39 0.00 0.45 0.00 NC -
DH 1100
Hops, dry RAC 0.5 NC - NC - 0.10 0.05 0.10 0.05 NC - NC -
MM 0095
MEAT FROM MAMMALS other than marine mammals, raw (incl prepared meat) - 80% as muscle
RAC 0.02 112.02 2.24 120.71 2.41 63.46 1.27 88.99 1.78 96.24 1.92 41.02 0.82
MM 0095
MEAT FROM MAMMALS other than marine mammals, raw (incl prepared meat) - 20% as fat
RAC 0.3 28.01 8.40 30.18 9.05 15.86 4.76 22.25 6.67 24.06 7.22 10.25 3.08
MO Edible offal (mammalian), raw RAC 0.01 15.17 0.15 5.19 0.05 6.30 0.06 6.78 0.07 3.32 0.03 3.17 0.03
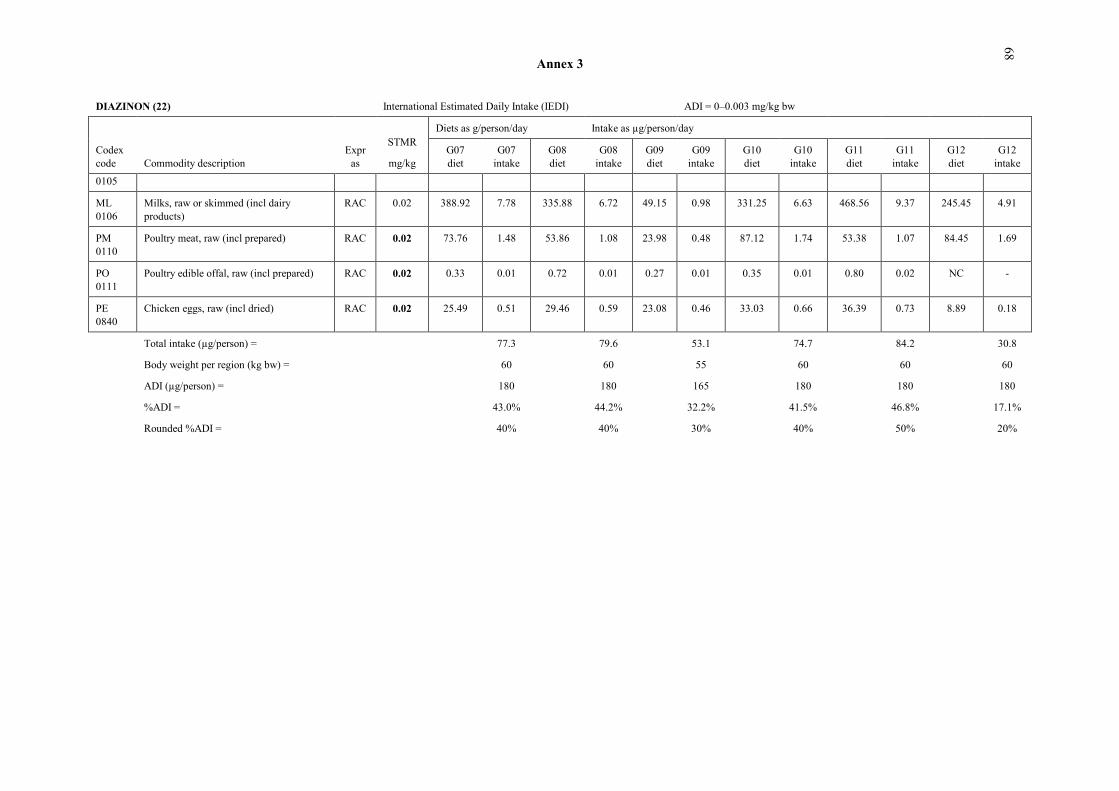
Annex 3
68 DIAZINON (22)
International Estimated Daily Intake (IEDI) ADI = 0–0.003 mg/kg bw
STMR
mg/kg
Diets as g/person/day Intake as µg/person/day
Codex code Commodity description
Expr as
G07 diet
G07 intake
G08 diet
G08 intake
G09 diet
G09 intake
G10 diet
G10 intake
G11 diet
G11 intake
G12 diet
G12 intake
0105
ML 0106
Milks, raw or skimmed (incl dairy products)
RAC 0.02 388.92 7.78 335.88 6.72 49.15 0.98 331.25 6.63 468.56 9.37 245.45 4.91
PM 0110
Poultry meat, raw (incl prepared) RAC 0.02 73.76 1.48 53.86 1.08 23.98 0.48 87.12 1.74 53.38 1.07 84.45 1.69
PO 0111
Poultry edible offal, raw (incl prepared) RAC 0.02 0.33 0.01 0.72 0.01 0.27 0.01 0.35 0.01 0.80 0.02 NC -
PE 0840
Chicken eggs, raw (incl dried) RAC 0.02 25.49 0.51 29.46 0.59 23.08 0.46 33.03 0.66 36.39 0.73 8.89 0.18
Total intake (µg/person) =
77.3 79.6 53.1 74.7 84.2 30.8
Body weight per region (kg bw) =
60
60
55
60
60
60
ADI (µg/person) =
180
180
165
180
180
180
%ADI =
43.0%
44.2%
32.2%
41.5%
46.8%
17.1%
Rounded %ADI =
40%
40%
30%
40%
50%
20%

Annex 3
69
DIAZINON (22)
International Estimated Daily Intake (IEDI) ADI = 0–0.003 mg/kg bw
STMR
mg/kg
Diets as g/person/day Intake as µg/person/day
Codex code Commodity description Expr as
G13 diet
G13 intake
G14 diet
G14 intake
G15 diet
G15 intake
G16 diet
G16 intake
G17 diet
G17 intake
FP 0009 Pome fruit, raw (incl apple juice, excl cider) RAC 0.04 2.43 0.10 11.06 0.44 79.27 3.17 1.64 0.07 19.56 0.78
JF 0226 Apple juice, single strength (incl concentrated)
PP 0.0004 0.10 0.00 0.10 0.00 7.19 0.00 0.10 0.00 NC -
FS 0013 Cherries, raw RAC 1 0.10 0.10 0.10 0.10 5.96 5.96 0.10 0.10 NC -
FS 0014 Plums, raw (incl dried plums, incl Chinese jujube)
RAC 1 0.10 0.10 0.10 0.10 16.65 16.65 0.10 0.10 NC -
DF 0014 Plum, dried (prunes) PP 2 0.10 0.20 0.10 0.20 0.37 0.74 0.10 0.20 NC -
- Peaches and nectarines, raw RAC 0.2 0.10 0.02 0.10 0.02 7.47 1.49 0.10 0.02 NC -
FB 0264 Blackberries, raw RAC 0.1 0.10 0.01 7.29 0.73 0.25 0.03 0.10 0.01 NC -
FB 0266 Dewberries, incl boysen- & loganberry, raw RAC 0.1 0.10 0.01 0.10 0.01 NC - 0.10 0.01 NC -
FB 0272 Raspberries, red, black, raw RAC 0.2 0.10 0.02 0.10 0.02 2.04 0.41 0.10 0.02 NC -
FB 0021 Currants, red, black, white, raw RAC 0.2 0.10 0.02 NC - 0.74 0.15 NC - NC -
FB 0265 Cranberries, raw RAC 0.05 NC - NC - 0.10 0.01 NC - NC -
FB 0275 Strawberry, raw RAC 0.1 0.10 0.01 0.10 0.01 3.35 0.34 0.10 0.01 0.10 0.01
FI 0353 Pineapple, raw (incl canned pineapple, incl pineapple juice, incl dried pineapple)
RAC 0.1 8.51 0.85 6.27 0.63 6.89 0.69 0.18 0.02 24.94 2.49
FI 0341 Kiwi fruit, raw RAC 0.2 0.10 0.02 0.10 0.02 2.00 0.40 0.10 0.02 NC -
- Onions, mature bulbs, dry RAC 0.05 9.01 0.45 20.24 1.01 30.90 1.55 9.61 0.48 2.11 0.11
- Onions, green, raw RAC 1 1.43 1.43 0.10 0.10 0.20 0.20 NC - 6.30 6.30
VB 0041 Cabbages, head, raw RAC 0.01 3.82 0.04 2.99 0.03 49.16 0.49 0.10 0.00 NC -
VB 0400 Broccoli, raw RAC 0.5 0.10 0.05 0.10 0.05 2.13 1.07 0.10 0.05 NC -
VB 0405 Kohlrabi, raw RAC 0.2 0.12 0.02 0.10 0.02 1.81 0.36 0.10 0.02 NC -
VC 0046 Melons, raw (excl watermelons) RAC 0.2 0.19 0.04 0.10 0.02 4.98 1.00 0.10 0.02 NC -
VC 0424 Cucumber, raw RAC 0.1 0.68 0.07 1.81 0.18 10.40 1.04 0.10 0.01 0.10 0.01

Annex 3
70 DIAZINON (22)
International Estimated Daily Intake (IEDI) ADI = 0–0.003 mg/kg bw
STMR
mg/kg
Diets as g/person/day Intake as µg/person/day
Codex code Commodity description Expr as
G13 diet
G13 intake
G14 diet
G14 intake
G15 diet
G15 intake
G16 diet
G16 intake
G17 diet
G17 intake
VC 0431 Squash, summer, raw (= courgette, zucchini) RAC 0.05 0.10 0.01 1.01 0.05 NC - 1.91 0.10 NC -
VO 0445 Peppers, sweet, raw (incl dried) RAC 0.05 5.49 0.27 10.57 0.53 8.84 0.44 0.91 0.05 NC -
VO 0447 Sweet corn on the cob, raw (incl frozen, incl canned) (i.e. kernels plus cob without husks)
RAC 0.02 3.63 0.07 20.50 0.41 8.78 0.18 0.10 0.00 0.17 0.00
VO 0448 Tomato, raw (incl juice, incl paste, incl canned)
RAC 0.12 15.50 1.86 5.78 0.69 71.52 8.58 2.00 0.24 12.50 1.50
VL 0480 Kale, raw (i.e. collards) (i.e. Brassica) RAC 0.05 0.79 0.04 0.62 0.03 NC - 0.10 0.01 NC -
VL 0482 Lettuce, head, raw RAC 0.5 NC - NC - NC - NC - NC -
VL 0483 Lettuce, leaf, raw RAC 0.5 0.29 0.15 0.10 0.05 6.71 3.36 0.10 0.05 NC -
VL 0502 Spinach, raw RAC 0.5 0.17 0.09 0.10 0.05 0.81 0.41 0.10 0.05 NC -
- Chinese cabbage flowering stalk, raw RAC 0.05 NC - NC - NC - NC - NC -
VP 0062 Beans, green, without pods, raw: beans except broad bean & soya bean (i.e. immature seeds only) (Phaseolus spp)
RAC 0.2 0.30 0.06 3.13 0.63 4.11 0.82 0.10 0.02 NC -
VP 0064 Peas, green, without pods, raw (i.e. immature seeds only) (Pisum spp)
RAC 0.2 0.21 0.04 0.10 0.02 5.51 1.10 0.10 0.02 NC -
VR 0494 Radish roots, raw RAC 0.1 3.96 0.40 2.86 0.29 3.30 0.33 2.67 0.27 5.34 0.53
VR 0577 Carrots, raw RAC 0.5 2.07 1.04 3.00 1.50 25.29 12.65 0.10 0.05 NC -
VR 0589 Potato, raw (incl flour, incl frozen, incl starch, incl tapioca)
RAC 0.01 23.96 0.24 13.56 0.14 213.41 2.13 104.35 1.04 8.56 0.09
VR 0589 Potato, raw (incl flour, incl frozen, incl tapioca, excl starch)
RAC 0 23.96 0.00 13.54 0.00 213.41 0.00 104.35 0.00 8.56 0.00
VR 0596 Sugar beet, raw (incl sugar) RAC 0.1 3.93 0.39 1.68 0.17 NC - NC - 36.12 3.61
GC 0645 Maize, raw (incl glucose & dextrose & isoglucose, incl flour, incl oil, incl beer, incl germ, incl starch)
RAC 0 116.66 0.00 10.52 0.00 38.46 0.00 76.60 0.00 34.44 0.00
TN 0660 Almonds, nutmeat RAC 0.05 0.10 0.01 0.10 0.01 0.61 0.03 0.10 0.01 NC -

Annex 3
71 DIAZINON (22)
International Estimated Daily Intake (IEDI) ADI = 0–0.003 mg/kg bw
STMR
mg/kg
Diets as g/person/day Intake as µg/person/day
Codex code Commodity description Expr as
G13 diet
G13 intake
G14 diet
G14 intake
G15 diet
G15 intake
G16 diet
G16 intake
G17 diet
G17 intake
TN 0678 Walnuts, nutmeat RAC 0 0.10 0.00 0.10 0.00 0.81 0.00 0.10 0.00 NC -
DH 1100 Hops, dry RAC 0.5 NC - NC - 0.10 0.05 NC - NC -
MM 0095
MEAT FROM MAMMALS other than marine mammals, raw (incl prepared meat) - 80% as muscle
RAC 0.02 23.34 0.47 40.71 0.81 97.15 1.94 18.06 0.36 57.71 1.15
MM 0095
MEAT FROM MAMMALS other than marine mammals, raw (incl prepared meat) - 20% as fat
RAC 0.3 5.84 1.75 10.18 3.05 24.29 7.29 4.52 1.35 14.43 4.33
MO 0105
Edible offal (mammalian), raw RAC 0.01 4.64 0.05 1.97 0.02 10.01 0.10 3.27 0.03 3.98 0.04
ML 0106 Milks, raw or skimmed (incl dairy products) RAC 0.02 108.75 2.18 70.31 1.41 436.11 8.72 61.55 1.23 79.09 1.58
PM 0110 Poultry meat, raw (incl prepared) RAC 0.02 3.92 0.08 12.03 0.24 57.07 1.14 5.03 0.10 55.56 1.11
PO 0111 Poultry edible offal, raw (incl prepared) RAC 0.02 0.10 0.00 0.70 0.01 0.97 0.02 0.10 0.00 NC -
PE 0840 Chicken eggs, raw (incl dried) RAC 0.02 3.83 0.08 4.27 0.09 26.38 0.53 1.13 0.02 7.39 0.15
Total intake (µg/person) =
12.8
13.9
85.5
6.2 23.8
Body weight per region (kg bw) =
60
60
60
60
60
ADI (µg/person) =
180
180
180
180
180
%ADI =
7.1%
7.7%
47.5%
3.4%
13.2%
Rounded %ADI =
7%
8%
50%
3%
10%

Annex 3
72 GLYPHOSATE
GLYPHOSATE (158)
International Estimated Daily Intake (IEDI) ADI = 0–1 mg/kg bw
STMR
mg/kg
Diets as g/person/day Intake as µg/person/day
Codex code Commodity description
Expr as
G01 diet
G01 intake
G02 diet
G02 intake
G03 diet
G03 intake
G04 diet
G04 intake
G05 diet
G05 intake
G06 diet
G06 intake
FI 0327 Banana, raw (incl plantains) (incl dried) RAC 0.05 5.06 0.25 6.91 0.35 37.17 1.86 31.16 1.56 40.21 2.01 18.96 0.95
VO 0447
Sweet corn on the cob, raw (incl frozen, incl canned) (i.e. kernels plus cob without husks)
RAC 0.325 0.14 0.05 0.94 0.31 5.70 1.85 2.61 0.85 1.94 0.63 0.22 0.07
VD 0071
Beans, dry, raw (Phaseolus spp) RAC 0.17 2.39 0.41 1.61 0.27 10.47 1.78 1.84 0.31 12.90 2.19 7.44 1.26
VD 0072
Peas, dry, raw (Pisum spp, Vigna spp): garden peas & field peas & cow peas
RAC 0.5 1.67 0.84 3.22 1.61 2.66 1.33 1.51 0.76 2.91 1.46 0.24 0.12
VD 0533
Lentil, dry, raw (Ervum lens) RAC 0.5 2.12 1.06 0.10 0.05 0.10 0.05 3.21 1.61 1.60 0.80 4.90 2.45
VD 0541
Soya bean, dry, raw (incl flour, incl paste, incl curd, incl sauce, excl oil)
RAC 5 0.63 3.15 1.09 5.45 0.40 2.00 1.40 7.00 1.68 8.40 0.48 2.40
OR 0541
Soya oil, refined PP 0.1 12.99 1.30 10.43 1.04 3.63 0.36 13.10 1.31 10.70 1.07 13.10 1.31
VR 0596
Sugar beet, raw RAC 3.4 NC - NC - NC - NC - 0.10 0.34 NC -
GC 0640
Barley, raw (incl malt extract, incl pot & pearled, incl flour & grits, incl beer, incl malt)
RAC 3.7 19.91 73.67 31.16 115.29 5.04 18.65 3.10 11.47 9.77 36.15 4.31 15.95
GC 0641
Buckwheat, raw (incl flour) RAC 3.7 NC - 0.40 1.48 0.10 0.37 0.10 0.37 0.10 0.37 0.10 0.37
GC 0645
Maize, raw (incl glucose & dextrose & isoglucose, incl beer, incl germ, excl flour, excl oil, excl starch)
RAC 0.12 0.84 0.10 0.24 0.03 1.56 0.19 0.46 0.06 2.44 0.29 13.13 1.58
GC 0656
Popcorn (i.e. maize used for preparation of popcorn)
RAC 0.12 - - - - - - - - - - - -
CF 1255 Maize, flour (white flour and wholemeal PP 0.13 22.72 2.95 35.61 4.63 87.27 11.35 34.92 4.54 46.71 6.07 49.12 6.39

Annex 3
73
GLYPHOSATE (158)
International Estimated Daily Intake (IEDI) ADI = 0–1 mg/kg bw
STMR
mg/kg
Diets as g/person/day Intake as µg/person/day
Codex code Commodity description
Expr as
G01 diet
G01 intake
G02 diet
G02 intake
G03 diet
G03 intake
G04 diet
G04 intake
G05 diet
G05 intake
G06 diet
G06 intake
flour)
- Maize starch PP 0.04 0.10 0.00 NC - 0.10 0.00 2.29 0.09 0.10 0.00 0.11 0.00
OR 0645
Maize oil PP 0.04 0.96 0.04 0.85 0.03 0.29 0.01 5.42 0.22 0.42 0.02 2.10 0.08
GC 0646
Millet, raw (incl flour, incl beer) RAC 3.7 1.46 5.40 2.32 8.58 5.84 21.61 0.89 3.29 16.17 59.83 0.10 0.37
GC 0647
Oats, raw (incl rolled) RAC 3.7 0.10 0.37 7.05 26.09 0.10 0.37 1.71 6.33 0.96 3.55 0.10 0.37
GC 0648
Quinoa, raw RAC 3.7 NC - NC - NC - NC - 0.10 0.37 NC -
GC 0650
Rye, raw (incl flour) RAC 3.7 0.13 0.48 19.38 71.71 0.10 0.37 0.12 0.44 0.10 0.37 2.15 7.96
GC 0651
Sorghum, raw (incl beer, excl flour) RAC 3.7 NC - 0.10 0.37 3.34 12.36 0.10 0.37 NC - NC -
- Sorghum, flour (white flour and wholemeal flour)
PP 1.5 3.91 5.87 NC - 11.62 17.43 14.24 21.36 9.87 14.81 2.62 3.93
GC 0653
Triticale, raw (incl flour) RAC 3.7 NC - NC - NC - 0.10 0.37 0.39 1.44 NC -
GC 0654
Wheat, raw (incl bulgur, incl fermented beverages, incl germ, incl wholemeal bread, excl white flour products, excl white bread)
RAC 3.7 0.10 0.37 1.13 4.18 0.10 0.37 0.10 0.37 0.74 2.74 0.10 0.37
CF 0654 Wheat, bran PP 1.8 NC - NC - NC - NC - NC - NC -
CP 1211 Wheat, white bread PP 0.11 0.25 0.03 0.63 0.07 0.12 0.01 0.43 0.05 1.39 0.15 0.22 0.02
CF 1211 Wheat, white flour (incl white flour products: starch, gluten, macaroni, pastry)
PP 0.11 301.49 33.16 269.27 29.62 30.33 3.34 222.94 24.52 136.12 14.97 343.34 37.77
- Wheat, macaroni, dry PP 0.11 0.72 0.08 2.20 0.24 1.22 0.13 3.99 0.44 0.53 0.06 1.66 0.18
- Wheat, pastry, baked PP 0.11 1.21 0.13 3.13 0.34 1.05 0.12 4.02 0.44 0.60 0.07 1.40 0.15

Annex 3
74
GLYPHOSATE (158)
International Estimated Daily Intake (IEDI) ADI = 0–1 mg/kg bw
STMR
mg/kg
Diets as g/person/day Intake as µg/person/day
Codex code Commodity description
Expr as
G01 diet
G01 intake
G02 diet
G02 intake
G03 diet
G03 intake
G04 diet
G04 intake
G05 diet
G05 intake
G06 diet
G06 intake
- Fonio, raw (incl flour) RAC 3.7 NC - NC - 1.01 3.74 NC - NC - NC -
- Cereals, NES, raw (including processed) : canagua, quihuicha, Job’s tears and wild rice
RAC 3.7 2.04 7.55 2.99 11.06 1.86 6.88 19.17 70.93 3.33 12.32 1.66 6.14
GS 0659 Sugar cane, raw RAC 0.27 38.16 10.30 NC - 12.58 3.40 0.34 0.09 17.79 4.80 42.78 11.55
- Sugar cane, molasses PP 2.3 NC - NC - NC - NC - 0.10 0.23 NC -
- Sugar cane, sugar (incl non-centrifugal sugar, incl refined sugar and maltose)
PP 0.065 61.52 4.00 86.27 5.61 18.80 1.22 80.02 5.20 66.39 4.32 56.32 3.66
SO 0495 Rape seed, raw RAC 3 0.10 0.30 NC - NC - 0.10 0.30 0.75 2.25 0.10 0.30
OR 0495
Rape seed oil, edible PP 0.009 0.35 0.00 0.44 0.00 0.19 0.00 0.97 0.01 3.28 0.03 0.77 0.01
SO 0691 Cotton seed, raw RAC 5.2 NC - NC - NC - NC - NC - NC -
OR 0691
Cotton seed oil, edible PP 0.52 3.22 1.67 1.54 0.80 1.01 0.53 0.74 0.38 1.12 0.58 2.93 1.52
SO 0702 Sunflower seed, raw (incl oil) RAC 0.395 7.40 2.92 35.86 14.16 1.15 0.45 8.76 3.46 5.45 2.15 13.62 5.38
MM 0095
MEAT FROM MAMMALS other than marine mammals, raw (incl prepared meat) - 80% as muscle
RAC 0.05 24.96 1.25 57.95 2.90 16.70 0.84 38.38 1.92 26.46 1.32 29.00 1.45
MM 0095
MEAT FROM MAMMALS other than marine mammals, raw (incl prepared meat) - 20% as fat
RAC 0.05 6.24 0.31 14.49 0.72 4.18 0.21 9.60 0.48 6.62 0.33 7.25 0.36
MO 0105
Edible offal (mammalian), raw RAC 2.9 4.79 13.89 9.68 28.07 2.97 8.61 5.49 15.92 3.84 11.14 5.03 14.59
ML 0106
Milks, raw or skimmed (incl dairy products)
RAC 0 289.65 0.00 485.88 0.00 26.92 0.00 239.03 0.00 199.91 0.00 180.53 0.00
PM 0110
Poultry meat, raw (incl prepared) - 90% as muscle
RAC 0 13.17 0.00 26.78 0.00 7.24 0.00 116.71 0.00 22.54 0.00 32.09 0.00
PM Poultry meat, raw (incl prepared) - 10% RAC 0 1.46 0.00 2.98 0.00 0.80 0.00 12.97 0.00 2.50 0.00 3.57 0.00
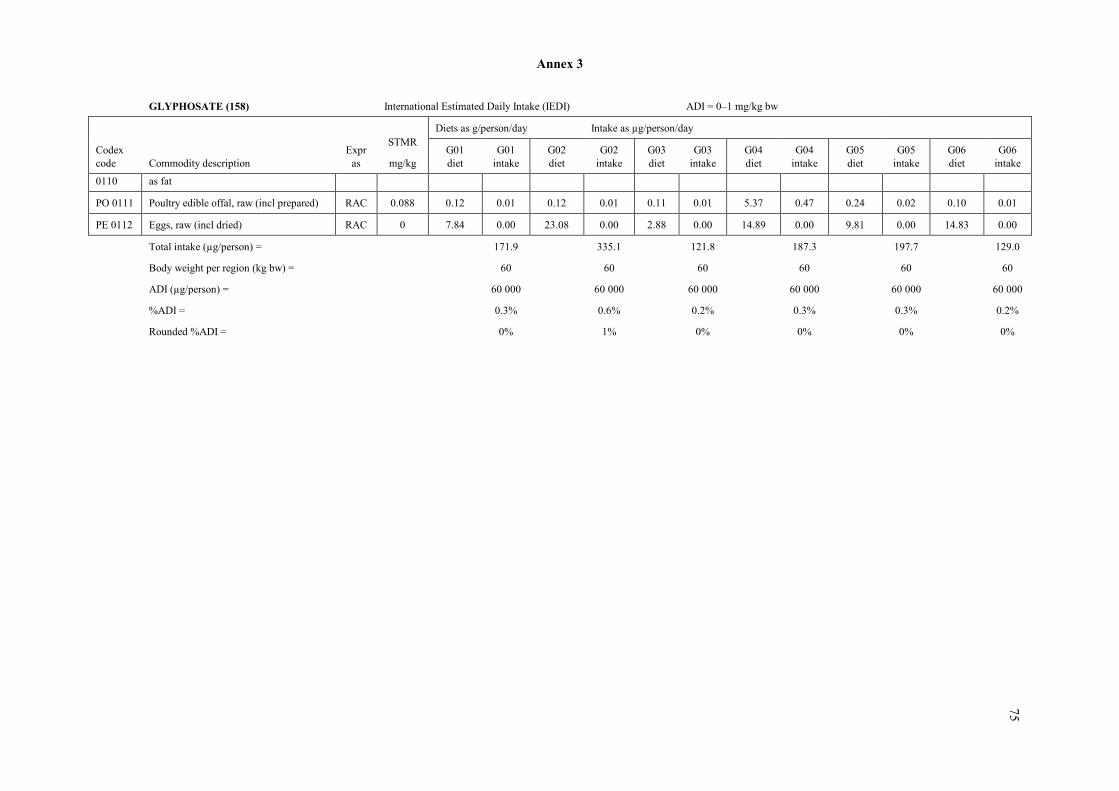
Annex 3
75
GLYPHOSATE (158)
International Estimated Daily Intake (IEDI) ADI = 0–1 mg/kg bw
STMR
mg/kg
Diets as g/person/day Intake as µg/person/day
Codex code Commodity description
Expr as
G01 diet
G01 intake
G02 diet
G02 intake
G03 diet
G03 intake
G04 diet
G04 intake
G05 diet
G05 intake
G06 diet
G06 intake
0110 as fat
PO 0111 Poultry edible offal, raw (incl prepared) RAC 0.088 0.12 0.01 0.12 0.01 0.11 0.01 5.37 0.47 0.24 0.02 0.10 0.01
PE 0112 Eggs, raw (incl dried) RAC 0 7.84 0.00 23.08 0.00 2.88 0.00 14.89 0.00 9.81 0.00 14.83 0.00
Total intake (µg/person) =
171.9
335.1
121.8 187.3 197.7 129.0
Body weight per region (kg bw) =
60
60
60
60
60
60
ADI (µg/person) =
60 000
60 000
60 000
60 000
60 000
60 000
%ADI =
0.3%
0.6%
0.2%
0.3%
0.3%
0.2%
Rounded %ADI =
0%
1%
0%
0%
0%
0%

Annex 3
76
GLYPHOSATE (158)
International Estimated Daily Intake (IEDI) ADI = 0–1 mg/kg bw
STMR
mg/kg
Diets as g/person/day Intake as µg/person/day
Codex code Commodity description
Expr as
G07 diet
G07 intake
G08 diet
G08 intake
G09 diet
G09 intake
G10 diet
G10 intake
G11 diet
G11 intake
G12 diet
G12 intake
FI 0327
Banana, raw (incl plantains) (incl dried) RAC 0.05 25.14 1.26 23.37 1.17 23.06 1.15 23.40 1.17 18.44 0.92 39.29 1.96
VO 0447
Sweet corn on the cob, raw (incl frozen, incl canned) (i.e. kernels plus cob without husks)
RAC 0.325 11.43 3.71 3.71 1.21 0.74 0.24 13.63 4.43 3.07 1.00 1.50 0.49
VD 0071
Beans, dry, raw (Phaseolus spp) RAC 0.17 1.51 0.26 1.50 0.26 1.90 0.32 5.11 0.87 1.36 0.23 23.43 3.98
VD 0072
Peas, dry, raw (Pisum spp, Vigna spp): garden peas & field peas & cow peas
RAC 0.5 3.80 1.90 1.25 0.63 1.06 0.53 2.33 1.17 2.70 1.35 3.83 1.92
VD 0533
Lentil, dry, raw (Ervum lens) RAC 0.5 0.95 0.48 1.18 0.59 0.40 0.20 0.96 0.48 0.71 0.36 1.28 0.64
VD 0541
Soya bean, dry, raw (incl flour, incl paste, incl curd, incl sauce, excl oil)
RAC 5 0.47 2.35 0.77 3.85 9.12 45.60 8.05 40.25 0.10 0.50 6.06 30.30
OR 0541
Soya oil, refined PP 0.1 19.06 1.91 21.06 2.11 5.94 0.59 33.78 3.38 40.05 4.01 13.39 1.34
VR 0596
Sugar beet, raw RAC 3.4 0.10 0.34 NC - 0.10 0.34 0.10 0.34 NC - NC -
GC 0640
Barley, raw (incl malt extract, incl pot & pearled, incl flour & grits, incl beer, incl malt)
RAC 3.7 36.18 133.87 53.45 197.77 9.39 34.74 35.25 130.43 46.68 172.72 15.92 58.90
GC 0641
Buckwheat, raw (incl flour) RAC 3.7 0.10 0.37 0.79 2.92 0.18 0.67 0.35 1.30 NC - NC -
GC 0645
Maize, raw (incl glucose & dextrose & isoglucose, incl beer, incl germ, excl flour, excl oil, excl starch)
RAC 0.12 0.10 0.01 9.93 1.19 1.40 0.17 10.26 1.23 0.33 0.04 0.10 0.01
GC 0656
Popcorn (i.e. maize used for preparation of popcorn)
RAC 0.12 - - - - - - - - - - - -
CF 1255
Maize, flour (white flour and wholemeal flour)
PP 0.13 14.27 1.86 12.86 1.67 19.71 2.56 12.55 1.63 4.21 0.55 52.30 6.80

Annex 3
77 GLYPHOSATE (158)
International Estimated Daily Intake (IEDI) ADI = 0–1 mg/kg bw
STMR
mg/kg
Diets as g/person/day Intake as µg/person/day
Codex code Commodity description
Expr as
G07 diet
G07 intake
G08 diet
G08 intake
G09 diet
G09 intake
G10 diet
G10 intake
G11 diet
G11 intake
G12 diet
G12 intake
- Maize starch PP 0.04 NC - NC - 0.19 0.01 7.13 0.29 NC - NC -
OR 0645
Maize oil PP 0.04 0.90 0.04 0.47 0.02 0.15 0.01 3.01 0.12 1.86 0.07 0.36 0.01
GC 0646
Millet, raw (incl flour, incl beer) RAC 3.7 0.10 0.37 0.16 0.59 1.75 6.48 0.69 2.55 NC - NC -
GC 0647
Oats, raw (incl rolled) RAC 3.7 7.50 27.75 6.26 23.16 0.15 0.56 4.87 18.02 3.16 11.69 2.98 11.03
GC 0648
Quinoa, raw RAC 3.7 NC - NC - NC - NC - NC - NC -
GC 0650
Rye, raw (incl flour) RAC 3.7 3.21 11.88 35.38 130.91 0.21 0.78 6.50 24.05 1.49 5.51 NC -
GC 0651
Sorghum, raw (incl beer, excl flour) RAC 3.7 NC - NC - 0.10 0.37 1.15 4.26 NC - 7.12 26.34
- Sorghum, flour (white flour and wholemeal flour)
PP 1.5 NC - NC - 1.29 1.94 0.10 0.15 NC - NC -
GC 0653
Triticale, raw (incl flour) RAC 3.7 0.10 0.37 0.17 0.63 0.29 1.07 0.10 0.37 NC - NC -
GC 0654
Wheat, raw (incl bulgur, incl fermented beverages, incl germ, incl wholemeal bread, excl white flour products, excl white bread)
RAC 3.7 1.00 3.70 0.11 0.41 0.10 0.37 0.84 3.11 0.10 0.37 0.10 0.37
CF 0654
Wheat, bran PP 1.8 NC - NC - NC - NC - NC - NC -
CP 1211
Wheat, white bread PP 0.11 1.30 0.14 0.46 0.05 0.10 0.01 0.22 0.02 2.44 0.27 0.77 0.08
CF 1211
Wheat, white flour (incl white flour products: starch, gluten, macaroni, pastry)
PP 0.11 199.38 21.93 193.50 21.29 106.30 11.69 185.31 20.38 171.11 18.82 132.37 14.56
- Wheat, macaroni, dry PP 0.11 6.71 0.74 4.98 0.55 2.12 0.23 1.90 0.21 2.89 0.32 4.12 0.45
- Wheat, pastry, baked PP 0.11 7.93 0.87 0.51 0.06 0.29 0.03 2.44 0.27 1.78 0.20 8.64 0.95

Annex 3
78 GLYPHOSATE (158)
International Estimated Daily Intake (IEDI) ADI = 0–1 mg/kg bw
STMR
mg/kg
Diets as g/person/day Intake as µg/person/day
Codex code Commodity description
Expr as
G07 diet
G07 intake
G08 diet
G08 intake
G09 diet
G09 intake
G10 diet
G10 intake
G11 diet
G11 intake
G12 diet
G12 intake
- Fonio, raw (incl flour) RAC 3.7 NC - NC - 0.10 0.37 NC - NC - NC -
- Cereals, NES, raw (including processed): canagua, quihuicha, Job’s tears and wild rice
RAC 3.7 6.17 22.83 3.01 11.14 0.76 2.81 3.30 12.21 3.38 12.51 15.84 58.61
GS 0659
Sugar cane, raw RAC 0.27 NC - NC - 4.27 1.15 0.10 0.03 NC - 3.24 0.87
- Sugar cane, molasses PP 2.3 NC - NC - 0.10 0.23 NC - NC - NC -
- Sugar cane, sugar (incl non-centrifugal sugar, incl refined sugar and maltose)
PP 0.065 92.24 6.00 95.72 6.22 24.12 1.57 77.39 5.03 117.73 7.65 100.67 6.54
SO 0495
Rape seed, raw RAC 3 NC - NC - 0.10 0.30 NC - NC - NC -
OR 0495
Rape seed oil, edible PP 0.009 12.52 0.11 7.63 0.07 3.00 0.03 6.01 0.05 NC - NC -
SO 0691
Cotton seed, raw RAC 5.2 NC - NC - NC - NC - NC - NC -
OR 0691
Cotton seed oil, edible PP 0.52 1.68 0.87 0.66 0.34 1.13 0.59 1.18 0.61 0.89 0.46 0.37 0.19
SO 0702
Sunflower seed, raw (incl oil) RAC 0.395 23.40 9.24 29.33 11.59 1.24 0.49 13.85 5.47 6.48 2.56 6.91 2.73
MM 0095
MEAT FROM MAMMALS other than marine mammals, raw (incl prepared meat) - 80% as muscle
RAC 0.05 112.02 5.60 120.71 6.04 63.46 3.17 88.99 4.45 96.24 4.81 41.02 2.05
MM 0095
MEAT FROM MAMMALS other than marine mammals, raw (incl prepared meat) - 20% as fat
RAC 0.05 28.01 1.40 30.18 1.51 15.86 0.79 22.25 1.11 24.06 1.20 10.25 0.51
MO 0105
Edible offal (mammalian), raw RAC 2.9 15.17 43.99 5.19 15.05 6.30 18.27 6.78 19.66 3.32 9.63 3.17 9.19
ML 0106
Milks, raw or skimmed (incl dairy products)
RAC 0 388.92 0.00 335.88 0.00 49.15 0.00 331.25 0.00 468.56 0.00 245.45 0.00
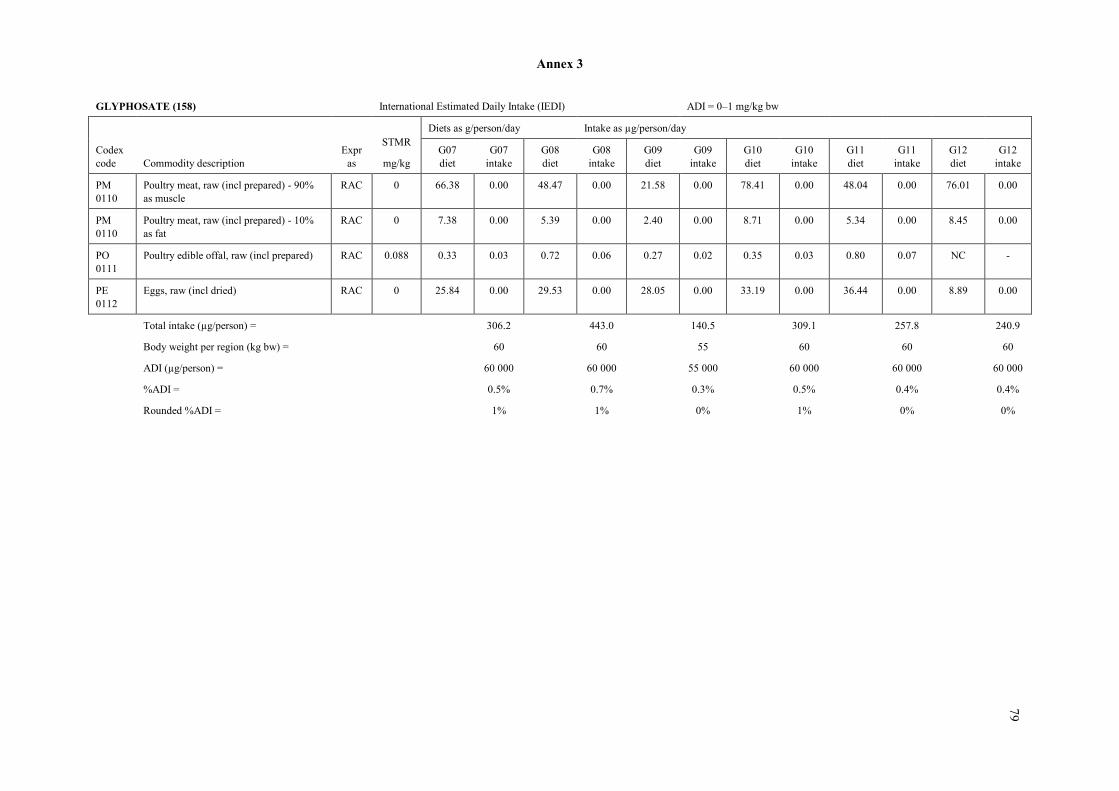
Annex 3
79 GLYPHOSATE (158)
International Estimated Daily Intake (IEDI) ADI = 0–1 mg/kg bw
STMR
mg/kg
Diets as g/person/day Intake as µg/person/day
Codex code Commodity description
Expr as
G07 diet
G07 intake
G08 diet
G08 intake
G09 diet
G09 intake
G10 diet
G10 intake
G11 diet
G11 intake
G12 diet
G12 intake
PM 0110
Poultry meat, raw (incl prepared) - 90% as muscle
RAC 0 66.38 0.00 48.47 0.00 21.58 0.00 78.41 0.00 48.04 0.00 76.01 0.00
PM 0110
Poultry meat, raw (incl prepared) - 10% as fat
RAC 0 7.38 0.00 5.39 0.00 2.40 0.00 8.71 0.00 5.34 0.00 8.45 0.00
PO 0111
Poultry edible offal, raw (incl prepared) RAC 0.088 0.33 0.03 0.72 0.06 0.27 0.02 0.35 0.03 0.80 0.07 NC -
PE 0112
Eggs, raw (incl dried) RAC 0 25.84 0.00 29.53 0.00 28.05 0.00 33.19 0.00 36.44 0.00 8.89 0.00
Total intake (µg/person) =
306.2 443.0 140.5 309.1 257.8 240.9
Body weight per region (kg bw) =
60
60
55
60
60
60
ADI (µg/person) =
60 000
60 000
55 000
60 000
60 000
60 000
%ADI =
0.5%
0.7%
0.3%
0.5%
0.4%
0.4%
Rounded %ADI =
1%
1%
0%
1%
0%
0%

Annex 3
80
GLYPHOSATE (158)
International Estimated Daily Intake (IEDI) ADI = 0–1 mg/kg bw
STMR
mg/kg
Diets as g/person/day Intake as µg/person/day
Codex code Commodity description Expr as
G13 diet
G13 intake
G14 diet
G14 intake
G15 diet
G15 intake
G16 diet
G16 intake
G17 diet
G17 intake
FI 0327 Banana, raw (incl plantains) (incl dried) RAC 0.05 20.88 1.04 81.15 4.06 24.58 1.23 37.92 1.90 310.23 15.51
VO 0447 Sweet corn on the cob, raw (incl frozen, incl canned) (i.e. kernels plus cob without husks)
RAC 0.325 3.63 1.18 20.50 6.66 8.78 2.85 0.10 0.03 0.17 0.06
VD 0071 Beans, dry, raw (Phaseolus spp) RAC 0.17 7.11 1.21 2.33 0.40 3.76 0.64 44.70 7.60 3.27 0.56
VD 0072 Peas, dry, raw (Pisum spp, Vigna spp): garden peas & field peas & cow peas
RAC 0.5 14.30 7.15 3.51 1.76 3.52 1.76 7.89 3.95 0.74 0.37
VD 0533 Lentil, dry, raw (Ervum lens) RAC 0.5 0.67 0.34 7.26 3.63 0.37 0.19 0.10 0.05 NC -
VD 0541 Soya bean, dry, raw (incl flour, incl paste, incl curd, incl sauce, excl oil)
RAC 5 2.89 14.45 0.21 1.05 0.48 2.40 3.16 15.80 0.26 1.30
OR 0541 Soya oil, refined PP 0.1 2.32 0.23 2.54 0.25 18.70 1.87 2.51 0.25 6.29 0.63
VR 0596 Sugar beet, raw RAC 3.4 0.10 0.34 NC - NC - NC - NC -
GC 0640 Barley, raw (incl malt extract, incl pot & pearled, incl flour & grits, incl beer, incl malt)
RAC 3.7 11.58 42.85 2.33 8.62 46.71 172.83 3.72 13.76 16.26 60.16
GC 0641 Buckwheat, raw (incl flour) RAC 3.7 0.10 0.37 2.82 10.43 0.10 0.37 0.10 0.37 NC -
GC 0645 Maize, raw (incl glucose & dextrose & isoglucose, incl beer, incl germ, excl flour, excl oil, excl starch)
RAC 0.12 0.55 0.07 0.51 0.06 3.26 0.39 7.96 0.96 NC -
GC 0656 Popcorn (i.e. maize used for preparation of popcorn)
RAC 0.12 - - - - - - - - - -
CF 1255 Maize, flour (white flour and wholemeal flour)
PP 0.13 94.34 12.26 8.09 1.05 28.03 3.64 55.94 7.27 28.07 3.65
- Maize starch PP 0.04 0.10 0.00 0.10 0.00 NC - NC - NC -
OR 0645 Maize oil PP 0.04 0.33 0.01 0.10 0.00 0.81 0.03 0.10 0.00 NC -
GC 0646 Millet, raw (incl flour, incl beer) RAC 3.7 61.13 226.18 0.78 2.89 NC - 33.55 124.14 NC -
GC 0647 Oats, raw (incl rolled) RAC 3.7 0.37 1.37 0.10 0.37 2.79 10.32 0.10 0.37 NC -
GC 0648 Quinoa, raw RAC 3.7 NC - NC - NC - NC - NC -
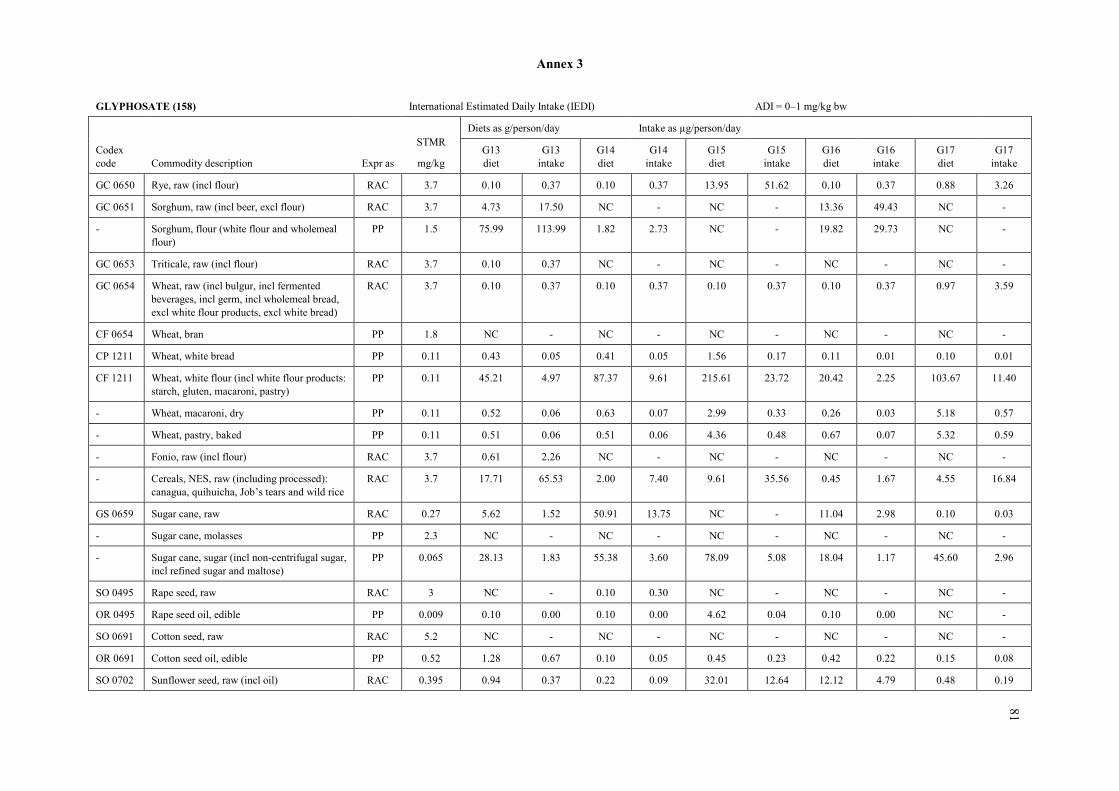
Annex 3
81 GLYPHOSATE (158)
International Estimated Daily Intake (IEDI) ADI = 0–1 mg/kg bw
STMR
mg/kg
Diets as g/person/day Intake as µg/person/day
Codex code Commodity description Expr as
G13 diet
G13 intake
G14 diet
G14 intake
G15 diet
G15 intake
G16 diet
G16 intake
G17 diet
G17 intake
GC 0650 Rye, raw (incl flour) RAC 3.7 0.10 0.37 0.10 0.37 13.95 51.62 0.10 0.37 0.88 3.26
GC 0651 Sorghum, raw (incl beer, excl flour) RAC 3.7 4.73 17.50 NC - NC - 13.36 49.43 NC -
- Sorghum, flour (white flour and wholemeal flour)
PP 1.5 75.99 113.99 1.82 2.73 NC - 19.82 29.73 NC -
GC 0653 Triticale, raw (incl flour) RAC 3.7 0.10 0.37 NC - NC - NC - NC -
GC 0654 Wheat, raw (incl bulgur, incl fermented beverages, incl germ, incl wholemeal bread, excl white flour products, excl white bread)
RAC 3.7 0.10 0.37 0.10 0.37 0.10 0.37 0.10 0.37 0.97 3.59
CF 0654 Wheat, bran PP 1.8 NC - NC - NC - NC - NC -
CP 1211 Wheat, white bread PP 0.11 0.43 0.05 0.41 0.05 1.56 0.17 0.11 0.01 0.10 0.01
CF 1211 Wheat, white flour (incl white flour products: starch, gluten, macaroni, pastry)
PP 0.11 45.21 4.97 87.37 9.61 215.61 23.72 20.42 2.25 103.67 11.40
- Wheat, macaroni, dry PP 0.11 0.52 0.06 0.63 0.07 2.99 0.33 0.26 0.03 5.18 0.57
- Wheat, pastry, baked PP 0.11 0.51 0.06 0.51 0.06 4.36 0.48 0.67 0.07 5.32 0.59
- Fonio, raw (incl flour) RAC 3.7 0.61 2.26 NC - NC - NC - NC -
- Cereals, NES, raw (including processed): canagua, quihuicha, Job’s tears and wild rice
RAC 3.7 17.71 65.53 2.00 7.40 9.61 35.56 0.45 1.67 4.55 16.84
GS 0659 Sugar cane, raw RAC 0.27 5.62 1.52 50.91 13.75 NC - 11.04 2.98 0.10 0.03
- Sugar cane, molasses PP 2.3 NC - NC - NC - NC - NC -
- Sugar cane, sugar (incl non-centrifugal sugar, incl refined sugar and maltose)
PP 0.065 28.13 1.83 55.38 3.60 78.09 5.08 18.04 1.17 45.60 2.96
SO 0495 Rape seed, raw RAC 3 NC - 0.10 0.30 NC - NC - NC -
OR 0495 Rape seed oil, edible PP 0.009 0.10 0.00 0.10 0.00 4.62 0.04 0.10 0.00 NC -
SO 0691 Cotton seed, raw RAC 5.2 NC - NC - NC - NC - NC -
OR 0691 Cotton seed oil, edible PP 0.52 1.28 0.67 0.10 0.05 0.45 0.23 0.42 0.22 0.15 0.08
SO 0702 Sunflower seed, raw (incl oil) RAC 0.395 0.94 0.37 0.22 0.09 32.01 12.64 12.12 4.79 0.48 0.19

Annex 3
82 GLYPHOSATE (158)
International Estimated Daily Intake (IEDI) ADI = 0–1 mg/kg bw
STMR
mg/kg
Diets as g/person/day Intake as µg/person/day
Codex code Commodity description Expr as
G13 diet
G13 intake
G14 diet
G14 intake
G15 diet
G15 intake
G16 diet
G16 intake
G17 diet
G17 intake
MM 0095
MEAT FROM MAMMALS other than marine mammals, raw (incl prepared meat) - 80% as muscle
RAC 0.05 23.34 1.17 40.71 2.04 97.15 4.86 18.06 0.90 57.71 2.89
MM 0095
MEAT FROM MAMMALS other than marine mammals, raw (incl prepared meat) - 20% as fat
RAC 0.05 5.84 0.29 10.18 0.51 24.29 1.21 4.52 0.23 14.43 0.72
MO 0105
Edible offal (mammalian), raw RAC 2.9 4.64 13.46 1.97 5.71 10.01 29.03 3.27 9.48 3.98 11.54
ML 0106 Milks, raw or skimmed (incl dairy products) RAC 0 108.75 0.00 70.31 0.00 436.11 0.00 61.55 0.00 79.09 0.00
PM 0110 Poultry meat, raw (incl prepared) - 90% as muscle
RAC 0 3.53 0.00 10.83 0.00 51.36 0.00 4.53 0.00 50.00 0.00
PM 0110 Poultry meat, raw (incl prepared) - 10% as fat
RAC 0 0.39 0.00 1.20 0.00 5.71 0.00 0.50 0.00 5.56 0.00
PO 0111 Poultry edible offal, raw (incl prepared) RAC 0.088 0.10 0.01 0.70 0.06 0.97 0.09 0.10 0.01 NC -
PE 0112 Eggs, raw (incl dried) RAC 0 3.84 0.00 4.41 0.00 27.25 0.00 1.13 0.00 7.39 0.00
Total intake (µg/person) =
533.9
88.0
363.9
280.2 136.9
Body weight per region (kg bw) =
60
60
60
60
60
ADI (µg/person) =
60 000
60 000
60 000
60 000
60 000
%ADI =
0.9%
0.1%
0.6%
0.5%
0.2%
Rounded %ADI =
1%
0%
1%
0%
0%

Annex 3
83 MALATHION
MALATHION (49)
International Estimated Daily Intake (IEDI) ADI = 0–0.3 mg/kg bw
STMR
mg/kg
Diets as g/person/day Intake as µg/person/day
Codex code Commodity description
Expr as
G01 diet
G01 intake
G02 diet
G02 intake
G03 diet
G03 intake
G04 diet
G04 intake
G05 diet
G05 intake
G06 diet
G06 intake
FC 0001 Citrus fruit, raw (incl citrus fruit juice, incl kumquat commodities)
RAC 0.02 34.91 0.70 16.51 0.33 17.23 0.34 104.48 2.09 35.57 0.71 98.49 1.97
FP 0226 Apple, raw (incl juice, incl cider) RAC 0.11 13.94 1.53 30.81 3.39 15.14 1.67 23.10 2.54 6.86 0.75 55.48 6.10
FB 0020 Blueberries, raw RAC 2.27 0.10 0.23 0.10 0.23 0.10 0.23 0.10 0.23 0.10 0.23 0.10 0.23
FB 0269 Grape, raw (incl must, incl dried, incl juice, incl wine)
RAC 0.16 16.25 2.60 28.96 4.63 2.87 0.46 24.22 3.88 9.33 1.49 68.64 10.98
FB 0275 Strawberry, raw RAC 0.25 0.70 0.18 2.01 0.50 0.10 0.03 1.36 0.34 0.37 0.09 2.53 0.63
- Onions, mature bulbs, dry RAC 0.23 29.36 6.75 37.50 8.63 3.56 0.82 34.78 8.00 18.81 4.33 43.38 9.98
- Onions, green, raw RAC 0.52 2.45 1.27 1.49 0.77 1.02 0.53 2.60 1.35 0.60 0.31 2.03 1.06
VC 0424 Cucumber, raw RAC 0.02 8.01 0.16 30.66 0.61 1.45 0.03 19.84 0.40 0.27 0.01 34.92 0.70
VO 0444 Peppers, chili, raw (incl dried) RAC 0.01 6.93 0.07 10.97 0.11 8.83 0.09 9.13 0.09 6.65 0.07 20.01 0.20
VO 0445 Peppers, sweet, raw (incl dried) RAC 0.01 4.49 0.04 6.44 0.06 7.21 0.07 5.68 0.06 9.52 0.10 8.92 0.09
VO 0447 Sweet corn on the cob, raw (incl frozen, incl canned) (i.e. kernels plus cob without husks)
RAC 0.01 0.14 0.00 0.94 0.01 5.70 0.06 2.61 0.03 1.94 0.02 0.22 0.00
VO 0448 Tomato, raw (incl canned, excl juice, excl paste)
RAC 0.21 42.04 8.83 76.13 15.99 10.69 2.24 84.59 17.76 24.92 5.23 203.27 42.69
- Tomato, paste (i.e. concentrated tomato sauce/puree)
PP 0.07 2.34 0.16 1.33 0.09 1.57 0.11 4.24 0.30 0.34 0.02 2.83 0.20
JF 0448 Tomato, juice (single strength, incl concentrated)
PP 0 0.29 0.00 0.29 0.00 0.10 0.00 0.38 0.00 0.10 0.00 0.14 0.00
VL 0485 Mustard greens, raw (i.e. Brassica) RAC 0.07 0.10 0.01 0.31 0.02 0.10 0.01 0.10 0.01 0.47 0.03 0.11 0.01
VL 0502 Spinach, raw RAC 0.35 0.74 0.26 0.22 0.08 0.10 0.04 0.91 0.32 0.10 0.04 2.92 1.02
VL 0506 Turnip greens, raw (i.e. Namenia, RAC 1.2 NC - NC - NC - NC - NC - NC -

Annex 3
84
MALATHION (49)
International Estimated Daily Intake (IEDI) ADI = 0–0.3 mg/kg bw
STMR
mg/kg
Diets as g/person/day Intake as µg/person/day
Codex code Commodity description
Expr as
G01 diet
G01 intake
G02 diet
G02 intake
G03 diet
G03 intake
G04 diet
G04 intake
G05 diet
G05 intake
G06 diet
G06 intake
Tendergreen)
VP 0061 Beans, green, with pods, raw: beans except broad bean & soya bean (i.e. immature seeds + pods) (Phaseolus spp)
RAC 0.31 0.68 0.21 NC - NC - 0.39 0.12 0.22 0.07 0.49 0.15
VD 0071 Beans, dry, raw (Phaseolus spp) RAC 0.36 2.39 0.86 1.61 0.58 10.47 3.77 1.84 0.66 12.90 4.64 7.44 2.68
VR 0506 Garden turnip, raw RAC 0.05 2.50 0.13 4.44 0.22 2.75 0.14 6.67 0.33 0.14 0.01 3.22 0.16
VS 0621 Asparagus RAC 0.305 0.10 0.03 0.10 0.03 0.10 0.03 0.10 0.03 0.10 0.03 0.21 0.06
GC 0645 Maize, raw (incl glucose & dextrose & isoglucose, incl flour, incl oil, incl beer, incl germ, incl starch)
RAC 0.01 29.81 0.30 44.77 0.45 108.95 1.09 52.37 0.52 60.28 0.60 75.69 0.76
GC 0651 Sorghum, raw (incl flour, incl beer) RAC 0.235 4.34 1.02 0.10 0.02 16.25 3.82 15.82 3.72 10.97 2.58 2.92 0.69
GC 0654 Wheat, raw (incl bulgur, incl fermented beverages, excl germ, excl wholemeal bread, excl white flour products, excl white bread)
RAC 10 0.10 1.00 1.12 11.20 0.10 1.00 0.10 1.00 0.61 6.10 0.10 1.00
CF 0654 Wheat, bran PP 25 NC - NC - NC - NC - NC - NC -
CF 1212 Wheat, wholemeal flour PP 7.5 NC - NC - NC - NC - NC - NC -
CP 1212 Wheat, wholemeal bread PP 1.2 0.10 0.12 0.10 0.12 0.10 0.12 0.10 0.12 0.10 0.12 0.10 0.12
CP 1211 Wheat, white bread PP 0.2 0.25 0.05 0.63 0.13 0.12 0.02 0.43 0.09 1.39 0.28 0.22 0.04
- Wheat, gluten PP 0.012 0.10 0.00 0.10 0.00 0.10 0.00 0.27 0.00 0.10 0.00 0.10 0.00
SO 0691 Cotton seed, raw RAC 4.8 NC - NC - NC - NC - NC - NC -
OR 0691 Cotton seed oil, edible PP 3.12 3.22 10.05 1.54 4.80 1.01 3.15 0.74 2.31 1.12 3.49 2.93 9.14
Total intake (µg/person) =
36.6
53.0
19.9 46.3 31.4 90.7
Body weight per region (kg bw) =
60
60
60
60
60
60
ADI (µg/person) =
18 000
18 000
18 000
18 000
18 000
18 000
%ADI =
0.2%
0.3%
0.1%
0.3%
0.2%
0.5%
Rounded %ADI =
0%
0%
0%
0%
0%
1%

Annex 3
85 MALATHION (49)
International Estimated Daily Intake (IEDI) ADI = 0–0.3 mg/kg bw
STMR
mg/kg
Diets as g/person/day Intake as µg/person/day
Codex code Commodity description
Expr as
G07 diet
G07 intake
G08 diet
G08 intake
G09 diet
G09 intake
G10 diet
G10 intake
G11 diet
G11 intake
G12 diet
G12 intake
FC 0001
Citrus fruit, raw (incl citrus fruit juice, incl kumquat commodities)
RAC 0.02 114.42 2.29 62.91 1.26 26.97 0.54 96.72 1.93 96.22 1.92 563.19 11.26
FP 0226
Apple, raw (incl juice, incl cider) RAC 0.11 61.44 6.76 72.81 8.01 26.84 2.95 45.18 4.97 93.28 10.26 7.78 0.86
FB 0020
Blueberries, raw RAC 2.27 0.10 0.23 0.23 0.52 0.10 0.23 0.83 1.88 0.33 0.75 NC -
FB 0269
Grape, raw (incl must, incl dried, incl juice, incl wine)
RAC 0.16 142.23 22.76 105.77 16.92 7.87 1.26 52.44 8.39 109.22 17.48 10.96 1.75
FB 0275
Strawberry, raw RAC 0.25 4.49 1.12 5.66 1.42 0.10 0.03 6.63 1.66 5.75 1.44 0.10 0.03
- Onions, mature bulbs, dry RAC 0.23 19.69 4.53 29.83 6.86 24.64 5.67 31.35 7.21 9.72 2.24 12.59 2.90
- Onions, green, raw RAC 0.52 1.55 0.81 0.74 0.38 1.05 0.55 3.74 1.94 0.94 0.49 6.45 3.35
VC 0424
Cucumber, raw RAC 0.02 6.72 0.13 11.03 0.22 32.10 0.64 15.10 0.30 4.05 0.08 9.57 0.19
VO 0444
Peppers, chili, raw (incl dried) RAC 0.01 6.36 0.06 15.46 0.15 10.74 0.11 7.28 0.07 8.21 0.08 3.58 0.04
VO 0445
Peppers, sweet, raw (incl dried) RAC 0.01 0.82 0.01 1.53 0.02 10.85 0.11 4.59 0.05 1.84 0.02 2.00 0.02
VO 0447
Sweet corn on the cob, raw (incl frozen, incl canned) (i.e. kernels plus cob without husks)
RAC 0.01 11.43 0.11 3.71 0.04 0.74 0.01 13.63 0.14 3.07 0.03 1.50 0.02
VO 0448
Tomato, raw (incl canned, excl juice, excl paste)
RAC 0.21 43.88 9.21 55.41 11.64 35.38 7.43 74.88 15.72 26.50 5.57 9.51 2.00
- Tomato, paste (i.e. concentrated tomato sauce/puree)
PP 0.07 4.96 0.35 3.20 0.22 0.15 0.01 1.61 0.11 6.88 0.48 0.52 0.04
JF 0448 Tomato, juice (single strength, incl concentrated)
PP 0 0.80 0.00 0.10 0.00 0.10 0.00 0.61 0.00 0.40 0.00 0.10 0.00
VL Mustard greens, raw (i.e. Brassica) RAC 0.07 NC - NC - NC - NC - NC - 0.13 0.01

Annex 3
86 MALATHION (49)
International Estimated Daily Intake (IEDI) ADI = 0–0.3 mg/kg bw
STMR
mg/kg
Diets as g/person/day Intake as µg/person/day
Codex code Commodity description
Expr as
G07 diet
G07 intake
G08 diet
G08 intake
G09 diet
G09 intake
G10 diet
G10 intake
G11 diet
G11 intake
G12 diet
G12 intake
0485
VL 0502
Spinach, raw RAC 0.35 2.20 0.77 1.76 0.62 13.38 4.68 2.94 1.03 5.53 1.94 0.10 0.04
VL 0506
Turnip greens, raw (i.e. Namenia, Tendergreen)
RAC 1.2 NC - NC - NC - NC - NC - NC -
VP 0061
Beans, green, with pods, raw: beans except broad bean & soya bean (i.e. immature seeds + pods) (Phaseolus spp)
RAC 0.31 5.07 1.57 0.83 0.26 0.17 0.05 3.70 1.15 NC - NC -
VD 0071
Beans, dry, raw (Phaseolus spp) RAC 0.36 1.51 0.54 1.50 0.54 1.90 0.68 5.11 1.84 1.36 0.49 23.43 8.43
VR 0506
Garden turnip, raw RAC 0.05 5.78 0.29 15.35 0.77 NC - 6.54 0.33 1.95 0.10 4.73 0.24
VS 0621
Asparagus RAC 0.305 0.84 0.26 2.08 0.63 7.11 2.17 1.01 0.31 1.69 0.52 0.10 0.03
GC 0645
Maize, raw (incl glucose & dextrose & isoglucose, incl flour, incl oil, incl beer, incl germ, incl starch)
RAC 0.01 18.51 0.19 26.18 0.26 26.04 0.26 39.99 0.40 7.36 0.07 64.58 0.65
GC 0651
Sorghum, raw (incl flour, incl beer) RAC 0.235 NC - NC - 1.44 0.34 1.15 0.27 NC - 7.12 1.67
GC 0654
Wheat, raw (incl bulgur, incl fermented beverages, excl germ, excl wholemeal bread, excl white flour products, excl white bread)
RAC 10 0.37 3.70 0.10 1.00 0.10 1.00 0.10 1.00 NC - 0.10 1.00
CF 0654
Wheat, bran PP 25 NC - NC - NC - NC - NC - NC -
CF 1212
Wheat, wholemeal flour PP 7.5 NC - NC - NC - NC - NC - NC -
CP 1212
Wheat, wholemeal bread PP 1.2 0.10 0.12 0.10 0.12 0.10 0.12 0.10 0.12 0.10 0.12 0.10 0.12
CP Wheat, white bread PP 0.2 1.30 0.26 0.46 0.09 0.10 0.02 0.22 0.04 2.44 0.49 0.77 0.15

Annex 3
87 MALATHION (49)
International Estimated Daily Intake (IEDI) ADI = 0–0.3 mg/kg bw
STMR
mg/kg
Diets as g/person/day Intake as µg/person/day
Codex code Commodity description
Expr as
G07 diet
G07 intake
G08 diet
G08 intake
G09 diet
G09 intake
G10 diet
G10 intake
G11 diet
G11 intake
G12 diet
G12 intake
1211
- Wheat, gluten PP 0.012 0.68 0.01 NC - 0.10 0.00 0.10 0.00 NC - NC -
SO 0691
Cotton seed, raw RAC 4.8 NC - NC - NC - NC - NC - NC -
OR 0691
Cotton seed oil, edible PP 3.12 1.68 5.24 0.66 2.06 1.13 3.53 1.18 3.68 0.89 2.78 0.37 1.15
Total intake (µg/person) =
61.3 54.0 32.4 54.6 47.3 35.9
Body weight per region (kg bw) =
60
60
55
60
60
60
ADI (µg/person) =
18 000
18 000
16 500
18 000
18 000
18 000
%ADI =
0.3%
0.3%
0.2%
0.3%
0.3%
0.2%
Rounded %ADI =
0%
0%
0%
0%
0%
0%

Annex 3
88
MALATHION (49)
International Estimated Daily Intake (IEDI) ADI = 0–0.3 mg/kg bw
STMR
mg/kg
Diets as g/person/day Intake as µg/person/day
Codex code Commodity description Expr as
G13 diet
G13 intake
G14 diet
G14 intake
G15 diet
G15 intake
G16 diet
G16 intake
G17 diet
G17 intake
FC 0001 Citrus fruit, raw (incl citrus fruit juice, incl kumquat commodities)
RAC 0.02 21.16 0.42 2.94 0.06 58.52 1.17 0.44 0.01 5.13 0.10
FP 0226 Apple, raw (incl juice, incl cider) RAC 0.11 66.71 7.34 2.19 0.24 65.63 7.22 188.34 20.72 1.38 0.15
FB 0020 Blueberries, raw RAC 2.27 NC - NC - 0.20 0.45 NC - NC -
FB 0269 Grape, raw (incl must, incl dried, incl juice, incl wine)
RAC 0.16 0.60 0.10 1.26 0.20 103.25 16.52 0.74 0.12 44.23 7.08
FB 0275 Strawberry, raw RAC 0.25 0.10 0.03 0.10 0.03 3.35 0.84 0.10 0.03 0.10 0.03
- Onions, mature bulbs, dry RAC 0.23 9.01 2.07 20.24 4.66 30.90 7.11 9.61 2.21 2.11 0.49
- Onions, green, raw RAC 0.52 1.43 0.74 0.10 0.05 0.20 0.10 NC - 6.30 3.28
VC 0424 Cucumber, raw RAC 0.02 0.68 0.01 1.81 0.04 10.40 0.21 0.10 0.00 0.10 0.00
VO 0444 Peppers, chili, raw (incl dried) RAC 0.01 7.55 0.08 12.48 0.12 24.78 0.25 0.87 0.01 NC -
VO 0445 Peppers, sweet, raw (incl dried) RAC 0.01 5.49 0.05 10.57 0.11 8.84 0.09 0.91 0.01 NC -
VO 0447 Sweet corn on the cob, raw (incl frozen, incl canned) (i.e. kernels plus cob without husks)
RAC 0.01 3.63 0.04 20.50 0.21 8.78 0.09 0.10 0.00 0.17 0.00
VO 0448 Tomato, raw (incl canned, excl juice, excl paste)
RAC 0.21 13.10 2.75 4.90 1.03 62.16 13.05 1.04 0.22 0.10 0.02
- Tomato, paste (i.e. concentrated tomato sauce/puree)
PP 0.07 0.58 0.04 0.22 0.02 2.21 0.15 0.24 0.02 3.10 0.22
JF 0448 Tomato, juice (single strength, incl concentrated)
PP 0 0.10 0.00 0.10 0.00 0.42 0.00 0.10 0.00 0.10 0.00
VL 0485 Mustard greens, raw (i.e. Brassica) RAC 0.07 0.10 0.01 0.10 0.01 NC - 0.10 0.01 NC -
VL 0502 Spinach, raw RAC 0.35 0.17 0.06 0.10 0.04 0.81 0.28 0.10 0.04 NC -
VL 0506 Turnip greens, raw (i.e. Namenia, Tendergreen)
RAC 1.2 NC - NC - NC - NC - NC -
VP 0061 Beans, green, with pods, raw: beans except broad bean & soya bean (i.e. immature seeds + pods) (Phaseolus spp)
RAC 0.31 NC - NC - NC - NC - NC -

Annex 3
89 MALATHION (49)
International Estimated Daily Intake (IEDI) ADI = 0–0.3 mg/kg bw
STMR
mg/kg
Diets as g/person/day Intake as µg/person/day
Codex code Commodity description Expr as
G13 diet
G13 intake
G14 diet
G14 intake
G15 diet
G15 intake
G16 diet
G16 intake
G17 diet
G17 intake
VD 0071 Beans, dry, raw (Phaseolus spp) RAC 0.36 7.11 2.56 2.33 0.84 3.76 1.35 44.70 16.09 3.27 1.18
VR 0506 Garden turnip, raw RAC 0.05 4.29 0.21 3.10 0.16 6.41 0.32 2.90 0.15 5.79 0.29
VS 0621 Asparagus RAC 0.305 0.10 0.03 0.10 0.03 0.17 0.05 0.10 0.03 NC -
GC 0645 Maize, raw (incl glucose & dextrose & isoglucose, incl flour, incl oil, incl beer, incl germ, incl starch)
RAC 0.01 116.66 1.17 10.52 0.11 38.46 0.38 76.60 0.77 34.44 0.34
GC 0651 Sorghum, raw (incl flour, incl beer) RAC 0.235 89.16 20.95 2.02 0.47 NC - 35.38 8.31 NC -
GC 0654 Wheat, raw (incl bulgur, incl fermented beverages, excl germ, excl wholemeal bread, excl white flour products, excl white bread)
RAC 10 0.10 1.00 0.10 1.00 0.10 1.00 0.10 1.00 0.97 9.70
CF 0654 Wheat, bran PP 25 NC - NC - NC - NC - NC -
CF 1212 Wheat, wholemeal flour PP 7.5 NC - NC - NC - NC - NC -
CP 1212 Wheat, wholemeal bread PP 1.2 0.10 0.12 0.10 0.12 0.10 0.12 0.10 0.12 0.10 0.12
CP 1211 Wheat, white bread PP 0.2 0.43 0.09 0.41 0.08 1.56 0.31 0.11 0.02 0.10 0.02
- Wheat, gluten PP 0.012 0.10 0.00 0.10 0.00 0.10 0.00 0.10 0.00 0.19 0.00
SO 0691 Cotton seed, raw RAC 4.8 NC - NC - NC - NC - NC -
OR 0691 Cotton seed oil, edible PP 3.12 1.28 3.99 0.10 0.31 0.45 1.40 0.42 1.31 0.15 0.47
Total intake (µg/person) =
43.9
9.9
52.5
51.2 23.5
Body weight per region (kg bw) =
60
60
60
60
60
ADI (µg/person) =
18 000
18 000
18 000
18 000
18 000
%ADI =
0.2%
0.1%
0.3%
0.3%
0.1%
Rounded %ADI =
0%
0%
0%
0%
0%


Annex 4
91 ANNEX 4: INTERNATIONAL ESTIMATES OF SHORT-TERM DIETARY INTAKES OF PESTICIDE RESIDUES
DIAZINON (22)
IESTI
ARfD = 0.03 mg/kg bw (30 µg/kg bw)
Maximum %ARfD:
100% 100% 100%
all gen pop child
Codex code Commodity Processing
STMR or
STMR-P
mg/kg
HR or HR-P
mg/kg DCF
Coun- try
Population group n
Large portion,
g/person
Unit weight,
edible portion,
g
Varia-bility factor Case
IESTI µg/kg
bw/day
% ARfD
rounded
% ARfD
rounded
% ARfD
rounded
FP 0226 Apple (all commodities)
highest utilization: Total
0.004 0.24 1.000 US Child, 1–6 yrs
- 624.45 127.0 3 2a 0.04–14.05
0–50% 0–20% 0–50%
FP 0227 Crab-apple (all commodities)
highest utilization: raw with peel
0 0.24 1.000 CN Gen pop, > 1 yrs
204 488.33 - - - 0–0 0–0% 0–0% 0–0%
FP 0228 Loquat (Japanese medlar) (all commodities)
highest utilization: raw without peel
0 0.24 1.000 JP Gen pop, > 1 yrs
113 326.40 49.0 3 2a 0.42–1.88
1–6% 1–6% 0–0%
FP 0229 Medlar Total 0.24 1.000 - - - - - - - - - - -
FP 0230 Pear (all commodities)
highest utilization: raw with peel (incl consumption without peel)
0.004 0.24 1.000 CN Child, 1–6 yrs
413 418.33 255.0 3 2a 0–13.81 0–50% 0–20% 0–50%
FT 0307 Persimmon, Japanese (all commodities)
highest utilization: raw with peel (incl consumption without peel)
0 0.24 1.000 TH Child, 3–6 yrs
20 264.88 227.5 3 2a 3.53–10.1
10–30%
10–20%
30–30%
FP 0231 Quince (all commodities)
highest utilization: Total
0 0.24 1.000 DE Child, 2–4 yrs
16 26.30 301.2 3 2b 1.17–1.17
4–4% 0–0% 4–4%
FS 0013 Cherries (all commodities)
highest utilization: raw
0 0.73 1.000 DE Child, 2–4 yrs
24 187.50 7.2 NR 1 0.83–8.48
3–30% 3–30% 8–30%
FS 0014 Plums (all commodities)
highest utilization: raw with peel (incl consumption without
0 0.78–1.9
1.000 TH Child, 3–6 yrs
11 376.88 93.0 3 2a 3.04–25.68
10–90%
4–40% 10–90%

Annex 4
92
DIAZINON (22)
IESTI
ARfD = 0.03 mg/kg bw (30 µg/kg bw)
Maximum %ARfD:
100% 100% 100%
all gen pop child
Codex code Commodity Processing
STMR or
STMR-P
mg/kg
HR or HR-P
mg/kg DCF
Coun- try
Population group n
Large portion,
g/person
Unit weight,
edible portion,
g
Varia-bility factor Case
IESTI µg/kg
bw/day
% ARfD
rounded
% ARfD
rounded
% ARfD
rounded
peel)
FS 0247 Peach (all commodities)
highest utilization: raw with peel (incl consumption without peel)
0 0.2 1.000 JP Child, 1–6 yrs
76 306.00 255.0 3 2a 1.09–10.53
4–40% 2–10% 4–40%
FB 0264
Blackberries (all commodities)
highest utilization: raw with skin
0 0.1 1.000 DE Gen pop, 14–80 yrs
35 460.00 2.4 NR 1 0.02–0.6 0–2% 0–2% 0–2%
FB 0266
Dewberries, incl boysen- & loganberry
Total 0.1 1.000 AU Child, 2–6 yrs
328 3.23 < 25 NR 1 0.02 0% - 0%
FB 0272
Raspberries, red, black (all commodities)
highest utilization: Total
0 0.2 1.000 FR Child, 3–6 yrs
0 157.50 4.3 NR 1 0.07–1.67
0–6% 1–3% 0–6%
FB 0021
Currants, red, black, white (all commodities)
highest utilization: Total
0 0.21 1.000 AU Gen pop, > 2 yrs
322 797.60 14.9 NR 1 0.14–2.5 0–8% 0–8% 0–7%
FB 0265
Cranberry (all commodities)
highest utilization: Total
0 0.13 1.000 AU Child, 2–16 yrs
103 279.66 1.8 NR 1 0.08–0.96
0–3% 0–2% 3–3%
FB 0275
Strawberry (all commodities)
highest utilization: Total
0 0.12 1.000 FR Child, 3–6 yrs
0 339.40 13.4 NR 1 0.14–2.15
0–7% 0–4% 0–7%
FI 0353 Pineapple (all commodities)
highest utilization: raw without peel
0 0.07–0.2
1.000 JP Child, 1–6 yrs
67 499.80 1116.0 3 2b 2.33–6.17
8–20% 4–10% 10–20%
VA 0385
Onion, bulb (all commodities)
highest utilization: raw without skin
0 0.05 1.000 JP Child, 1–6 yrs
748 102.00 244.4 3 2b 0.08–0.93
0–3% 0–1% 0–3%
VA 0389
Spring onion (all commodities)
highest utilization: cooked/boiled
0 0.65 1.000 NL Child, 2–6 yrs
E 20.30 30.0 3 2b 1.66–2.15
6–7% 3–3% 6–7%
VB 0041
Cabbage, head (all commodities)
highest utilization: raw
0 0.35 1.000 CN Child, 1–6 yrs
287 255.54 1402.5 3 2b 13.35–16.63
40–60%
20–30%
40–60%

Annex 4
93
DIAZINON (22)
IESTI
ARfD = 0.03 mg/kg bw (30 µg/kg bw)
Maximum %ARfD:
100% 100% 100%
all gen pop child
Codex code Commodity Processing
STMR or
STMR-P
mg/kg
HR or HR-P
mg/kg DCF
Coun- try
Population group n
Large portion,
g/person
Unit weight,
edible portion,
g
Varia-bility factor Case
IESTI µg/kg
bw/day
% ARfD
rounded
% ARfD
rounded
% ARfD
rounded
VB 0400
Broccoli (all commodities)
highest utilization: cooked/boiled
0 0.23 1.000 NL Toddler, 8–20 m
125 160.73 286.0 3 2b 3.61–10.87
10–40%
10–10%
10–40%
VB 0405
Kohlrabi (all commodities)
highest utilization: Total
0 0.2 1.000 DE Child, 2–4 yrs
34 161.80 175.2 3 2b 0.62–6.01
2–20% 2–6% 4–20%
VC 0046
Melons, except watermelon (all commodities)
highest utilization: Total
0 0.18 1.000 FR Child, 3–6 yrs
0 358.11 420.0 3 2b 9.93–10.23
30–30%
20–30%
30–30%
VC 0424
Cucumber (all commodities)
highest utilization: raw with skin
0 0.1 1.000 CN Child, 1–6 yrs
340 212.11 458.1 3 2b 0.91–3.94
3–10% 3–8% 2–10%
VC 0431
Squash, summer (courgette, marrow, zucchetti, zucchini) (all commodities)
highest utilization: Total
0 0.05 1.000 FR Child, 3–6 yrs
0 148.84 270.0 3 2b 0.16–1.18
1–4% 1–3% 4–4%
VO 0445
Peppers, sweet (incl. pim(i)ento) (bell pepper, paprika) (all commodities)
highest utilization: raw with skin
0 0.05 1.000 CN Child, 1–6 yrs
1002 169.85 170.0 3 2b 0.3–1.58 1–5% 0–2% 1–5%
VO 0447
Sweet corn (corn-on-the-cob) (all commodities)
highest utilization: cooked/boiled
0 0.02 1.000 TH Child, 3–6 yrs
1383 196.99 191.1 3 2a 0.08–0.68
0–2% 0–1% 0–2%
VO 0448
Tomato (all other commodities)
highest utilization: raw with peel
0.48 1.000 CN Child, 1–6 yrs
1117 263.76 180.0 3 2a 10.35–18.56
30–60%
9–20% 30–60%
VO 0448
Tomato dried 0.48 5.000 AU Gen pop, > 2 yrs
61 861.10 8.0 NR 1 30.85 100% 100% 3%
VL 0466
Chinese cabbage, type pak-choi (all commodities)
highest utilization: raw
0 0.05 1.000 CN Child, 1–6 yrs
1966 327.07 1548.4 3 2b 0.62–3.04
2–10% 2–6% 2–10%

Annex 4
94
DIAZINON (22)
IESTI
ARfD = 0.03 mg/kg bw (30 µg/kg bw)
Maximum %ARfD:
100% 100% 100%
all gen pop child
Codex code Commodity Processing
STMR or
STMR-P
mg/kg
HR or HR-P
mg/kg DCF
Coun- try
Population group n
Large portion,
g/person
Unit weight,
edible portion,
g
Varia-bility factor Case
IESTI µg/kg
bw/day
% ARfD
rounded
% ARfD
rounded
% ARfD
rounded
VL 0467
Chinese cabbage, type pe-tsai (all commodities)
highest utilization: Total
0 0.02 1.000 CN Child, 1–6 yrs
2788 336.16 1500.0 3 2b 0.25–1.25
1–4% 1–3% 1–4%
VL 0480
Kale (borecole, collards) (all commodities)
highest utilization: Total
0 0.02 1.000 DE Gen pop, 14–80 yrs
123 669.80 672.0 3 2b 0.33–0.53
1–2% 1–2% 1–2%
VL 0482
Lettuce, head (all commodities)
highest utilization: raw
0 0.5 1.000 NL Child, 2–6 yrs
91 140.10 338.9 3 2b 4.7–11.42
20–40%
10–20%
20–40%
VL 0483
Lettuce, leaf Total 0.5 1.000 CN Child, 1–6 yrs
243 387.25 305.4 3 2a 30.92 100% 30% 100%
VL 0483
Lettuce, leaf raw 0.5 1.000 NL Child, 2–6 yrs
91 140.10 117.8 3 2a 10.21 30% 10% 30%
VL 0483
Lettuce, leaf cooked/boiled 0.5 1.000 NL Gen pop, > 1 yrs
2 220.89 79.0 3 2a 2.88 10% 10% NC
VL 0502
Spinach (all commodities)
highest utilization: Total
0 0.5 1.000 ZA Child, 1–5 yrs
- 237.48 197.8 3 2a 2.22–22.29
7–70% 7–20% 7–70%
VP 0061
Beans, green, with pods, raw: beans except broad bean & soya bean (i.e. immature seeds + pods) (Phaseolus spp) (all commodities)
highest utilization: canned/preserved
0 0.2 1.000 NL Toddler, 8–20 m
E 127.90 2.3 NR 1 0.76–2.51
3–8% 3–5% 8–8%
VP 0064
Peas, green, without pods, raw (i.e. immature seeds only) (Pisum spp) (all commodities)
highest utilization: Total
0 0.2 1.000 UK Child, 1.5–4.5 yrs
57 174.00 < 25 NR 1 0.76–2.4 3–8% 2–6% 4–8%

Annex 4
95
DIAZINON (22)
IESTI
ARfD = 0.03 mg/kg bw (30 µg/kg bw)
Maximum %ARfD:
100% 100% 100%
all gen pop child
Codex code Commodity Processing
STMR or
STMR-P
mg/kg
HR or HR-P
mg/kg DCF
Coun- try
Population group n
Large portion,
g/person
Unit weight,
edible portion,
g
Varia-bility factor Case
IESTI µg/kg
bw/day
% ARfD
rounded
% ARfD
rounded
% ARfD
rounded
VR 0494
Radish (all commodities)
highest utilization: raw with skin
0 0.1 1.000 NL Child, 2–6 yrs
E 64.40 172.0 3 2b 0.14–1.05
0–4% 0–1% 0–4%
VR 0577
Carrot (all commodities)
highest utilization: raw with skin
0 0.5 1.000 CN Child, 1–6 yrs
400 234.68 300.0 3 2b 4.08–21.82
10–70%
10–30%
10–70%
VR 0589
Potato (all commodities)
highest utilization: Total
0 0 1.000 ZA Child, 1–5 yrs
- 299.62 216.0 3 2a 0–0 0–0% 0–0% 0–0%
VR 0596
Sugar beet (all commodities)
highest utilization: Total
0 0.1 1.000 DE Gen pop, 14–80 yrs
26295 161.79 160.0 3 2a 0.63–0.63
2–2% 2–2% 0–0%
GC 0645
Maize (corn) Total 0 1.000 CN Child, 1–6 yrs
166 524.69 < 25 NR 3 ND - - -
TN 0660
Almonds (all commodities)
highest utilization: raw incl roasted
0 0.03 1.000 DE Women, 14–50 yrs
24 100.00 1.2 NR 1 0.03–0.04
0–0% 0–0% 0–0%
TN 0678
Walnut (all commodities)
highest utilization: raw incl roasted
0 0 1.000 DE Child, 2–4 yrs
75 49.40 7.0 NR 1 0–0 0–0% 0–0% 0–0%
DH 1100
Hops, dry Total 0.45 1.000 DE Gen pop, 14–80 yrs
5866 8.50 < 25 NR 3 ND - - -
MM 0095
Meat from mammals other than marine mammals
Total NA NA 1.000 CN Child, 1–6 yrs
302 264.84 NR NR 1 NA 30% 20% 30%
MM 0095
Meat from mammals other than marine mammals: 20% as fat
Total 2 1.000 CN Child, 1–6 yrs
302 52.97 NR NR 1 6.57 20% 10% 20%
MM 0095
Meat from mammals other than marine mammals: 80% as muscle
Total 0.13333 1.000 CN Child, 1–6 yrs
302 211.87 NR NR 1 1.75 6% 4% 6%
MO Edible offal Total 0.03 1.000 US Child, 1–6 - 186.60 NR NR 1 0.37 1% 1% 1%

Annex 4
96
DIAZINON (22)
IESTI
ARfD = 0.03 mg/kg bw (30 µg/kg bw)
Maximum %ARfD:
100% 100% 100%
all gen pop child
Codex code Commodity Processing
STMR or
STMR-P
mg/kg
HR or HR-P
mg/kg DCF
Coun- try
Population group n
Large portion,
g/person
Unit weight,
edible portion,
g
Varia-bility factor Case
IESTI µg/kg
bw/day
% ARfD
rounded
% ARfD
rounded
% ARfD
rounded
0105 (mammalian) yrs
ML 0106
Milks Total 0.02 1.000 NL Toddler, 8–20 m
1882 1060.67 NR NR 3 ND - - -
PM 0110
Poultry meat Total NA NA 1.000 CN Child, 1–6 yrs
175 347.00 NR NR 1 NA 1% 1% 1%
PM 0110
Poultry meat: 10% as fat
Total 0.02 1.000 CN Child, 1–6 yrs
175 34.70 NR NR 1 0.04 0% 0% 0%
PM 0110
Poultry meat: 90% as muscle
Total 0.02 1.000 CN Child, 1–6 yrs
175 312.30 NR NR 1 0.39 1% 1% 1%
PO 0111
Poultry, edible offal (includes kidney, liver and skin)
Total 0.02 1.000 CN Gen pop, > 1 yrs
421 345.63 NR NR 1 0.13 0% 0% 0%
PE 0112 Eggs Total 0.02 1.000 CN Child, 1–6 yrs
136 195.82 NR NR 1 0.24 1% 0% 1%

Annex 4
97
MALATHION (49)
IESTI
ARfD = 2 mg/kg bw (2000 µg/kg bw)
Maximum %ARfD:
9% 5% 9%
all gen pop child
Codex code Commodity Processing
STMR or
STMR-P mg/kg
HR or HR-P
mg/kg DCF
Coun- try
Population group n
Large portion,
g/person
Unit weight,
edible portion,
g
Varia-bility factor Case
IESTI µg/kg
bw/day
% ARfD
rounded
% ARfD
rounded
% ARfD
rounded
001 CITRUS FRUITS - 0.22 - - - - - - - - - - - -
FC 0303
Kumquats (all commodities)
highest utilization: Total
0 0.22 1.000 JP Gen pop, > 1 yrs
135 120.00 < 25 NR 1 0.04–0.53
0–0% 0–0% 0–0%
FC 0204
Lemon (all commodities)
highest utilization: Total
0.02 0.22 1.000 FR Child, 3–6 yrs
0 58.15 64.0 3 2b 0.01–2.03
0–0% 0–0% 0–0%
FC 0205
Lime (all commodities)
highest utilization: Total
0.02 0.22 1.000 AU Gen pop, > 2 yrs
579 259.21 49.0 3 2a 0–1.17 0–0% 0–0% 0–0%
001B Mandarins - 0.22 - - - - - - - - - - - -
FC 0003
Mandarins (incl mandarin-like hybrids) (all commodities)
highest utilization: raw, without peel
0.02 0.22 1.000 CN Child, 1–6 yrs
151 586.75 124.3 3 2a 0–11.39 0–1% 0–0% 0–1%
FC 0004
Oranges, sweet, sour (incl orange-like hybrids) (all commodities)
highest utilization: Total
0.02 0.22 1.000 AU Child, 2–6 yrs
1735 800.83 155.8 3 2a 0.01–12.88
0–1% 0–0% 0–1%
FC 0005
Pummelo and Grapefruits (incl Shaddock-like hybrids, among others Grapefruit) (all commodities)
highest utilization: raw, without peel
0.02 0.22 1.000 DE Child, 2–4 yrs
12 358.60 178.5 3 2a 0–9.75 0–0% 0–0% 0–0%
FP 0226 Apple (all commodities)
highest utilization: Total
0.11 0.37 1.000 US Child, 1–6 yrs
- 624.45 127.0 3 2a 0.33–21.67
0–1% 0–0% 0–1%
FB Blueberries highest utilization: 0 7.5 1.000 DE Gen pop, 70 388.00 1.8 NR 1 17.6– 1–2% 0–2% 1–2%

Annex 4
98
MALATHION (49)
IESTI
ARfD = 2 mg/kg bw (2000 µg/kg bw)
Maximum %ARfD:
9% 5% 9%
all gen pop child
Codex code Commodity Processing
STMR or
STMR-P mg/kg
HR or HR-P
mg/kg DCF
Coun- try
Population group n
Large portion,
g/person
Unit weight,
edible portion,
g
Varia-bility factor Case
IESTI µg/kg
bw/day
% ARfD
rounded
% ARfD
rounded
% ARfD
rounded
0020 (all commodities) raw with skin 14–80 yrs 38.1
FB 0269
Grape (all commodities)
highest utilization: raw with skin
0 2.6 1.000 CN Child, 1–6 yrs
232 366.72 636.6 3 2b 8.24–177.27
0–9% 0–4% 0–9%
FB 0275
Strawberry (all commodities)
highest utilization: Total
0 0.59 1.000 FR Child, 3–6 yrs
0 339.40 13.4 NR 1 0.67–10.6
0–1% 0–0% 0–1%
VA 0385
Onion, bulb (all commodities)
highest utilization: raw without skin
0 0.59 1.000 JP Child, 1–6 yrs
748 102.00 244.4 3 2b 0.94–11.01
0–1% 0–0% 0–1%
VA 0389
Spring onion (all commodities)
highest utilization: cooked/boiled
0 5 1.000 NL Child, 2–6 yrs
E 20.30 30.0 3 2b 12.74–16.55
1–1% 0–0% 1–1%
VC 0424
Cucumber (all commodities)
highest utilization: raw with skin
0 0.1 1.000 CN Child, 1–6 yrs
340 212.11 458.1 3 2b 0.91–3.94
0–0% 0–0% 0–0%
VO 0444
Peppers, chili (all commodities)
highest utilization: raw with skin
0 0.08 1.000 CN Gen pop, > 1 yrs
1743 295.71 43.2 3 2a 0.06–0.57
0–0% 0–0% 0–0%
VO 0445
Peppers, sweet (incl. pim(i)ento) (bell pepper, paprika) (all commodities)
highest utilization: raw with skin
0 0.08 1.000 CN Child, 1–6 yrs
1002 169.85 170.0 3 2b 0.48–2.53
0–0% 0–0% 0–0%
VO 0447
Sweet corn (corn-on-the-cob) (all commodities)
highest utilization: cooked/boiled
0 0.02 1.000 TH Child, 3–6 yrs
1383 196.99 191.1 3 2a 0.08–0.68
0–0% 0–0% 0–0%
VO 0448
Tomato (all commodities)
highest utilization: dried
0 0.0123–0.41
5.000 AU Gen pop, > 2 yrs
61 861.10 8.0 NR 1 8.84–26.35
0–1% 0–1% 0–1%
VL 0485
Mustard greens (all commodities)
highest utilization: raw
0 1.1 1.000 CN Child, 1–6 yrs
635 299.31 244.8 3 2a 8.12–53.78
0–3% 0–1% 0–3%
VL 0502
Spinach (all commodities)
highest utilization: Total
0 2.2 1.000 ZA Child, 1–5 yrs
- 237.48 197.8 3 2a 9.79–98.07
0–5% 0–2% 0–5%

Annex 4
99
MALATHION (49)
IESTI
ARfD = 2 mg/kg bw (2000 µg/kg bw)
Maximum %ARfD:
9% 5% 9%
all gen pop child
Codex code Commodity Processing
STMR or
STMR-P mg/kg
HR or HR-P
mg/kg DCF
Coun- try
Population group n
Large portion,
g/person
Unit weight,
edible portion,
g
Varia-bility factor Case
IESTI µg/kg
bw/day
% ARfD
rounded
% ARfD
rounded
% ARfD
rounded
VL 0506
Turnip greens (Namenia, Tendergreen) (all commodities)
highest utilization: cooked/boiled
0 3.4 1.000 NL Toddler, 8–20 m
64 90.73 < 25 NR 1 5.58–30.24
0–2% 0–1% 0–2%
VP 0061
Beans, green, with pods, raw: beans except broad bean & soya bean (i.e. immature seeds + pods) (Phaseolus spp) (all commodities)
highest utilization: canned/preserved
0 0.9 1.000 NL Toddler, 8–20 m
E 127.90 2.3 NR 1 3.42–11.29
0–1% 0–0% 1–1%
VD 0071
Beans (dry) (Phaseolus spp)
Total 1.2 1.000 FR Child, 3–6 yrs
0 145.38 0.5 NR 3 ND - - -
VR 0506
Turnip, garden (all commodities)
highest utilization: cooked/boiled (without peel)
0 0.13 1.000 NL Child, 2–6 yrs
E 133.31 176.0 3 2b 1.41–2.83
0–0% 0–0% 0–0%
VS 0621
Asparagus (all commodities)
highest utilization: Total
0 0.69 1.000 US Child, 1–6 yrs
- 142.56 42.4 3 2a 6.74–10.46
0–1% 0–0% 0–1%
GC 0645
Maize (corn) (all commodities)
highest utilization: Total
0.01 0 1.000 CN Child, 1–6 yrs
166 524.69 < 25 NR 3 0.01–0.33
0–0% 0–0% 0–0%
GC 0651
Sorghum (Chicken corn, Dari seed, Durra, Feterita) (all commodities)
highest utilization: cooked/boiled
0.235 0 0.400 CN Gen pop, > 1 yrs
356 1348.67 < 25 NR 3 0.05–2.38
0–0% 0–0% 0–0%
GC 0654
Wheat (all commodities)
highest utilization: Pasta/noodles (dry)
0.2–25 0 1.000 CN Child, 1–6 yrs
2023 225.90 NR NR 3 4–140 0–7% 0–5% 0–7%
SO 0691
Cotton seed (all commodities)
highest utilization: Oil (refined)
3.12–4.8 0 1.000 US Gen pop, all ages
- 9.10 NR NR 3 0.24–0.44
0–0% 0–0% 0–0%

100

Annex 5 101
101
ANNEX 5: REPORTS AND OTHER DOCUMENTS RESULTING FROM PREVIOUS JOINT MEETINGS OF THE FAO PANEL OF EXPERTS ON PESTICIDE RESIDUES IN FOOD AND THE ENVIRONMENT AND THE WHO CORE ASSESSMENT GROUP ON
PESTICIDE RESIDUES
1. Principles governing consumer safety in relation to pesticide residues. Report of a meeting of a WHO Expert Committee on Pesticide Residues held jointly with the FAO Panel of Experts on the Use of Pesticides in Agriculture. FAO Plant Production and Protection Division Report, No. PL/1961/11; WHO Technical Report Series, No. 240, 1962.
2. Evaluation of the toxicity of pesticide residues in food. Report of a Joint Meeting of the FAO Committee on Pesticides in Agriculture and the WHO Expert Committee on Pesticide Residues. FAO Meeting Report, No. PL/1963/13; WHO/Food Add./23, 1964.
3. Evaluation of the toxicity of pesticide residues in food. Report of the Second Joint Meeting of the FAO Committee on Pesticides in Agriculture and the WHO Expert Committee on Pesticide Residues. FAO Meeting Report, No. PL/1965/10; WHO/Food Add./26.65, 1965.
4. Evaluation of the toxicity of pesticide residues in food. FAO Meeting Report, No. PL/1965/10/1; WHO/Food Add./27.65, 1965.
5. Evaluation of the hazards to consumers resulting from the use of fumigants in the protection of food. FAO Meeting Report, No. PL/1965/10/2; WHO/Food Add./28.65, 1965.
6. Pesticide residues in food. Joint report of the FAO Working Party on Pesticide Residues and the WHO Expert Committee on Pesticide Residues. FAO Agricultural Studies, No. 73; WHO Technical Report Series, No. 370, 1967.
7. Evaluation of some pesticide residues in food. FAO/PL:CP/15; WHO/Food Add./67.32, 1967.
8. Pesticide residues. Report of the 1967 Joint Meeting of the FAO Working Party and the WHO Expert Committee. FAO Meeting Report, No. PL:1967/M/11; WHO Technical Report Series, No. 391, 1968.
9. 1967 Evaluations of some pesticide residues in food. FAO/PL:1967/M/11/1; WHO/Food Add./68.30, 1968.
10. Pesticide residues in food. Report of the 1968 Joint Meeting of the FAO Working Party of Experts on Pesticide Residues and the WHO Expert Committee on Pesticide Residues. FAO Agricultural Studies, No. 78; WHO Technical Report Series, No. 417, 1968.
11. 1968 Evaluations of some pesticide residues in food. FAO/PL:1968/M/9/1; WHO/Food Add./69.35, 1969.
12. Pesticide residues in food. Report of the 1969 Joint Meeting of the FAO Working Party of Experts on Pesticide Residues and the WHO Expert Group on Pesticide Residues. FAO Agricultural Studies, No. 84; WHO Technical Report Series, No. 458, 1970.
13. 1969 Evaluations of some pesticide residues in food. FAO/PL:1969/M/17/1; WHO/Food Add./70.38, 1970.

102 Annex 5
14. Pesticide residues in food. Report of the 1970 Joint Meeting of the FAO Working Party of Experts on Pesticide Residues and the WHO Expert Committee on Pesticide Residues. FAO Agricultural Studies, No. 87; WHO Technical Report Series, No. 4574, 1971.
15. 1970 Evaluations of some pesticide residues in food. AGP:1970/M/12/1; WHO/Food Add./71.42, 1971.
16. Pesticide residues in food. Report of the 1971 Joint Meeting of the FAO Working Party of Experts on Pesticide Residues and the WHO Expert Committee on Pesticide Residues. FAO Agricultural Studies, No. 88; WHO Technical Report Series, No. 502, 1972.
17. 1971 Evaluations of some pesticide residues in food. AGP:1971/M/9/1; WHO Pesticide Residue Series, No. 1, 1972.
18. Pesticide residues in food. Report of the 1972 Joint Meeting of the FAO Working Party of Experts on Pesticide Residues and the WHO Expert Committee on Pesticide Residues. FAO Agricultural Studies, No. 90; WHO Technical Report Series, No. 525, 1973.
19. 1972 Evaluations of some pesticide residues in food. AGP:1972/M/9/1; WHO Pesticide Residue Series, No. 2, 1973.
20. Pesticide residues in food. Report of the 1973 Joint Meeting of the FAO Working Party of Experts on Pesticide Residues and the WHO Expert Committee on Pesticide Residues. FAO Agricultural Studies, No. 92; WHO Technical Report Series, No. 545, 1974.
21. 1973 Evaluations of some pesticide residues in food. FAO/AGP/1973/M/9/1; WHO Pesticide Residue Series, No. 3, 1974.
22. Pesticide residues in food. Report of the 1974 Joint Meeting of the FAO Working Party of Experts on Pesticide Residues and the WHO Expert Committee on Pesticide Residues. FAO Agricultural Studies, No. 97; WHO Technical Report Series, No. 574, 1975.
23. 1974 Evaluations of some pesticide residues in food. FAO/AGP/1974/M/11; WHO Pesticide Residue Series, No. 4, 1975.
24. Pesticide residues in food. Report of the 1975 Joint Meeting of the FAO Working Party of Experts on Pesticide Residues and the WHO Expert Committee on Pesticide Residues. FAO Plant Production and Protection Series, No. 1; WHO Technical Report Series, No. 592, 1976.
25. 1975 Evaluations of some pesticide residues in food. AGP:1975/M/13; WHO Pesticide Residue Series, No. 5, 1976.
26. Pesticide residues in food. Report of the 1976 Joint Meeting of the FAO Panel of Experts on Pesticide Residues and the Environment and the WHO Expert Group on Pesticide Residues. FAO Food and Nutrition Series, No. 9; FAO Plant Production and Protection Series, No. 8; WHO Technical Report Series, No. 612, 1977.
27. 1976 Evaluations of some pesticide residues in food. AGP:1976/M/14, 1977.
28. Pesticide residues in food – 1977. Report of the Joint Meeting of the FAO Panel of Experts on Pesticide Residues and Environment and the WHO Expert Group on Pesticide Residues. FAO Plant Production and Protection Paper 10 Rev, 1978.

Annex 5 103
103
29. Pesticide residues in food: 1977 evaluations. FAO Plant Production and Protection Paper 10 Suppl., 1978.
30. Pesticide residues in food – 1978. Report of the Joint Meeting of the FAO Panel of Experts on Pesticide Residues and Environment and the WHO Expert Group on Pesticide Residues. FAO Plant Production and Protection Paper 15, 1979.
31. Pesticide residues in food: 1978 evaluations. FAO Plant Production and Protection Paper 15 Suppl., 1979.
32. Pesticide residues in food – 1979. Report of the Joint Meeting of the FAO Panel of Experts on Pesticide Residues in Food and the Environment and the WHO Expert Group on Pesticide Residues. FAO Plant Production and Protection Paper 20, 1980.
33. Pesticide residues in food: 1979 evaluations. FAO Plant Production and Protection Paper 20 Suppl., 1980
34. Pesticide residues in food – 1980. Report of the Joint Meeting of the FAO Panel of Experts on Pesticide Residues in Food and the Environment and the WHO Expert Group on Pesticide Residues. FAO Plant Production and Protection Paper 26, 1981.
35. Pesticide residues in food: 1980 evaluations. FAO Plant Production and Protection Paper 26 Suppl., 1981.
36. Pesticide residues in food – 1981. Report of the Joint Meeting of the FAO Panel of Experts on Pesticide Residues in Food and the Environment and the WHO Expert Group on Pesticide Residues. FAO Plant Production and Protection Paper 37, 1982.
37. Pesticide residues in food: 1981 evaluations. FAO Plant Production and Protection Paper 42, 1982.
38. Pesticide residues in food – 1982. Report of the Joint Meeting of the FAO Panel of Experts on Pesticide Residues in Food and the Environment and the WHO Expert Group on Pesticide Residues. FAO Plant Production and Protection Paper 46, 1982.
39. Pesticide residues in food: 1982 evaluations. FAO Plant Production and Protection Paper 49, 1983.
40. Pesticide residues in food – 1983. Report of the Joint Meeting of the FAO Panel of Experts on Pesticide Residues in Food and the Environment and the WHO Expert Group on Pesticide Residues. FAO Plant Production and Protection Paper 56, 1985.
41. Pesticide residues in food: 1983 evaluations. FAO Plant Production and Protection Paper 61, 1985.
42. Pesticide residues in food – 1984. Report of the Joint Meeting on Pesticide Residues. FAO Plant Production and Protection Paper 62, 1985.
43. Pesticide residues in food – 1984 evaluations. FAO Plant Production and Protection Paper 67, 1985.
104 Annex 5
44. Pesticide residues in food – 1985. Report of the Joint Meeting of the FAO Panel of Experts on Pesticide Residues in Food and the Environment and a WHO Expert Group on Pesticide Residues. FAO Plant Production and Protection Paper 68, 1986.
45. Pesticide residues in food – 1985 evaluations. Part I. Residues. FAO Plant Production and Protection Paper 72/1, 1986.
46. Pesticide residues in food – 1985 evaluations. Part II. Toxicology. FAO Plant Production and Protection Paper 72/2, 1986.
47. Pesticide residues in food – 1986. Report of the Joint Meeting of the FAO Panel of Experts on Pesticide Residues in Food and the Environment and a WHO Expert Group on Pesticide Residues. FAO Plant Production and Protection Paper 77, 1986.
48. Pesticide residues in food – 1986 evaluations. Part I. Residues. FAO Plant Production and Protection Paper 78, 1986.
49. Pesticide residues in food – 1986 evaluations. Part II. Toxicology. FAO Plant Production and Protection Paper 78/2, 1987.
50. Pesticide residues in food – 1987. Report of the Joint Meeting of the FAO Panel of Experts on Pesticide Residues in Food and the Environment and a WHO Expert Group on Pesticide Residues. FAO Plant Production and Protection Paper 84, 1987.
51. Pesticide residues in food – 1987 evaluations. Part I. Residues. FAO Plant Production and Protection Paper 86/1, 1988.
52. Pesticide residues in food – 1987 evaluations. Part II. Toxicology. FAO Plant Production and Protection Paper 86/2, 1988.
53. Pesticide residues in food – 1988. Report of the Joint Meeting of the FAO Panel of Experts on Pesticide Residues in Food and the Environment and a WHO Expert Group on Pesticide Residues. FAO Plant Production and Protection Paper 92, 1988.
54. Pesticide residues in food – 1988 evaluations. Part I. Residues. FAO Plant Production and Protection Paper 93/1, 1988.
55. Pesticide residues in food – 1988 evaluations. Part II. Toxicology. FAO Plant Production and Protection Paper 93/2, 1989.
56. Pesticide residues in food – 1989. Report of the Joint Meeting of the FAO Panel of Experts on Pesticide Residues in Food and the Environment and a WHO Expert Group on Pesticide Residues. FAO Plant Production and Protection Paper 99, 1989.
57. Pesticide residues in food – 1989 evaluations. Part I. Residues. FAO Plant Production and Protection Paper 100, 1990.
58. Pesticide residues in food – 1989 evaluations. Part II. Toxicology. FAO Plant Production and Protection Paper 100/2, 1990.
59. Pesticide residues in food – 1990. Report of the Joint Meeting of the FAO Panel of Experts on Pesticide Residues in Food and the Environment and a WHO Expert Group on Pesticide Residues. FAO Plant Production and Protection Paper 102, Rome, 1990.

Annex 5 105
105
60. Pesticide residues in food – 1990 evaluations. Part I. Residues. FAO Plant Production and Protection Paper 103/1, Rome, 1990.
61. Pesticide residues in food – 1990 evaluations. Part II. Toxicology. World Health Organization, WHO/PCS/91.47, Geneva, 1991.
62. Pesticide residues in food – 1991. Report of the Joint Meeting of the FAO Panel of Experts on Pesticide Residues in Food and the Environment and a WHO Expert Group on Pesticide Residues. FAO Plant Production and Protection Paper 111, Rome, 1991.
63. Pesticide residues in food – 1991 evaluations. Part I. Residues. FAO Plant Production and Protection Paper 113/1, Rome, 1991.
64. Pesticide residues in food – 1991 evaluations. Part II. Toxicology. World Health Organization, WHO/PCS/92.52, Geneva, 1992.
65. Pesticide residues in food – 1992. Report of the Joint Meeting of the FAO Panel of Experts on Pesticide Residues in Food and the Environment and a WHO Expert Group on Pesticide Residues. FAO Plant Production and Protection Paper 116, Rome, 1993.
66. Pesticide residues in food – 1992 evaluations. Part I. Residues. FAO Plant Production and Protection Paper 118, Rome, 1993.
67. Pesticide residues in food – 1992 evaluations. Part II. Toxicology. World Health Organization, WHO/PCS/93.34, Geneva, 1993.
68. Pesticide residues in food – 1993. Report of the Joint Meeting of the FAO Panel of Experts on Pesticide Residues in Food and the Environment and a WHO Expert Group on Pesticide Residues. FAO Plant Production and Protection Paper 122, Rome, 1994.
69. Pesticide residues in food – 1993 evaluations. Part I. Residues. FAO Plant Production and Protection Paper 124, Rome, 1994.
70. Pesticide residues in food – 1993 evaluations. Part II. Toxicology. World Health Organization, WHO/PCS/94.4, Geneva, 1994.
71. Pesticide residues in food – 1994. Report of the Joint Meeting of the FAO Panel of Experts on Pesticide Residues in Food and the Environment and a WHO Expert Group on Pesticide Residues. FAO Plant Production and Protection Paper 127, Rome, 1995.
72. Pesticide residues in food – 1994 evaluations. Part I. Residues. FAO Plant Production and Protection Paper 131/1 and 131/2 (2 volumes), Rome, 1995.
73. Pesticide residues in food – 1994 evaluations. Part II. Toxicology. World Health Organization, WHO/PCS/95.2, Geneva, 1995.
74. Pesticide residues in food – 1995. Report of the Joint Meeting of the FAO Panel of Experts on Pesticide Residues in Food and the Environment and the WHO Core Assessment Group. FAO Plant Production and Protection Paper 133, Rome, 1996.
75. Pesticide residues in food – 1995 evaluations. Part I. Residues. FAO Plant Production and Protection Paper 137, 1996.

106 Annex 5
76. Pesticide residues in food – 1995 evaluations. Part II. Toxicological and Environmental. World Health Organization, WHO/PCS/96.48, Geneva, 1996.
77. Pesticide residues in food – 1996. Report of the Joint Meeting of the FAO Panel of Experts on Pesticide Residues in Food and the Environment and the WHO Core Assessment Group. FAO Plant Production and Protection Paper, 140, 1997.
78. Pesticide residues in food – 1996 evaluations. Part I. Residues. FAO Plant Production and Protection Paper, 142, 1997.
79. Pesticide residues in food – 1996 evaluations. Part II. Toxicological. World Health Organization, WHO/PCS/97.1, Geneva, 1997.
80. Pesticide residues in food – 1997. Report of the Joint Meeting of the FAO Panel of Experts on Pesticide Residues in Food and the Environment and the WHO Core Assessment Group. FAO Plant Production and Protection Paper, 145, 1998.
81. Pesticide residues in food – 1997 evaluations. Part I. Residues. FAO Plant Production and Protection Paper, 146, 1998.
82. Pesticide residues in food – 1997 evaluations. Part II. Toxicological and Environmental. World Health Organization, WHO/PCS/98.6, Geneva, 1998.
83. Pesticide residues in food – 1998. Report of the Joint Meeting of the FAO Panel of Experts on Pesticide Residues in Food and the Environment and the WHO Core Assessment Group. FAO Plant Production and Protection Paper, 148, 1999.
84. Pesticide residues in food – 1998 evaluations. Part I. Residues. FAO Plant Production and Protection Paper, 152/1 and 152/2 (two volumes).
85. Pesticide residues in food – 1998 evaluations. Part II. Toxicological and Environmental. World Health Organization, WHO/PCS/99.18, Geneva, 1999.
86. Pesticide residues in food – 1999. Report of the Joint Meeting of the FAO Panel of Experts on Pesticide Residues in Food and the Environment and the WHO Core Assessment Group. FAO Plant Production and Protection Paper, 153, 1999.
87. Pesticide residues in food – 1999 evaluations. Part I. Residues. FAO Plant Production and Protection Paper, 157, 2000.
88. Pesticide residues in food – 1999 evaluations. Part II. Toxicological. World Health Organization, WHO/PCS/00.4, Geneva, 2000.
89. Pesticide residues in food – 2000. Report of the Joint Meeting of the FAO Panel of Experts on Pesticide Residues in Food and the Environment and the WHO Core Assessment Group. FAO Plant Production and Protection Paper, 163, 2001.
90. Pesticide residues in food – 2000 evaluations. Part I. Residues. FAO Plant Production and Protection Paper, 165, 2001.
91. Pesticide residues in food – 2000 evaluations. Part II. Toxicological. World Health Organization, WHO/PCS/01.3, 2001.

Annex 5 107
107
92. Pesticide residues in food – 2001. Report of the Joint Meeting of the FAO Panel of Experts on Pesticide Residues in Food and the Environment and the WHO Core Assessment Group. FAO Plant Production and Protection Paper, 167, 2001.
93. Pesticide residues in food – 2001 evaluations. Part I. Residues. FAO Plant Production and Protection Paper, 171, 2002.
94. Pesticide residues in food – 2001 evaluations. Part II. Toxicological. World Health Organization, WHO/PCS/02.1, 2002.
95. Pesticide residues in food – 2002. Report of the Joint Meeting of the FAO Panel of Experts on Pesticide Residues in Food and the Environment and the WHO Core Assessment Group. FAO Plant Production and Protection Paper, 172, 2002.
96. Pesticide residues in food – 2002 evaluations. Part I. Residues. FAO Plant Production and Protection Paper, 175/1 and 175/2 (two volumes).
97. Pesticide residues in food – 2002 evaluations. Part II. Toxicological. World Health Organization, WHO/PCS, 2003.
98. Pesticide residues in food – 2003. Report of the Joint Meeting of the FAO Panel of Experts on Pesticide Residues in Food and the Environment and the WHO Core Assessment Group. FAO Plant Production and Protection Paper, 176, 2004.
99. Pesticide residues in food – 2003 evaluations. Part I. Residues. FAO Plant Production and Protection Paper, 177, 2004.
100. Pesticide residues in food – 2003 evaluations. Part II. Toxicological. World Health Organization, WHO/PCS, 2004.
101. Pesticide residues in food – 2004. Report of the Joint Meeting of the FAO Panel of Experts on Pesticide Residues in Food and the Environment and the WHO Core Assessment Group. FAO Plant Production and Protection Paper, 178, 2004.
102. Pesticide residues in food – 2004 evaluations. Part I. Residues. FAO Plant Production and Protection Paper, 182, 2005.
103. Pesticide residues in food – 2004 evaluations. Part II. Toxicological. World Health Organization, WHO/PCS, 2005.
104. Pesticide residues in food – 2005. Report of the Joint Meeting of the FAO Panel of Experts on Pesticide Residues in Food and the Environment and the WHO Core Assessment Group. FAO Plant Production and Protection Paper, 183, 2005.
105. Pesticide residues in food – 2005 evaluations. Part I. Residues. FAO Plant Production and Protection Paper, 184, 2006.
106. Pesticide residues in food – 2005 evaluations. Part II. Toxicological. World Health Organization, WHO/PCS/07.1, 2006.
107. Pesticide residues in food – 2006. Report of the Joint Meeting of the FAO Panel of Experts on Pesticide Residues in Food and the Environment and the WHO Core Assessment Group. FAO Plant Production and Protection Paper, 187, 2007.

108 Annex 5
108. Pesticide residues in food – 2006 evaluations. Part I. Residues. FAO Plant Production and Protection Paper, 189/1 and 189/2 (two volumes), 2007.
109. Pesticide residues in food – 2006 evaluations. Part II. Toxicological. World Health Organization, 2008.
110. Pesticide residues in food – 2007. Report of the Joint Meeting of the FAO Panel of Experts on Pesticide Residues in Food and the Environment and the WHO Core Assessment Group. FAO Plant Production and Protection Paper, 191, 2008.
111. Pesticide residues in food – 2007 evaluations. Part I. Residues. FAO Plant Production and Protection Paper, 192, 2008.
112. Pesticide residues in food – 2007 evaluations. Part II. Toxicological. World Health Organization, 2009.
113. Pesticide residues in food – 2008. Report of the Joint Meeting of the FAO Panel of Experts on Pesticide Residues in Food and the Environment and the WHO Core Assessment Group. FAO Plant Production and Protection Paper, 193, 2009.
114. Pesticide residues in food – 2008 evaluations. Part I. Residues. FAO Plant Production and Protection Paper, 194, 2009.
115. Pesticide residues in food – 2008 evaluations. Part II. Toxicological. World Health Organization, 2010.
116. Pesticide residues in food – 2009. Report of the Joint Meeting of the FAO Panel of Experts on Pesticide Residues in Food and the Environment and the WHO Core Assessment Group. FAO Plant Production and Protection Paper, 196, 2010.
117. Pesticide residues in food – 2009 evaluations. Part I. Residues. FAO Plant Production and Protection Paper, 198, 2010.
118. Pesticide residues in food – 2009 evaluations. Part II. Toxicological. World Health Organization, 2011.
119. Pesticide residues in food – 2010. Report of the Joint Meeting of the FAO Panel of Experts on Pesticide Residues in Food and the Environment and the WHO Core Assessment Group. FAO Plant Production and Protection Paper, 200, 2011.
120. Pesticide residues in food – 2010 evaluations. Part I. Residues. FAO Plant Production and Protection Paper, 206, 2011.
121. Pesticide residues in food – 2010 evaluations. Part II. Toxicological. World Health Organization, 2011.
122. Pesticide residues in food – 2011. Report of the Joint Meeting of the FAO Panel of Experts on Pesticide Residues in Food and the Environment and the WHO Core Assessment Group on Pesticide Residues. FAO Plant Production and Protection Paper, 211, 2012.
123. Pesticide residues in food – 2011 evaluations. Part I. Residues. FAO Plant Production and Protection Paper, 206, 2012.

Annex 5 109
109
124. Pesticide residues in food – 2011 evaluations. Part II. Toxicological. World Health Organization, 2012.
125. Pesticide residues in food – 2012. Report of the Joint Meeting of the FAO Panel of Experts on Pesticide Residues in Food and the Environment and the WHO Core Assessment Group on Pesticide Residues. FAO Plant Production and Protection Paper, 215, 2013.
126. Pesticide residues in food – 2012 evaluations. Part I. Residues. FAO Plant Production and Protection Paper, 216, 2013.
127. Pesticide residues in food – 2012 evaluations. Part II. Toxicological. World Health Organization, 2013.
128. Pesticide residues in food – 2013. Report of the Joint Meeting of the FAO Panel of Experts on Pesticide Residues in Food and the Environment and the WHO Core Assessment Group on Pesticide Residues. FAO Plant Production and Protection Paper, 219, 2014.
129. Pesticide residues in food – 2013 evaluations. Part I. Residues. FAO Plant Production and Protection Paper, 220, 2014.
130. Pesticide residues in food – 2013 evaluations. Part II. Toxicological. World Health Organization, 2014.
131. Pesticide residues in food – 2014. Report of the Joint Meeting of the FAO Panel of Experts on Pesticide Residues in Food and the Environment and the WHO Core Assessment Group on Pesticide Residues. FAO Plant Production and Protection Paper, 221, 2015.
132. Pesticide residues in food – 2014 evaluations. Part I. Residues. FAO Plant Production and Protection Paper, 222, 2015.
133. Pesticide residues in food – 2015 evaluations. Part II. Toxicological. World Health Organization, 2016.


FAOPLANT
PRODUCTIONAND PROTECTION
PAPER
227 227
ISSN 2070-2515227Pesticide residues in food 2016 –
Joint FAO/WHO Meeting on Pesticide Residues
FAO
Pesticide residuesin food 2016
REPORT2016
Special Session of the Joint FAO/WHO Meeting on Pesticide Residues
I5693E/1/05.16
8Biotecnología agrícola para países en desarrollo
FAO
Biotecnología agrícolapara países en desarrollo Resultados de un foro electrónico
ESTUDIO FAOINVESTIGACIÓNY TECNOLOGIA
En esta publicación se presenta un informe sobre las primeras seis conferencias mediante correo electrónico organizadas por el Foro electrónico de la FAO sobre la biotecnología en la alimentación y la agricultura,
celebradas entre marzo de 2000 y mayo de 2001. Todas las conferencias contaron con un moderador, duraron aproximadamente dos meses y se centraron en la biotecnología agrícola en los países en desarrollo. Las cuatro primeras conferencias trataron de la idoneidad para los países en desarrollo de las biotecnologías actualmente
disponibles en los sectores agrícola, pesquero, forestal y ganadero. Las otras dos conferencias trataron de las repercusiones de la biotecnología agrícola sobre el hambre y la seguridad alimentaria en los países en
desarrollo y las consecuencias de los derechos de propiedad intelectual en la alimentación y la agricultura en esos países.
8
ISSN 1020-055X
Etude prospective du secteur forestier en AfriqueRapport r gional Ð opportunit s et d �s ˆ l'horizon 2020
ƒTUDE FAOFORæTS
Ce rapport r gional de lÕEtude prospective du secteur forestier en Afrique fournit une vue dÕensemble des possibilit s o�ertes et des d �s ˆ relever pour renforcer la contribution du secteur forestier au d veloppement
durable de lÕAfrique, dans le contexte des changements politiques et institutionnels, d mographiques, conomiques, technologiques et environnementaux. Sur la base dÕun examen de lÕimpact des facteurs de changement et des sc narios probables, il donne une indication de ce qui pourrait arriver dÕici ˆ 2020, si les
tendances actuelles persistent. Les priorit s et les strat gies permettant de renforcer la contribution du secteur forestier au bien- tre social sont galement tudi es.
141
ISSN 1014-1197
412Title SPIN
EFAO
9 7 8 9 2 5 2 0 4 9 1 0 4TC/M/Y4521F/1/2.03/600
ISBN 92-5-204910-X ISSN 1014-2894
Title Spanishgdfgdfgdf sdJgfsdFFAO/WHO MeetingfSubtiltle
ESTUDIO FAOPRODUCCIîN
Y SANIDADANIMAL
Blurb TEXTHelvetica bold 8/12
412
ISSN 1014-1200
412Title SPIN
EFAO
A Joint Meeting of the FAO Panel of Experts on Pesticide Residues in Food and the Environment and the WHO Core Assessment Group on Pesticide Residues (JMPR) was held in Geneva, Switzerland, from 9 to 13 May 2016. The three pesticides evaluated at the meeting were placed on the agenda by the JMPR Secretariat following the recommendation of an electronic task force of the WHO Core Assessment Group that they be re-evaluated due to public health concerns identified by the
International Agency for Research on Cancer (IARC) and the availability of a significant number of new studies. During the meeting, the WHO Core Assessment Group was responsible for reviewing epidemiological, toxicological and related data in order to establish acceptable daily intakes (ADIs) and acute reference doses (ARfDs) of the pesticides for humans, where necessary. As no residue data
were requested, the FAO Expert was responsible for estimating the dietary exposures (both short-term and long-term) to the pesticides reveiewed and, on this basis, performed dietary risk assessments in relation to their ADIs or ARfDs. This report contains information on ADIs, ARfDs and general principles for the evaluation of pesticides. The recommendations of the Joint Meeting, including further research and information, are proposed for use by Member governments of the
respective agencies and other interested parties.