photoelectrochemical and biological production of …photoelectrochemical and biological production...
TRANSCRIPT
�������� �� �������� ��� ��������� �������������� �� � ��� ����
����������________________________________________________________________________________
��������������������� � ���������� ����������
�� �������� � ������� �� �������� ��
������ ���������� �
�� ������������ ����� �������� ������
�������

Photoelectrochemical and BiologicalProduction of Hydrogen and Storageof Hydrogen by Carbon Nanotubes
Satyen K. DebDirector, Basic Sciences Center
National Renewable Energy LaboratoryGolden, CO 80401
Presented at the Workshop on Physics for Energy SourcesInternational Center for Theoretical Physics (ICTP)
Trieste, ItalyOctober 17–29, 2005
034016344
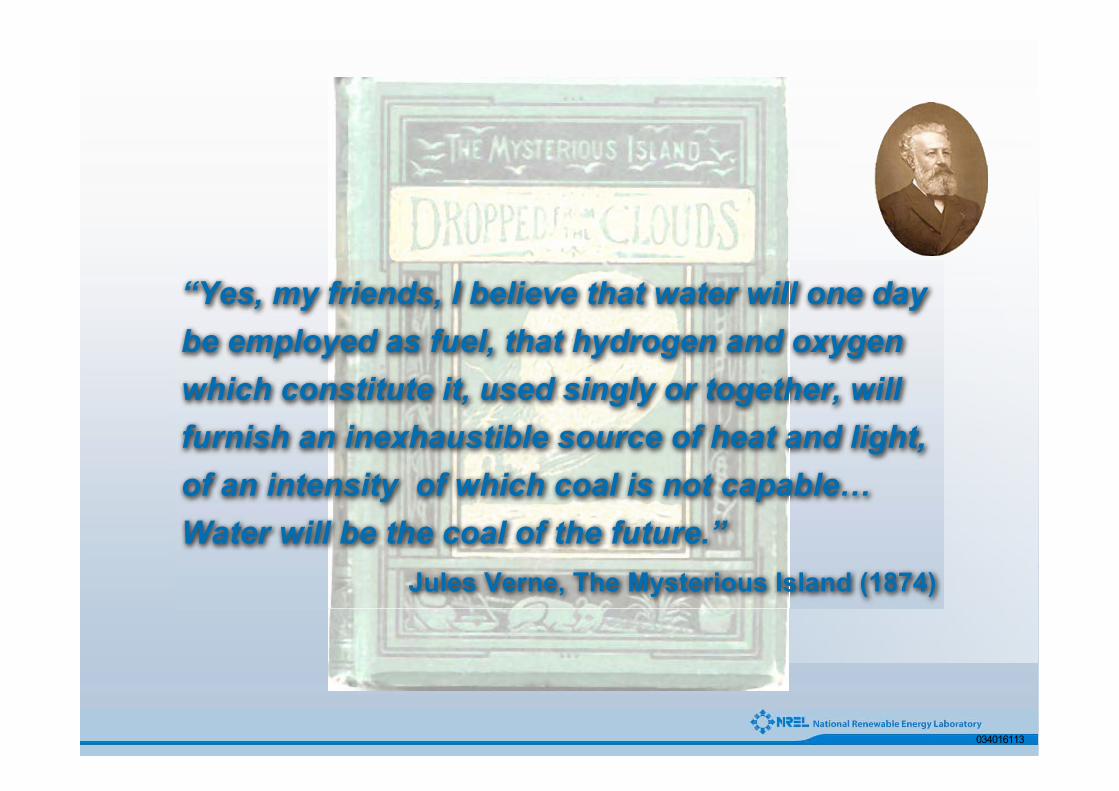
“Yes, my friends, I believe that water will one day
be employed as fuel, that hydrogen and oxygen
which constitute it, used singly or together, will
furnish an inexhaustible source of heat and light,
of an intensity of which coal is not capable…
Water will be the coal of the future.”
Jules Verne, The Mysterious Island (1874)
034016113
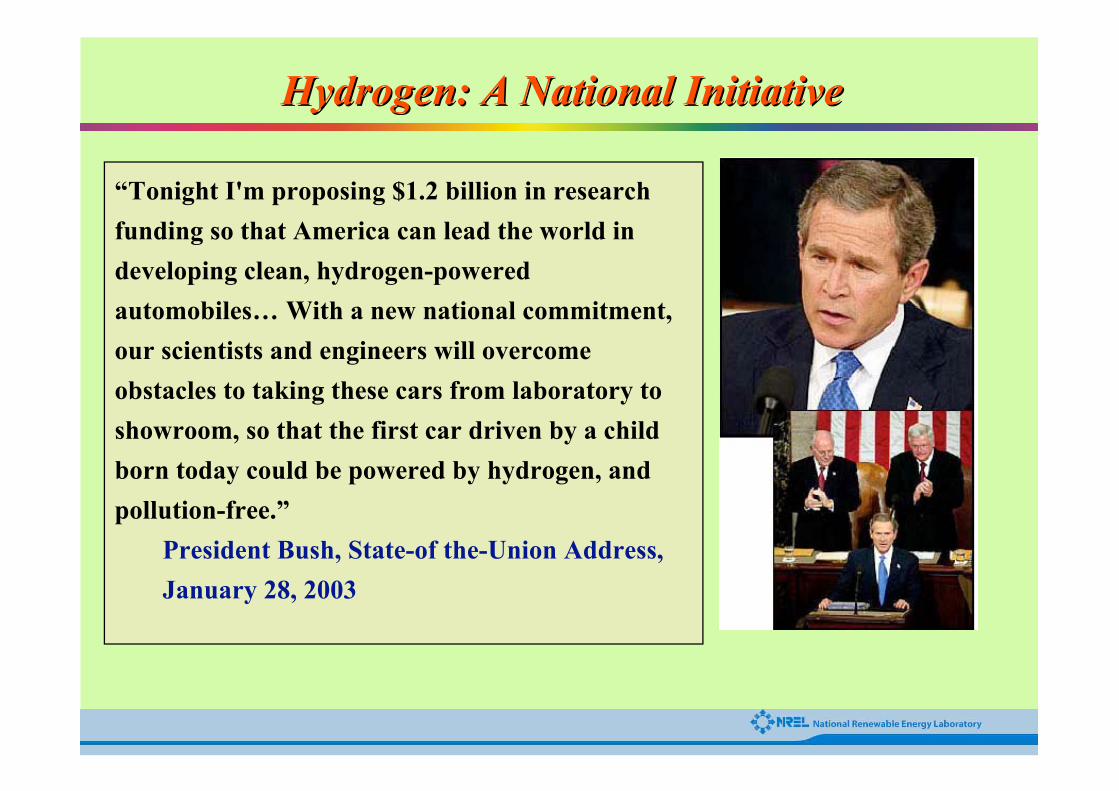
“Tonight I'm proposing $1.2 billion in research
funding so that America can lead the world in
developing clean, hydrogen-powered
automobiles… With a new national commitment,
our scientists and engineers will overcome
obstacles to taking these cars from laboratory to
showroom, so that the first car driven by a child
born today could be powered by hydrogen, and
pollution-free.”
President Bush, State-of the-Union Address,
January 28, 2003
Hydrogen: A National InitiativeHydrogen: A National Initiative
Energy Source
% of U.S.
Electricity
Supply
% of Total
U.S. Energy
Supply
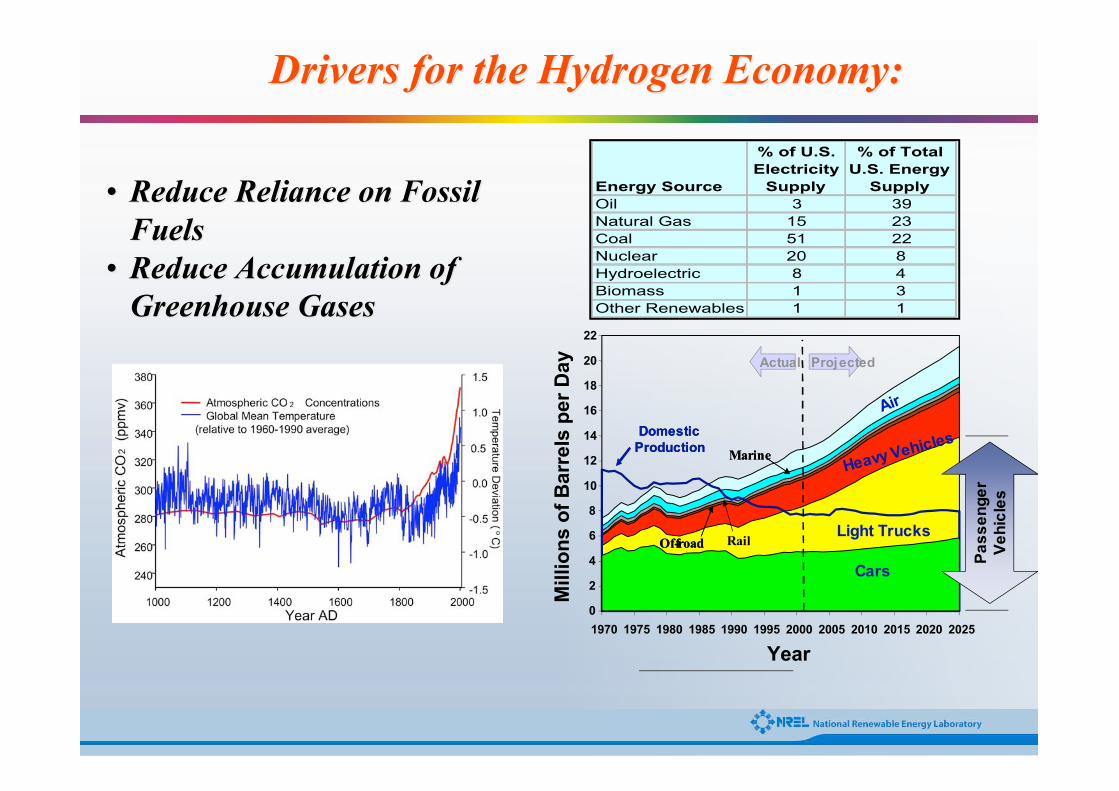
Oil 3 39
Natural Gas 15 23
Coal 51 22
Nuclear 20 8
Hydroelectric 8 4
Biomass 1 3
Other Renewables 1 1
Drivers for the Hydrogen Economy:Drivers for the Hydrogen Economy:
0
2
4
6
8
10
12
14
16
18
20
22
1970 1975 1980 1985 1990 1995 2000 2005 2010 2015 2020 2025
Millio
ns
of
Barr
els
per
Day
DomesticProductionDomestic
Production
Actual Projected
Light Trucks
Heavy Vehicles
Year
Air
MarineMarine
RailOff-roadOff-road
Cars
Pa
ss
en
ge
rV
eh
icle
s
•• Reduce Reliance on Fossil Reduce Reliance on Fossil
FuelsFuels
•• Reduce Accumulation of Reduce Accumulation of
Greenhouse GasesGreenhouse Gases

The Hydrogen EconomyThe Hydrogen Economy
solarwindhydro
fossil fuelreforming
nuclear/solarthermochemical
cycles H2
gas orhydridestorage H2
automotivefuel cells
stationaryelectricity/heat
generation
consumerelectronics
H2O
production storageuse
in fuel cells
Bio- andbioinspired
9M tons/yr
40M tons/yr(Transportation only)
9.72 MJ/L(2015 FreedomCAR Target)
4.4 MJ/L (Gas, 10,000 psi)8.4 MJ/L (LH2) $3000/kW
$35/kW(Internal Combustion Engine)
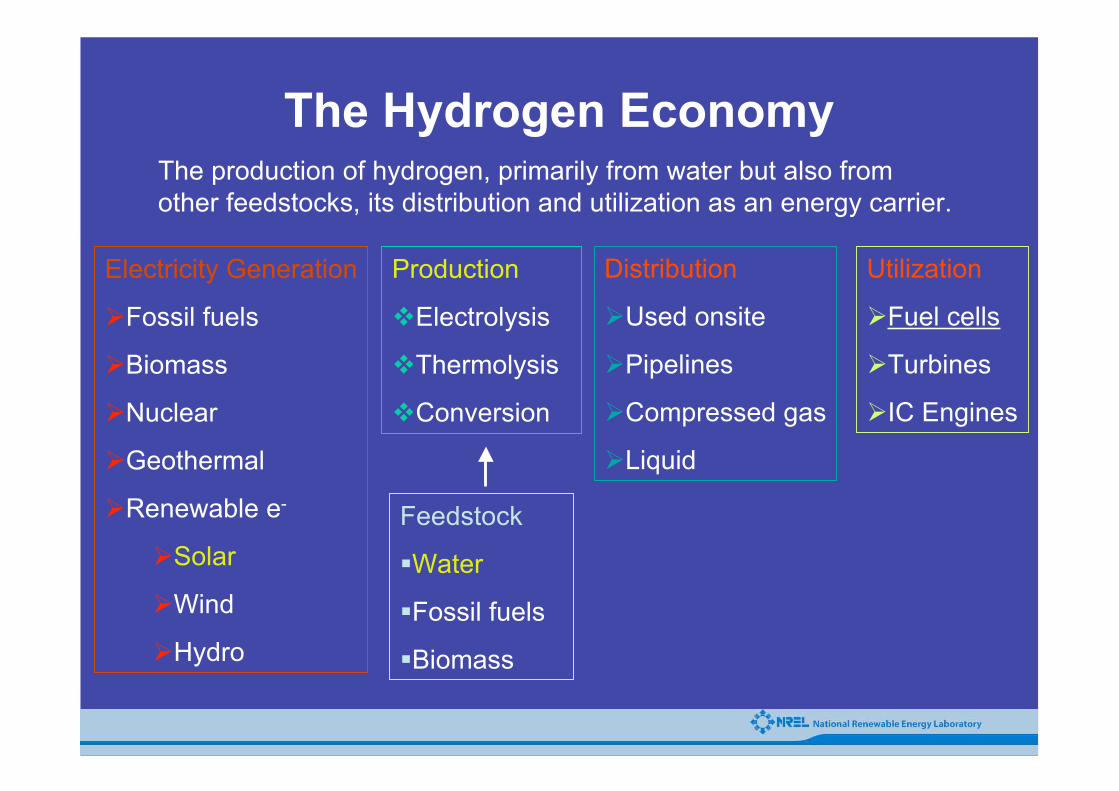
The Hydrogen EconomyThe production of hydrogen, primarily from water but also from
other feedstocks, its distribution and utilization as an energy carrier.
Feedstock
�Water
�Fossil fuels
�Biomass
Distribution
�Used onsite
�Pipelines
�Compressed gas
�Liquid
Utilization
�Fuel cells
�Turbines
�IC Engines
Electricity Generation
�Fossil fuels
�Biomass
�Nuclear
�Geothermal
�Renewable e-
�Solar
�Wind
�Hydro
Production
�Electrolysis
�Thermolysis
�Conversion

Solar Energy
Heat
Hydrogen
Thermolysis
Mechanical Energy
Electricity
Electrolysis
Biomass
Conversion
Photolysis
Sustainable Paths to Hydrogen

Hydrogen:A Future Energy Carrier
• High energy content on a weight basis
• If from a renewable source:
• Displaces need for fossil fuels
• Non-poluting
• Carbon neutral
• Addresses global change issues
• Enhances energy security
energy
H2O H2 + � O2 �H0 = 68.3 kcal/mol
catalyst

• Semiconductor photoelectrolysis
• Photobiological Systems
• Homogeneous water splitting
• Heterogeneous water splitting
• Thermal cycles
(Sunlight and Water to Hydrogen(Sunlight and Water to Hydrogen
with No External Electron Flow)with No External Electron Flow)
Direct Conversion SystemsCombination of a Light Harvesting System and a
Water Splitting System

LightFuel
Electricity
Photosynthesis
Fuels Electricity
Photovoltaics
H O
O H
2
22
sc M
e
sc
e
M
CO
Sugar
H O
O
2
2
2
Energy Conversion Strategies
Semiconductor/LiquidJunctions

Photo-Electrochemical Production of
Hydrogen from Water
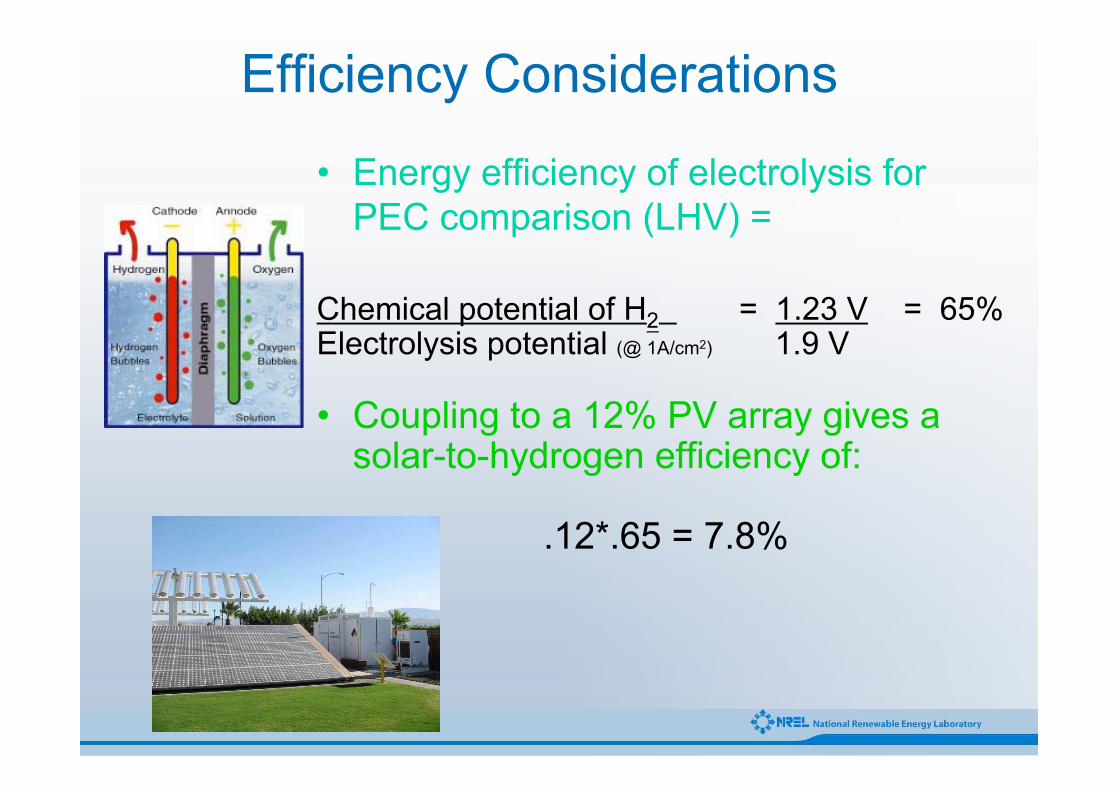
Efficiency Considerations
• Energy efficiency of electrolysis for
PEC comparison (LHV) =
Chemical potential of H2 = 1.23 V = 65%Electrolysis potential (@ 1A/cm2) 1.9 V
• Coupling to a 12% PV array gives asolar-to-hydrogen efficiency of:
.12*.65 = 7.8%

Hydrogen from Visible Light and Water�Visible light has enough energy to split water
(H2O) into hydrogen (H2) and oxygen (O2).�Fortunately water is transparent and does notabsorb this energy.
�The combination of a light harvesting systemand a water splitting system is necessary tobe able to use sunlight to split water.
�Photoelectrochemical processes alongwith certain algae can use this light toproduce hydrogen from water.
2H2H22OO �� 2H2H22 + O+ O22Visible
Light

Photoelectrochemical Conversion Material
Requirements
H 2 O/H 2
H 2 O/O 2
1.23 eV
(1.6-1.7 eV)p-typeSemiconductor
E g >1.7 eV
CounterElectrode
All three conditions mustbe satisfied
SIMULTANEOUSLY
Bandgap
Band edge overlap
Fast charge transfer
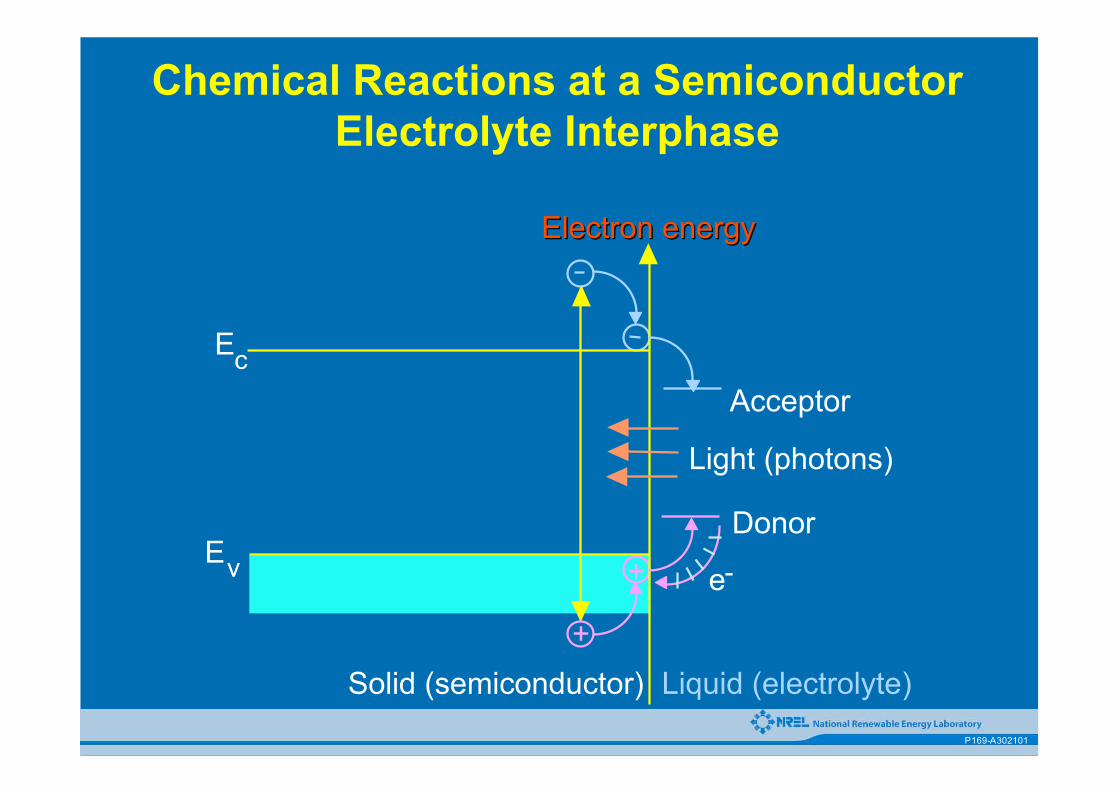
Chemical Reactions at a SemiconductorElectrolyte Interphase
Electron energyElectron energy
+
+
Acceptor
Donor
Liquid (electrolyte)Solid (semiconductor)
Ec
Ev e-
Light (photons)
P169-A302101

Band Edges of p- and n-TypeSemiconductors Immersed in AqueousElectrolytes to Form Liquid Junctions
Econduction
Evalence
O2
H2
Econduction
Evalence
2H2O + 2e– = 2OH–+ H
H2O + 2h+ = 2H+ + 1/2 O
2
P158-A199107
n-type
p-type
2
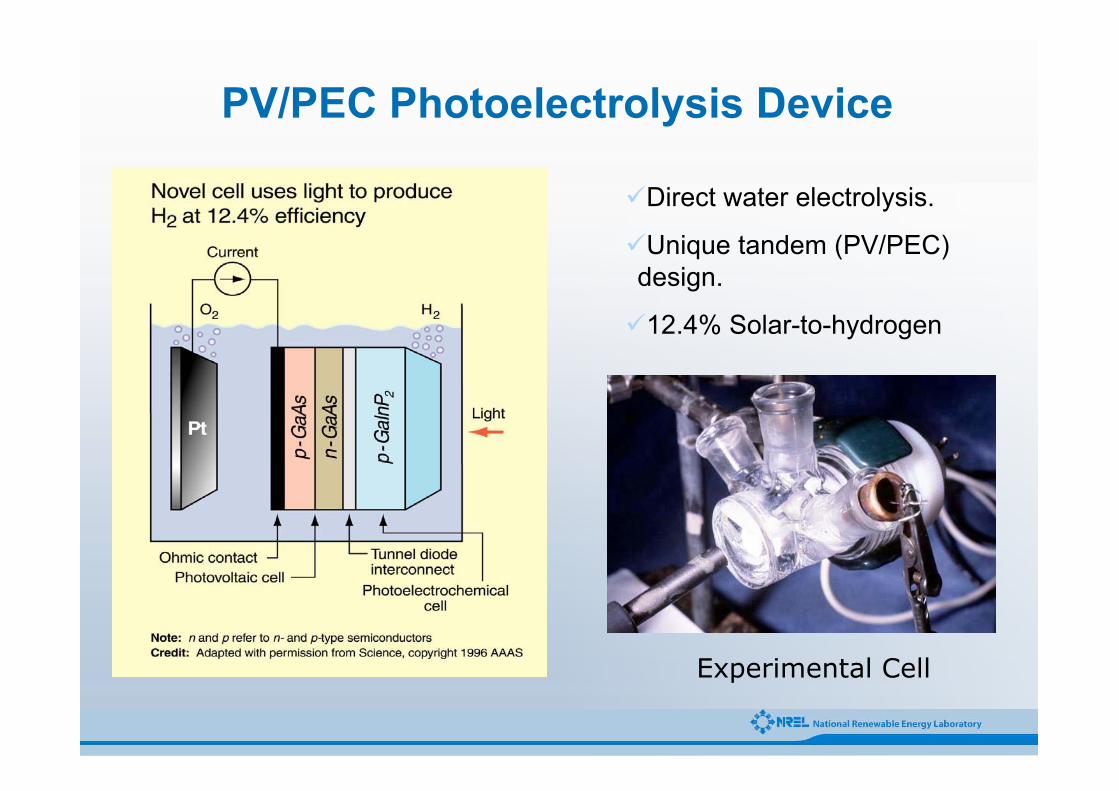
PV/PEC Photoelectrolysis Device
Experimental Cell
�Direct water electrolysis.
�Unique tandem (PV/PEC)
design.
�12.4% Solar-to-hydrogen

03514212
World Record Efficiency Solar Cell
Several World RecordEfficiencies:
• 29.5% 1 sun flat plate cell
• 30.2% 140-180 sun
concentrator cell
• 25.7% 1 sun space cell
Gallium Indium Phosphide/Gallium
Arsenide Photovoltaic Solar Cell
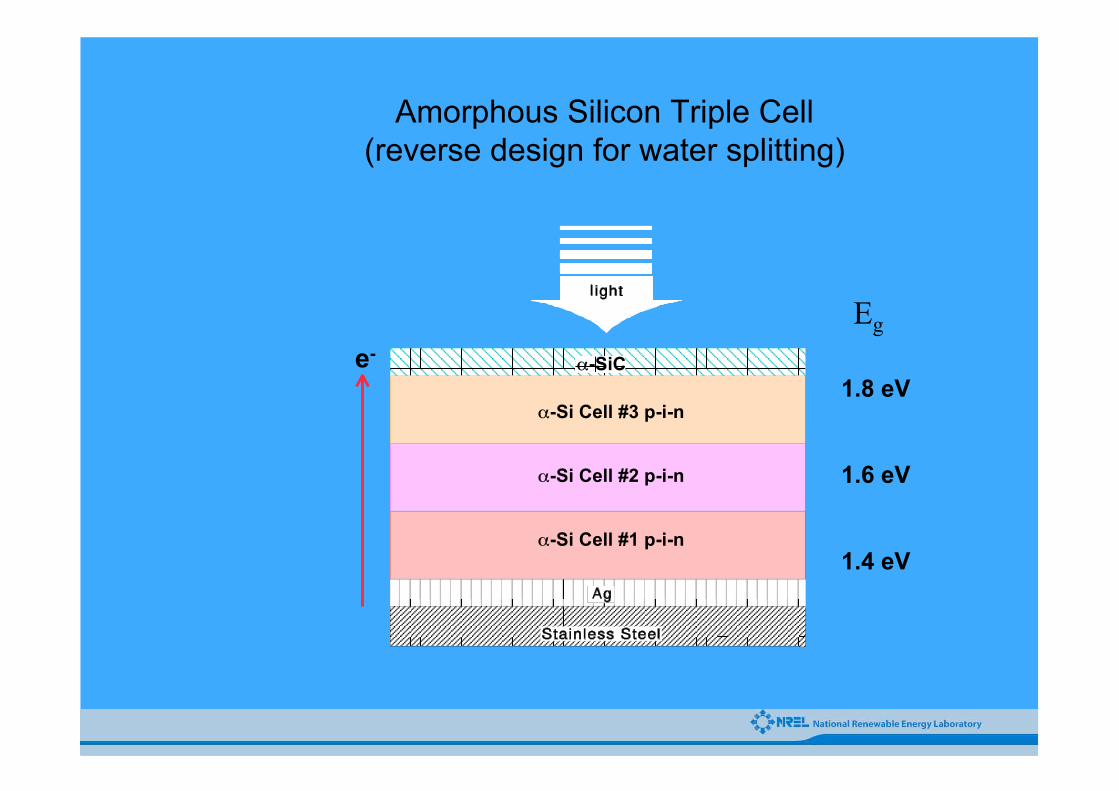
Amorphous Silicon Triple Cell
(reverse design for water splitting)
�-Si Cell #3 p-i-n
�-Si Cell #2 p-i-n
�-Si Cell #1 p-i-n
e-�-SiC
1.8 eV
1.6 eV
1.4 eV
Eg

High Efficiency Semiconductor Materials• III-V materials have the highest PV efficiency of any
semiconductor material.– Largest range of available bandgaps
– ….but• Unstable in aqueous solution (exception nitrides)
• Band-edge mismatch (exception nitrides).
• I-III-VI materials offer low-cost manufacturing.– Synthesis procedures for desired bandgap unknown.
– ….but• Unstable in aqueous solution?
• Band-edge mismatch?
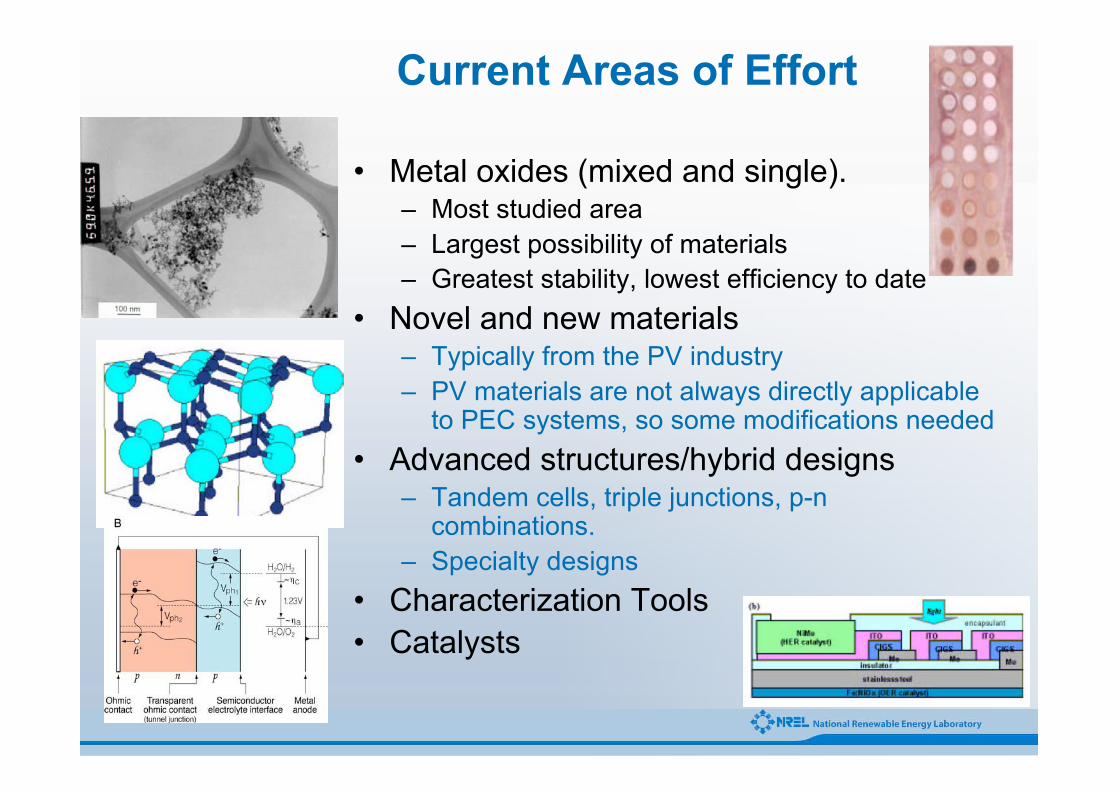
Current Areas of Effort
• Metal oxides (mixed and single).– Most studied area
– Largest possibility of materials
– Greatest stability, lowest efficiency to date
• Novel and new materials– Typically from the PV industry
– PV materials are not always directly applicableto PEC systems, so some modifications needed
• Advanced structures/hybrid designs– Tandem cells, triple junctions, p-n
combinations.
– Specialty designs
• Characterization Tools
• Catalysts
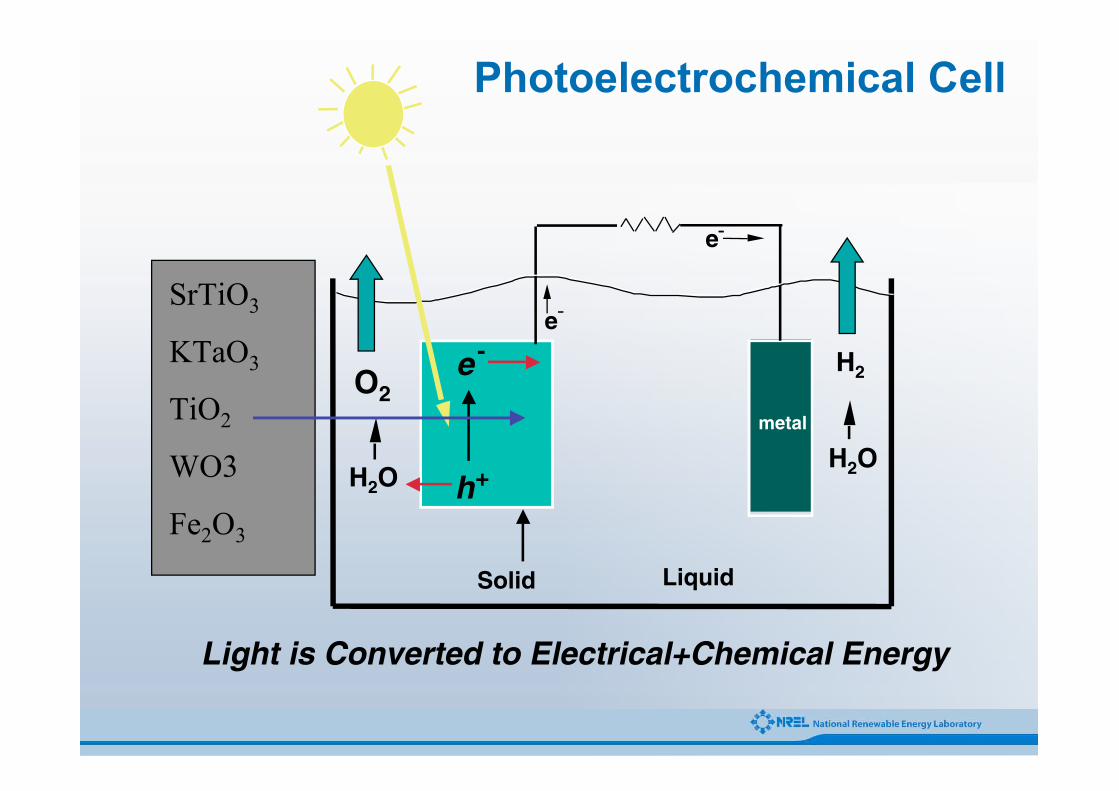
Photoelectrochemical Cell
metal
e--
e--
O2
H2O
H2
H2O
e -
h+
Light is Converted to Electrical+Chemical Energy
LiquidSolid
SrTiO3
KTaO3
TiO2
WO3
Fe2O3

�Material Durability –semiconductor must bestable in aqueous solution
�Efficiency – the band gap(Eg) must be at least 1.6-1.7eV, but not over 2.2 eV
�Energetics – the bandedges must straddle H2Oredox potentials (GrandChallenge)
11..2233 eeVV
11..66--11..77 eeVV
p-typeSemiconductor
EEgg
CounterElectrode
H2O/H2
H2O/O2
All must be satisfied
simultaneously
Electron
Energy
Technical Challenges (the big three)Material Characteristics for
Photoelectrochemical Hydrogen Production
i
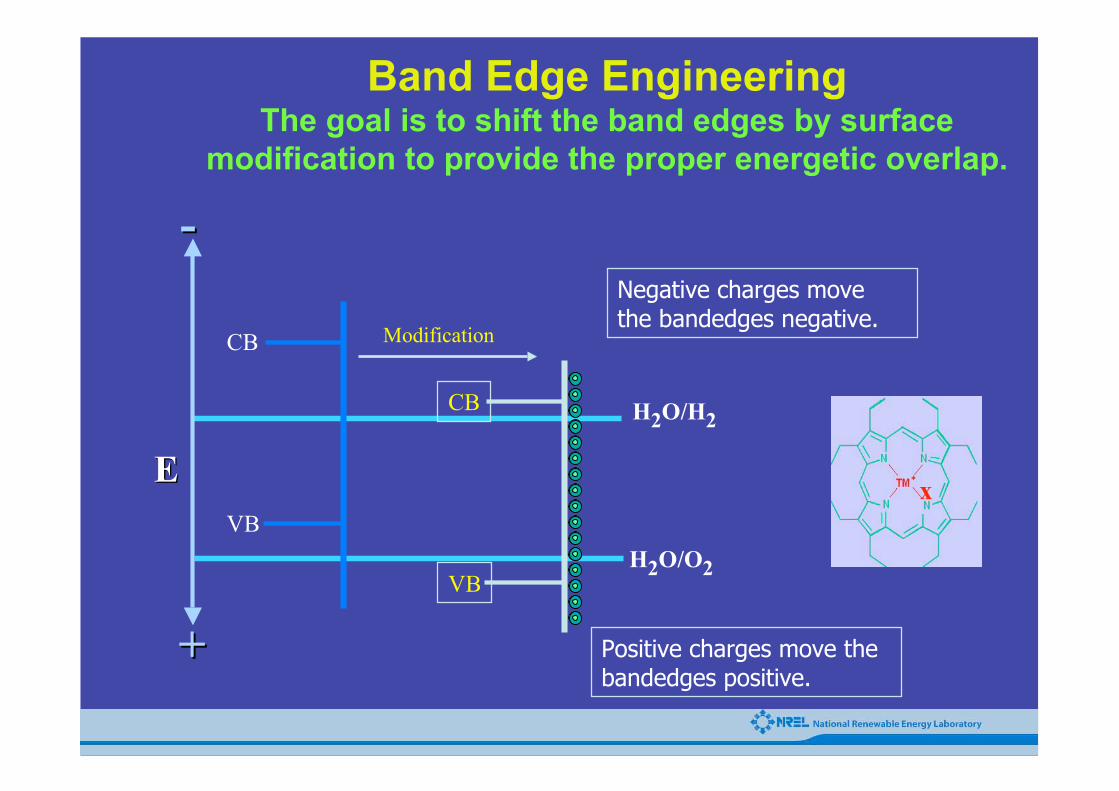
Band Edge EngineeringThe goal is to shift the band edges by surface
modification to provide the proper energetic overlap.
EE
++
--
H2O/H2
H2O/O2
CB
VB
CB
VB
Negative charges movethe bandedges negative.
Positive charges move thebandedges positive.
Modification
x

Ultra-high Efficiency Water Splitting Photoconversion
Cell Based on Single Exciton Fission
Biological Systems for HydrogenPhotoproduction

Plants, cyanobacteria, and algae dominate the biosphere.Plants, cyanobacteria, and algae dominate the biosphere.
They live on sun and water.They live on sun and water.
Chlorophyll on Earth!Chlorophyll on Earth!
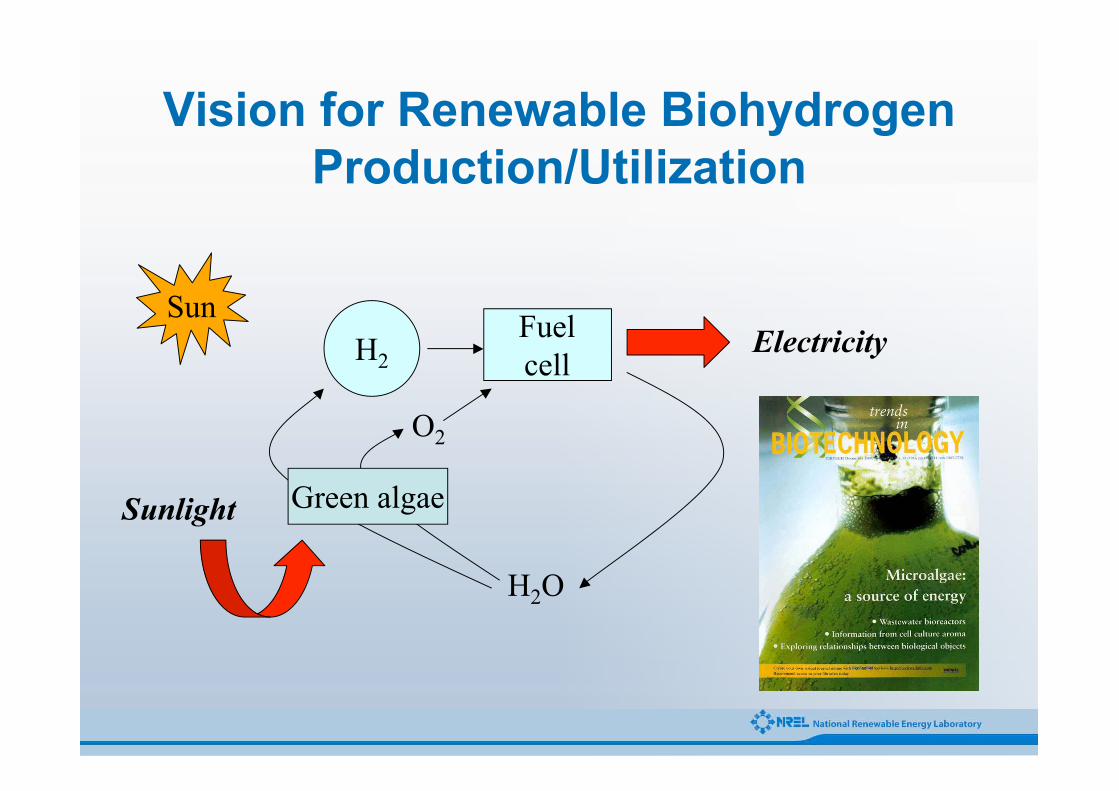
H2
Fuel
cellElectricity
H2O
O2
Sunlight Green algae
Vision for Renewable BiohydrogenProduction/Utilization
Sun
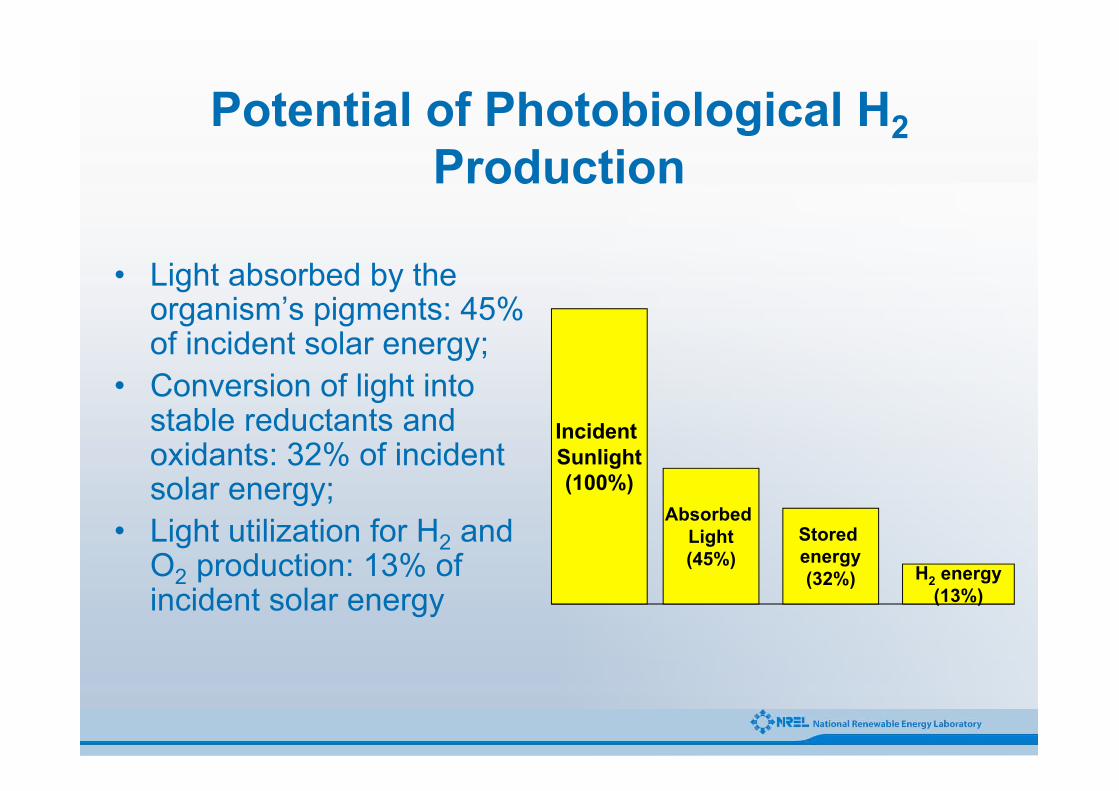
Potential of Photobiological H2
Production
• Light absorbed by theorganism’s pigments: 45%of incident solar energy;
• Conversion of light intostable reductants andoxidants: 32% of incidentsolar energy;
• Light utilization for H2 andO2 production: 13% ofincident solar energy
IncidentSunlight(100%)
AbsorbedLight(45%)
Storedenergy(32%) H2 energy
(13%)
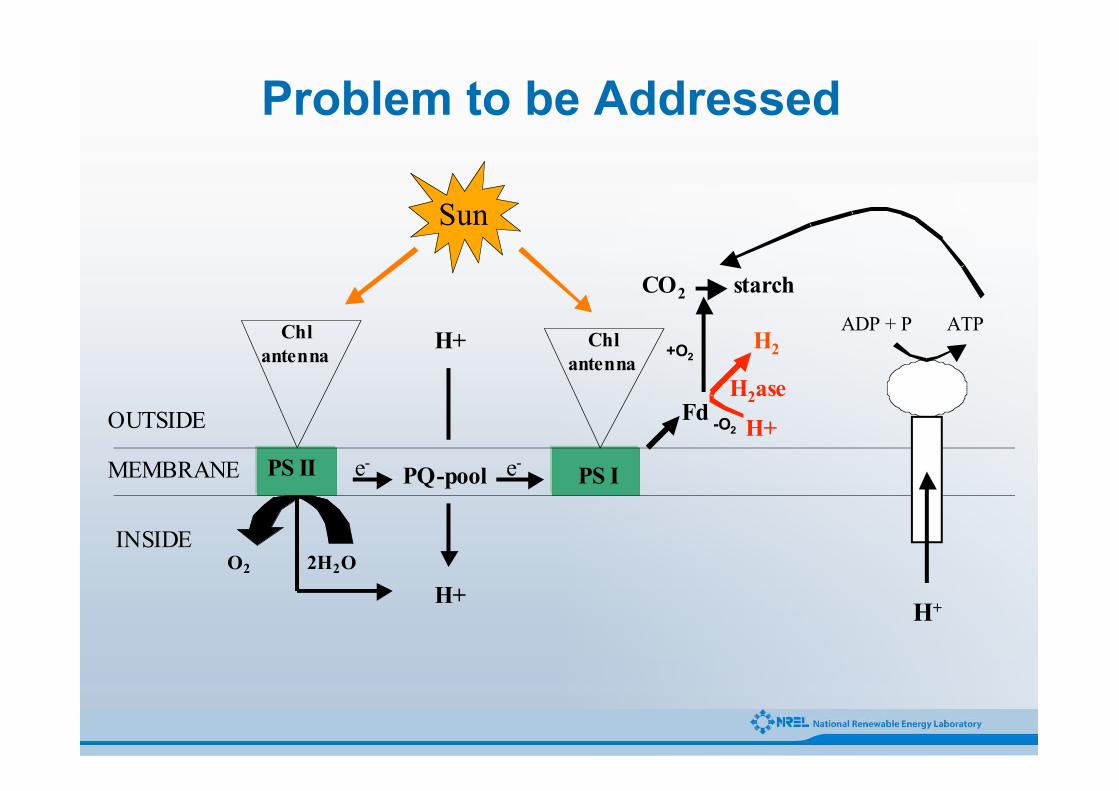
Problem to be Addressed
O2 2H2O
PS II PQ-pool PS I
FdH2ase
H2
e-e-
Chl
antennaChl
antenna
CO2 starch
Sun
H+H+
H+ADP + P ATP
H+
INSIDE
OUTSIDE
MEMBRANE
+O2
-O2

Model of [FeFe]-Hydrogenase H-cluster
Peters JW, Lanzilotta WN, Lemon BJ, Seefeldt, LCScience 1998, 282, 1853-1858.Nicolet Y, Piras C, Legrand P, Hatchikian EC, Fontecilla-Camps JCStructure and Folding Des. 1999, 7, 13-23.Nicolet Y, deLacey AL, Vernede X, Fernandez VM, Hatchikian EC, Fontecilla-Camps JCJ. Amer. Chem. Soc. 2001, 123, 1596-1601.
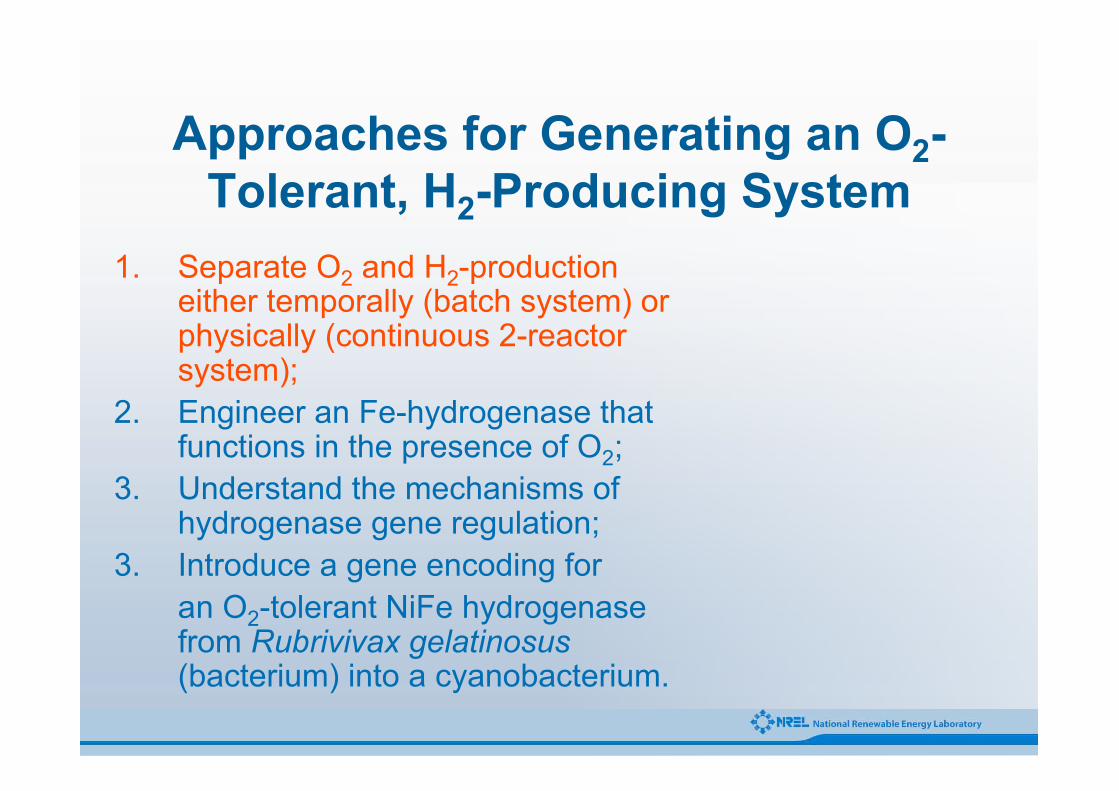
Approaches for Generating an O2-Tolerant, H2-Producing System
1. Separate O2 and H2-productioneither temporally (batch system) orphysically (continuous 2-reactorsystem);
2. Engineer an Fe-hydrogenase thatfunctions in the presence of O2;
3. Understand the mechanisms ofhydrogenase gene regulation;
3. Introduce a gene encoding for
an O2-tolerant NiFe hydrogenasefrom Rubrivivax gelatinosus(bacterium) into a cyanobacterium.
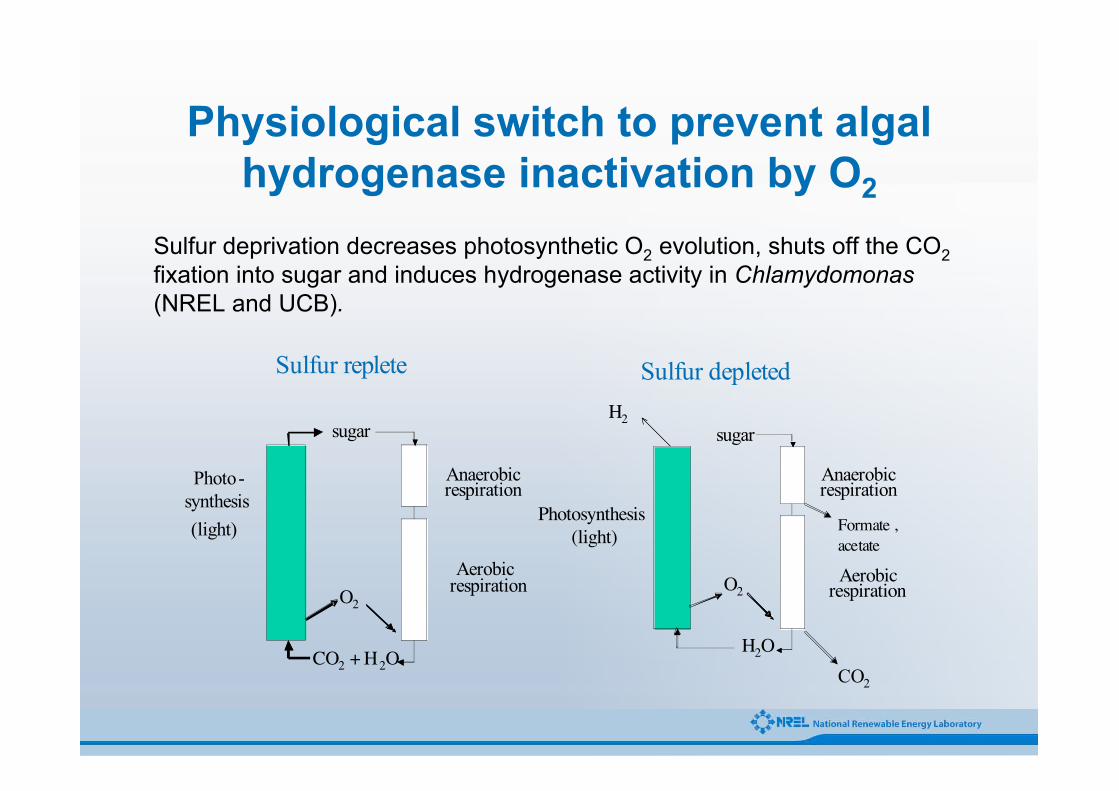
Physiological switch to prevent algalhydrogenase inactivation by O2
Photo-
synthesis
(light)
Anaerobicrespiration
Aerobicrespiration
sugar
O2
Sulfur replete
Anaerobicrespiration
respiration
sugar
CO2
Sulfur depleted
Formate ,acetate
CO2 + H2O
Photosynthesis(light)
H2
AerobicO2
H2O
Sulfur deprivation decreases photosynthetic O2 evolution, shuts off the CO2
fixation into sugar and induces hydrogenase activity in Chlamydomonas
(NREL and UCB).

Physiological switch to prevent algalhydrogenase inactivation by O2
140120100806040200
400
300
200
100
0
Time, h
H2gas
120100806040200
200
100
0
Time, h
linearfitR
Results
Photosynthesis
Respiration
Batch system: Sulfur-deprived cultures gradually inactivate
photosynthesis and become anaerobic (1-2 days). They then
photoproduce H2 for a total of 3-4 days. Cycles of +S and –S can be
repeated for at least 3 times (Sergey Kosourov).
Vav = 30-60 ml L-1 d-1;
estimated cost for cyclic: $720/kg
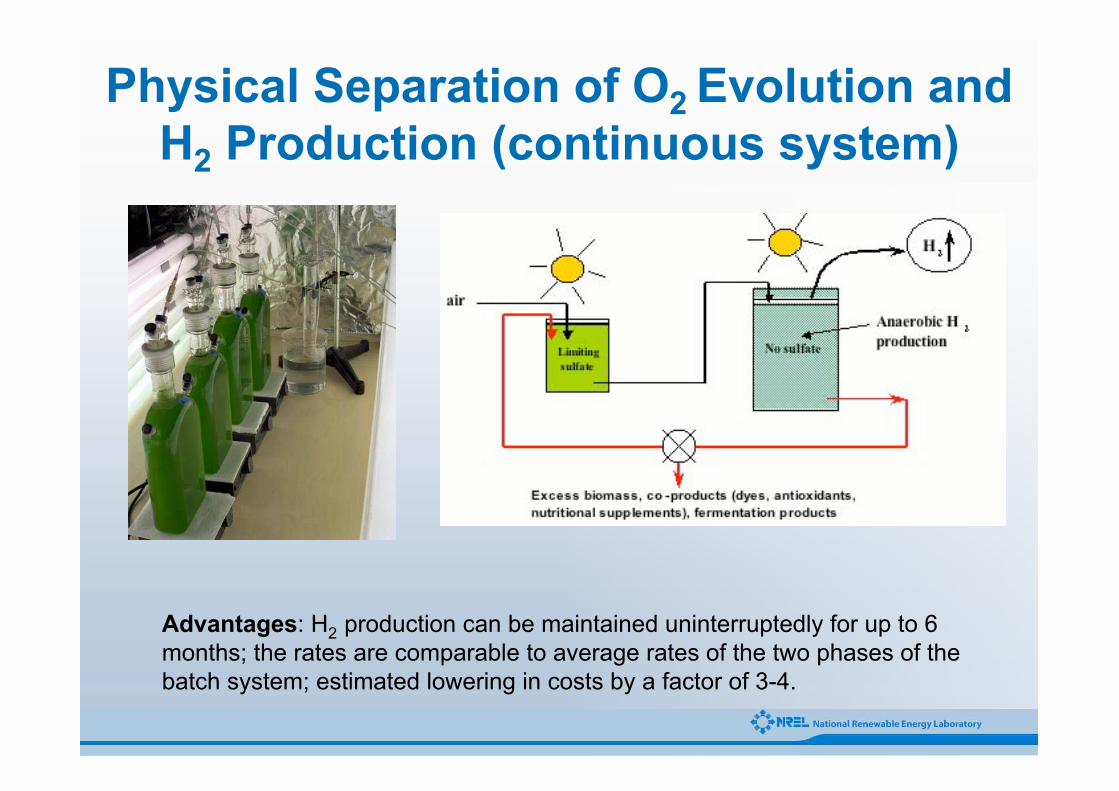
Physical Separation of O2 Evolution andH2 Production (continuous system)
Advantages: H2 production can be maintained uninterruptedly for up to 6
months; the rates are comparable to average rates of the two phases of the
batch system; estimated lowering in costs by a factor of 3-4.
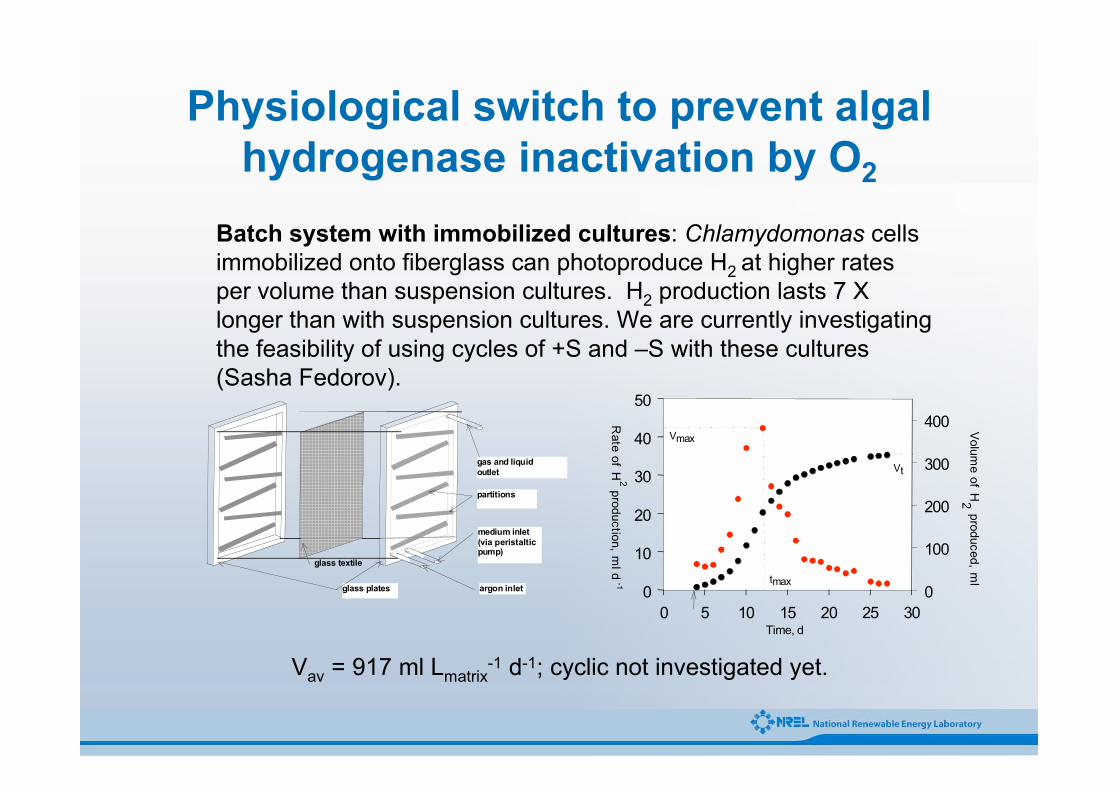
Physiological switch to prevent algalhydrogenase inactivation by O2
partitions
gas and liquidoutlet
medium inlet(via peristalticpump)
argon inlet
glass textile
glass plates
Batch system with immobilized cultures: Chlamydomonas cells
immobilized onto fiberglass can photoproduce H2 at higher rates
per volume than suspension cultures. H2 production lasts 7 X
longer than with suspension cultures. We are currently investigating
the feasibility of using cycles of +S and –S with these cultures
(Sasha Fedorov).
Vav = 917 ml Lmatrix-1 d-1; cyclic not investigated yet.
0 5 10 15 20 25 30
0
10
20
30
40
50
Volu
me
of
H2
pro
duced,
ml
0
100
200
300
400
Time, d
Vmax
tmax
Vt
Rate
of
H2
pro
ductio
n,
mld
-1
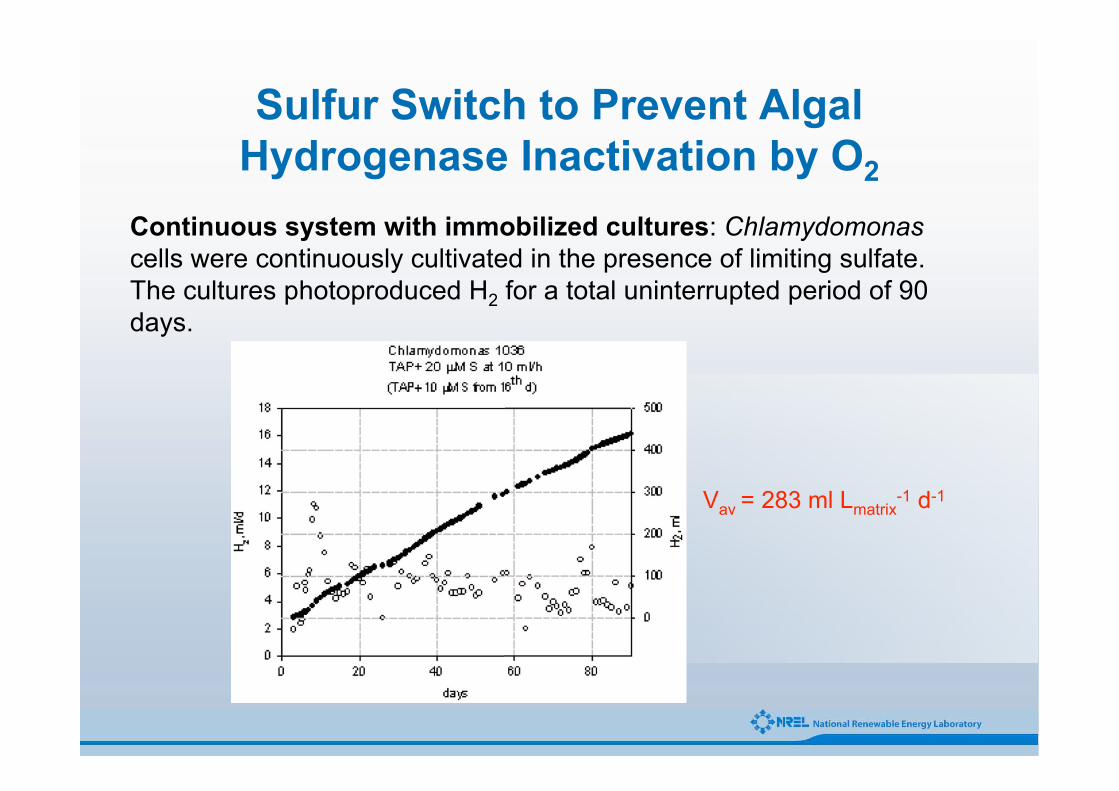
Sulfur Switch to Prevent AlgalHydrogenase Inactivation by O2
Continuous system with immobilized cultures: Chlamydomonas
cells were continuously cultivated in the presence of limiting sulfate.
The cultures photoproduced H2 for a total uninterrupted period of 90
days.
Vav = 283 ml Lmatrix-1 d-1

Approaches for Generating an O2-Tolerant, H2-Producing System
1. Separate O2 and H2-productioneither temporally (batch system) orphysically (continuous 2-reactorsystem);
2. Engineer an Fe-hydrogenase thatfunctions in the presence of O2;
3. Understand the mechanisms ofhydrogenase gene regulation;
4. Introduce a gene encoding for
an O2-tolerant NiFe hydrogenasefrom Rubrivivax gelatinosus(bacterium) into a
cyanobacterium.
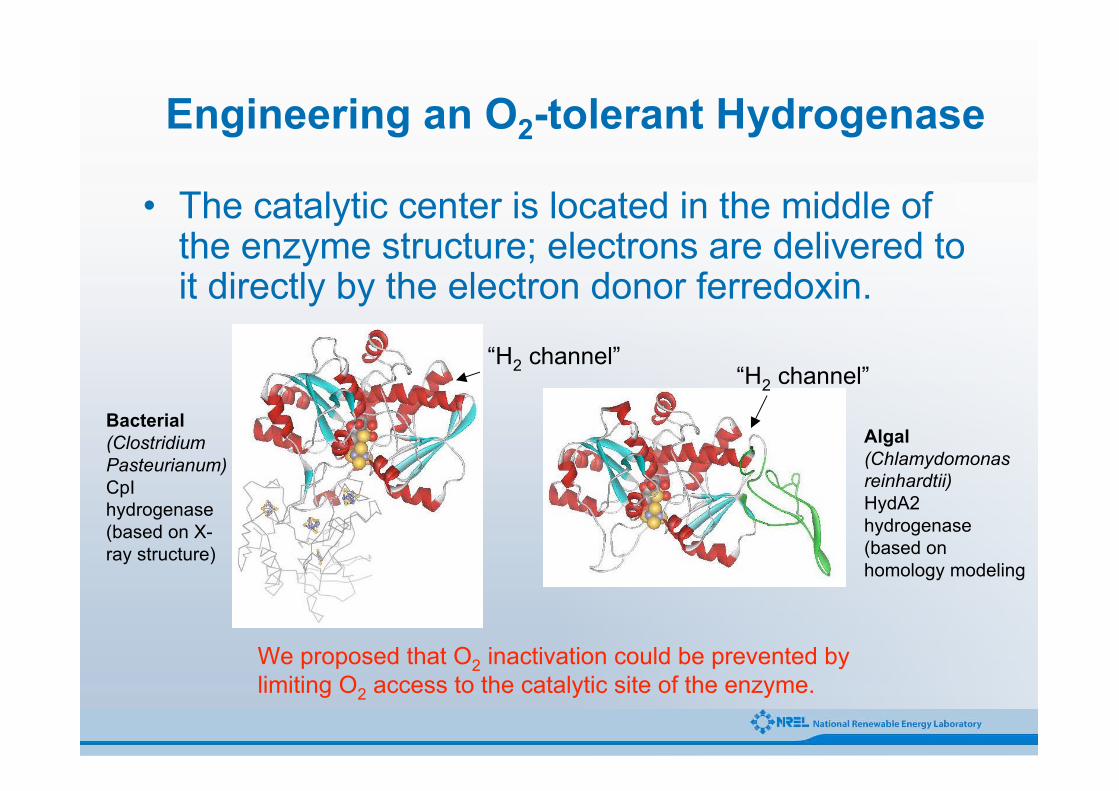
Engineering an O2-tolerant Hydrogenase
• The catalytic center is located in the middle ofthe enzyme structure; electrons are delivered toit directly by the electron donor ferredoxin.
“H2 channel”“H2 channel”
Bacterial(Clostridium
Pasteurianum)
CpI
hydrogenase
(based on X-
ray structure)
Algal(Chlamydomonas
reinhardtii)
HydA2
hydrogenase
(based on
homology modeling
We proposed that O2 inactivation could be prevented by
limiting O2 access to the catalytic site of the enzyme.

Combined Trajectories for H2 andO2 Diffusion Simulations
• H2 diffuses from active site at a greater rate than O2, and through
many more “pathways”
• O2 diffused through a limited number (1, possibly more) of pathways
• Rate difference and non-biased pathways are due to the difference in
size between H2 and O2 (masses are set equal)
H2O2

Engineering an O2-tolerant Hydrogenase
Pathway APathway B
Introduction of large amino acid residues in the cavity next to the
catalytic site (red) resulted in non-assembly of an active enzyme.
Mutations done along pathway A (green) resulted in insignificant
(< 20%) increase in O2 tolerance. Future work will address double
mutations affecting both pathways simultaneously.

Approaches for Generating an O2-Tolerant, H2-Producing System
1. Separate O2 and H2-productioneither temporally (batch system) orphysically (continuous 2-reactorsystem);
2. Engineer an Fe-hydrogenase thatfunctions in the presence of O2;
3. Understand the mechanisms ofhydrogenase gene regulation;
3. Introduce a gene encoding for
an O2-tolerant NiFe hydrogenasefrom Rubrivivax gelatinosus(bacterium) into a cyanobacterium.

Chemochromic Screen for H2-photoproduction
Colonies on TAP plates Chemochromic sensor
Sensor is based on the reduction of WO3 by H2
Identification of Factors Involvedin Hydrogenase Gene Expression
H2 Production Rates
0
5
10
15
20
25
30
35
40
45
A1 A1 + EF A1 + G A1 + EF + G
Hyd transformants
µµm
ole
H2
mg
pro
tein
-1h
-1
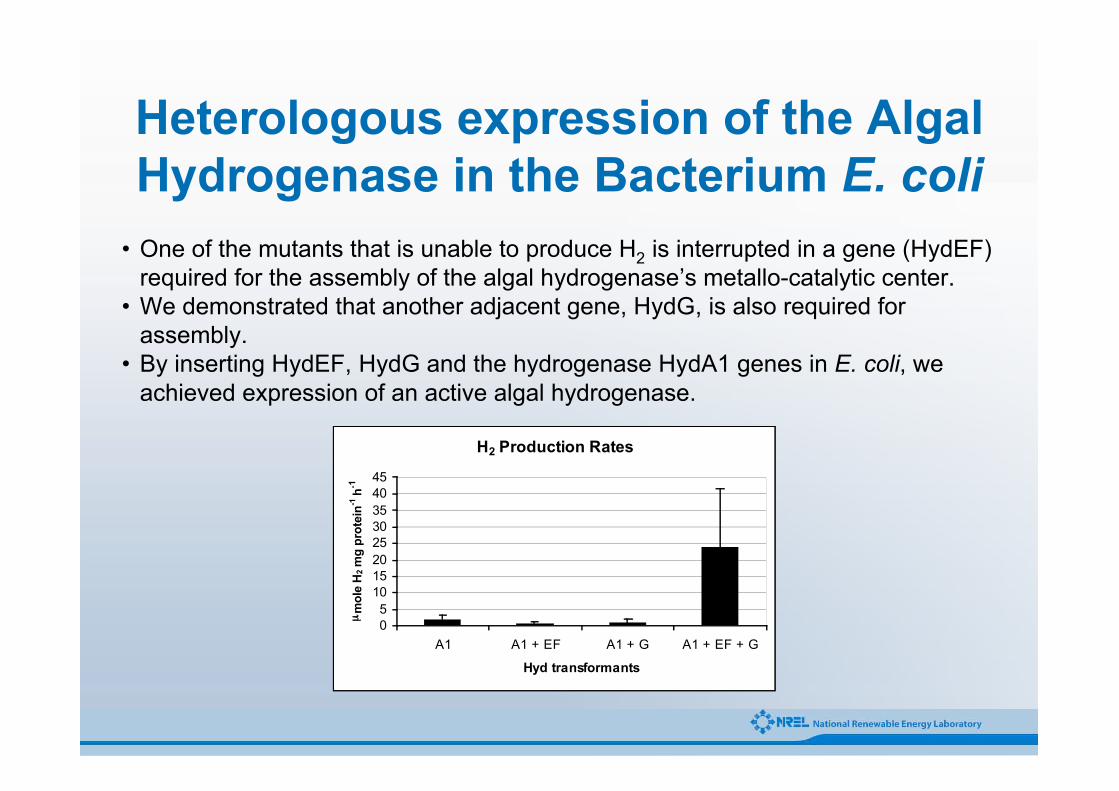
Heterologous expression of the AlgalHydrogenase in the Bacterium E. coli
• One of the mutants that is unable to produce H2 is interrupted in a gene (HydEF)
required for the assembly of the algal hydrogenase’s metallo-catalytic center.
• We demonstrated that another adjacent gene, HydG, is also required for
assembly.
• By inserting HydEF, HydG and the hydrogenase HydA1 genes in E. coli, we
achieved expression of an active algal hydrogenase.

Approaches for Generating an O2-Tolerant, H2-Producing System
1. Separate O2 and H2-production eithertemporally (batch system) orphysically (continuous 2-reactorsystem);
2. Engineer an Fe-hydrogenase thatfunctions in the presence of O2;
3. Understand the mechanisms ofhydrogenase gene regulation;
3. Introduce a gene encoding for
an O2-tolerant NiFe hydrogenasefrom Rubrivivax gelatinosus(bacterium) into a cyanobacterium.
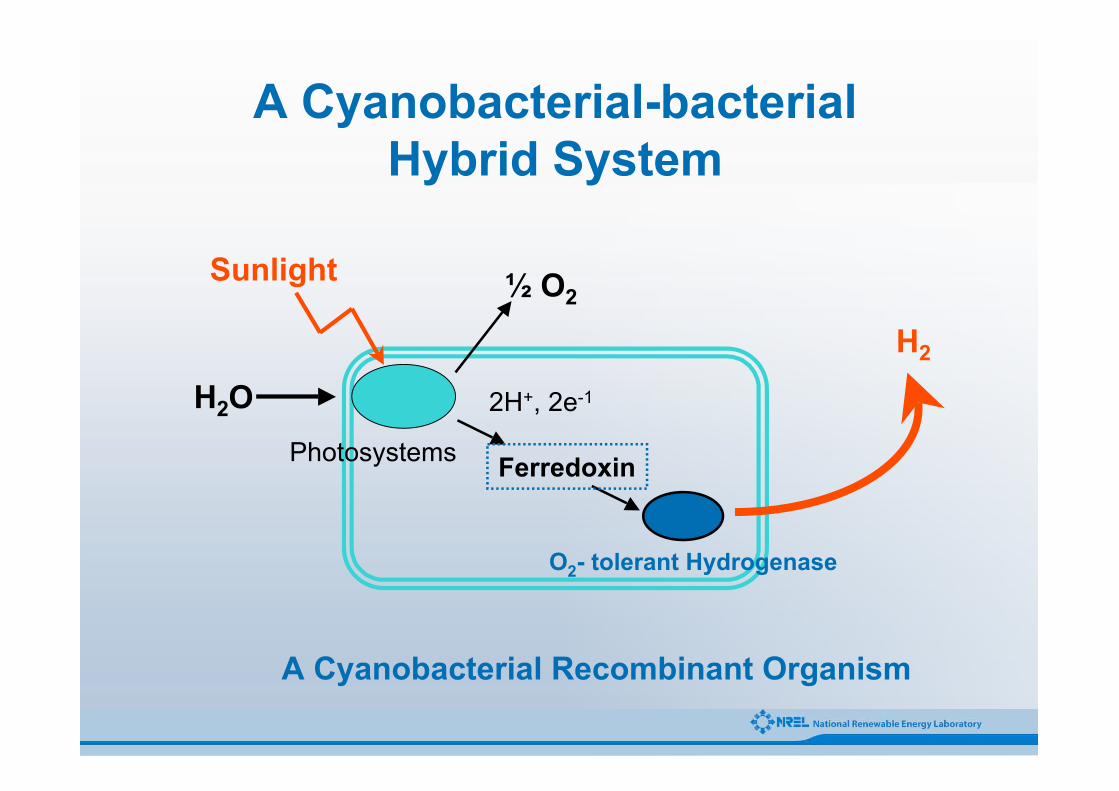
A Cyanobacterial-bacterialHybrid System
O2- tolerant Hydrogenase
A Cyanobacterial Recombinant Organism
H2O
� O2
H2
Sunlight
Photosystems
2H+, 2e-1
Ferredoxin
0
20
40
60
80
100
120
0 5 10 15 20 25Hours, stirred in full air
Hydro
genase
Activity,%
T1/2 = 21 hr
0
20
40
60
80
100
120
0 5 10 15 20 25
Hours stirred in full air
(A) Whole Cell (B) Purified Hydrogenase
T1/2 = 6 hr
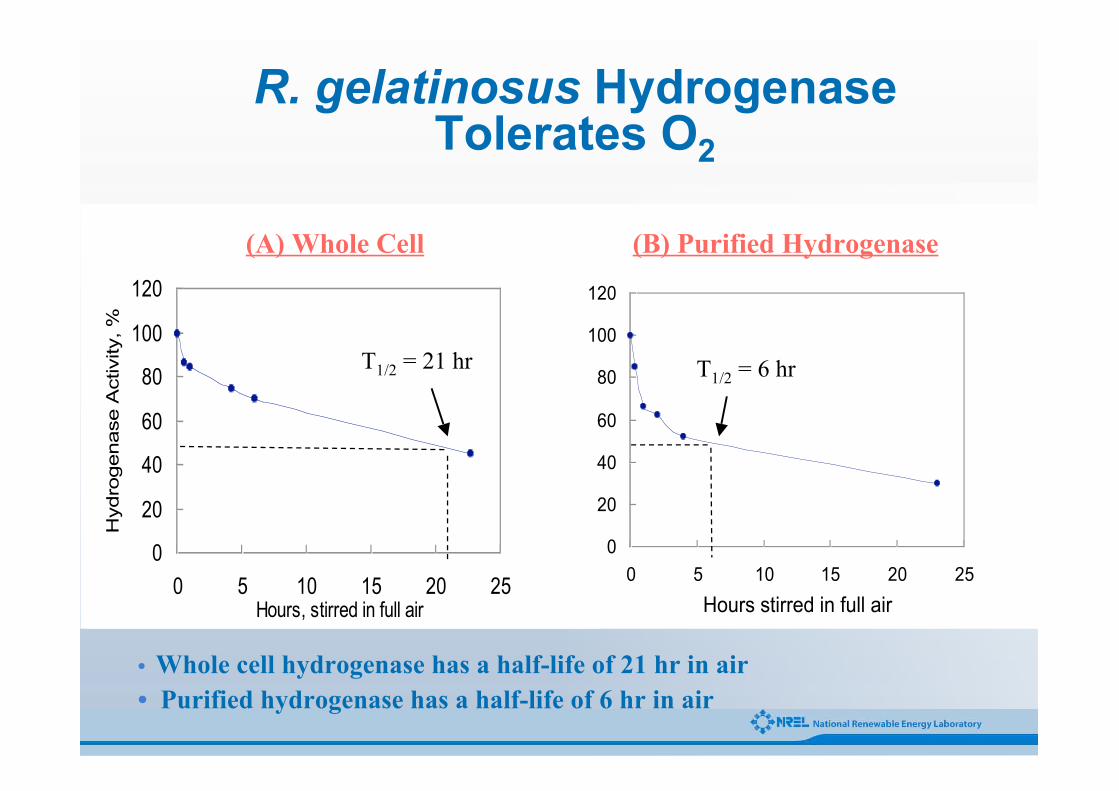
R. gelatinosus HydrogenaseTolerates O2
• Whole cell hydrogenase has a half-life of 21 hr in air
• Purified hydrogenase has a half-life of 6 hr in air

Future Directions
• Scientific feasibility of photobiological H2 productionhas been demonstrated.
• It will be a number of years before a commerciallyviable technology is developed.
• Clear research directions to develop an algal H2
technology have been identified.
• Cost factors may dictate the addition of coproductrecovery, a system to harvest more of the solarspectrum, and fermentation of excess biomass.

Fossil Fuel ReformingMolecular level understanding of catalytic mechanisms,
nanoscale catalyst design, high temperature gas
separation
Solar Photoelectrochemistry/PhotocatalysisLight harvesting, charge transport, chemical
assemblies, bandgap engineering, interfacial chemistry,
catalysis and photocatalysis, organic semiconductors,
theory and modeling, and stability
Bio- and Bio-inspired H2 ProductionMicrobes & component redox enzymes, nanostructured
2D & 3D hydrogen/oxygen catalysis, sensing, and
energy transduction, engineer robust biological and
biomimetic H2 production systems
Nuclear and Solar Thermal HydrogenThermodynamic data and modeling for
thermochemical cycle (TC), high temperature
materials: membranes, TC heat exchanger materials,
gas separation, improved catalysts
Priority Research Areas in Hydrogen ProductionPriority Research Areas in Hydrogen Production
Dye-Sensitized Solar Cells
Ni surface-alloyed with Au to reducecarbon poisoning
Synthetic
Catalysts for
Water Oxidation
and Hydrogen
Activation

034016114
Hydrogen Storage by CarbonNanotube

A computational representation ofhydrogen adsorption in an optimizedarray of (10,10) nanotubes at 298 K and200 Bar. The red spheres representhydrogen molecules and the blue spheresrepresent carbon atoms in thenanotubes, showing 3 kinds of bindingsites. (K. Johnson et al.)
Carbon Nanotubes for Hydrogen StorageCarbon Nanotubes for Hydrogen Storage
• The very small size and very high
surface area of carbon nanotubes
make them interesting for hydrogen
storage.
• Challenge is to increase the H:C
stoichiometry and to strengthen the
H—C bonding at 300 K.

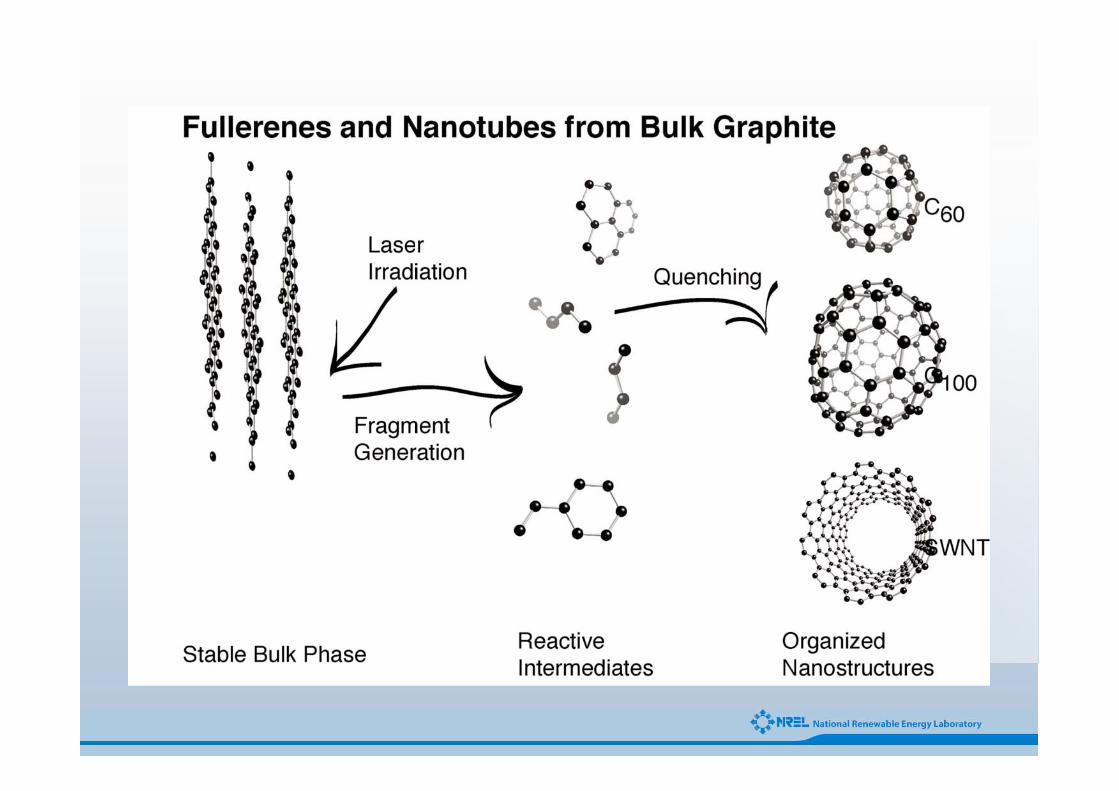

• Carbon Single-walled Nanotubes
(SWNT
– a cylindrical single layer of graphite.

Some milestones in the synthesis of single-wall nanotubes.
1985 - Kroto et al. discover C60
(leads to 1996 Nobel Prize in Chemistry).
1990 - Kratschmer et al. produce macroscopic quantities of C60
1991 - Iijima discovers multi-walled carbon nanotubes (MWNTs).
1992 - Ebbesen and Ajayan synthesize gram quantities of MWNTs.
1993 - Iijima & Ichihashi and Bethune et al. discover single-wallnanotubes (SWNTs) by arc-discharge.
1995 - Guo et al. introduce laser vaporization for production ofhigher purity SWNT samples.
1996 - Dai et al. decompose CO on metal catalysts to grow SWNTs,introducing chemical vapor deposition.
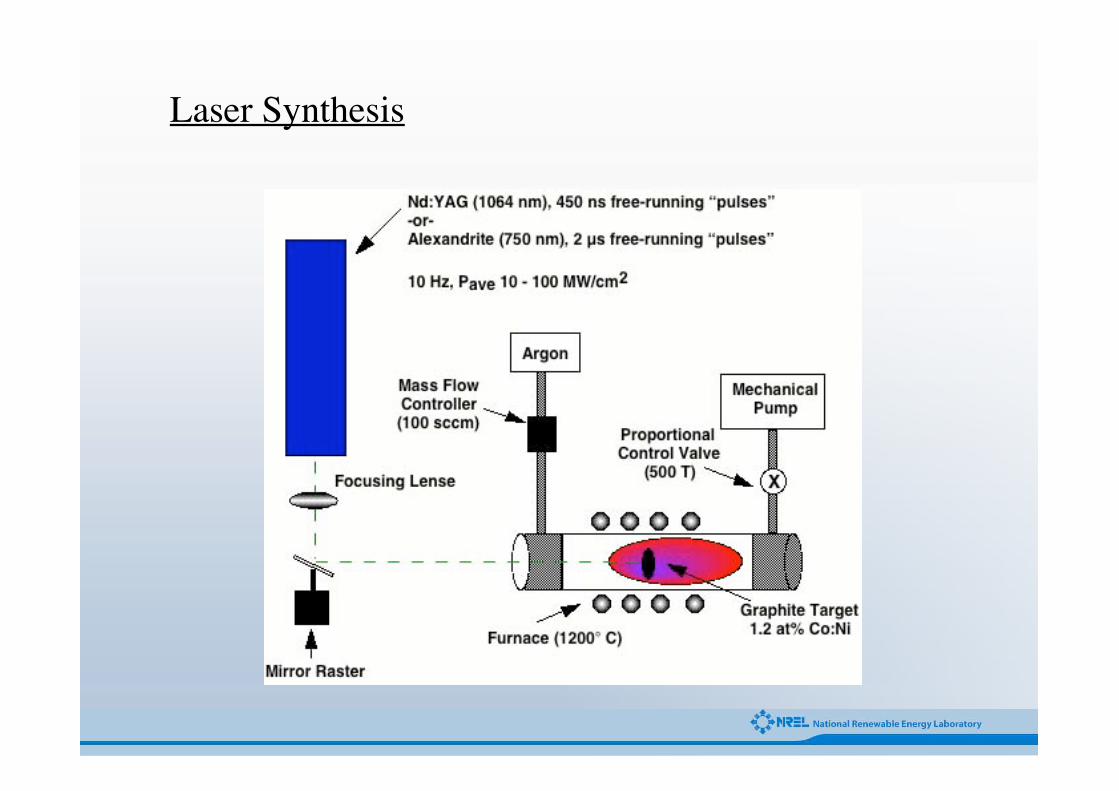
Laser Synthesis
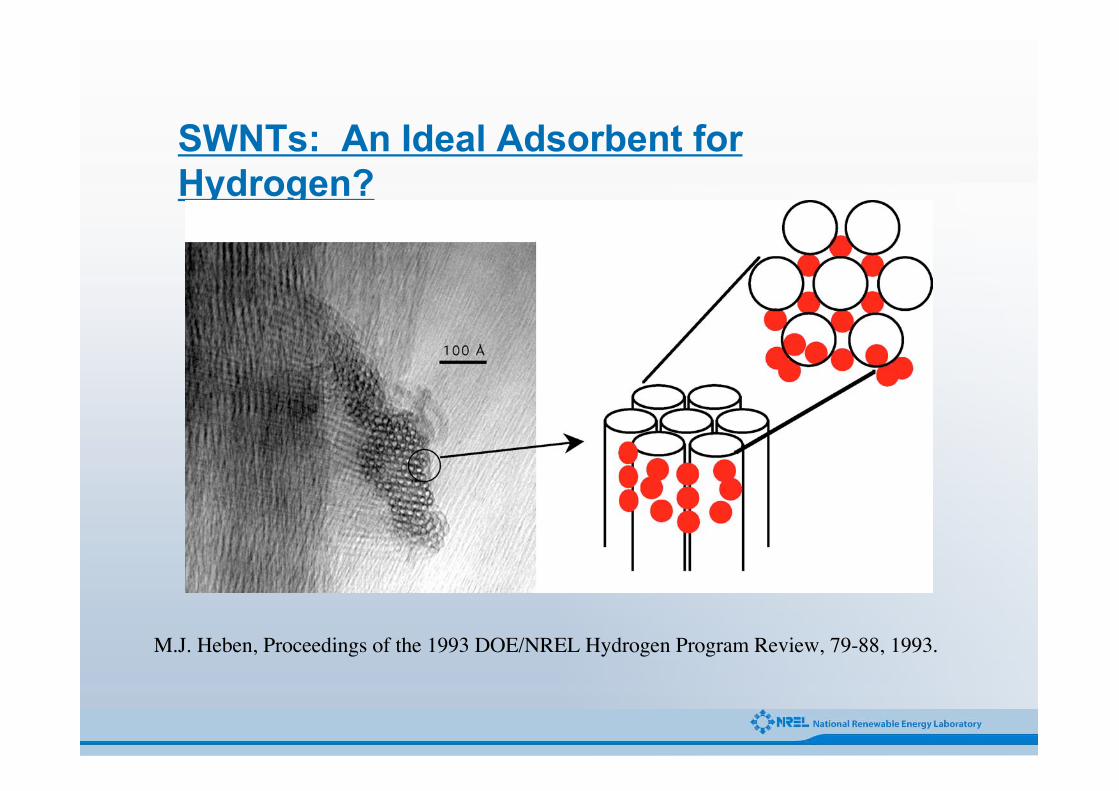
SWNTs: An Ideal Adsorbent forHydrogen?
M.J. Heben, Proceedings of the 1993 DOE/NREL Hydrogen Program Review, 79-88, 1993.

Hydrogen Adsorption After Degassing
• New high temperatureadsorption site
• Integrated H2 was ~0.01wt% of the total sampleweight
• Storage densities between5 and 10 wt% on a SWNTbasis
A.C. Dillon, K.M. Jones, T.A.Bekkedahl, C.H. Kiang, D.S.Bethune, & M.J. Heben, Nature (386) 377, 1997.

60
50
40
30
20
10
0
De
so
rpti
on
Ra
te (
nm
ole
s/s
ec
)
8006004002000
Time (s)
011904, 0.90 mg, 2.39 wt% Pure SWNT, 0.96 mg, 0.003 wt%
H2 Desorption
Cp[ScH2(H2)4]0.23 eV
• Doped single-wall nanotubes (SWNTs)
synthesized and capacity measured to be ~2.5 -
3 wt.% hydrogen storage
• Expanded work scope beyond SWNTs
C48B12[ScH(H2)5]12C48B12[ScH]12
60H2
Potential for 8.8 wt%
Storage Accomplishments-Carbon and New Materials
6
5
4
3
2
1
500400300200100Temperature (K)
Pur ified Nanotubes PANI-CSA
Hyd
rog
en
TP
DM
as
s
Sig
na
l(a
.u.)
• Binding energies
calculated and
optimum compounds
theoretically predicted
for potential storage
materials
MacDiarmid, et al, U.Penn, Heben et al, NREL
Conducting
polymers
may show
promise
NREL: Y. Zhao, et al., PRL 94, 155504 (2005)
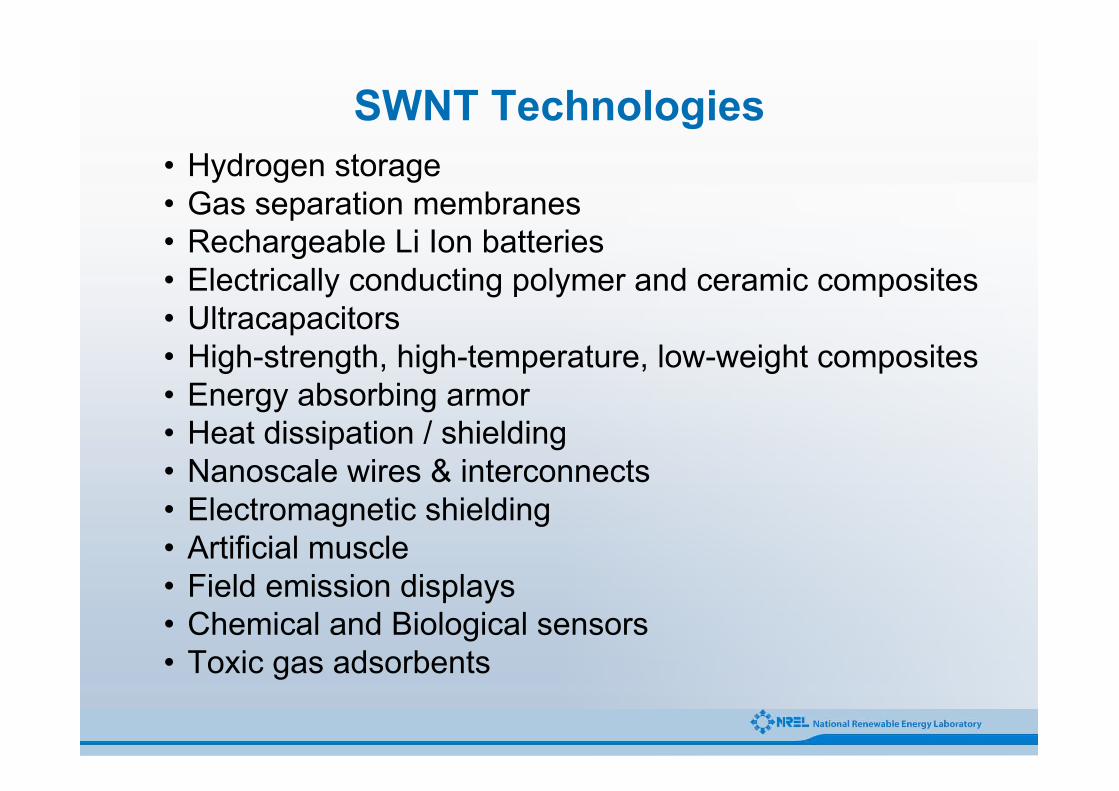
• Hydrogen storage
• Gas separation membranes
• Rechargeable Li Ion batteries
• Electrically conducting polymer and ceramic composites
• Ultracapacitors
• High-strength, high-temperature, low-weight composites
• Energy absorbing armor
• Heat dissipation / shielding
• Nanoscale wires & interconnects
• Electromagnetic shielding
• Artificial muscle
• Field emission displays
• Chemical and Biological sensors
• Toxic gas adsorbents
SWNT Technologies

Metal Hydrides and Complex HydridesDegradation, thermophysical properties,
effects of surfaces, processing, dopants, and
catalysts in improving kinetics,
nanostructured composites
Nanoscale/Novel MaterialsFinite size, shape, and curvature effects on
electronic states, thermodynamics, and
bonding, heterogeneous compositions and
structures, catalyzed dissociation and
interior storage phase
Theory and ModelingModel systems for benchmarking against
calculations at all length scales, integrating
disparate time & length scales, first
principles methods applicable to condensed
phases
Priority Research Areas in Hydrogen StoragePriority Research Areas in Hydrogen Storage
H D C O Al Si Fe
X ray cross section
Neutron cross section
H D C O Al Si Fe
X ray cross section
Neutron cross section
NaBH4 + 2 H2O � 4 H2 + NaBO2
H Adsorption inNanotube Array
Neutron Imaging ofHydrogen
Cup-StackedCarbon Nanofiber
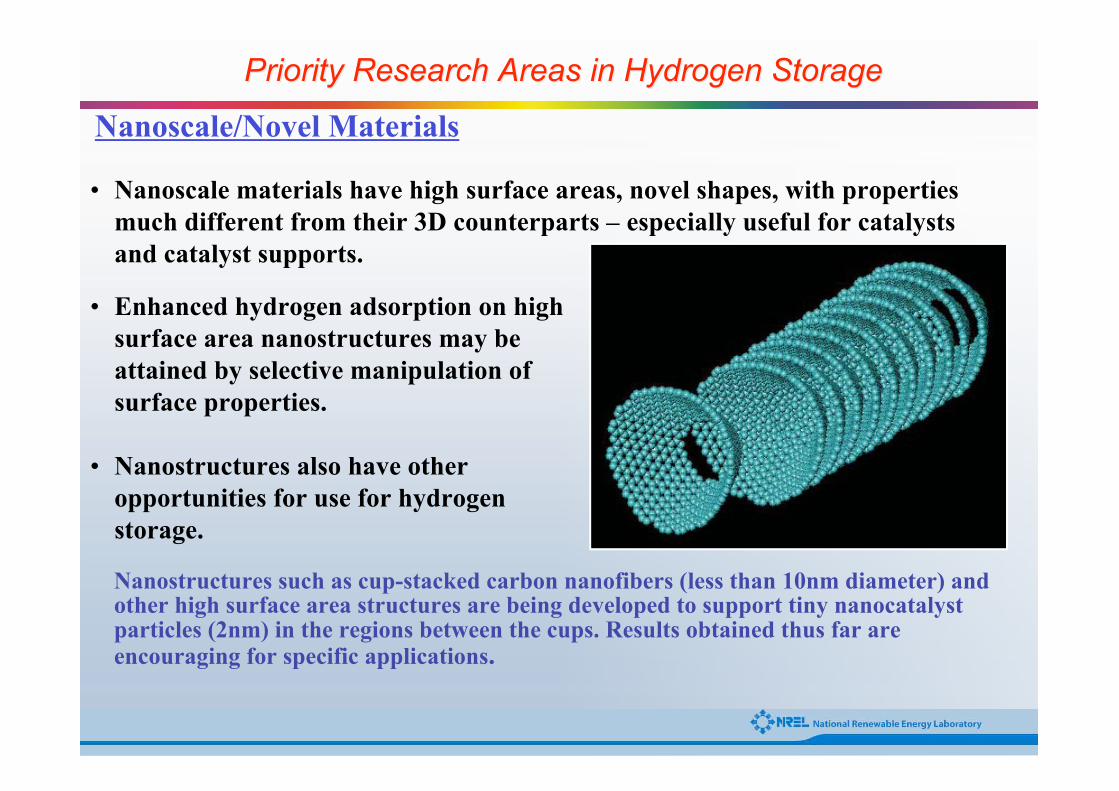
Nanoscale/Novel Materials
• Nanoscale materials have high surface areas, novel shapes, with properties
much different from their 3D counterparts – especially useful for catalysts
and catalyst supports.
Priority Research Areas in Hydrogen StoragePriority Research Areas in Hydrogen Storage
Nanostructures such as cup-stacked carbon nanofibers (less than 10nm diameter) andother high surface area structures are being developed to support tiny nanocatalystparticles (2nm) in the regions between the cups. Results obtained thus far areencouraging for specific applications.
• Enhanced hydrogen adsorption on high
surface area nanostructures may be
attained by selective manipulation of
surface properties.
• Nanostructures also have other
opportunities for use for hydrogen
storage.

National Hydrogen Storage Project1
Metal hydrides
Chemical Hydrogen Storage
Carbon-Based Materials
New materials/processesfor on-board storage
Compressed/Cryogenic& Hybrid approaches
Off-boardstorage systems3
Testing & Analysis Cross Cutting
BasicScience2
1. Coordinated by DOE Energy Efficiency and Renewable Energy, Office of Hydrogen, Fuel Cells and Infrastructure Technologies2. Basic science for hydrogen storage conducted through DOE Office of Science, Basic Energy Sciences3. Coordinated with Delivery program element
Centers of Excellence Independent Projects

DOE Center of Excellence on Carbon-basedHydrogen Storage Materials
Oak Ridge
Rice University(2 projects)
CalTech
Univ
Pennsylvania
Penn
State
Univ
North
Carolina
Univ
Michigan(2 projects)
Duke Univ
Livermore
NIST
NREL
Air Products
Lead Lab
Steering Committee

Chemochromic Hydrogen Sensors
Conclusions
• Significant advances have been made on photoelectro-
chemical and photobiological approaches to generation
of hydrogen from water.
• Carbon-based nanostructure materials are promising for
hydrogen storage for vehicular applications.
• Major hurdles remain in increasing conversion efficiency
and long-term stability while decreasing cost.
• Exciting new research opportunities are being pursued
for optimizing materials and device parameters as well
as developing new materials and device concepts.
034016116
Acknowledgements
The work at NREL reported in this presentation is attributed
to: Dr. J. Turner, Dr. A. Nozik, Dr. M. Seibert, Dr. M. Ghirardi,
Ms. Pin-Ching Maness, Dr. M. Heben, Dr. A. Dillon and many
of our past and present collaborators and supported by the
U.S. DOE/EERE Hydrogen, Fuel Cells and Infrastructure
Technologies, and U.S. DOE/BES/Biosciences Programs.
034016117