pide bps paper 2014
TRANSCRIPT
8/21/2019 Pide Bps Paper 2014
http://slidepdf.com/reader/full/pide-bps-paper-2014 1/29
8/21/2019 Pide Bps Paper 2014
http://slidepdf.com/reader/full/pide-bps-paper-2014 2/29
PIDE Working Papers
2006:4
Civil Servants’ Salary Structure
Faiz Bilquees
Pakistan Institute of Development Economics, Islamabad
PAKISTAN INSTITUTE OF DEVELOPMENT ECONOMICS
ISLAMABAD
8/21/2019 Pide Bps Paper 2014
http://slidepdf.com/reader/full/pide-bps-paper-2014 3/29
2
Acknowledgements: I am indebted to Dr A. R. Kemal and Dr Nadeem Ul Haque for their guidanceand valuable comments on the first draft of this paper. Thanks are also due to S. Zaheer Abbas Shah
for excellent typing assistance.
All rights reserved. No part of this publication may be reproduced, stored in a retrieval system or
transmitted in any form or by any means—electronic, mechanical, photocopying, recording or
otherwise—without prior permission of the author(s) and or the Pakistan Institute of Development
Economics, P. O. Box 1091, Islamabad 44000.
© Pakistan Institute of Development
Economics, 2006.
Pakistan Institute of Development Economics
Quaid-i-Azam University Campus
Islamabad 45320, Pakistan
E-mail: [email protected]
Website: http://www.pide.org.pk
Fax: +92-51-9210886
8/21/2019 Pide Bps Paper 2014
http://slidepdf.com/reader/full/pide-bps-paper-2014 4/29
3
C O N T E N T S
Page
Abstract v
I. Introduction 1
II. Salary Structure 2
(a) Determination of Basic Minimum Salary 2
(b) Length of the Pay Scales 5
(c) Overlapping of Pay Scales 5
(d) Increments 6
III. Perks 7
(a) Housing Allowance 7
(b) Conveyance Allowance 9
(c) Grade-specific Allowances 10
IV. Welfare of the Federal Employees: 1990-91–2005-06 11
(a) Indices of Real Wages 12
(b) Nominal Salaries as Percent of GNP Per Capita 14
V. Conclusions and Policy Recommendations 16
References 20
List of Tables
Table 1. Number of Stages between the Minimum and the
Maximum of a Scale 5
Table 2. Overlapping of Pay Scales 6
8/21/2019 Pide Bps Paper 2014
http://slidepdf.com/reader/full/pide-bps-paper-2014 5/29
4
Page
Table 3. Adjusted Rental Ceilings and Percentage Changes by
Grades 8
Table 4. Absolute and Percent Increases in the Conveyance
Allowance, by Groups of Employees 9
Table 5. Monthly Cost of Fully Maintained Cars 10Table 6. Grade-specific Allowances for the Three Highest Grades 11
Table 7. Indices of Real Wages as a Percent of GNP: 1991-92 to
2005-06 13
Table 8. Indices of Nominal Wages as a Percent of GNP: 1990-91
to 2004-05 15
Appendix Table 1. Estimation of Markup on Basic Salaries 18
Appendix Table 2. Revised Basic Pay Scales with Stages 19
Appendix Table 3. 20
List of FiguresFigure 1. Percentage Increases in Basic Salaries 3
Figure 2. Indices of Real Wages 4
Figure 3. House Rent as a Percentage of Basic Salary 8
Figure 4. Absolute Conveyance Allowance as a Percent of Basic
Salary 10
(ii)

8/21/2019 Pide Bps Paper 2014
http://slidepdf.com/reader/full/pide-bps-paper-2014 6/29
5
ABSTRACT
The paper looks at the trends in nominal and real salaries of the FederalGovernment employees over the period 1990-2006. It examines the structural
defects in the existing salary structure and the anomalies in the allowances
structure to show that appropriate remuneration for the civil servants requires
serious and urgent consideration. The widening gap in the emoluments of
government employees versus the public sector corporations and private sector
employees has a strong bearing on the motivation and ability to work. The paper
makes serious recommendations to overhaul the existing structure of salaries
and perks to make the public sector employment competitive and cost-effective.

8/21/2019 Pide Bps Paper 2014
http://slidepdf.com/reader/full/pide-bps-paper-2014 7/29
8/21/2019 Pide Bps Paper 2014
http://slidepdf.com/reader/full/pide-bps-paper-2014 8/29
Civil Servants’ Salary Structure1
I. INTRODUCTION
The civil service in a large part of the world still guarantees security of jobs over the full working life, and this is highly valued by the employees
especially in developing countries where employment opportunities are scarce.
The salary structure of the civil service deserves special attention because it
determines the quality of personal hired. While many other factors also affect
the performance of the employees, the financial rewards have a strong bearing
on the motivation and performance of the staff. This is particularly so
considering the ever-widening gap between the wages of the public and the
private sectors in most of the developing countries.
In Pakistan independent pay commissions headed by senior retired civil
servants have always fixed the pay scales. The first pay commission of 1948-49
rejected the colonial wage structure because of widespread divergence in the pay
scales of high-paid British officials and the lower-grade local officers. Itrecommended a judious salary structure. The commission prescribed a living
wage (undefined) for the low paid employees, and advised conservatism and
wage restraint for the remaining categories. The commission also ruled that
men of genius belonged to the private sector and not the public sector. The
government however disassociated itself from this viewpoint and the next pay
commission of 1970 strongly emphasised the need to provide adequate
compensation and due recognition as incentives for persons of highest caliber to
seek employment in the public sector.2 Later the commission also recommended
further rationalisation of salary structures. The pay commission of 1972
eventually compressed the 650 pay scales to 22 national pay scales. The
subsequent pay commissions of 1977, 1983, 1987, 1991, 1994, 2001 and 2005
have continued with these twenty-two scales with the declared objective ofnarrowing the gap between the highest paid and the lowest paid. However, this
gap remains fixed at 1:9 for the last four salary revisions between 1991 and
2005. This coupled with low real wages, increasing trend towards contract
employment, and no motivation to excel makes the government employment
least attractive compared to the private sector.3
1The paper deals with the salary structure of the Federal Government employees of general
services only; special groups/cadres like the Foreign Service, the Prime Minister’s Secretariat
employees, MP grades, etc., are not covered here.2See Irfan (1989).3See Haque and Kim (1994).
8/21/2019 Pide Bps Paper 2014
http://slidepdf.com/reader/full/pide-bps-paper-2014 9/29
2
The vibrant private sector growth with attractive salary packages, training
opportunities, and modern Human Resource Development (HRD) is the focus of
talented individuals. Furthermore, within the government the salary structures of
the various public sector corporations are close to those of the private sector
while the rest of the government is stuck with 22 grades. Thus the gap between
the salaries of civil servants and employees of government corporations as well
as the private sector continues to widen.4 The civil servants therefore, lack theright incentives to perform. This paper examines some of the structural
problems underlying the pay scales of the Federal Government employees as
well as the trends in salaries and allowances as they have evolved overtime. The
lengthy and over lapping pay scales are a disincentive to efficient workers.
The paper is structured as follows: Section II analyses the existing salary
structure in the light of recent revisions. Section III analyses the allowance
structures and the associated anomalies. Section IV gives an over view of the
trends in real salaries of the civil servants for the period 1990-91 to 2005-06,
and provides a comparison of pubic and private sector wages. Finally, Section
V concludes the paper with some suggestions/recommendations.
II. SALARY STRUCTURE
(a) Determination of Basic Minimum Salary
Pay Commissions in determining the pay structure fixes the minimum
wage as a reference point for the pays and salaries of the other government
employees. The minimum wages may be ascertained in a number of ways.5
• Firstly, minimum wages of the government employees may be fixed by
taking into consideration the market wages of the unskilled workers.
However, because market wage rate is itself influenced by the wages set
by the government, such an approach is not very useful. Besides, market
wages may or may not be sufficiently high to provide for the basic
necessities of the workers. In view of the social dimension of the wagerate structure to which the government is committed, such an approach
does not seem to be very appropriate.
• Secondly, the proposed minimum wages in the new pay structure may
be no less than the wages sufficient to purchase the bundle of goods and
services which the least paid employees could buy at the time minimum
wages were fixed in the previous pay scales. Such an approach implies
that nominal wages are adjusted upwards by the rate of inflation over the
intervening period.
4For a comprehensive analysis of pay gaps in the public and the private sectors in Pakistan,
see Hyder and Reilly (2005).5See the Kemal and Bilquees (1994) paper prepared for the 1994 Pay Commission.
8/21/2019 Pide Bps Paper 2014
http://slidepdf.com/reader/full/pide-bps-paper-2014 10/29
3
• Thirdly, the minimum wages may be set at a level which does not result
into a deterioration in the economic position of the least paid employee
in the society. In order to ensure that, real wages must be increased at a
rate equaling to the increase in productivity. Accordingly, the nominal
wages have to be adjusted for both the inflation rate as well as the gains
in productivity.
• Fourthly, the minimum wages are set in such a way that the expenditure
on food out of the income, in accordance with the preference of the
consumer for food and non-food consumption, is sufficient to meet the
caloric requirements. This approach implies that minimum wages should
be at least sufficient to provide the basic needs.
Prior to the last revision of 2005, pay scales have been revised by the
various independent pay commissions on the following principle: at every
revision of basic salary all relief and indexation granted in the previous period
are merged into basic salary of the last period. (This is considered as total basic
salary in this paper.) A certain increase on the total basic salary determines the
revised basic minimum salary of the next period.
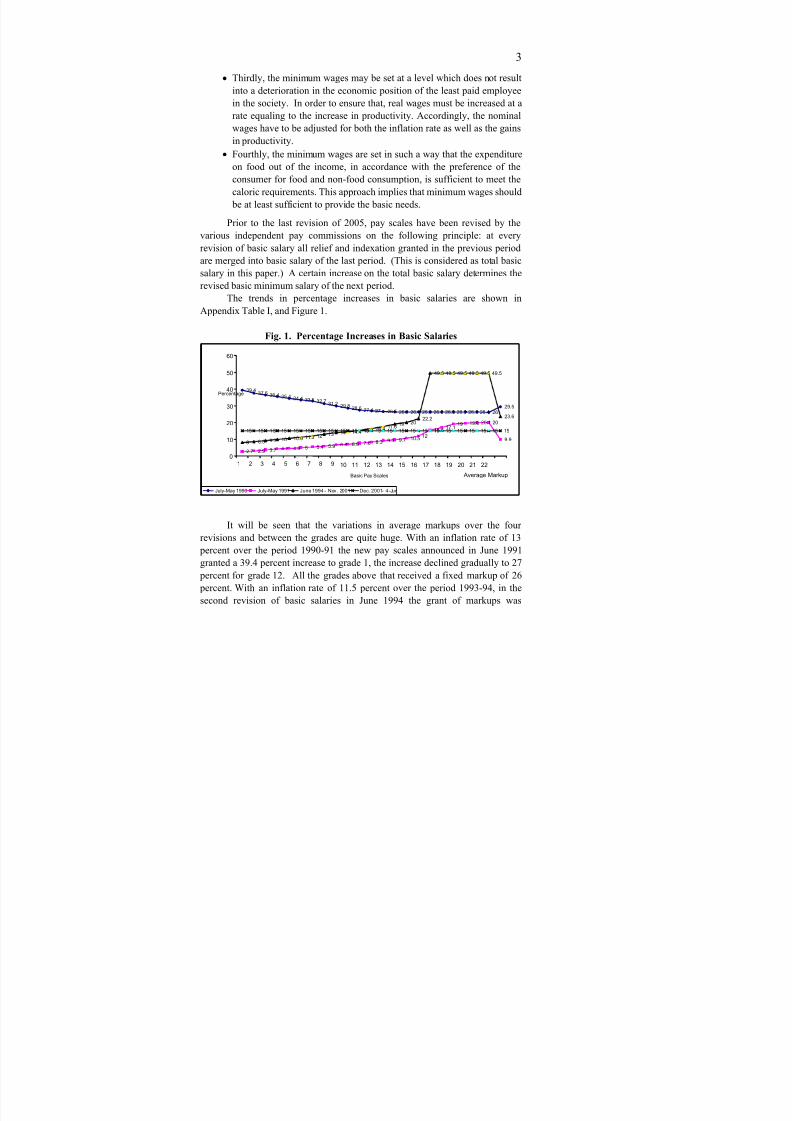
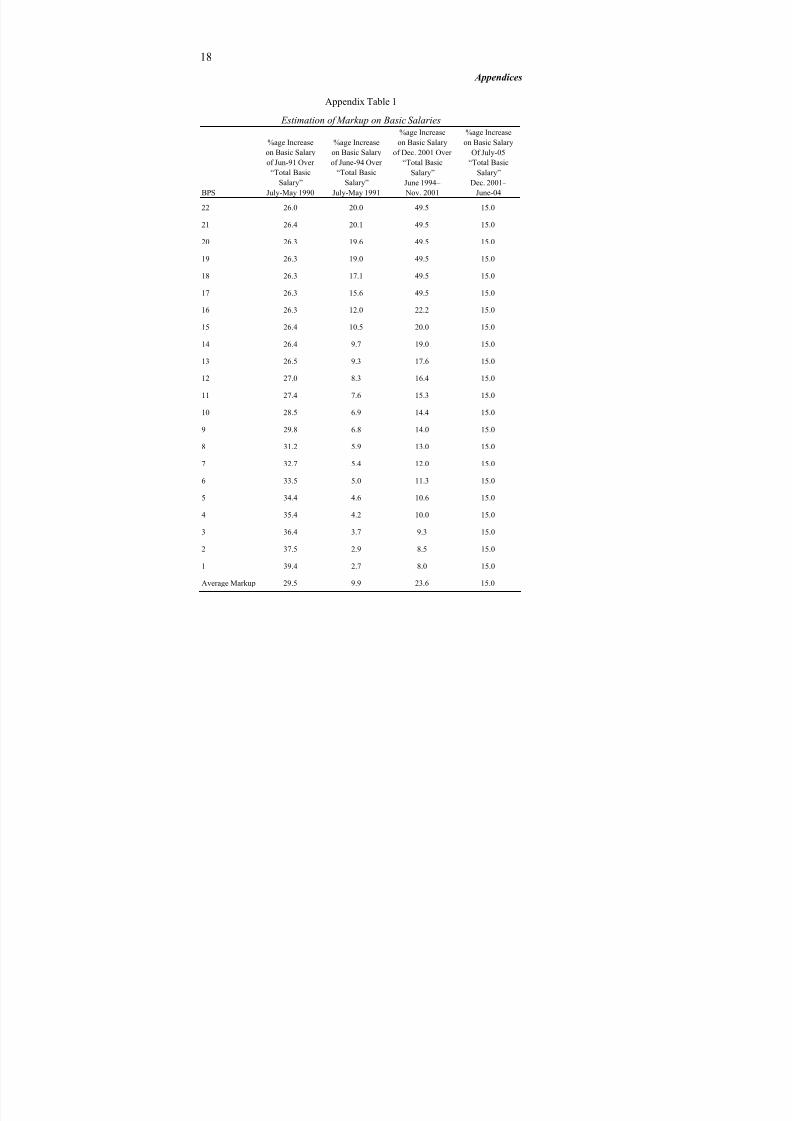
The trends in percentage increases in basic salaries are shown inAppendix Table I, and Figure 1.
Fig. 1. Percentage Increases in Basic Salaries
It will be seen that the variations in average markups over the four
revisions and between the grades are quite huge. With an inflation rate of 13
percent over the period 1990-91 the new pay scales announced in June 1991
granted a 39.4 percent increase to grade 1, the increase declined gradually to 27
percent for grade 12. All the grades above that received a fixed markup of 26
percent. With an inflation rate of 11.5 percent over the period 1993-94, in the
second revision of basic salaries in June 1994 the grant of markups was
39.4 37.5 36.4 35.4 34.4 33.5 32.7
31.2 29.8 28.5 27.4 27 26.5 26.4 26.4 26.3 26.3 26.3 26.3 26.3 26.4 2629.5
2.7
2.9
3.7 4.2 4.6 5 5.4 5.9 6.8 6.9 7.6 8.3 9.3 9.7 10.5
12
15.6 17.1
19 19.6 20.1 20
9.98 8.5 9.3 10 10.6 11.3 12 13 14 14.4 15.3 16.4 17.6
19 2022.2
49.5 49.5 49.5 49.5 49.5 49.5
23.6
15 15 1 5 15 15 15 15 15 15 15 15 15 15 15 15 15 15 15 15 15 15 15 15
0
10
20
30
40
50
60
1 2 3 4 5 6 7 8 9 10 11 12 13 14 15 16 17 18 19 20 21 22
Average MarkupBasic Pay Scales
Percentage
July-May 1990 July-May 1991 June 1994 - Nov. 2001 Dec. 2001- 4-Jun
8/21/2019 Pide Bps Paper 2014
http://slidepdf.com/reader/full/pide-bps-paper-2014 11/29
4
reversed: it varied from 2.7 percent for grade 1 to 20 percent for grade 22. After
a gap of six years the next revision in December 2001 saw a shift in the policy:
it froze the maximum relief allowance—the Special Additional Allowance—it
was not included to the computation of the total basic salary. With the exclusion
of this allowance, the markups for grades 1 to 17 increased in ascending order
from 8 to 22.2 percent, and were constant at 49.5 for the remaining five grades
in December 2001. For the last revision of July 2005 the revised scales weredetermined as follows: all the three relief allowances granted between December
2001 and July 2005 were frozen for all the grades, and the basic minimum
salaries of all grades in 2001 were increased by 15 percent to arrive at the new
pay scales. The ratio of the highest to the lowest paid remained 1:9 over the
four revisions.
Since the pay commission reports are “confidential” it is not possible to
ascertain the reasons for the shift in methodology. However, the shift raises an
important issue: how does one account for the erosion of the real value of these
allowances considering inflation rates of 9.3 percent in 2004-05 and 6.6 percent
in 2005-06? Does the 15 percent increase in the basic salary of 2001
compensate for the loss due to exclusion of allowances and the erosion in their
real value overtime in July 2005?To sum up, the average nominal increases fluctuated widely from 29.5
percent in 1991 to 9.9 percent 1994, 23.6 percent in 2001, and 15 percent in
2005.6 However the real wages continued to decline overtime as shown in
Figure 2.
Fig. 2. Indices of Real Wages
6Average markups during the previous revisions over the period 1978-91 ranged between
12.3 to 13.7 percent only [see Bilquees (1994)].
130 127
120 121 120 119 114 114 1 14 1 14
108 107111
108 109104 105
107 106 107104 103
115 113
108 109 108 107 105 105 1 04 1 04
101 100 103
101 102
95 96 9794 95
92 91
105 104 97 101
98 97 93 93 94 94
91 91 9289 91
78
8488
86 8791
98
110 108 99 103 102 101
95 95 96 9691 91 93
89 90
79
85
90
84 85
92
101
0
20
40
60
80
100
120
140
1 2 3 4 5 6 7 8 9 10 11 12 13 14 15 16 17 18 19 20 21 22
Basic Pay Scale
1991-92 1993-94 2001-02 2005-06
8/21/2019 Pide Bps Paper 2014
http://slidepdf.com/reader/full/pide-bps-paper-2014 12/29
5
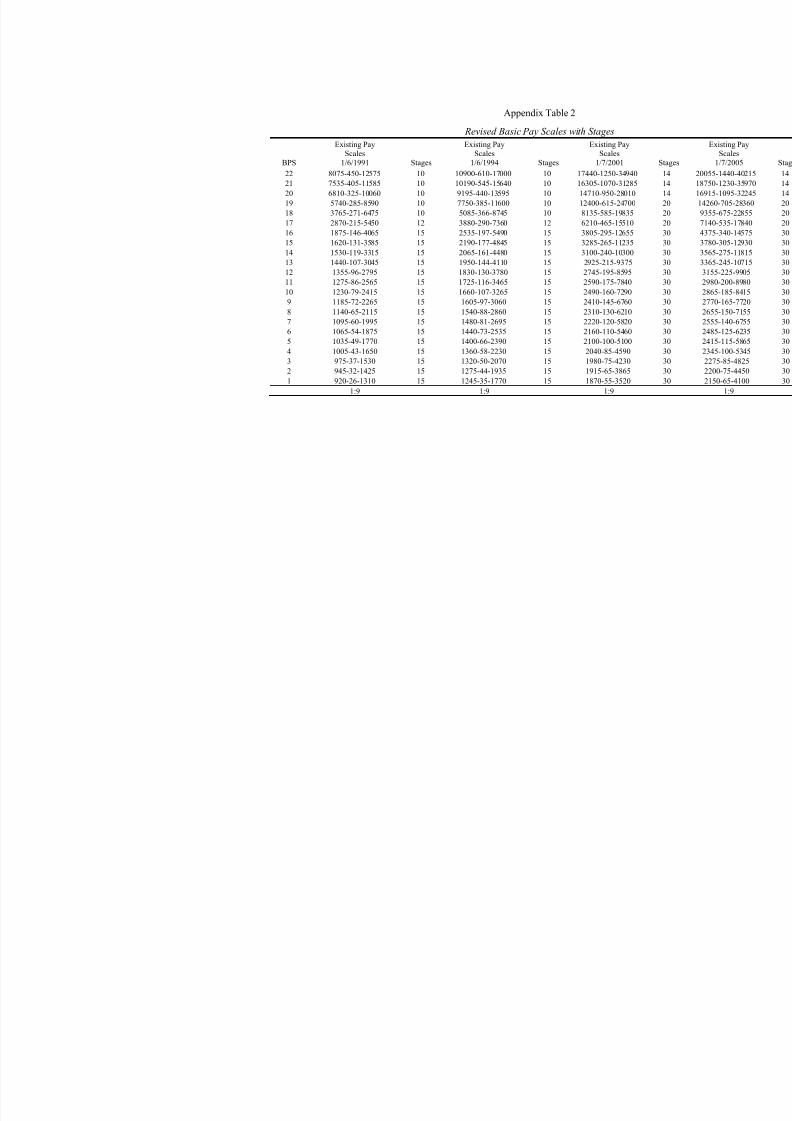
(b) Length of the Pay Scales7
The length of the pay scales refers to the number of stages (number of
increments to be earned) to reach the maximum of the scale as shown in Table 1.
The distribution of the stages between the gazetted and non-gazetted scales is
biased in favour of higher grades. Compared to the nineties, these stages have
doubled from 15 to 30 for grades 1 to16. For grades 17 to 19 the stages are
increased by more than half (12 to 20 stages), and for grades 20 to 22 they have
increased by less than half (10 to14 stages) since 2001.
Table 1
Number of Stages between the Minimum and the Maximum of a Scale
1-16 17 17-19 18-22 20-22
Years/Grades No. of Stages Required to Reach the Maximum of a Scale
1991 15 12 – 10 –
1994 15 12 – 10 –2001 30 – 20 – 14
2005 30 – 20 – 14
These extremely long pay scales have their pros and cons: they are
undesirable because they are both inefficient and uneconomic. The inefficiency
arises due to unhindered payment of increments to all irrespective of their work
input. This rules out the difference between efficient and non-efficient workers,
hence there is no incentive to perform. They are uneconomical because
inefficient employees continue to receive increments until they reach the
maximum of the scale. The lengthy scales are desirable compared to the shorter
scales only because the latter would require rapid promotions. In other words,
the limited availability of posts in each scale, or the prospects for promotion
would affect the length of scale.
Lengthy pay scales are indeed a very regressive feature of the civil
service salary structure. An employee stuck on the same job for 15 to 30 years
earning annual increments only, with no prospects of improvement in his living
insight is bound to lose all motivation to work over the coming years.
(c) Overlapping of Pay Scales
Another important issue related to the salary structure is that by how
much salary scales should overlap? Scales overlap when the maximum of one
scale is higher than the minimum of the next higher scale(s). In the advanced
industrialised countries, civil service salary scales do not overlap by more than
two higher scales. In Pakistan however overlapping of grades is a serious issue
as shown in Table 2 below.
7Sections IIb, IIc, and IId are based on Chew (1992).
8/21/2019 Pide Bps Paper 2014
http://slidepdf.com/reader/full/pide-bps-paper-2014 13/29
6
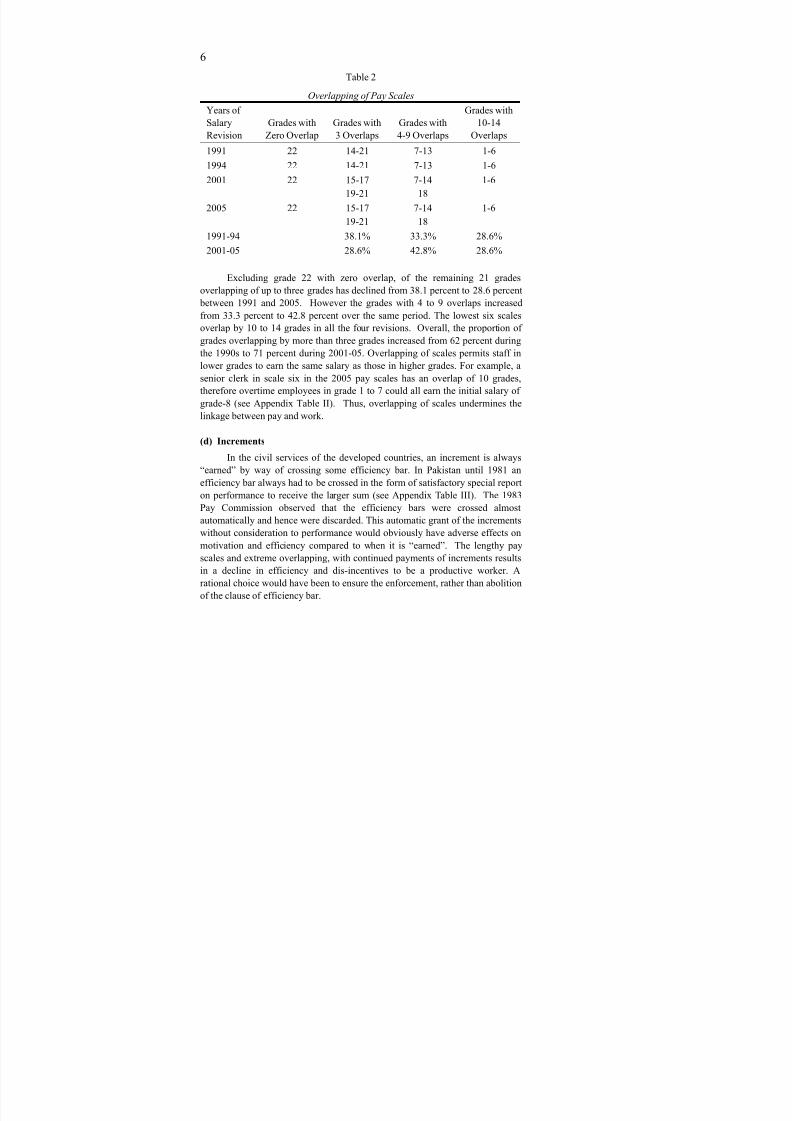
Table 2
Overlapping of Pay Scales
Years of
Salary
Revision
Grades with
Zero Overlap
Grades with
3 Overlaps
Grades with
4-9 Overlaps
Grades with
10-14
Overlaps
1991 22 14-21 7-13 1-61994 22 14-21 7-13 1-6
2001 22 15-17
19-21
7-14
18
1-6
2005 22 15-17
19-21
7-14
18
1-6
1991-94 38.1% 33.3% 28.6%
2001-05 28.6% 42.8% 28.6%
Excluding grade 22 with zero overlap, of the remaining 21 grades
overlapping of up to three grades has declined from 38.1 percent to 28.6 percent
between 1991 and 2005. However the grades with 4 to 9 overlaps increasedfrom 33.3 percent to 42.8 percent over the same period. The lowest six scales
overlap by 10 to 14 grades in all the four revisions. Overall, the proportion of
grades overlapping by more than three grades increased from 62 percent during
the 1990s to 71 percent during 2001-05. Overlapping of scales permits staff in
lower grades to earn the same salary as those in higher grades. For example, a
senior clerk in scale six in the 2005 pay scales has an overlap of 10 grades,
therefore overtime employees in grade 1 to 7 could all earn the initial salary of
grade-8 (see Appendix Table II). Thus, overlapping of scales undermines the
linkage between pay and work.
(d) Increments
In the civil services of the developed countries, an increment is always
“earned” by way of crossing some efficiency bar. In Pakistan until 1981 an
efficiency bar always had to be crossed in the form of satisfactory special report
on performance to receive the larger sum (see Appendix Table III). The 1983
Pay Commission observed that the efficiency bars were crossed almost
automatically and hence were discarded. This automatic grant of the increments
without consideration to performance would obviously have adverse effects on
motivation and efficiency compared to when it is “earned”. The lengthy pay
scales and extreme overlapping, with continued payments of increments results
in a decline in efficiency and dis-incentives to be a productive worker. A
rational choice would have been to ensure the enforcement, rather than abolition
of the clause of efficiency bar.
8/21/2019 Pide Bps Paper 2014
http://slidepdf.com/reader/full/pide-bps-paper-2014 14/29
7
To sum up, lengthy scales, extensive overlapping and unconditional grant
of increments weaken the linkage between pay and work, and contribute to
unequal levels of work within one grade. Overlapping of grades makes it worse
among the grades, and the linkage between work content and salary vanishes or
becomes more inequitable.
III. PERKS
(a) Housing Allowance
The accommodation facility/allowance provided to the federal government
employees falls into three categories: (i) those who make their own living
arrangements instead of renting house on government account, they receive fifty
percent of the basic salary as housing subsidy; (ii) those who requisite houses in the
open market at the official rental ceiling; and (iii) those who are provided
government accommodation. The last two categories pay 5 percent of gross salary
as house rent recovery (or partial tax on the allowance) that also provides towards
maintenance of houses on government account.8 All categories of this allowance are
highly valued by the employees. However it is important to note that employees
hiring houses in the open market face serious hardships due to the failure of the
government to impose rent control in the federal capital.
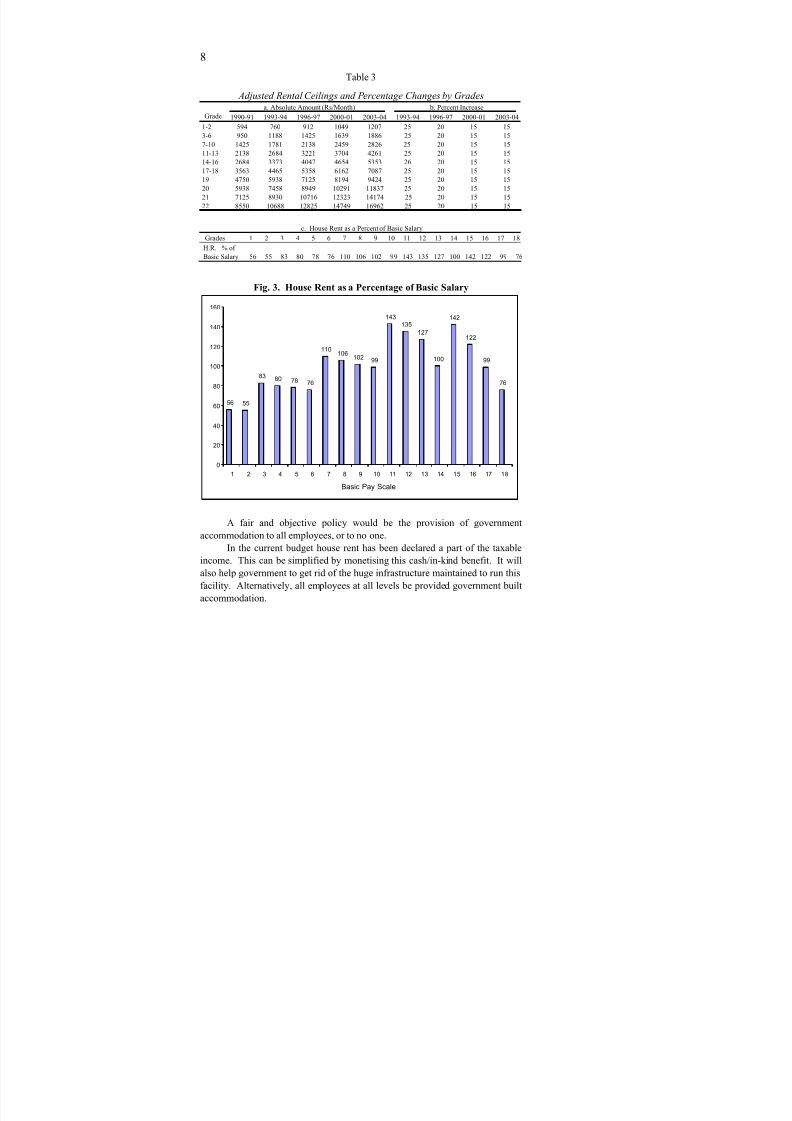
In Table 3, we see that house rents have been increased before or after each
salary revision. However, grades up to 18 have been lumped in to six groups for
the allocation of house rent. The rationale behind this policy is not known, but it
raises a serious anomaly: the higher salary results in lower house rent entitlement
up to grade 18 (see section c of the table). This erosion has serious implications
for the very poor households in the lower grades, indeed it looks very awkward
even for grades seventeen and eighteen as shown in Figure 3.
Although house rent is the most valuable cash allowance for employees
renting houses, this facility pales in comparison to the physical government
housing. It is rather awkward if we compare a secretary renting his own house
or a portion in any house at the official entitlement in Islamabad (that is what
one can get at the market rate), with a colleague living in government built
accommodation. While the former gets monthly house rent amounting to Rs
16,962 the government accommodation carries an imputed rental value of more
than Rs 100,000 since it is independent occupancy, is built on a larger space,
and has all amenities like servant quarters, porch, modern kitchen facilities etc.
Furthermore, it is an open secret that many people in top positions live in
government housing while their own houses (generally in the name of spouses)
are rented out at market rates.
8The employees of semi-government organisations are not entitled to the maintenance
facility despite the 5 percent deduction.
8/21/2019 Pide Bps Paper 2014
http://slidepdf.com/reader/full/pide-bps-paper-2014 15/29
8
Table 3
Adjusted Rental Ceilings and Percentage Changes by Gradesa. Absolute Amount (Rs/Month) b. Percent Increase
Grade 1990-91 1993-94 1996-97 2000-01 2003-04 1993-94 1996-97 2000-01 2003-04
1-2 594 760 912 1049 1207 25 20 15 15
3-6 950 1188 1425 1639 1886 25 20 15 15
7-10 1425 1781 2138 2459 2826 25 20 15 15
11-13 2138 2684 3221 3704 4261 25 20 15 1514-16 2684 3373 4047 4654 5353 26 20 15 15
17-18 3563 4465 5358 6162 7087 25 20 15 15
19 4750 5938 7125 8194 9424 25 20 15 15
20 5938 7458 8949 10291 11837 25 20 15 15
21 7125 8930 10716 12323 14174 25 20 15 15
22 8550 10688 12825 14749 16962 25 20 15 15
c. House Rent as a Percent of Basic Salary
Grades 1 2 3 4 5 6 7 8 9 10 11 12 13 14 15 16 17 18
H.R. % of
Basic Salary 56 55 83 80 78 76 110 106 102 99 143 135 127 100 142 122 99 76
Fig. 3. House Rent as a Percentage of Basic Salary
56 55
83 80 78 76
110106
102 99
143
135
127
100
142
122
99
76
0
20
40
60
80
100
120
140
160
1 2 3 4 5 6 7 8 9 10 11 12 13 14 15 16 17 18
Basic Pay Scale
A fair and objective policy would be the provision of government
accommodation to all employees, or to no one.
In the current budget house rent has been declared a part of the taxable
income. This can be simplified by monetising this cash/in-kind benefit. It will
also help government to get rid of the huge infrastructure maintained to run this
facility. Alternatively, all employees at all levels be provided government built
accommodation.

8/21/2019 Pide Bps Paper 2014
http://slidepdf.com/reader/full/pide-bps-paper-2014 16/29
9
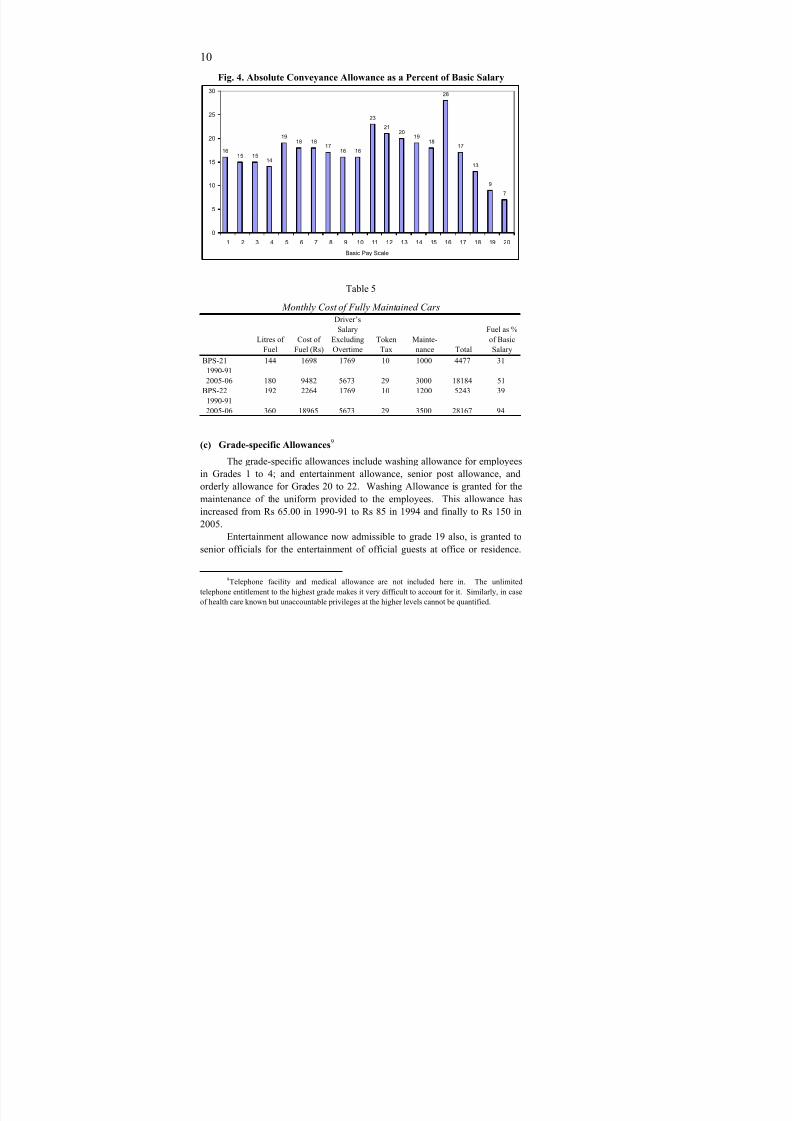
(b) Conveyance Allowance
Whether an employee owns a vehicle or not all employees upto grade 20
are paid conveyance allowance in-cash while the two highest grades are
provided fully maintained staff cars for official and private use. For the purpose
of this study it is assumed that all employees below grade 18 do not maintain a
car. Therefore the employees in grade 18-20 receive a car maintenance
allowance.
The absolute amounts of conveyance allowance, its rate of increase over
time, and the allowance as percentage of basic salary for all grades are reported
in Table 4 (a, b, c). The employees up to grade 19 are lumped in to five broad
groups for the payment of conveyance allowance. Therefore as in case of house
rent, when calculated as a percent of the basic salary this practice results in
losses to employees of higher grades. The loss, is particularly more pronounced
between grades 16 to 20 (see Section-c Table 4, and Figure 4). This practice of
lumping grades for house rent and conveyance allowances is rather ambiguous.
Table 4
Absolute and Percent Increases in the Conveyance Allowance, byGroups of Employees
a. Absolute Conveyance Allowance b. Percent Increase
Grades 1-Jul-91 1-Jul-94 1-Jul-01 1-Jul-05 1-Jul-91 1-Jul-94 1-Jul-01 1-Jul-05
1-4 96 96 170 340 26 0 77 100
5-10 96 96 170 460 26 0 77 171
11-15 193 193 340 680 154 0 76 100
16-19 193 355 620 1240 20 84 75 100
20 355 355 620 1240 120 0 75 100
c. Absolute Conveyance Allowance as a Percent of Basic Salary
C. Grades 1 2 3 4 5 6 7 8 9 10 11 12 13 14 15 16 17 18 19 20 21 22
CA as % of
Basic Salary 16 15 15 14 19 18 18 17 16 16 23 21 20 19 18 28 17 13 9 7
The conveyance facility of grade 21 and 22 for official and private use
includes tax-free cars of 1000 and 1300cc respectively; fully indexed fuel of 180
and 360 litres (Petrol) per month, full maintenance and repairs, as well as
uniformed drivers. It will be seen from Table 5 that in 2005-06 only the fuel
payment of grade 21 amounts to 51 percent of the basic salary while that of
grade-22 constitutes 94 percent of the basic salary of the grade. Conservative
estimates of maintenance of official cars are shown in Table 5. The current
budget also includes a rather complicated procedure to tax this privilege,
however the simple solution again would be to monetise this facility and make it
a part of the salary package, and do away with the vast network of maintaining/
running of official transport.
8/21/2019 Pide Bps Paper 2014
http://slidepdf.com/reader/full/pide-bps-paper-2014 17/29
10
Fig. 4. Absolute Conveyance Allowance as a Percent of Basic Salary
16 15 1514
1918 18
17
16 16
23
2120
1918
28
17
13
9
7
0
5
10
15
20
25
30
1 2 3 4 5 6 7 8 9 10 11 12 13 14 15 16 17 18 19 20
Basic Pay Scale
Table 5
Monthly Cost of Fully Maintained Cars
Litres of
Fuel
Cost of
Fuel (Rs)
Driver’s
Salary
Excluding
Overtime
Token
Tax
Mainte-
nance Total
Fuel as %
of Basic
Salary
144 1698 1769 10 1000 4477 31BPS-21
1990-91
2005-06 180 9482 5673 29 3000 18184 51
192 2264 1769 10 1200 5243 39BPS-22
1990-91
2005-06 360 18965 5673 29 3500 28167 94
(c) Grade-specific Allowances9
The grade-specific allowances include washing allowance for employees
in Grades 1 to 4; and entertainment allowance, senior post allowance, and
orderly allowance for Grades 20 to 22. Washing Allowance is granted for the
maintenance of the uniform provided to the employees. This allowance has
increased from Rs 65.00 in 1990-91 to Rs 85 in 1994 and finally to Rs 150 in
2005.
Entertainment allowance now admissible to grade 19 also, is granted to
senior officials for the entertainment of official guests at office or residence.
9Telephone facility and medical allowance are not included here in. The unlimited
telephone entitlement to the highest grade makes it very difficult to account for it. Similarly, in case
of health care known but unaccountable privileges at the higher levels cannot be quantified.

8/21/2019 Pide Bps Paper 2014
http://slidepdf.com/reader/full/pide-bps-paper-2014 18/29
11
These include in-office meetings and/or special assignments requiring
subordinates to consult the officials at residence.
Senior Post Allowance is presumably meant to maintain a certain
minimum gap between the highest-paid and the lowest-paid.
Orderly Allowance was introduced in 1985-86 and was initially
admissible only if an orderly for domestic duties was actually hired. This was
meant to promote employment of lower-income groups. However, thiscondition was waived later and it is now part of the salary. All the allowances
for the highest grades are reported in Table 6.
Table 6
Grade-specific Allowances for the Three Highest Grades
Years 1990-91 1994-95 1996-97 2002-03 2003-04 2005-06
Grades
Allowances Grade 20
Entertainment 400 400 400 450 450 600
Special P. Allow. 200 600 800 850 850 1100
Orderly Allow. 800 1000 1000 1900 2375 2375
Grade 21
Entertainment 450 450 450 525 525 700
Special P. Allow. 400 800 800 925 925 1200
Orderly Allow. 800 1000 1000 1900 2375 2375
Grade 22
Entertainment 650 650 650 725 725 975
Special P. Allow. 600 1000 1000 1200 1200 1600
Orderly Allow 800 1000 1000 2375 2375 2375
To summarise, the practice to club together various grades arbitrarily for
the allowances makes the allowances structure very inequitable. The housing
allowance versus the government housing is a serious anomaly to be resolved.
Similarly the distribution of conveyance allowance between grades 1 to 20 and
between grade 21 and 22 has serious implications for the distribution of income.
The regular allowances granted to groups of grades tend to favour the lower
grades in these groups. The grade-specific allowances of the highest income
groups apparently make the salary structures look very inequitable.
IV. WELFARE OF THE FEDERAL EMPLOYEES: 1990-91–2005-06
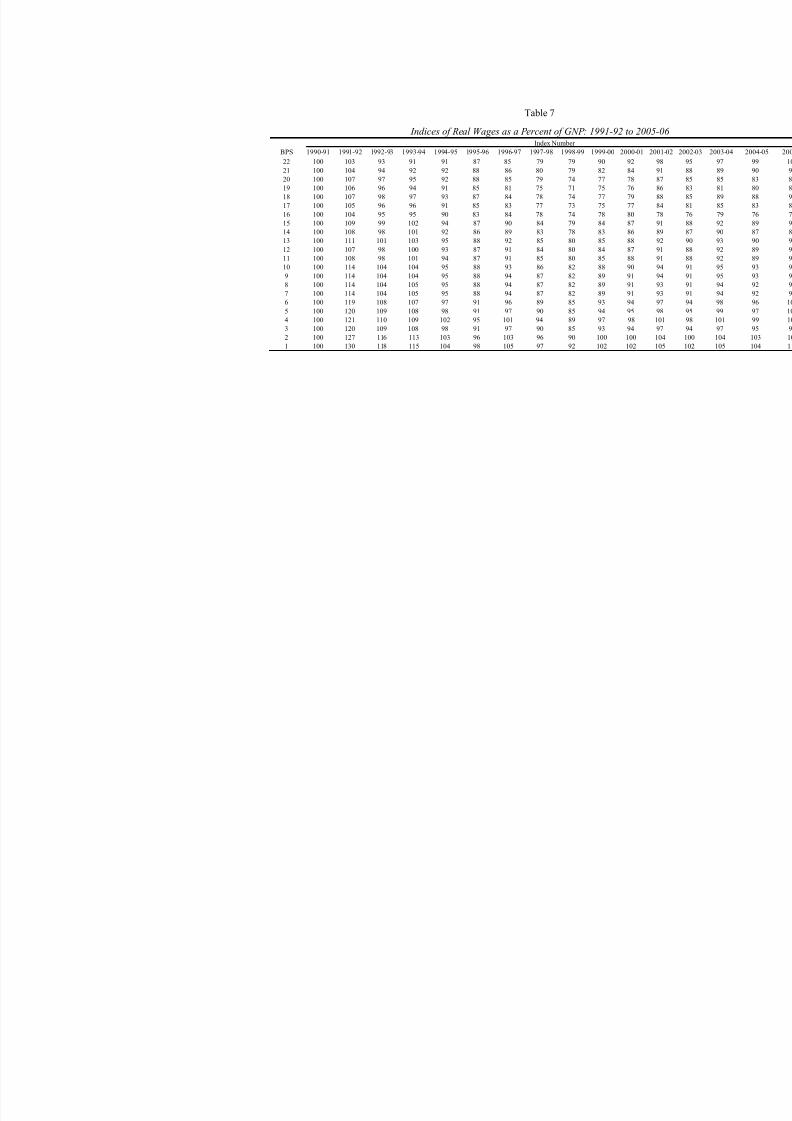
Trends in the real salaries of federal government employees are analysed
with reference to: (a) indices of real wages indicating the increase or decrease in
welfare of the employees in each grade and between different grades; and (b) the
proportional gains in the welfare of the federal employees vis-à-vis the rest of
the public in terms of GNP per capita.
8/21/2019 Pide Bps Paper 2014
http://slidepdf.com/reader/full/pide-bps-paper-2014 19/29
12
(a) Indices of Real Wages
The trends in the indices of real wages as shown in Table 7 are analysed
with reference to the increases in salaries granted overtime.10
The first revision of salaries effective June 1991, granted a maximum
markup of 39 percent to grade 1, decreasing gradually to 27 percent for grade
12, the remaining grades were granted a uniform increase of 26 percent.
Consequently, the real wages of all grades increased ranging from 30 percent for
grade 1 to only 3 percent for grade 22 in one year. However due to the rise in
inflation rate from 9.3 percent in 1991-92 to 11 percent in 1992-93 only grades 1
to 10 and grade 13 sustained positive real wages. Grades 11 and 12 may have
been affected negatively due to the pairing of grades for the allowances. The
further increase in inflation rate to 11.5 percent in the fiscal year 1993-94 led to
the second revision of June 1994. This revision reversed the markup in basic
salaries in favour of higher grades—it increased from 2.7 percent for grade 1 to
20 percent for the two highest grades. However this revision failed to mitigate
fully the effects of erosion due to double digit inflation: real wages for grades
16 to 22 remained negative, while grades 1 to 15 earned a positive but declining
real wage. For both the revisions the ratio of the highest paid to the lowest paid
remained 1:9.
Contrary to the policy of salary revisions every three years, the next
revision was delayed for six years when Pakistan faced serious fiscal constraints
under the IMF’s Structural Adjustment Programmes.11 This delay however had
serious implications for real earnings of the civil servants for the three years
1995-1997. Double digit inflation persisted until 1996-97 resulting in negative
real wage for all grades except for grades 1, 2 and 4.
In the following two years between July 1997 to June 1999 inflation
declined to single digits (7.4 and 5.7), but in the absence of any salary
adjustments real wages were negative for all the 22 grades during 1997-8 and
1998-9. This outcome was repeated in the following year.
The third revision of pay scales in December 2001 saw a shift in the
existing methodology of salary revision. The Special Additional Allowance was
frozen in the calculation of Total Basic Salary. The salary revision resulted in
positive real wage for grades 1, 2 and 4 by increases of 5, 4 and 1 percent
respectively in 2001-02, and only grade 1 registered an increase of 2 percent
despite the decline in inflation rate to only 2.9 percent in 2002-03. Inflation rate
increased to 9.3 percent in 2004-05 and the real wages were negative for all
grades except for grades 1 and 2. Thus the severe erosion of the salaries in the
nineties could not be recouped despite the continued decline in inflation from
10An important caveat may be noted here: the trends in real wages do not reflect the market
value of the perks granted to the federal government employees particularly at the level of four
highest grades.11This aspect is also studied by Kraay, Aart and Van Rijckeghem (1996).
8/21/2019 Pide Bps Paper 2014
http://slidepdf.com/reader/full/pide-bps-paper-2014 20/29
Table 7
Indices of Real Wages as a Percent of GNP: 1991-92 to 2005-0Index Number
BPS 1990-91 1991-92 1992-93 1993-94 1994-95 1995-96 1996-97 1997-98 1998-99 1999-00 2000-01 2001-
22 100 103 93 91 91 87 85 79 79 90 92 98
21 100 104 94 92 92 88 86 80 79 82 84 91
20 100 107 97 95 92 88 85 79 74 77 78 87
19 100 106 96 94 91 85 81 75 71 75 76 86
18 100 107 98 97 93 87 84 78 74 77 79 88
17 100 105 96 96 91 85 83 77 73 75 77 84
16 100 104 95 95 90 83 84 78 74 78 80 78
15 100 109 99 102 94 87 90 84 79 84 87 91
14 100 108 98 101 92 86 89 83 78 83 86 89
13 100 111 101 103 95 88 92 85 80 85 88 92
12 100 107 98 100 93 87 91 84 80 84 87 91
11 100 108 98 101 94 87 91 85 80 85 88 91
10 100 114 104 104 95 88 93 86 82 88 90 94
9 100 114 104 104 95 88 94 87 82 89 91 94
8 100 114 104 105 95 88 94 87 82 89 91 93
7 100 114 104 105 95 88 94 87 82 89 91 93
6 100 119 108 107 97 91 96 89 85 93 94 975 100 120 109 108 98 91 97 90 85 94 95 98
4 100 121 110 109 102 95 101 94 89 97 98 101
3 100 120 109 108 98 91 97 90 85 93 94 97
2 100 127 116 113 103 96 103 96 90 100 100 104
1 100 130 118 115 104 98 105 97 92 102 102 105
8/21/2019 Pide Bps Paper 2014
http://slidepdf.com/reader/full/pide-bps-paper-2014 21/29
14
12.5 percent in 1996-97 to 2.9 percent in 2002-03. This outcome can be directly
attributed to the delay of six years in the revision of salaries without due
consideration to the inflation rate and it consequences.
The final revision of salaries in 2005, as described earlier was based
purely on a 15 percent increase of the basic salary of 2001 while all the relief
allowances were frozen. The decline in inflation to 6.6 percent in 2005-06 led to
an increase in real wages of grades 1, 2, 4, 5 and 6 by 10, 8, 3, 2 and 1 percentrespectively. The highest grade also registered a 1 percent increase for once.
The latter may be explained by the exceptionally high increase in the senior post
and entertainment allowance for the highest grade. Overall the position of
almost all grades deteriorated after 1993-94 with minor exceptions.
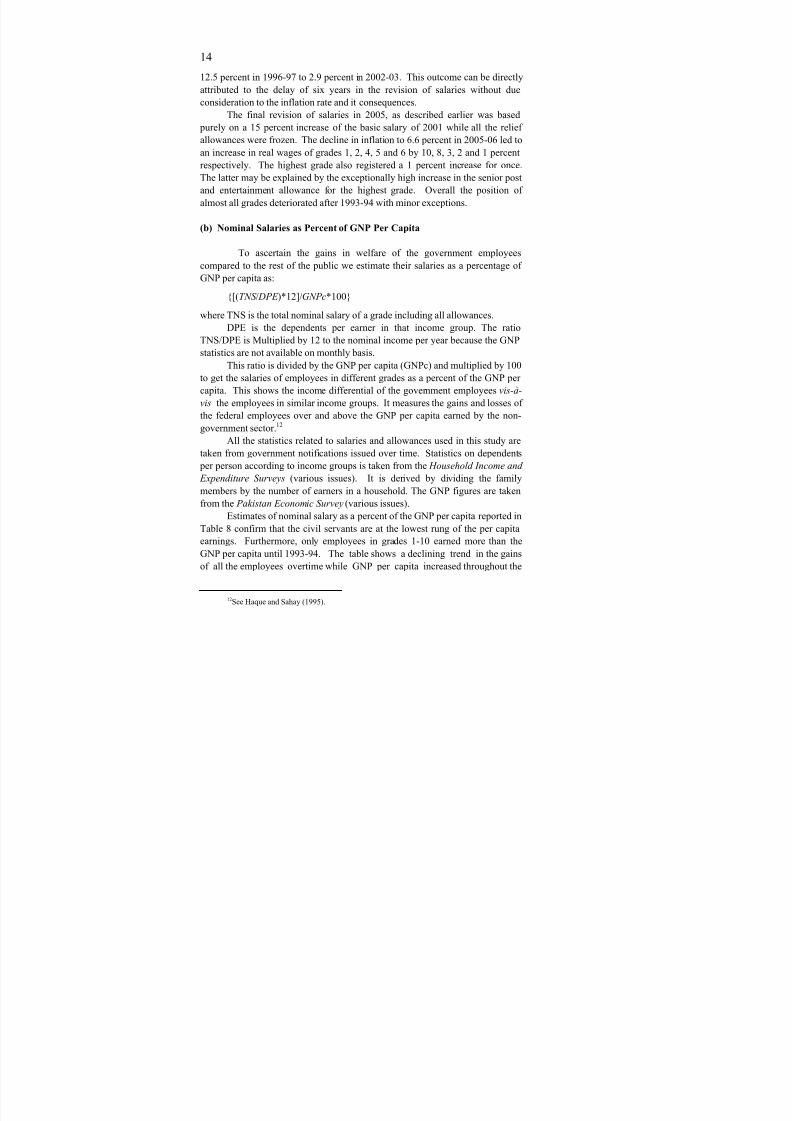
(b) Nominal Salaries as Percent of GNP Per Capita
To ascertain the gains in welfare of the government employees
compared to the rest of the public we estimate their salaries as a percentage of
GNP per capita as:
{[(TNS / DPE )*12]/GNPc*100}
where TNS is the total nominal salary of a grade including all allowances.
DPE is the dependents per earner in that income group. The ratio
TNS/DPE is Multiplied by 12 to the nominal income per year because the GNP
statistics are not available on monthly basis.
This ratio is divided by the GNP per capita (GNPc) and multiplied by 100
to get the salaries of employees in different grades as a percent of the GNP per
capita. This shows the income differential of the government employees vis-à-
vis the employees in similar income groups. It measures the gains and losses of
the federal employees over and above the GNP per capita earned by the non-
government sector.12
All the statistics related to salaries and allowances used in this study are
taken from government notifications issued over time. Statistics on dependents per person according to income groups is taken from the Household Income and
Expenditure Surveys (various issues). It is derived by dividing the family
members by the number of earners in a household. The GNP figures are taken
from the Pakistan Economic Survey (various issues).
Estimates of nominal salary as a percent of the GNP per capita reported in
Table 8 confirm that the civil servants are at the lowest rung of the per capita
earnings. Furthermore, only employees in grades 1-10 earned more than the
GNP per capita until 1993-94. The table shows a declining trend in the gains
of all the employees overtime while GNP per capita increased throughout the
12See Haque and Sahay (1995).
8/21/2019 Pide Bps Paper 2014
http://slidepdf.com/reader/full/pide-bps-paper-2014 22/29
Table 8
Indices of Nominal Wages as a Percent of GNP: 1990-91 to 2004
BPS 1990-91 1991-92 1992-93 1993-94 1994-95 1995-96 1996-97 1997-98 1998-99 1999-00 2000-01 200
22 100 99 92 88 85 82 80 76 74 70 70 7
21 100 100 93 104 85 82 81 76 74 64 64 6
20 100 103 96 107 85 82 80 75 70 60 59 6
19 100 102 95 107 85 80 76 72 67 58 57 6
18 100 104 96 110 87 82 79 74 69 60 60 6
17 100 102 95 109 85 80 78 73 68 59 59 6
16 100 101 94 108 84 78 80 75 70 61 61 5
15 100 105 98 115 87 81 85 80 74 65 66 6
14 100 105 97 115 86 81 84 80 74 64 66 6
13 100 107 100 117 88 82 86 81 75 66 67 6
12 100 105 97 114 87 82 86 81 75 66 67 6
11 100 104 97 114 87 81 86 81 75 66 67 6
10 100 109 102 117 88 82 87 82 76 68 68 7
9 100 110 102 118 88 82 87 82 77 68 69 7
8 100 110 102 118 88 82 88 82 77 68 69 6
7 100 110 102 118 88 82 88 83 77 69 69 6
6 100 116 108 122 91 86 92 86 80 73 72 7
5 100 116 108 123 91 86 92 86 81 73 72 7
4 100 116 108 123 94 88 94 89 83 75 74 7
3 100 117 108 123 92 86 92 87 81 73 72 7
2 100 124 115 129 96 91 98 92 86 79 77 7
1 100 125 116 130 97 92 98 93 86 79 78 7

8/21/2019 Pide Bps Paper 2014
http://slidepdf.com/reader/full/pide-bps-paper-2014 23/29
16
period. The declining trend is more pronounced for the higher grades compared
to the lower grades.13
V. CONCLUSIONS AND POLICY RECOMMENDATIONS
The pay scales of the civil service in Pakistan is beset with structural
defects in terms of length of scales, overlaps, and unhindered payments of
increments since 1983. The basic salary structure suffers from a number of
anomalies resulting in widening of gaps between work and pay and hence the
loss of incentive to work. Revision of salary scales has become a mechanical
exercise subject to the fiscal constraint of the federal government. The shift in
the methodology of determination of salary revisions for 2005 reflects adversely
on the policy-makers considering the loss of real salary due to the freezing of
allowances over three revisions, while inflation peaked at 9.3 percent in 2004-05
and stood at 6.6 percent in 2005-06.
Furthermore the grant and allocation of allowances has its own
ambiguities leading to serious distortions in remuneration among grades. Indeed
this system of perks has many drawbacks: it creates an infrastructure for the
maintenance of housing and cars, which at its best is inefficient, and at it’s worst
both inefficient and corrupt, resulting in loss of tax resources. It also insulates
the government servants who are in charge of policy from realities of life such
as renting houses and paying for cars. Monetisation of house rents will ease the
rent situation as the employees would prefer to save by acquiring the minimum
required accommodation. Currently they tend to hire houses according to their
full entitlements because there is no rebate on the house rent recovery, or in the
tax on the allowance if they pay a rent lower than their entitlement. The
conveyance facility of the two highest grades defies all sense of proportions
compared to the other grades. The unlimited telephone facility is totally against
the basic fiscal norm of user charge. Indeed all these factors suggest that the
people heading the various pay commissions are prevailed upon to maintain the
status-quo.
The erosion of real salaries particularly of the higher grades and the very
low nominal salaries of all grades compared to the non-government sector
(despite exclusion of tax deductions) reflects the importance government
attaches to the living standards of its workers. The indexation of salaries to the
inflation rate was granted only once in the eighties. However in the nineties the
fiscal constraint is met by the postponement of salary revisions for up to six
years, and is substituted by the irregular, piecemeal, token increases in relief and
other allowances. The new trend of freezing the relief allowances in the revision
of salaries is a serious anomaly with negative consequences for those at the
receiving end.
13The caveat in footnote (9) also applies in this case.

8/21/2019 Pide Bps Paper 2014
http://slidepdf.com/reader/full/pide-bps-paper-2014 24/29
17
In the light of the findings of this study the following recommendations
are put forward for consideration.
The lengthy and excessively overlapping pay scales and the unhindered
payment of increments need to be revamped significantly to establish a
“connect” between pay and work and to promote career advancement. One
possibility is to create sub-grades clearly identifying duties and remunerations,
coupled with a strict code of conduct. However, a more efficient way out of thismaze of existing salary structure is to monetise all the perks at the market rate
and add to the basic wage fully indexed. This begs the question: how to
determine the salaries thereafter? Governments in industrialised market
economies have generally taken the level of pay in other employing sectors as
the basic point of reference when determining the remuneration of their
employees. It is fair to pay the civil servants at the same rate as private
companies and public corporations if the government wishes to attract and retain
a motivated work force. Intelligent and motivated managers and administrators
are the need of the civil service. Only right people in the right places can help
put this distorted, corrupt and inefficient structure back in place.
The issue of monetisation of perks has overtime been brushed aside on
the pretext of lack of resources, but as pointed out earlier it is more an issue ofmaintaining the status quo. The three possible avenues to finance this
monetisation include:14 first, all the donor’s money being offered for the civil
service reforms could be considered for this package at some levels at least.
Secondly, money received from an auction/sale of all government housing
which remains inadequate forever, as well as the auction of official vehicles
could be used to help civil servants to purchase their own vehicles on lease, to
be run and maintained by themselves, compared to the lengthy procedures
announced to tax this facility. Similarly, loans can be provided on easy terms to
encourage employees to build own houses. Rationalisation of these two major
allowances and their inclusion as part of salary would also help government to
get rid of the huge infrastructures established to manage these perks. Finally,
the long-run benefits of this policy of rationalising and monetsing of all perksincluding free/subsidised telephones, reimbursement of excessive medical bills,
domestic servants, will outweigh the initial costs.
14See World Bank (2004).
8/21/2019 Pide Bps Paper 2014
http://slidepdf.com/reader/full/pide-bps-paper-2014 25/29
18
Appendices
Appendix Table 1
Estimation of Markup on Basic Salaries
BPS
%age Increase
on Basic Salaryof Jun-91 Over
“Total Basic
Salary”
July-May 1990
%age Increase
on Basic Salaryof June-94 Over
“Total Basic
Salary”
July-May 1991
%age Increase
on Basic Salary
of Dec. 2001 Over“Total Basic
Salary”
June 1994–
Nov. 2001
%age Increase
on Basic Salary
Of July-05“Total Basic
Salary”
Dec. 2001–
June-04
22 26.0 20.0 49.5 15.0
21 26.4 20.1 49.5 15.0
20 26.3 19.6 49.5 15.0
19 26.3 19.0 49.5 15.0
18 26.3 17.1 49.5 15.0
17 26.3 15.6 49.5 15.0
16 26.3 12.0 22.2 15.0
15 26.4 10.5 20.0 15.0
14 26.4 9.7 19.0 15.0
13 26.5 9.3 17.6 15.0
12 27.0 8.3 16.4 15.0
11 27.4 7.6 15.3 15.0
10 28.5 6.9 14.4 15.0
9 29.8 6.8 14.0 15.0
8 31.2 5.9 13.0 15.0
7 32.7 5.4 12.0 15.0
6 33.5 5.0 11.3 15.0
5 34.4 4.6 10.6 15.0
4 35.4 4.2 10.0 15.0
3 36.4 3.7 9.3 15.0
2 37.5 2.9 8.5 15.0
1 39.4 2.7 8.0 15.0
Average Markup 29.5 9.9 23.6 15.0
8/21/2019 Pide Bps Paper 2014
http://slidepdf.com/reader/full/pide-bps-paper-2014 26/29
Appendix Table 2
Revised Basic Pay Scales with Stages
BPS
Existing Pay
Scales1/6/1991 Stages
Existing Pay
Scales1/6/1994 Stages
Existing Pay
Scales1/7/2001 S
22 8075-450-12575 10 10900-610-17000 10 17440-1250-34940
21 7535-405-11585 10 10190-545-15640 10 16305-1070-31285
20 6810-325-10060 10 9195-440-13595 10 14710-950-28010
19 5740-285-8590 10 7750-385-11600 10 12400-615-24700
18 3765-271-6475 10 5085-366-8745 10 8135-585-19835
17 2870-215-5450 12 3880-290-7360 12 6210-465-15510
16 1875-146-4065 15 2535-197-5490 15 3805-295-12655
15 1620-131-3585 15 2190-177-4845 15 3285-265-11235
14 1530-119-3315 15 2065-161-4480 15 3100-240-10300
13 1440-107-3045 15 1950-144-4110 15 2925-215-9375
12 1355-96-2795 15 1830-130-3780 15 2745-195-8595
11 1275-86-2565 15 1725-116-3465 15 2590-175-7840
10 1230-79-2415 15 1660-107-3265 15 2490-160-7290
9 1185-72-2265 15 1605-97-3060 15 2410-145-6760 8 1140-65-2115 15 1540-88-2860 15 2310-130-6210
7 1095-60-1995 15 1480-81-2695 15 2220-120-5820
6 1065-54-1875 15 1440-73-2535 15 2160-110-5460
5 1035-49-1770 15 1400-66-2390 15 2100-100-5100
4 1005-43-1650 15 1360-58-2230 15 2040-85-4590
3 975-37-1530 15 1320-50-2070 15 1980-75-4230
2 945-32-1425 15 1275-44-1935 15 1915-65-3865
1 920-26-1310 15 1245-35-1770 15 1870-55-3520
1:9 1:9 1:9

8/21/2019 Pide Bps Paper 2014
http://slidepdf.com/reader/full/pide-bps-paper-2014 27/29
20
Appendix Table 3
Grade No.
Scales
(1-3-1972)
Revised Scales
(1-5-1977)
Revised Scales
(1-7-1981)
1 100-2-116/8-140 250-5-280/6-340 250-5-280/6-340-7-375
2 110-3-152/4-160 260-6-302/7-365 260-6-302/7-365-8-405
3 120-3-150/5-180 270-7-326/8-390 270-7-326/8-390-9-435
4 130-4-170/5-200 280-8-352/9-415 280-8-352/9-415-12-475
5 150-6-180/8-220/10-280 290-10-350/12-470 290-10-350/12-470-14-540
6 165-8-205/10-255/10-315 315-12-399/14-525 315-12-399/14-525-16-605
7 180-10-230/10-280/15-370 335-14-447/16-575 335-14-447/16-575-18-665
8 200-12-260/15-335/15-425 370-16-514/18-640 370-16-514/18-640-22-750
9 225-15-300/16-380/20-480 390-20-590/22-700 390-20-590/22-700-24-820
10 250-18-340/20-440/20-540 410-22-520/24-760 410-22-520/24-760-28-900
11 275-20-375/20-475/25-600 430-24-550/28-830 430-24-550/28-830-30-980
12 300-20-400/25-525/25-650 460-28-600/30-900 460-28-600/30-900-32-1060
13 325-25-450/25-575/25-700 490-30-790/32-950 490-30-790/32-950-35-1125
14 350-25-475/25-600/30-750 520-30-730/35-1010 520-30-730/35-1010-40-1210
15 375-25-500/30-650/35-825 550-35-900/40-1100 550-35-900/40-1100-50-1350
16 400-35-750/50-1000 625-40-825/50-1325 625-40-825/50-1325-60-1625
17 500-50-1000/50-1250 900-50-1150/60-1750 900-50-1150/60-1750-100-2250
18 1000-75-1750 1350-75-1650/100-2150 1350-75-1650/100-2650
19 1800-80-2200 2250-100-2750 2250-100-305020 2300-100-2600 2600-125-3225 2600-125-3600
21 2750 3000-150-3750 3000-150-4200
22 3000 3250-200-4250 3250-200-4850
REFERENCES
Bilquees, Faiz (1994) Real Wages of the Federal Government Employees:
Trends from 1977-78 to 1991-92. The Pakistan Development Review 33:1,
229–251.
Chew, D. C. E. (1992) Civil Service Pay in South Asia. Geneva: ILO.
Haque, Nadeem Ul, and Se-Jik Kim (1994) Human Capital Flight: Impact of
Migration on Income and Growth. International Monetary Fund,Washington, D. C. (IMF Working Papers 94/155.)
Haque, Nadeem Ul, and Ratna Sahay (1996) Do Government Wage Cuts Close
Budget Deficits?—A Conceptual Framework for Developing Countries and
Transition Economies. International Monetary Fund, Washington, D. C.
(Working Paper WP/96/19.)
Hayder, Asma and Barry Reilly (2005) The Public and Private Sector Pay Gap
in Pakistan: A Quantile Regression Analysis. The Pakistan Development
Review 44:3, 271–306.
Irfan, M. (1989) Wage Policy in Pakistan 1970-84. Published in Government
Wage Policy Foundation in Developing Countries: Seven Country Studies.
Geneva: ILO.

8/21/2019 Pide Bps Paper 2014
http://slidepdf.com/reader/full/pide-bps-paper-2014 28/29
21
Kemal, A. R., and Faiz Bilquees (1994) Determination of the Basic Minimum
Wages Through Calories Intake Approach. Study prepared for Pay and
Pension Committee. Government of Pakistan, Islamabad.
Kraay, Aart, and Caroline Van Rijckeghem (1996) Employment and Wages in
the Public Sector—A Cross Country Study. Washington, D. C.: International
Monetary Fund as quoted in Haque, et al . (1997) Fiscal Austerity and Public
Servant Quality published in Public Economics. (International MonetaryFund Working Paper.)
Pakistan, Government of (Various Issues) Pakistan Economic Survey.
Islamabad: Economic Adviser’s Wing, Ministry of Finance.
Pakistan, Government of (Various Issues) Household Income and Expenditure
Survey. Islamabad: Federal Bureau of Statistics, Statistics Division.
Pakistan, Government of (1991-92 to 2000) All Notifications and Memorandums
issued in connection with the Salaries and Allowances of the Federal
Government Employees. Islamabad: Ministry of Finance.
World Bank (2004) Pakistan Public Expenditure Management: Strategic Issues
and Reform Agenda. Washington, D.C., USA. (Report No. 25665-Pk.)

8/21/2019 Pide Bps Paper 2014
http://slidepdf.com/reader/full/pide-bps-paper-2014 29/29
22
PIDE Working Papers
2006:1. Remittances, Trade Liberalisation, and Poverty in
Pakistan: The Role of Excluded Variables in Poverty
Change Analysis by Rizwana Siddiqui and A. R. Kemal
(2006). 40pp.
2006:2. Poverty-reducing or Poverty-inducing? A CGE-based Analysis of Foreign Capital Inflows in Pakistan by
Rizwana Siddiqui and A. R. Kemal (2006). 43pp.
2006:3. Bureaucracy and Pro-poor Change by Ali Cheema andAsad Sayeed (2006). 26pp.