prefuse: a toolkit for interactive information visualization · · 2017-03-13information...
TRANSCRIPT

Prefuse: a toolkit for interactive information visualization
Jeffery Heer, UC Berkeley Stuart K. Card, Palo Alto Research Center James A. Landay, University of Washington
1

Infovis � What is information visualization (infovis)?
◦ Visual representations of abstract information ◦ Demystify data and reveal hidden patterns
2
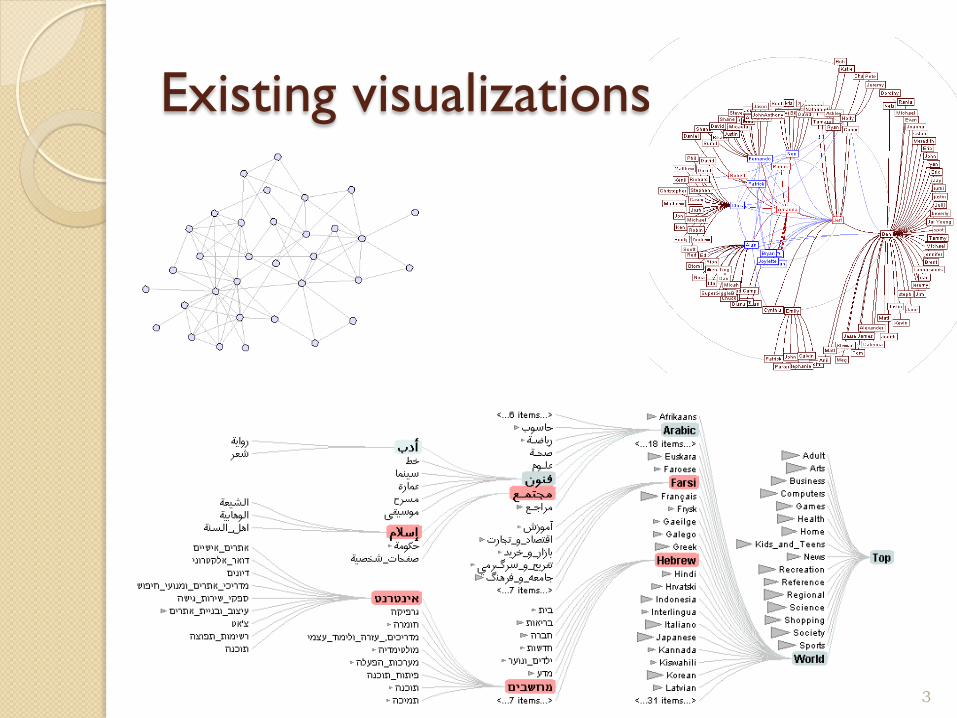
Existing visualizations
3
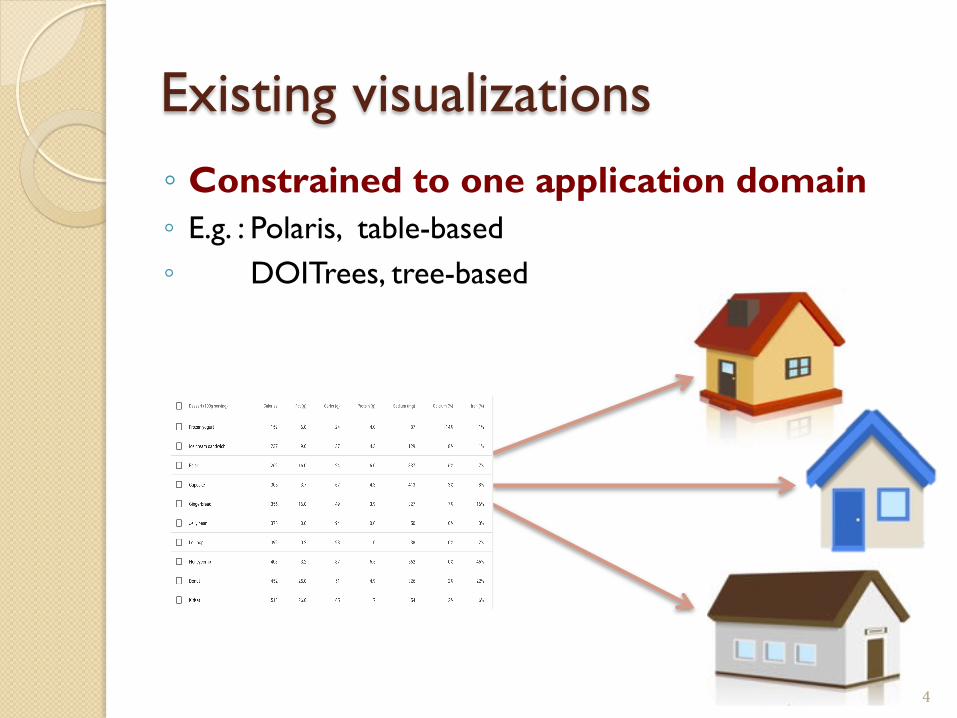
Existing visualizations ◦ Constrained to one application domain ◦ E.g. : Polaris, table-based ◦ DOITrees, tree-based
4
What’s new in Prefuse ?
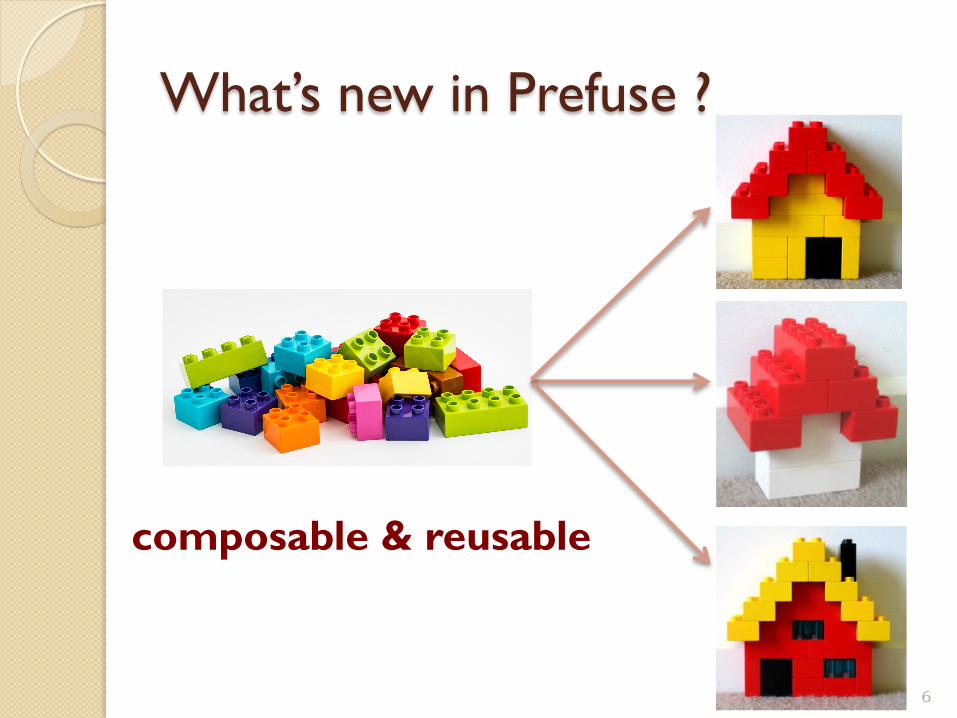
What’s new in Prefuse ?
composable & reusable
6
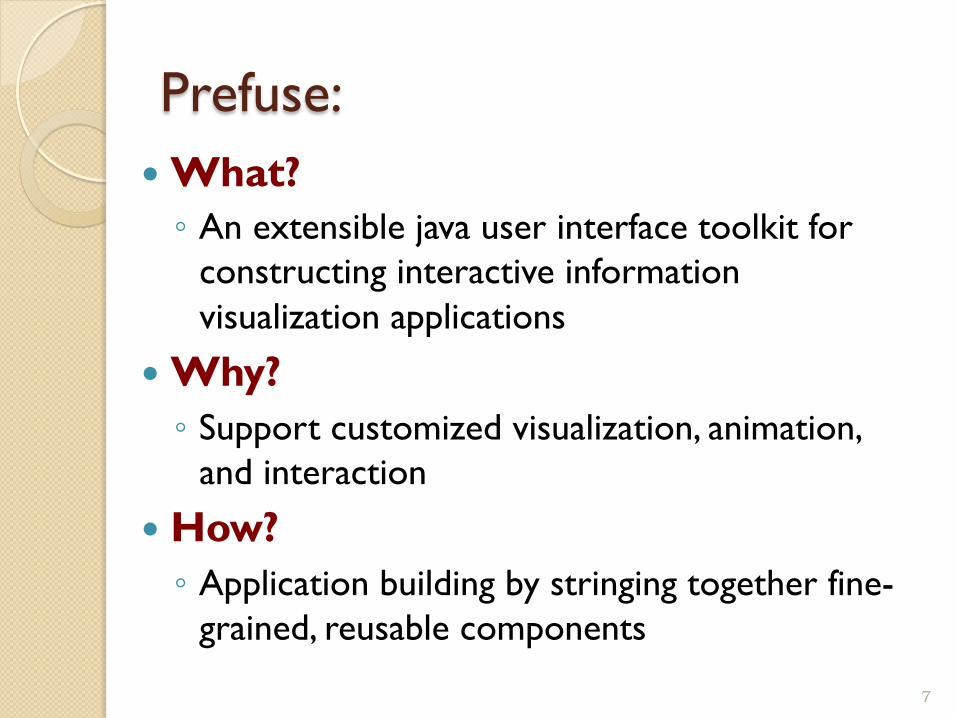
Prefuse: � What? ◦ An extensible java user interface toolkit for
constructing interactive information visualization applications
� Why? ◦ Support customized visualization, animation,
and interaction
� How? ◦ Application building by stringing together fine-
grained, reusable components
7

An example using Prefuse
8
An example using Prefuse
9
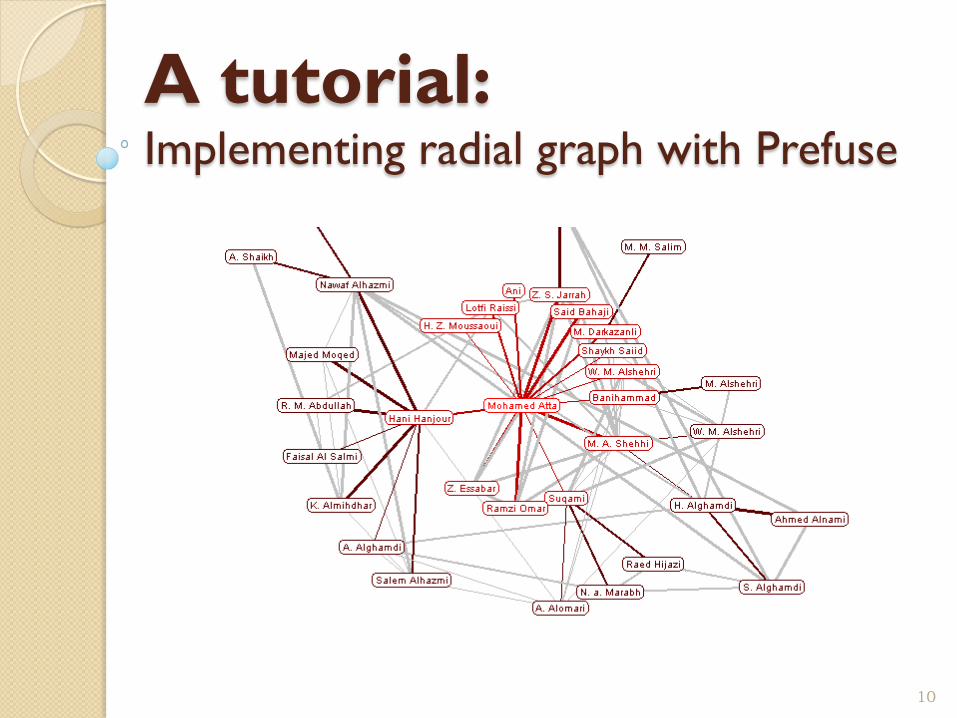
A tutorial: Implementing radial graph with Prefuse
10
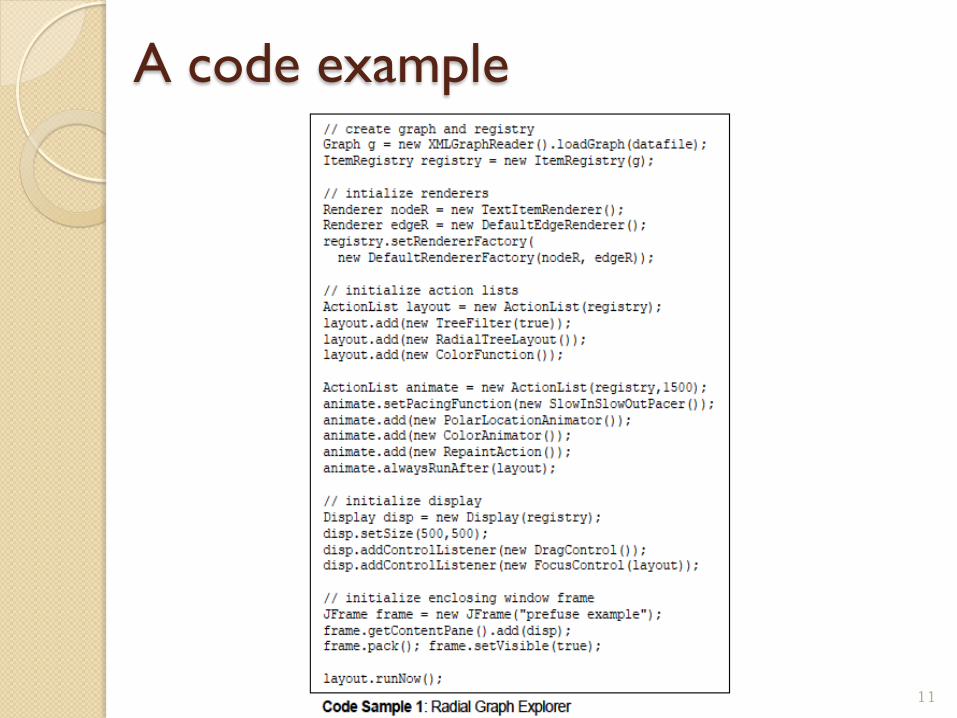
A code example
11
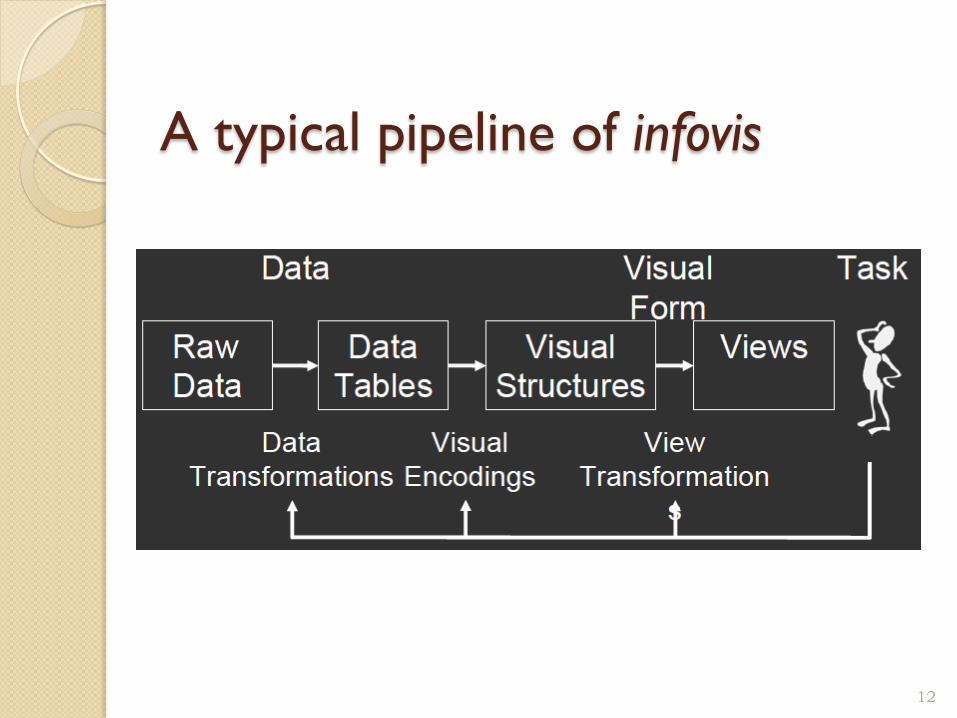
A typical pipeline of infovis
12

Design of Prefuse ◦ Prefuse provides interfaces and default implementations of
data structures for unstructured, graph and tree data ◦ Abstract Data: � Data element: entity with attributes
13

Design of Prefuse � Filtering: ◦ Process of mapping abstract data to a
representation suitable for visualization then generate corresponding visual analogues
14 14

Design of Prefuse ◦ Visual Analogues: � To arrange data and stored in a centralized structure
called ItemRegistry to house a specific visualization
◦ Prefuse provides several VisualItems to visualize different types of entities
15 15

Writing apps – a code sample
• Load data • Initialize ItemRegistry to house
visualization
16

Design of Prefuse � Actions: ◦ Composable modules that update the VisualItems ◦ Mechanism for selecting visualized data and setting
visual properties, performing tasks such as filtering, layout, color assignment and sizing
17

Design of Prefuse � ActionsList: ◦ Configurable runnable Class that sequentially
execute Actions
18

Writing apps – a code sample
• Specify two ActionList: • Filter data to tree structure, apply radial tree layout and
assign colors to nodes. • Add an animation transition for when the focus of the
visualization changes
19
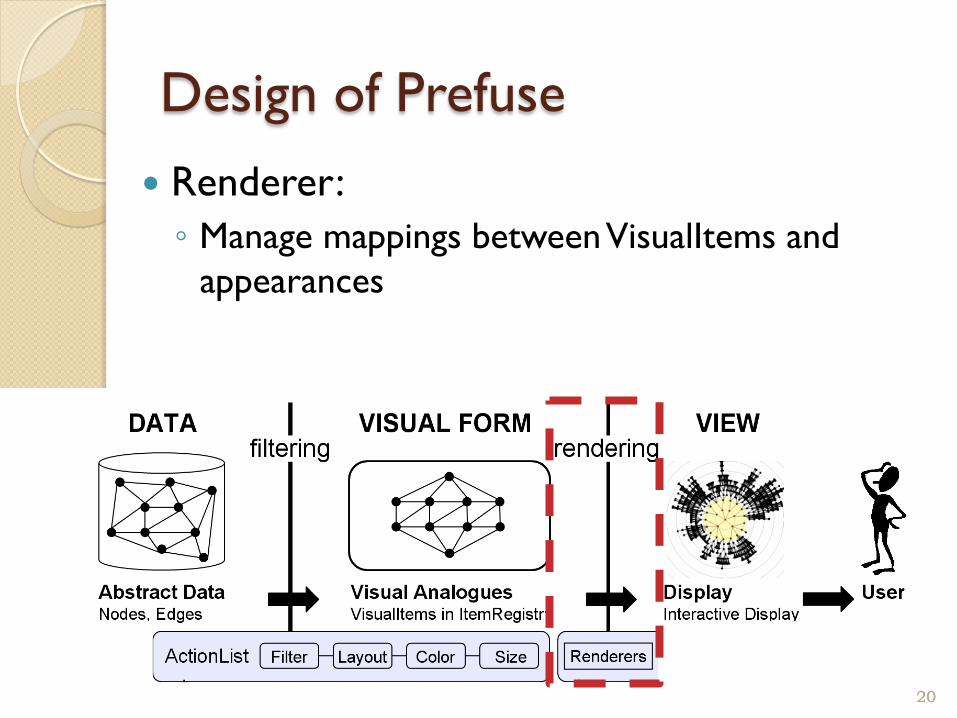
Design of Prefuse � Renderer: ◦ Manage mappings between VisualItems and
appearances
20 20

Writing apps – a code sample
• Initiate renderers • Assign renderers to appropriate items
21

Design of Prefuse � Display: ◦ Perform presentation of visualized data � Apply view transformations � Support interaction with visualized items
22 22

Writing apps – a code sample
• Present visualization: • Enable user to reposition nodes and select new
focus by clicking on a node
23

Radial Graph using Prefuse
24

Evaluations
� Prefuse: ◦ A toolkit consists of composable, reusable units ◦ Enables reuse and composition of visualization
and interaction techniques
Summary
� How?
25

Evaluations
� Prefuse: ◦ A toolkit consists of composable, reusable units ◦ Enables reuse and composition of visualization
and interaction techniques
Summary
� Application coverage � Qualitative usability
26
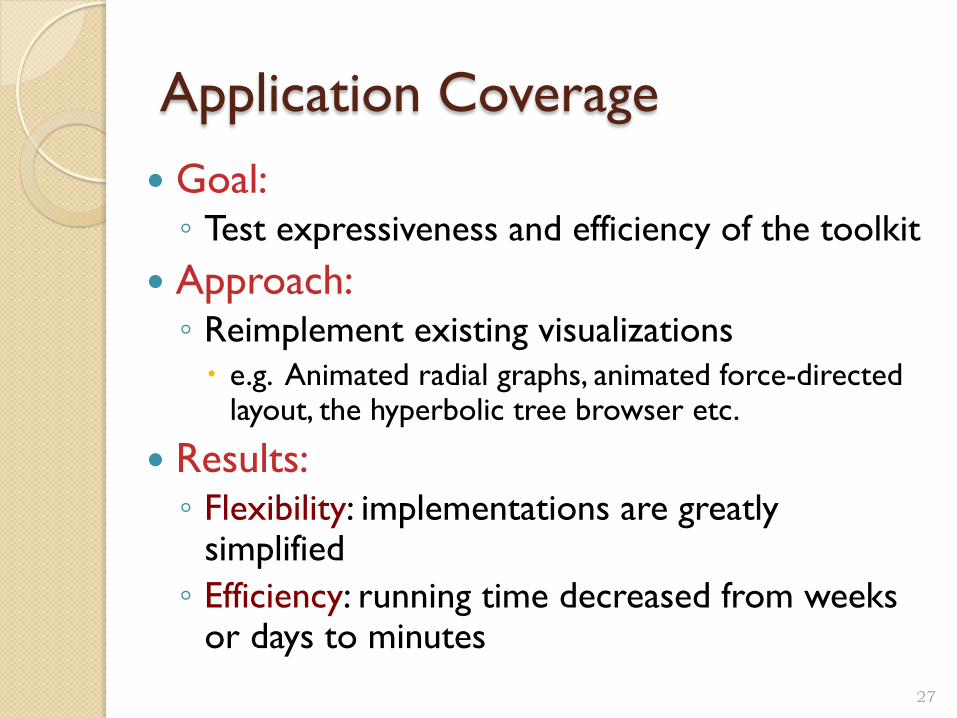
Application Coverage � Goal: ◦ Test expressiveness and efficiency of the toolkit
� Approach: ◦ Reimplement existing visualizations � e.g. Animated radial graphs, animated force-directed
layout, the hyperbolic tree browser etc.
� Results: ◦ Flexibility: implementations are greatly
simplified ◦ Efficiency: running time decreased from weeks
or days to minutes 27

Qualitative Usability Study � Goal: ◦ Understand the learnability and usability of
programming for other programmers � Approach: ◦ Given tutorial, observe 8 programmers of
varying background and expertise � using the toolkit to build applications � interviewing them about experiences
� Results: ◦ Programmers can use the toolkit to quickly
build and tailor the visualizations
28

After Prefuse
29

After Prefuse
30
D3 – Data-Driven Documents � A JavaScript Library � Help visualize data on web browser
31
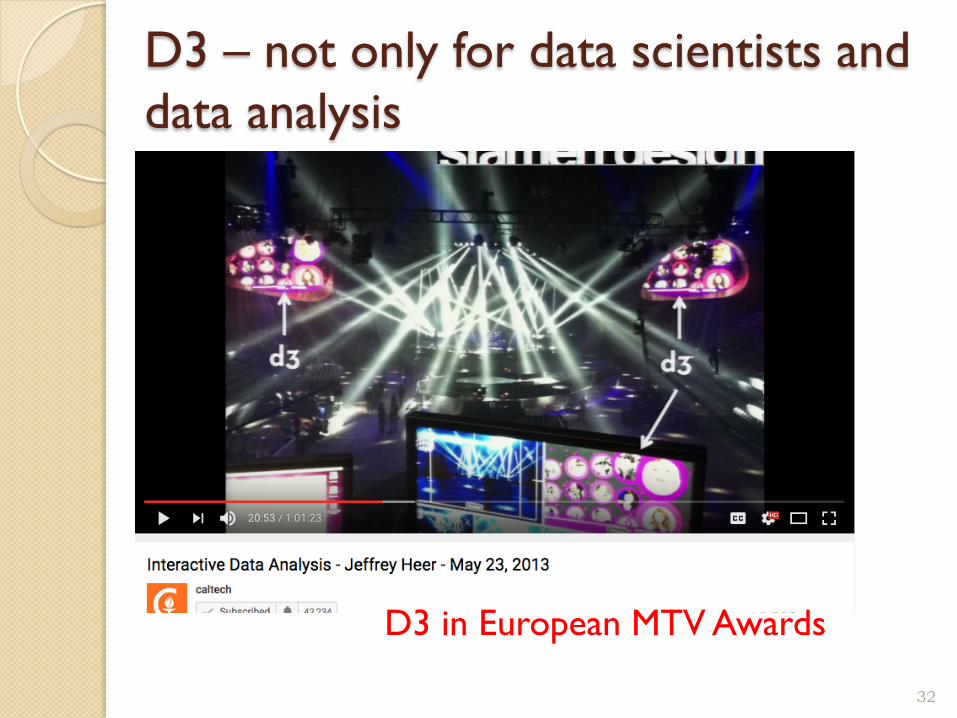
D3 – not only for data scientists and data analysis
D3 in European MTV Awards
32
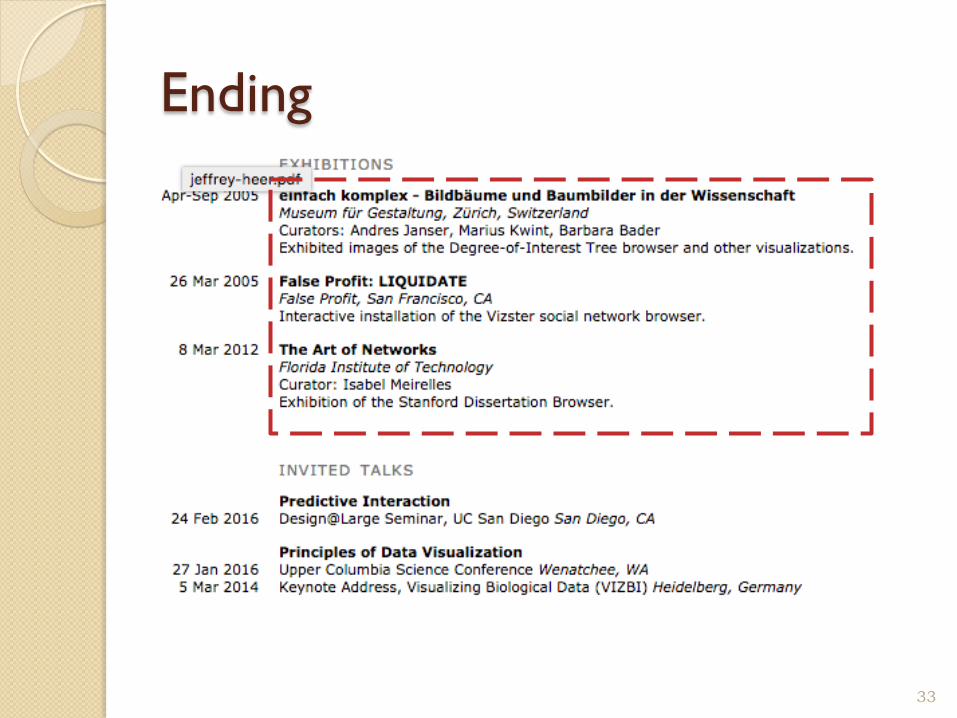
Ending
33
Take away � What is Prefuse and why it ? � How to use it? � How did we evaluate it? � What did you learn from author’s experience ?
34