ptt global chemical public company limitedpttgc.listedcompany.com/misc/mdna/20160216-pttgc... · in...
TRANSCRIPT
PTT Global Chemical Public Company Limited
FY2015 Management Discussion and Analysis
(Translation)

(Translation)
FY2015 Management Discussion and Analysis Page | 1
Executive Summary
In 2015 PTT Global Chemical Public Company Limited (“the Company”) had a net profit of 20,502 MB with earning per share (EPS) of 4.55 baht per share, increased 33% from year 2014 with a net profit 15,372 MB or 3.41 baht per share.
Table 1 : Performance Summary
(Unit: Million Baht) 2014** 2015 YoY
% + /(-) 4Q/2015
Sales Revenue 550,909 400,128 -27% 96,088 EBITDA 34,220 44,740 31% 10,387 EBITDA Margin (%) 6% 11% 5% 11% Net Profit 15,372 20,502 33% 4,690 EPS (Baht/Share) 3.41 4.55 33% 1.04 Adjusted EBITDA* 52,369 50,873 -3% 14,971 Adjusted EBITDA Margin (%) 10% 13% 3% 16%
Note: * Adjusted EBITDA refers EBITDA excluding impact of inventory value (Inventory and NRV) and extraordinary items ** Restated FY2014 Financial Statements from the implementation of new accounting standards (Pack 5) and purchasing PTTPM and PTTPL shares under common control
Under the oil market volatility coupled with region economic uncertainty situations in the year 2015, the Company has managed its production and sales to minimize the impact external factors. This has resulted in 2015 performance to improve. The adjusted EBITDA margin of 2015 increased to 13% from 10% in year 2014. An increase in the operating performance was due from an increase in performance of refinery and aromatics business units. For refinery business unit, the spread between petroleum products and its feedstock improved, especially for the gasoline and fuel oil that has increased due to the demand of the market. For Aromatics business, although the spread between product price and condensate of main aromatics product as paraxylene and benzene decreased, but the spread of aromatics unit by-products which accounts for about 41% increased following petroleum product spread. However, the performance of olefins and derivatives business declined due to a decrease in polyethylene product price. This has resulted in olefins and derivatives units adjusted EBITDA margin to drop to 24% in 2015 from 26% in the previous year.
In 2015 Dubai crude oil price opened at 60 USD/bbl and closed at 35 USD/bbl in December 2015. Although Dubai crude price continued to decrease, but the Company was able to mitigate the impact of stock loss using commodity hedging. This resulted in net impact from stock loss of Baht 957 million (Stock loss of Baht 6,504 million, NRV Gain of Baht 2,902 million and commodity hedging gain of Baht 2,645 million)
Also in 4Q/2015, the Company has recognized an impairment loss of Myriant totaling Baht 2,531 million (or net income of Baht 2,056 million), an impairment of Succinic Acid Plant at Lake Providence, the US as the plant is in the process of the quality of product testing. As a result, the plant cannot utilize its full capacity; therefore, the Company had to recognize the impairment as such.
Table 2 : Adjusted EBITDA Margin
% Adj. EBITDA Margin 2557 2558 4Q/2015
Business Unit :
Refinery 4 8
15 Aromatics 3 9
11
Olefins and Derivative 26 24
22 Green 4 6
11
HVS 5 7
3 Average 10 13
16
45%
15%
30%
3%7%
Sales Revenue
400,128 MB
27%
11%55%
2%4%
1%
Adjusted EBITDA
50,873 MB
47%
18%
26%
3%6%
Sales Revenue
Refinery Aromatics Olefins and Derivative Green HVS Others
(Translation)
FY2015 Management Discussion and Analysis Page | 2
Summary of Core Business Performance
The performance of refinery business unit rose in 2015 from last year. The Adjusted EBITDA increased by 33%, which was mainly due to an increase in some petroleum product spread over crude oil price. The spread of gasoline over Dubai crude oil price in year 2015 increased 28%, and the spread of fuel oil price with Dubai crude oil price increased 40% meanwhile the spread of jet fuel and diesel fuel over Dubai crude oil price dropped 13% and 15% respectively. The Company’s refinery has CDU utilization rate of 100%, slightly decreased from last year. As a result, CDU GRM stood at 5.45 USD/bbl, increased 24% from last year. However, the Company realized stock loss, NRV, and commodity hedging of refinery product and feedstock net to Baht 827 million. (Comprising of stock loss of Baht 4,570 million, NRV gain of Baht 1,352 million and net profit from Commodity Hedging of Baht 2,391 million baht)
In 2015, the performance of aromatics business unit increased from last year. The main reason was due to an increase in spread of by-product over condensate coupled with the decrease in crude oil price which led to lower energy value used in aromatics plants. This has resulted in better performance of aromatics units despite the lower spread of main products price over condensate such as paraxylene and benzene. In 2015, the aromatics plant had a BTX’s utilization rate at 74% dropped from last year and this was due to planned and unplanned shutdown of Aromatics II plant. As a result, the Company reported product to feedstock margin per unit of Aromatics product at 217 USD/ton of BTX, increased 25% from last year. The Company also realized Stock Loss, NRV Gain, and Commodity Hedging Gain of net Baht 468 million. (Comprising of Stock Loss of Baht 1,934 million, NRV Gain of Baht 1,431 million and Baht 35 million profit from Commodity Hedging).
For olefins and derivatives business unit, the performance decreased from previous year. This was due a drop in polyethylene price of approximately 20% when compared to year 2014 which resulted in a drop in olefins and derivatives adjusted EBITDA margin to 24% from 26% in previous year. However, the utilization rate of olefins crackers increased from 91% in 2014 to 94% in 2015.
Change in Accounting Standard
Federation of Accounting Professions has announced five new and revised accounting standards relating to financial reporting (Pack 5) which has been effective since January 1, 2015. In order to comply with new standards, the comparative financial statements for the period of 2014 needed to be restated accordingly.
On June 29, 2015, the Company acquired additional 25% shares of PTT Polymer Marketing Company Limited (PTTPM) from IRPC Public Company Limited (IRPC), which resulted in the increment of shareholding interest in PTTPM from 25% to 50% as well as the change in an investment position from associate to joint venture. In addition, on July 2, 2015, the Company acquired 50% shares in PTT Polymer Logistics Company Limited (PTTPL) from PTT Public Company Limited (PTT), which resulted PTTPL being a joint venture company. These business combinations are under common control transaction, therefore, the Company required to restate previous financial statements for comparison purpose, however, the adjustment does not impact the Company’s net profit.
Summary of events that had significant impact on financial statements in 2015:
On February 16, 2015, the Board of Director passed the resolution to propose the Annual General Meeting of Shareholders to consider and approve the dividend payment for year 2014 of 2.37 Baht/share or 71% of consolidated net profit.
On March 23, 2015, the Board of Director passed the resolution to acquire 25% shares of PTTPM from IRPC. The Company acquired 24% shareholding interest whereas Solution Creation (100% owned subsidiary of the Company) would hold the remaining 1% shareholding interest. After the share acquisition, PTTGC

(Translation)
FY2015 Management Discussion and Analysis Page | 3
group will hold a total of 50% shareholding interest in PTTPM. This transaction is in line with the Company’s restructuring policy in order to create marketing excellency and enhance control effectiveness.
On March 23, 2015, the Board of Director passed the resolution to acquire 50% shares of PTTPL from PTT. The Company acquired 49% shareholding interest whereas Solution Creation (100% owned subsidiary of the Company) would hold the remaining 1% shareholding interest. After the share acquisition, PTTGC group will hold a total of 50% shareholding interest in PTTPL. This transaction is in line with the Company’s restructuring policy for better logistic management and improve capability to manage and control supply chain.
The Company has rescheduled the shutdown of Olefins Plant I-4/1 from previously scheduled in August 2015 to March 29, 2015 to clean up Quench Oil Tower. This would take approximately 21 days shutdown as previousely planned.
On May 18, 2015, the Global Power Synergy Public Company Limited (“GPSC”), in which the Company hold 30.31% shares, has initially listed in the Stock Exchange of Thailand (“SET”) and initial public offering (“IPO”). The Company did not increase stake in GPSC, resulted in the dilution in the Company’s shareholding portion from previously 31.31% to 22.73% and recognized a gain of Baht 432 million in 2015 Statement of Income.
On June 29, 2015, the Board of Director has passed the resolution to approved investment capital expenditure for investment in LLDPE expansion. The LLDPE project consists of the production capacity expansion of LLDPE of 400,000 ton/year and production of hexane-1 (a co-monomer for LLDPE production) of 34,000 ton/year. This project will enhance value to the Company’s ethylene by extend the product chain. This project is expected to complete and start commercial operation in 2018.
On June 29, 2015, the Board of Director has passed the resolution to establish PTTGC America Corporation and PTTGC America LLC in the US to explore Front End Engineering Design (FEED) Study and project investment capital expenditure.
On August 28, 2015, the Company shut down Aromatic 2 plant (with aromatics capacity of 1,070,000 ton/year) to repair compressor motor of reforming unit. To mitigate impact of the shutdown, the Company rescheduled annual maintenance shutdown plan and tie-in of the debottlenecking of Aromatics Complex 2 to the same period.
On August 24, 2015, the Board of Director passed the resolution to approve interim dividend for 1H15, from January 1, 2015 to June 30, 2015 of Baht 1.50 per share or 46% of 1H15 net profit.
On August 24, 2015, the Board of Director passed the resolution to approve share repurchase program for financial management purpose in the maximum amount of Baht 4,500 million and the number of the shares to be repurchased is approximately 2% of the total issued shares. The repurchase period covers the duration of 6 months, starting from September 8, 2015. At the end of 2015, the Company has repurchased 41,431,000 shares or 0.919% of the total issued shares, with total value of Baht 2,104,534,625.
On November 30, 2015, the Company has additional capacity from plant improvement project of ethylene oxide (EO), a feedstock of ethylene glycol (EG), which includes MEG DEG TEG and EO Derivatives, also Ethoxylate. Ethanolamine. Previously, EO originally had a capacity of 336 KTA increased to 426 KTA
In 4Q/2015, the Company has recognized an impairment loss of Myriant totaling Baht 2,531 million (or net income of Baht 2,056 million), an impairment of Succinic Acid Plant at Lake Providence, USA as the plant is in the process of the quality of product testing. As a result, capacity utilization cannot operate at full capacity, therefore, the company had to recognized the impairment as such.

(Translation)
FY2015 Management Discussion and Analysis Page | 4
Market Overview
Petroleum Market Overview
Table 3 : Crude Price & Petroleum Product Spreads
Unit : USD/bbl 2014 2015 YoY
% + /(-) 4Q/2015
Dubai Crude Oil 96.61 50.91 -47% 40.71 Jet-Dubai 15.88 13.88 -13% 14.09 Diesel-Dubai 16.06 13.66 -15% 13.77 Fuel Oil-Dubai -8.30 -5.02 40% -6.55 Gasoline-Dubai 14.31 18.28 28% 18.68
Dubai crude price for 2015 has been continually volatiled from ending of last year at 52.9 USD/bbl to close at 31.8 USD/bbl at the end of 2015. The average Dubai crude price for 2015 stayed at 50.9 USD/bbl, decreased by 45.7 USD/bbl or 47% comparing to last year. This was because crude oil price was pressured by supply surplus from Shale Oil production in the US. Meanwhile, OPEC continued to maintain production at around 30 million barrel/day to keep its market share. In addition, Iran and six world powers concluded nearly ten years of negotiations with a landmark nuclear deal in July 2015. Therefore, market perceived additional capacity from Iran after lifting the sanction. In term of demand, it is still uncertain due to global economic slowdown especially in China.
In 2015, price and spread of petroleum product was fluctuated as a result of sharp drop in crude oil price. This increased the demand for gasoline used in vehicle and therefore spread of gasoline over Dubai crude oil price in 2015 averaged at 18.28 USD/bbl, 3.97 USD/bbl increase from previous year. However, an increase in utilization rate of refineries to serve increased demand for gasoline also increased the production of jet and diesel, while the demand for jet and diesel was still uncertain due to weaken economic put pressure on demand in industrial sector. Hence spread of jet over Dubai crude oil price averaged at 13.88 USD/bbl, decreased 2.00 USD/bbl from previous year and the spread of diesel over Dubai crude oil price averaged at 13.66 USD/bbl, decreased 2.40 USD/bbl from previous year. On the other hand, demand for fuel oil increased in shipping sector as decreasing in fuel oil price boosted demand of fuel oil for floating storage, so the spread of fuel oil over Dubai crude oil price increased 3.30 USD/bbl from previous year to averaged at -5.02 USD/bbl in 2015.

(Translation)
FY2015 Management Discussion and Analysis Page | 5
Aromatics Market Overview Table 4 : Aromatics Product Prices and Spreads over Condensate
Unit: USD/ton 2014 2015 YoY
% + /(-) 4Q/2015
Condensate 836 447 -47% 375 Paraxylene (FECP) 1,236 829 -33% 786 Paraxylene (FECP)-Condensate 400 383 -4% 410 Benzene (Spot Korea) 1,211 685 -43% 606 Benzene (Spot Korea)-Condensate 375 238 -36% 230 Naphtha-Condensate 25 44 74% 69
Paraxylene market has remained in a down cycle since 2014 from large number of new paraxylene capacities pressured palaxylene price to stay at low level. In 2015, spread of paraxylene over condensate averaged at 383 USD/ton, decreased 4% from last year. This year, supply addition for paraxylene was still higher than its demand addition. World supply for paraxylene was 48.8 million ton/year, increased 2.9 million ton/year whereas world demand was 3.9 million ton/year, increased only 1.9 million ton/year. It derived from concerns on global economics especially in China which caused seasonal demand to decline. Moreover, according to uncertainty of crude oil price polyester and PTA players slowdowned their orders. However, there had been factors supporting the price of paraxylene. First, Aromatics plants shutdown during the year caused a tight in paraxylene supply in some period of time such as the shutdown of Dragon Aromatics in China with total capacity of 1.6 million ton/year, the shutdown of FCFC in Taiwan with total capacity of 580,000 ton/year and the shutdown of Jurong Aromatics Corp. in Singapore with total capacity of 800,000 ton/year. Furthuremore, reformate, which is the feedstock for aromatics products, had been use for blending gasoline because of its high demand, helped supporting paraxylene spread over condensate.
In 2015, benzene spread over condensate averaged at 238 USD/ton, decreased 36% from last year. The major reasons were from a decline in crude oil price, China economics slowdown caused demand for downstream products of benzene to decline, and supply surplus in Asia due to the US can produced more benzene and reduced the import from Asia. These reasons pressured benzene spread over condensate to remain low throughout the year.

(Translation)
FY2015 Management Discussion and Analysis Page | 6
Olefins and Derivatives Market Overview
Table 5 : Prices and Spreads of Olefins and Derivatives
Unit : USD/ton 2014 2015 YoY
% + /(-) 4Q/2015
Naphtha (MOPJ) 861 491 -43% 445 Ethylene (SEA) 1,395 1,104 -21% 1,033 HDPE 1,544 1,237 -20% 1,153 HDPE-Naphtha 682 747 9% 708 LLDPE 1,543 1,234 -20% 1,158 LLDEP- Naphtha 681 743 9% 713 LDPE 1,571 1,249 -21% 1,158 LDPE- Naphtha 710 758 7% 713 MEG (ACP) 1,113 948 -15% 837 MEG-0.65 Ethylene 206 230 12% 165
In 2015, overall olefins and derivatives products price declined following crude oil price. Ethylene price averaged at 1,104 USD/ton, decreased 21% from 2014, as a result of declined crude oil price. Another factor came from abnormal ethylene market in 2014 which was extremely tight due to many ethylene producers in Asia including China, Japan, Taiwan, Singapore and Thailand had mojor turnaround and many plants reduced operating rate in 2Q/2015 because of technical problems.
Polyethylene prices in 2015 decreased from previous year following a decline in crude oil price. HDPE price averaged at 1,237 USD/ton, decreased 20%, LLDPE price averaged at 1,234 USD/ton, decreased 20%, LDPE price averaged at 1,249 USD/ton, decreased 21% from previous year. In addition, the effect of Yuan devaluation made manufacturers extremely concern about a decline in China's import. Such devaluation aslso had the impact on Asian currencies to weaken when compared to the US dollar which is the currency used to purchase polymer. As a result, downstream producers were more careful in importing raw materials to reduce the impact of the change in the value of money. They, therefore, leaned their inventory in order to minimize the risk of instability of oil prices as well as the economics. However, spread of HDPE over Naphtha remained strong at 747 USD/ton, increased 9%. This was because Naphtha price sharply dropped by 43% following crude oil price whereas demand for polymer remained stable.
In 2015, demand and supply of MEG market was quite balance. Some major producers had maintenance shutdown so the supply was lower for period of time. Nontheless, due to MEG is the main feedstock for polyester industrial, in which will become main feedstock for textile and PET. Thus, MEG market trend was in the same direction as polyester business that was sluggish because of crude oil price instability and economics weakness. MEG price averaged at 948 USD/ton, decreased 15% from 2014. Yet, ethylene price declined 21%, due to soften crude oil price and tighten ethylene, caused spread of MEG-0.65Ethylene improved.
(Translation)
FY2015 Management Discussion and Analysis Page | 7
Performance Analysis by Business Unit
Refinery Business Unit
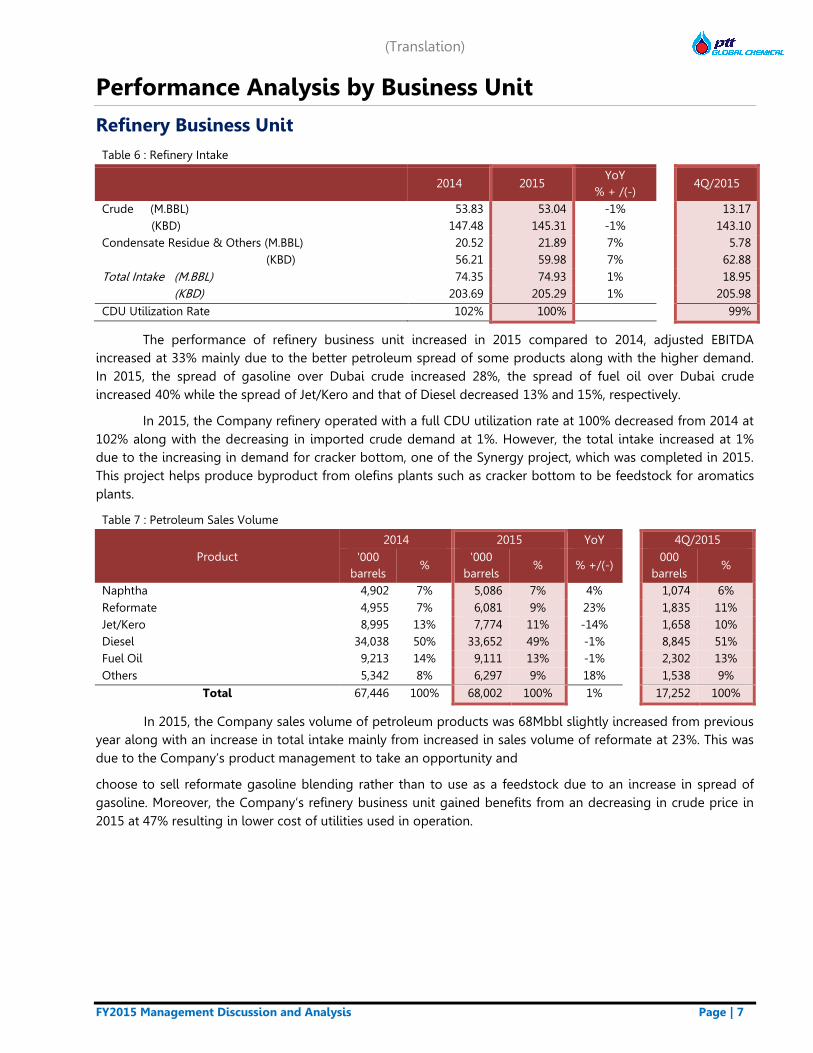
Table 6 : Refinery Intake
2014 2015 YoY
% + /(-) 4Q/2015
Crude (M.BBL) 53.83 53.04 -1% 13.17 (KBD) 147.48 145.31 -1% 143.10 Condensate Residue & Others (M.BBL) 20.52 21.89 7% 5.78 (KBD) 56.21 59.98 7% 62.88 Total Intake (M.BBL) 74.35 74.93 1% 18.95 (KBD) 203.69 205.29 1% 205.98 CDU Utilization Rate 102% 100% 99%
The performance of refinery business unit increased in 2015 compared to 2014, adjusted EBITDA increased at 33% mainly due to the better petroleum spread of some products along with the higher demand. In 2015, the spread of gasoline over Dubai crude increased 28%, the spread of fuel oil over Dubai crude increased 40% while the spread of Jet/Kero and that of Diesel decreased 13% and 15%, respectively.
In 2015, the Company refinery operated with a full CDU utilization rate at 100% decreased from 2014 at 102% along with the decreasing in imported crude demand at 1%. However, the total intake increased at 1% due to the increasing in demand for cracker bottom, one of the Synergy project, which was completed in 2015. This project helps produce byproduct from olefins plants such as cracker bottom to be feedstock for aromatics plants.
Table 7 : Petroleum Sales Volume
Product 2014 2015 YoY 4Q/2015
'000 barrels
% '000
barrels % % +/(-)
000 barrels
%
Naphtha 4,902 7% 5,086 7% 4% 1,074 6% Reformate 4,955 7% 6,081 9% 23% 1,835 11% Jet/Kero 8,995 13% 7,774 11% -14% 1,658 10% Diesel 34,038 50% 33,652 49% -1% 8,845 51% Fuel Oil 9,213 14% 9,111 13% -1% 2,302 13% Others 5,342 8% 6,297 9% 18% 1,538 9%
Total 67,446 100% 68,002 100% 1% 17,252 100%
In 2015, the Company sales volume of petroleum products was 68Mbbl slightly increased from previous year along with an increase in total intake mainly from increased in sales volume of reformate at 23%. This was due to the Company’s product management to take an opportunity and
choose to sell reformate gasoline blending rather than to use as a feedstock due to an increase in spread of gasoline. Moreover, the Company’s refinery business unit gained benefits from an decreasing in crude price in 2015 at 47% resulting in lower cost of utilities used in operation.

(Translation)
FY2015 Management Discussion and Analysis Page | 8
Table 8 : Gross Refinery Margin
Unit: USD/bbl 2014 2015 YoY
% + /(-) 4Q/2015
Market GRM 4.41 5.45 24% 6.23 CDU GRM 5.61 7.13 27% 8.25 CRS GRM 2.77 2.95 7% 3.39 Hedging Gain/(Loss) 0.94 0.93 0% 3.86 Stock Gain/(Loss) Net NRV -3.73 -1.78 52% -2.22
Accounting GRM 0.98 5.13 421% 7.88
In 2015, the Company reported market GRM from CDU (CDU GRM) at 4.41 USD/bbl, increased 27% from 2014 at 4.41 USD/bbl. In 2015, the Company realized stock loss of Baht 4,570 million or -1.78 USD/bbl from a decreasing in crude oil price from 60 USD/bbl in the beginning of the year to 35 USD/bbl in the end of the year. At the end of 2015, product price did not significantly decrease so the Company did not have to revalue the ending inventory.
However, there was the reversal of NRV Loss last year, therefore, the Company reported net NRV Gain of Baht 1,352 million or 0.53 USD/bbl. In 2015, the Company had gain from commodity hedging of Baht 2,391 million or 0.93 USD/bbl mainly from inventory hedging. The accounting GRM in 2015 concluded at 5.13 USD/bbl, 4.1 USD/bbl increased from 2014 acccounting GRM at0.98 USD/bbl.
Aromatics Business Unit Table 9 : Aromatics Intake and Production
2014 2015 YoY
% + /(-) 4Q/2015
Condensate ('000 tons) 4,666 4,697 1% 1,260 Others ('000 tons) 936 517 -45% 102 Total Intake ('000 tons) 5,602 5,214 -7% 1,362 BTX Production ('000 tons) 1,892 1,720 -9% 386 BTX Utilization Rate 81% 74% 66%
* Aromatics capacity 2.259 Mton/year
The performance of aromatics business unit in 2015 increased comparing to previous year due to an increase in spread of naphtha over condensate at 74%. Even spread of paraxylene over condensate and spread of benzene over condensate decreased 4% and 36%, respectively from previous year. The company gained benefits from lower utilities cost due to a decrease in crude oil price at 47%.
In 2015,BTX utilization rate averaged at 74% decreased from 81% due to maintenance shutdown plan and unplanned shutdown of Aromatic II plant since July 28, 2015 for 75 days to fix compressor motor at platforming unit. In order to maximize benefits from plants shutdown, the Company rescheduled maintenance shutdown plan and debottlenecking project of Aromatics II plant to the same period. In 2015, the toal intake decreased 7% due to the Company’s product management to take an opportunity and choose to sell reformate gasoline blending rather than to use as aromatics feedstock resulting in less reformate gasoline as feedstock for aromatics.

(Translation)
FY2015 Management Discussion and Analysis Page | 9
Table 10 : Aromatics Sales Volume
Product 2014 2015 YoY 4Q/2015
'000 tons
% '000 tons
% % +/(-) '000 tons
%
Benzene (BZ) 552 17% 493 17% -11% 115 14% Cyclohexane 162 5% 157 5% -4% 38 5% Paraxylene (PX) 1,092 34% 1,003 34% -8% 218 27% Other BTX Products 53 2% 60 2% 12% 15 2%
Total BTX Products 1,860 59% 1,712 59% -8% 386 49% Naphtha and Raffinate 945 30% 898 31% -5% 278 35% Other By-Products 351 11% 310 11% -12% 132 17%
Total 3,176 100% 2,920 100% -8% 795 100%
BTX sales volume in 2015 decreased 8% comparing to previous year following a reduction in capacity. The Company sales volume of reformate at 38,908 ton or 5% of total aromatics products and byproducts to capture the favorable market condition.
Table 11 : Aromatics market P2F
Unit: USD/ton 2014 2015 YoY
% + /(-) 4Q/2015
Market P2F 174 217 25% 251 NRV -23.6 24.4 N/A 10.7 Hedging Gain/(Loss) -0.1 0.6 N/A 2.5 Stock Gain/(Loss) -62.3 -33.0 N/A -38.5 Accounting P2F 88 209 137% 226
Resulting from product spreads and production factors in 2015, the Company reported P2F margin 217 USD/ton, increased 25% or 174 USD/ton from previous year. Aromatics business unit reported a stock loss in 2015 of Baht 1,934 million or -32.97 USD/ton while reversal of NRV Loss last year of Baht 1,431 million or 24.40 USD/ton resulting in an increase in accounting P2F at 209 USD/ton BTX comparing to previous year at 88 USD/ton BTX.
Olefins and Olefins Derivative Business Unit Table 12 : Adjusted EBITDA of Olefins and Derivatives
(Unit: Million Baht) 2014 2015 YoY
% + /(-) 4Q/2015
Adj. EBITDA 34,910 28,032 -20% 6,829 Adj. EBITDA Margin 26% 24% -7% 22%
Table 13 : Sales volume and utilization rate of Olefins and Derivatives
2014 2015 YoY 4Q/2015
Sales
Volume '000 tons
Utilization Rate
Sales Volume
'000 tons
Utilization Rate
% + /(-) Sales
Volume '000 tons
Utilization Rate
Olefins * 708 91% 760 94% 7% 203 97%
HDPE 873 107% 868 108% -1% 233 115% LLDPE 407 100% 365 91% -10% 89 79% LDPE 323 105% 333 111% 3% 90 104%
Total PE 1,603 105% 1,566 104% -2% 411 103% MEG 382 95% 420 96% 10% 130 117%

(Translation)
FY2015 Management Discussion and Analysis Page | 10
Note: * Sales Volume of Olefins is external volume.
The performance of Olefins and Olefins derivatives declined in 2015 following a decline in crude oil price and polyethylene price decreased by 20% from previous year. The utilization rate of olefins plants averaged at 94% increased from previous year at 91%.
Performance: HDPE
Overall HDPE performance in 2015 declined comparing to 2014. HDPE sales revenue decreased 15% from previous year due to a decrease in HDPE price at 20%. In 2015, the total utilization rate of all 3 HDPE plants averaged at 108%, increased from 2014 at 107% while the sales volume decreased due to a boosting sales at year end 2014 when crude oil price decreased dramatically.
Performance: LLDPE
Overall LLDPE performance in 2015 declined comparing to 2014. LLDPE price decreased in accordance with the crude oil price. In 2015, LLDPE price averaged at 1,234 USD/ton decreased 20% from previous year. The utilization rate of LLDPE plant averaged at 91% in 2015 decreased from that of 2014 at 100%. LLDPE sales volume in 2015 decreased 10% from previous year due to 35 days unplanned shutdown in 2Q/2015 and 16 days shutdown plan in 4Q/2015.
Performance: LDPE
Overall LDPE performance in 2015 declinced comparing to 2014. Sales revenue of LDPE decreased 13% from previous year. LDPE price averaged at 1,249 USD/ton decreased 21% from previous year. The utilization rate of LDPE plant averaged at 111% increased from previous year at 105% while sales volume increased 3%.
Ethylene Oxide Business Unit
The performance of ethylene oxide business unit in 2015 declined comparing to 2014 even the spread of products increased due to the expansion in Ethylene Oxide (EO) plant resulting in increasing in sales volume in 4Q/2015 while the spread of product, feedstock price decreased in accordance with the crude oil price. The utilization rate of MEG plant in 2015 averaged at 96% slightly increased from previous year at 95%.
In 4Q/2015, the Company had Ethylene Oxide (EO) plant improvement, EO capacity from 336 Kton/year to 426 Kton/year and MEG capacity from 395 Kton/year to 425 Kton/year.

(Translation)
FY2015 Management Discussion and Analysis Page | 11
Operating Performance
Note: * Adjusted EBITDA refers to EBITDA excluding impact of inventory value ( excludes Inventory gain/ ( loss) and NRV) and extraordinary items
** Restated FY2014 Financial Statements from the implementation of new accounting standards (Pack 5) and purchasing PTTPM and PTTPL shares under common control
2014** 2015 YoY 4Q/2015
MB % MB % MB % MB %
Sales Revenue 550,909 100 400,128 100 (150,781) (27)
96,088 100
Feedstock Cost (449,497) (82) (304,672) (76) (144,825) (32)
(71,547) (74)
Product to Feed Margin 101,412 18 95,456 24 (5,956) (6)
24,541 26
1 Variable Cost (28,433) (5) (25,752) (6) (2,681) (9)
(6,585) (7)
2 Fixed Cost (16,389) (3) (16,143) (4) (246) (2)
(4,652) (5)
3 Stock Gain/(Loss) & NRV (15,910) (3) (3,602) (1) 12,308 77
(2,053) (2)
4 Gain/(Loss) Commodity Hedging 2,249 0 2,645 1 396 18
2,853 3
5 Other Income 4,353 1 5,023 1 670 15
1,847 2
6 SG&A (10,823) (2) (10,356) (3) (467) (4)
(3,033) (3)
7 Extra Item:
Provision for business restructuring (2,239) (0) 0 0 (2,239) N/A
0 0
Impairment loss
0 0 (2,531) (1) 2,531 N/A
(2,531) (3)
EBITDA 34,220 6 44,740 11 10,520 31
10,387 11
Depreciation & Amortization
(15,890) (3) (16,382) (4) 492 3
(4,209) (4)
EBIT 18,330 3 28,358 7 10,028 55
6,178 6
8 Finance Cost (4,452) (1) (3,967) (1) (485) (11)
(937) (1)
9 FX Gain/(Loss) 618 0 (2,338) (1) (2,956) (478)
510 1
10 Shares of profit/(loss) from investments 177 0 711 0 534 302
(210) (0)
11 Income Tax Expense (581) (0) (1,984) (0) 1,403 241
(769) (1)
Net Profit 14,092 3 20,780 5 6,688 47
4,772 5
Profit/(loss) attributable to:
Owners of the Company 15,372 3 20,502 5 5,130 33
4,690 5
Non-controlling interests (1,280) (0) 278 0 1,558 122
82 0
Adjusted EBITDA* 52,369 10 50,873 13 (1,496) (3)
14,971 16

(Translation)
FY2015 Management Discussion and Analysis Page | 12
Performance Comparison
(1) Variable Cost
Variable cost decreased by Baht 2,681 million or 9% from last year. Even depreciation of Baht caused variable cost per unit to increase but fuel gas price declined following crude oil price, therefore overall variable cost per unit declined. Moreover, for refinery business, LPG and fuel oil had been more internally used as fuel instead of buying natural gas externally to optimize benefit resulting in a decline in variable cost per unit.
(2) Fixed Cost
Fixed cost decreased by Baht 246 million or 2% from FY2014 which was insignificant change.
(3) Stock Gain/(Loss) and NRV
In 2015, the Company reported Stock Loss of Baht 6,504 million and NRV Gain of Baht 2,902 million, whereas in 2014, there was Stock Loss of 12,835 million and NRV Loss of Baht 3,075 million.
Stock Loss in 2015 of Baht 6,504 million came from Refinery business by Baht 4,570 million and from Aromatics business by Baht 1,934 million. This was resulted from a decline in crude oil price from 60 USD/bbl at the beginning of the year to 35 USD/bbl in December 2558. At the end of 2015, product price did not significantly decrease so the Company did not have to revalue the ending inventory. However, there was the reversal of NRV Loss last year, therefore, the Company reported net NRV Gain for the whole year.
(4) Gain/(Loss) Commodity Hedging
In order to manage risk, the Company has done Crack Spread Hedging, Fuel Loss Hedging, Polyethylene Spread Hedging and Inventory Hedging to hedge the margin and ending inventory value to the targeted level. In 2015, the Company reported gain from Commodity Hedging of Baht 2,645 million which mainly came from Inventory Hedging for Refinery business. The hedging value was 19 USD/bbl higher than the actual value settlement, with the volume of 4.3 million barrels.
(5) Other Income
Other income increased by Baht 670 million or 15% from last year, which mainly came from profit generated from the decrement in investment in GPSC after IPO from 30.31% to 22.73%. The Company recorded profit of GPSC IPO at Baht 432 million in 2Q/2015.
(6) SG&A
Selling, General & Administrative Expense (SG&A) decreased by Baht 467 million or 4% from last year which was insignificant change.
(7) Extraordinary Item
In 2015, the Company realized impairment loss of Succinic Acid production palnt of Myriant at Lake Providence, the US totaling to Baht 2,531 million (or Baht 2,056 million after tax deduction). This comprised asset impairment of Baht 2,151 and goodwill impairment of Baht 380 million. Due to the product is under quality test, this plant cannot operate at full capacity, therefore, the Company had to realize such impairment loss.
(8) Finance Cost
Fiancne cost decreased by Baht 485 million or 11% from last year. This came from the increment in interest income totaling to Baht 215 million and the increment in interest expense totaling to Baht 270 million. Inetrest expense increased as this year the Company invested more in short term investment. On the other hand, interest expense decreased due to the repayment of USD 300 million-debenture in June 2015.
(9) Gain/(Loss) from Foreign Exchange

(Translation)
FY2015 Management Discussion and Analysis Page | 13
In 2015, the Company reported a loss from foreign exchange of Baht 2,338 million, compairing to gain from foreign exchange of Baht 618 million in 2014. Loss this year mainly resulted from revalue of foreign currencies loan. At the end the year, the Company had loan in foreign currencies of USD 1,100 million. Depreciation of Baht by 3.14 Baht/USD or 9% caused the Company to realized loss from foreign currencies (based on average sales BOT, end of 2015 at 35.26 Baht/USD against end of 2014 at 33.11 Baht/USD). However, according to hedging policy, the Company had done forward contact to minimize the impact of Baht depreciation. In addition, weaken of Baht also caused sales revenue to increase.
(10) Share of Profit/(Loss) from investment
In 2015, the Company realized a total share of profit from investments of Baht 711 million, increased by Baht 534 million from last year. This was mainly resulted from increment in profit of Emery due to its expense control policy. Moreover, Emery realized gain from selling its factory at Dusseldolf, Germany according to the Company’s strategy to focus on Specialty Oleochemicals.
(11) Income Tax
In 2015, the Company recognized income tax expense totaling at Baht 1,984 million, increased by Baht 1,403 million from last year. This was resulted from an increase in overall performance in 2015.

(Translation)
FY2015 Management Discussion and Analysis Page | 14
Statement of Financial Position
Asset
As of December 31, 2015, the Company had total asset of Baht 377,545 million, decreased by Baht 3,898 million or 1% from December 31, 2014 which came from a decrease in current asset of Baht 5,230 million, while there was an increase non-current asset of Baht 1,332 million.
1) Current asset decreased by Baht 5,230 million or 4% mainly due to the following reasons
Cash and cash equivalents and current investments increased by Baht 1,953 million or 4% which was mainly due to cash received from operation of Baht 50,822 million, net cash received from long term loan of Baht 3,635 million and cash received from interest income and dividend received of Baht 1,716 million. However, there was cash used in purchasing assets and investment activities totaling of Baht 20,309 million, repayment of debenture of Baht 14,643 million and payment of dividend and interest of Baht 17,132 million, and cash received from share buy back of Baht 2,105 million.
Accounts receivable decreased by Baht 6,358 million or 17%, mainly due to a decrement in product prices when compare with last year. However, sales volume did not significantly change from last year.
2014 (day)
2015 (day)
+/(-) (day)
AR Turnover 30 30 -
AR Turnover for 2015 averaged at 30 days, same as 2014. In addition, AR Turnover of all business units
was not significantly different from last year.
Inventory decreased by Baht 1,647 million or 5%. At the end of last year when crude oil price sharply dropped, the Company had policy to manage inventory level to minimize loss from NRV, thus, inventory at the end of 2014 was lower than normal level. Eventhough inventory level increased from last year, decrease in feedstock and product cost caused ending inventory to decline.
2014 (day)
2015 (day)
+/(-) (day)
Inventory Turnover 18 20 2
Inventory Turnover for 2015 averaged at 20 days, increased from the end of year 2014 by 2 days. This was primarily due to the minimization of inventory level policy at the end of 2014. Therefore, during the
Decemebr 31, 2014 381 Billion Baht
December 31, 2015 394 Billion Baht
Unit: Billion Baht Cash/ Cash equivalent/ Short term investment
Current Asset
PP&E
Non-current Asset
Other Liability
Interest Bearing Debt
Shareholder’s Equity

(Translation)
FY2015 Management Discussion and Analysis Page | 15
end of last year the Company tried to decrease purchasing volume and increase sales volume which caused ending inventory and inventory turnover in 2014 to stay in a low level.
Other current assets increased by Baht 822 million or 11% mainly due to the following reasons
o Other receivable increased by Baht 1,191 million which significantly included the increasing in receivables from commodity hedging of Baht 1,670 million. Nevertheless, prepaid income taxes decreased by Baht 624 million. This was due to performance of 2H14 sharply dropped which made income tax payment at first half higher than yearly income tax and therefore the Company reported prepaid income tax at year end. Yet, this year did not occur such an event.
o Receivables from oil fund decreased by Baht 399 million because of a reduction in compensation rate of LPG Fund from 7.71 Baht/kilogram to 1 Baht/kilogram.
2) Non-current asset increased by Baht 3,541 million or 1% which was mainly due to
Property, plant and equipment increased by Baht 868 million or 0.4%. This was from an increase in assets cost and assets under construction by Baht 17,771 million. The increment in assets cost was mainly from complted and on-going projects such as Phenol II, TOCGC plant improvement, and Aromatics II debottlenecking project. Moreover, there was as increase in plant turnaround recognized as asset during the period. However, PPE decreased during the period from depreciation and assets disposal of Baht 14,454 million and Baht 292 million, respectively. Additionally, there had been impairment of Myriant’s Succinid Acid factory by Baht 2,151 million.
Other non-current asset increased by Baht 464 million or 1% mainly from an increase in investment in the associates and joint ventures by Baht 315 million which was caused by gain recognized from a reduction in GPSC’s investment portion and share of profit from investment during 2015. Moreover, intangible asset increased by Baht 737 million mainly from license for Phenol II and TOCGC plant improvement projects. However, in 2015, the Company impaired the goodwill of Myriant’s Succinid Acid factory by Baht 380 million.
Liability
As of December 31, 2015, the Company had total liability of Baht 143,280 million, decreased by 9,713 million or 6% from December 31, 2014 which was resulted from decreasing in current liability by Baht 14,898 million whereas non-current liability increased by Baht 5,185 million.
1) Current liability decreased by Baht 14,898 million or 27% from the following reasons
Bank overdraft and short-term loans from financial institutions decreased by Baht 186 million or 24%. This was mainly due to Vencorex decreased the amount of AR factoring sold to financial institutions as Vencorex had better performance and better cash flow as a result of less working capital needed from the reduction in product and raw material price.
Accounts payable decreased by Baht 2,029 million or 9%. Even purchase volume declined at year end 2014 according to inventory control during crude oil price volatility, significant drop in feedstock price caused accounts payable to decline.
Other accounts payable decreased by Baht 360 million or 4%. The main reason was due to a decrease in accrued expenses for the Aromatics II Debottlenecking and HDI Derivatives projects that almost complete.
Payables to contractors decreased by Baht 319 million or 13% from payment during the period according to time schedule.

(Translation)
FY2015 Management Discussion and Analysis Page | 16
Current portion of long term loan decreased by Baht 13,410 million or 59% due mainly to a repayment of debenture by USD 300 million in June 2015, repayment of Baht bond by Baht 4,500 million in October and December 2015 and loan repayment of Baht 7,500 million. However, there was the reclassification of long term loan and long term debenture to current portion around Baht 8,400 million.
Corpoorate income tax payable increased by Baht 575 million or 846% due to the recognition of income tax for the second half of 2015 as a result of the improvement performance. While in 2014, income tax of the first half of the year was higher than full year actual income tax so there is no corporate income tax payable.
Other current liability increased by Baht 831 million or 264% due mainly to the classification of liabilities originally recorded as other liability as it will be paid within the year 2016. This included liability from the amount expected to be paid for 34% increment in Vencorex shares (holding stake increased from 51% to 85%) and reserve expense for Vencorex’s restructuring, etc.
2) Non-current liability increased by Baht 5,185 million or 5% which was mainly due to
Long-term loan increased by Baht 6,301 million or 7% due to the additional loan drawn down during the period totaling to Baht 11,590 million. Moreover, value of USD debenture increased by 3,141 million as a result of Baht depreciation. However, there had been the reclassification of long term loan and long term debenture to current portion totaling to Baht 8,400 million.
Deferred tax liability (net with deferred tax asset) decreased by Baht 336 million or 13%. This was mainly due from the impairment of Myriant’s asset so that deferred tax liability of such asset needed to cancel out accordingly.
Other liability decreased by Baht 910 million or 49% as a result of the reclassification to other current liability as mentioned above.
Shareholder’s Equity
As of December 31, 2015, the Company reported total shareholders’ of Baht 234,265 million, increased by Baht 5,815 million or 3% from December 31, 2014. This included an increased in the Company’s portion of Baht 6,793 million, a decrease in former shareholder before business restructuring portion of Baht 1,513 million, and an increase in non-controlling interest portion of Baht 535 million.
The Company’s portion increased by Baht 6,793 million or 3% from the Company’s net profit of Baht 20,502 million. On the other hand, the Company’s portion decreased from 1) dividend payment of Baht 11,270 million 2) share buy back in 2015 presented as negative in equity of Baht 2,105 million 3) increment in investment in Myriant during the period resulted in additional recognition of net loss by Baht 480 million (including loss carried forword of Baht 485 million and loss from translation of Baht 5 million).
Former shareholder before business restructuring arose from the purchasing of PTTPM’s shares from IRPC which made the Company’s sharing interest in PTTPM increased from 25% to 50% and the purchasing of 50% PTTPL’s shares from PTT. These transactions were accounted for business combination under common control, thus, the comparing financial statements needed to be restated as if they were bought from the beginning. As a result, former shareholder before business restructuring portion of Baht 1,513 million was adjusted to present in 2014 financial statements.
Non-controlling interest’s portion increased by Baht 535 million or 25% from the profit recognized during the year of Baht 173 million and a recognition of an increase in non-controlling interest portion of Vencorex by Baht 374 million, and increase in non-controlling interest portion of Myraint by Baht 481 million. In addition, there was gain from translation of Baht 2 million, while, there was dividend payment of Baht 495 million.

(Translation)
FY2015 Management Discussion and Analysis Page | 17
Statement of Cash Flows
For statement of cash flows for the year ended December 31, 2015, the Company had net cash from operating activities of Baht 50,822 million, net cash used in investment activities of Baht 22,344 million which was mainly from investment in on-going projects such as Phenol II, TOCGC plant improvement and Aromatics II Debottlenecking project, etc. In addition, the Company had net cash paid from financing activities of Baht 30,028 million from loan repayment, debenture repayment, interest paid, treasury stock project, and dividend paid. Adding up together with beginning cash and cash equivalents and the effect of exchange rate changes on balances held in foreign currencies of Baht 13,033 million, the Company had cash and cash equivalents at the end of 2015 of Baht 11,483 million. Including current investments, the Company reported cash and cash equivalents and current investments totaling to Baht 47,741 million.

(Translation)
FY2015 Management Discussion and Analysis Page | 18
Key Financial Ratio
Financial Ratios 2014 2015
Current Ratio (Times) 2.19 2.86
EBITDA to sales revenue (%) 6.21% 11.18%
Net Profits to sales revenues (%) 2.79% 5.12%
Return on total assets (%) 5.09% 7.36%
Return on equity (%) 6.86% 8.99%
Interest Bearing Debt to equity (Times) 0.50 0.45
Net interest bearing debt to equity (Times) 0.29 0.25
Net interest bearing debt to EBITDA (Times) 1.97 1.30
Note:
Current ratio = Current assets divided by current liabilities
EBITDA to sales revenue = EBITDA divided by sales revenue
Net profit on sale revenue = Net profit divided by sales revenue
Return on total assets = Net profit divided by average total assets
Return on equity = Net profit divided by average total shareholder’s equity
Interest Bearing Debt to Shareholders’ Equity
= Interest Bearing Debt divided by shareholder’s equity
Net Interest Bearing Debt to Shareholders’ Equity
= Interest Bearing Debt net from cash and cash equivalent and current investments divided by shareholder’s equity
Net Interest Bearing Debt to EBITDA = Interest Bearing Debt net from cash and cash equivalent and current investments divided by EBITDA