pulse sensor - amazon web...
TRANSCRIPT


姓名標示 — 非商業性 — 相同方式分享
CC (Creative Commons)
姓名標示 — 你必須給予 適當表彰、提供指向本授權條款的連結,以及 指出(本作品的原始版本)是否已被變更。你可以任何合理方式為前述表彰,但不得以任何方式暗示授權人為你或你的使用方式背書。
非商業性 — 你不得將本素材進行商業目的之使用。
相同方式分享 — 若你重混、轉換本素材,或依本素材建立新素材,你必須依本素材的授權條款來散布你的貢獻物。

3
● Raspberry Pi官方經銷商
about 台灣樹莓派
http://farnell.com/raspberrypi-consumer/approved-retailers.php?region=apac&MER=MER-LM-OB-RPICC-76315

● 專注於 Raspberry Pi 應用與推廣
● 舉辦社群聚會 / 工作坊 / 讀書會 /黑客松
● Website :● https://www.raspberrypi.com.tw/
● Facebook : ● 搜尋 RaspberryPi.Taiwan● https://www.facebook.com/RaspberryPi.Taiwan
about 台灣樹莓派

5
● COSCUP, MakerConf, PyCon講者
● 投影片
● http://www.slideshare.net/raspberrypi-tw/presentations
● 程式碼
● https://github.com/raspberrypi-tw
分享 x 社群

6
http://en.wikipedia.org/wiki/Internet_of_Things

● Chemical(化學訊號 )● Neurotransmitters(神經傳遞物質 )● Hormones(賀爾蒙)● Intracellular signal transmitters● Specific receptor binding(特定的受器結合 )
● Electrical(電訊號 )● Nerve and muscle cells(神經與肌肉 )
● Mechanical (機械訊號 )● Mechanomyogram(MMG)
Bio-Signal ( 生理訊號 )
http://cc.ee.ntu.edu.tw/~ultrasound/belab/course_files/01_bio_signal_biopac/Exp1%20105-2_print.pdf

● 心電圖 (ECG, Electrocardiography)● 腦波圖 (EEG, Electroencephalography)● 肌電圖 (EMG, Electromyography)● 胃腸電圖 (EGG, Electrogastrogram)● 視網膜電圖 (ERG, Electroretinogram)● 眼電圖 (EOG, Electrooculography)
常見生理電訊號 (BioElectrical Signals)
http://cc.ee.ntu.edu.tw/~ultrasound/belab/course_files/01_bio_signal_biopac/Exp1%20105-2_print.pdf
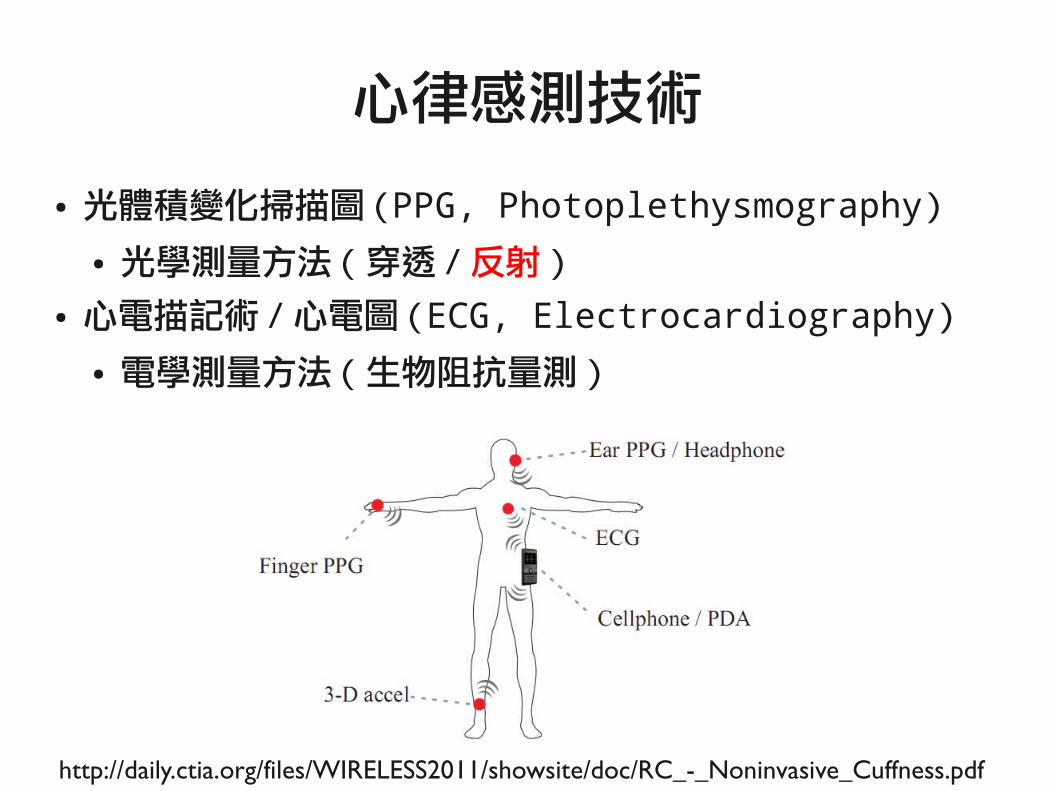
● 光體積變化掃描圖(PPG, Photoplethysmography)● 光學測量方法(穿透/反射)
● 心電描記術/心電圖(ECG, Electrocardiography)● 電學測量方法(生物阻抗量測)
心律感測技術
http://daily.ctia.org/files/WIRELESS2011/showsite/doc/RC_-_Noninvasive_Cuffness.pdf
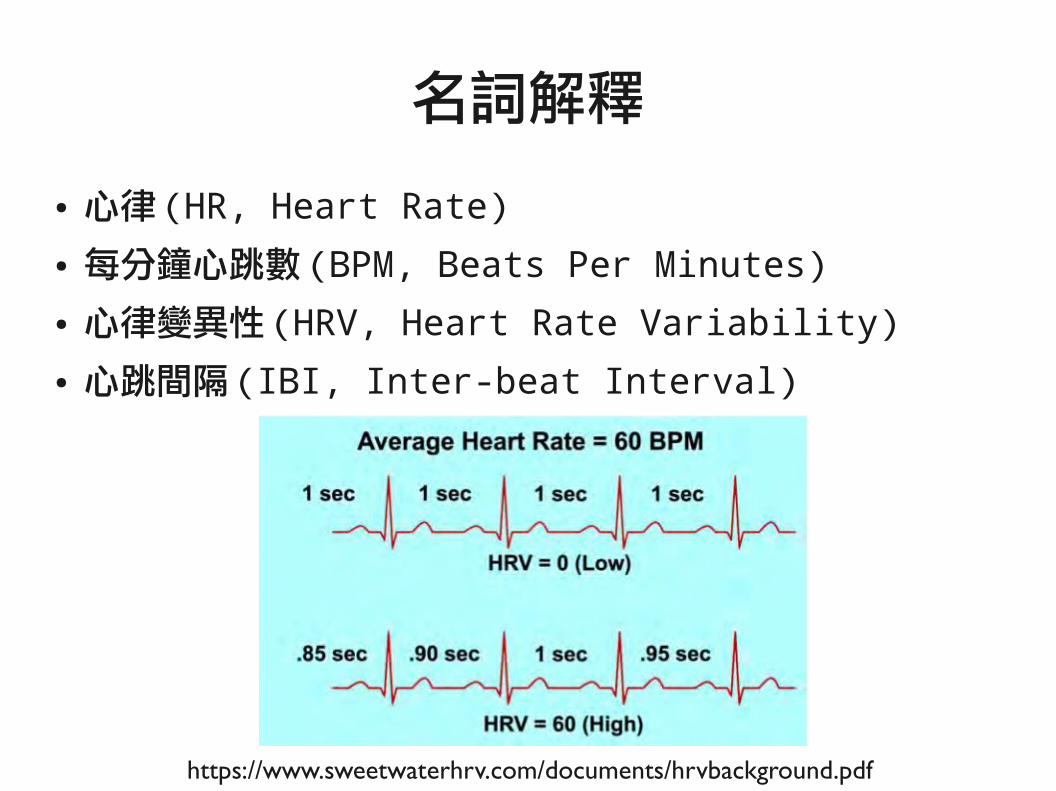
● 心律(HR, Heart Rate)● 每分鐘心跳數(BPM, Beats Per Minutes)● 心律變異性(HRV, Heart Rate Variability)● 心跳間隔(IBI, Inter-beat Interval)
名詞解釋
https://www.sweetwaterhrv.com/documents/hrvbackground.pdf

心律和脈博
http://highscope.ch.ntu.edu.tw/wordpress/?p=63780
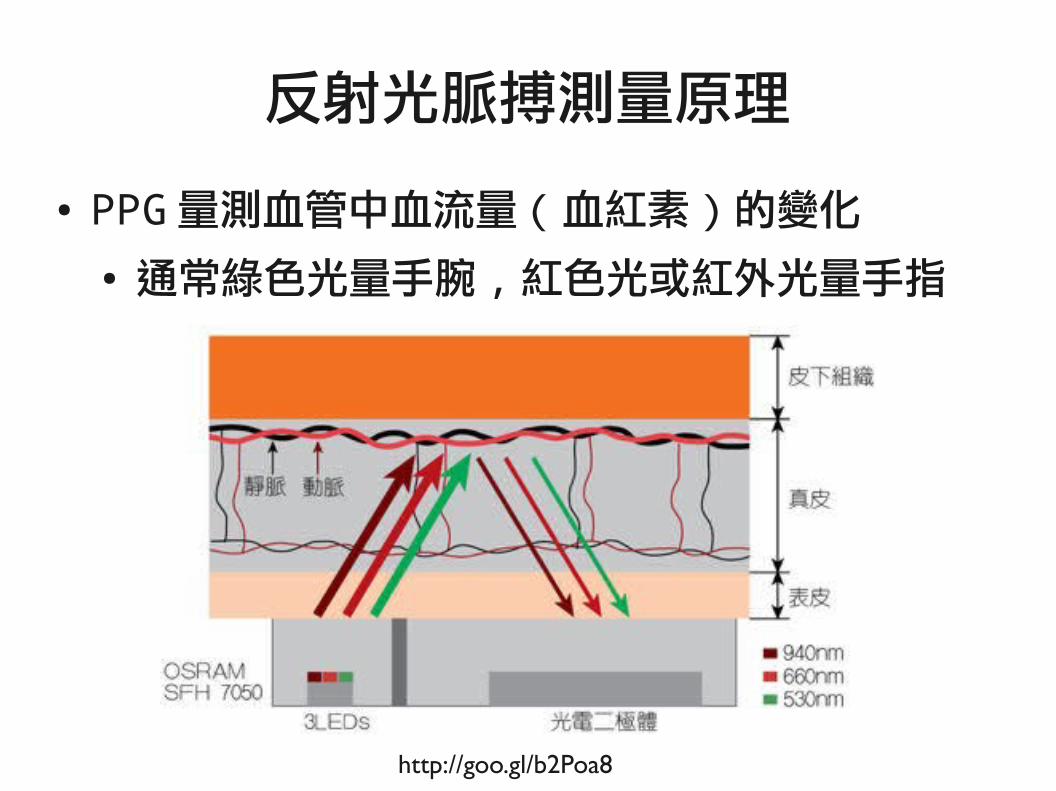
● PPG量測血管中血流量 (血紅素 ) 的變化
● 通常綠色光量手腕 , 紅色光或紅外光量手指
反射光脈搏測量原理
http://goo.gl/b2Poa8

● 光反射的強度 = 血流量的變化 = 心臟律動的結果
PPG 測量中檢測器訊號的產生
http://goo.gl/b2Poa8

脈搏感測器 (Pulse Sensor)
https://www.sparkfun.com/products/11574

近看感測器
https://www.sparkfun.com/products/11574
APDS-9008 環境光感測器
530nm 綠色光源
接地3.3V訊號輸出

16
線路圖MCP3008 RPiCLK Pin23 (SCLK)Din Pin19 (MOSI)Dout Pin21 (MISO)CS Pin24 (CE0)
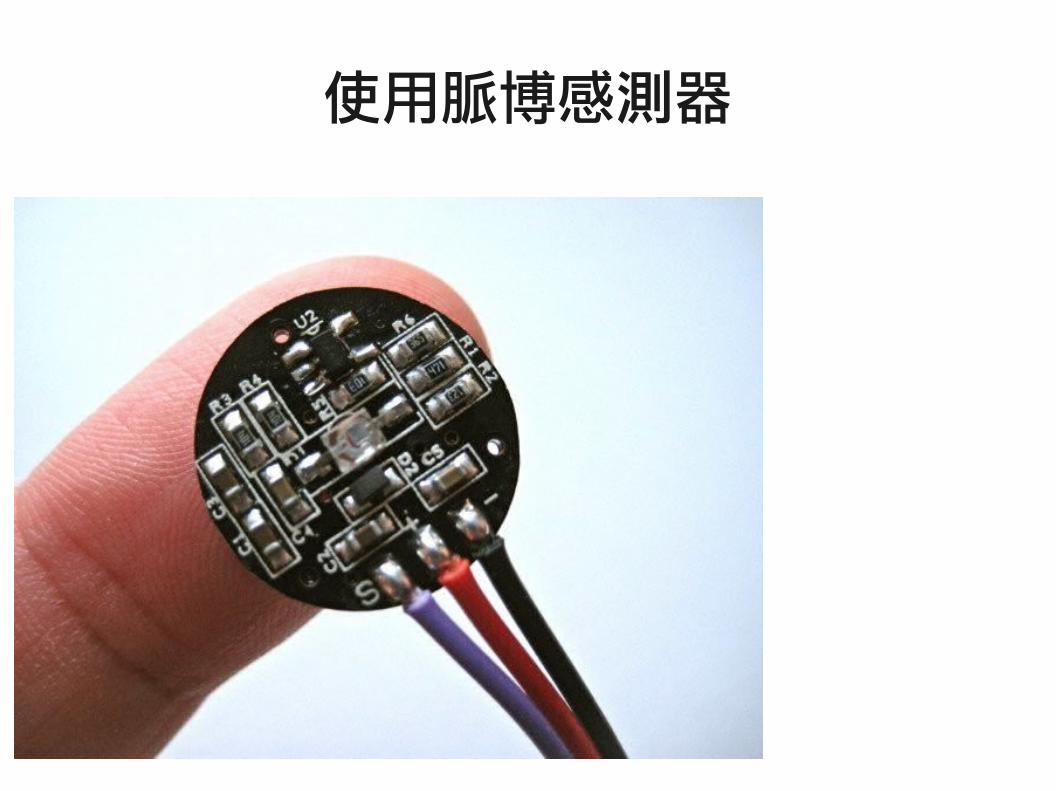
使用脈博感測器
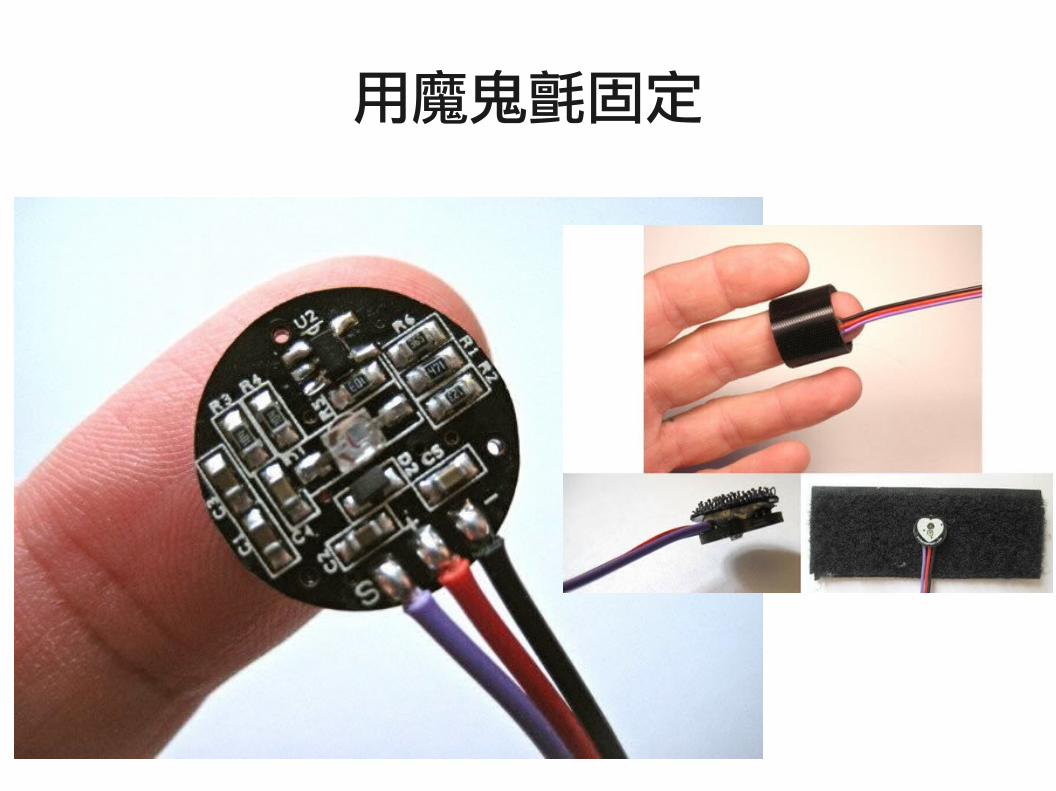
用魔鬼氈固定

19
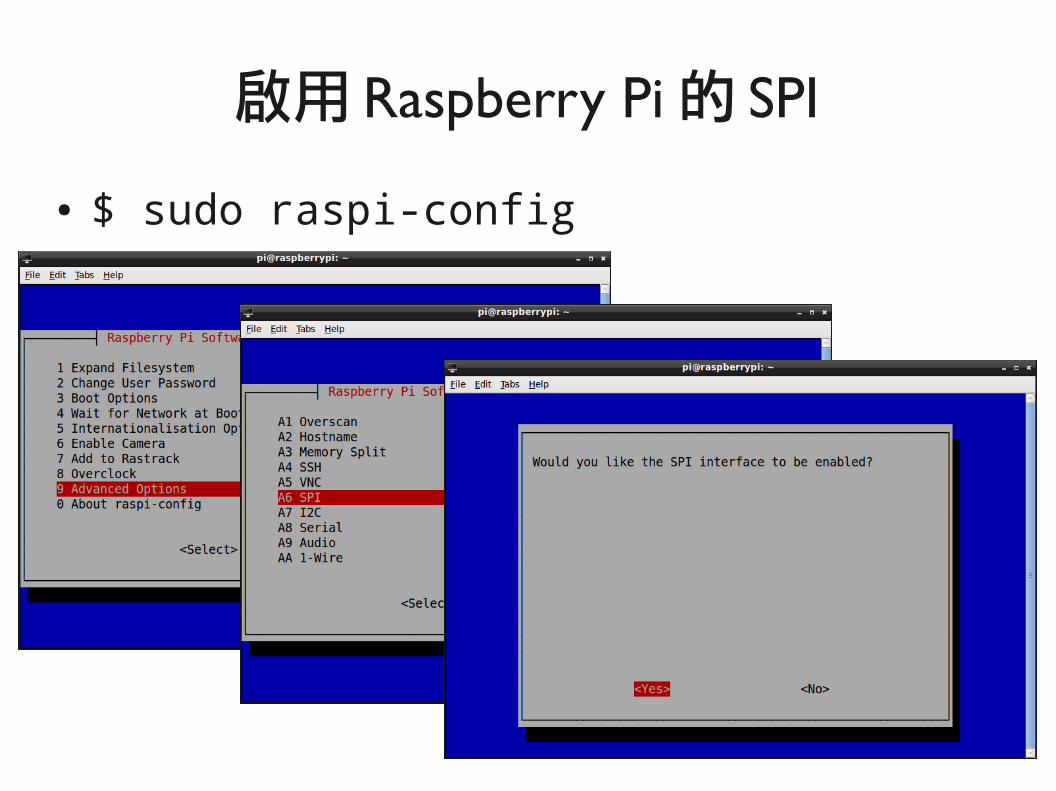
● $ sudo raspi-config
啟用 Raspberry Pi 的 SPI

20
● $ sudo raspi-config
啟用 Raspberry Pi 的 SPI
21
● $ sudo raspi-config
啟用 Raspberry Pi 的 SPI

22
from spidev import SpiDev
●
● class mcp3008:
● def __init__(self, bus = 0, device = 0):
● self.bus, self.device = bus, device
● self.spi = SpiDev()
● self.open()
● def open(self):
● self.spi.open(self.bus, self.device)
● def read(self, channel = 0):
● adc = self.spi.xfer2([1, (8 + channel) << 4, 0])
● data = ((adc[1] & 3) << 8) + adc[2]
● return data
● def close(self):
● self.spi.close()
類比轉數位 (Analog Digital Converter)

23
from mcp3008 import mcp3008
● import time
●
● adc = mcp3008(0, 0)
●
● try:
● while True:
● signal = adc.read(0)
● print "Signal:{0}".format(signal)
● time.sleep(0.005)
●
● except KeyboardInterrupt:
● adc.close()
●
●
使用 mcp3008 類別

24
DEMOread_signal.py
$ cd /home/pi/pulse_sensor
$ python read_signal.py
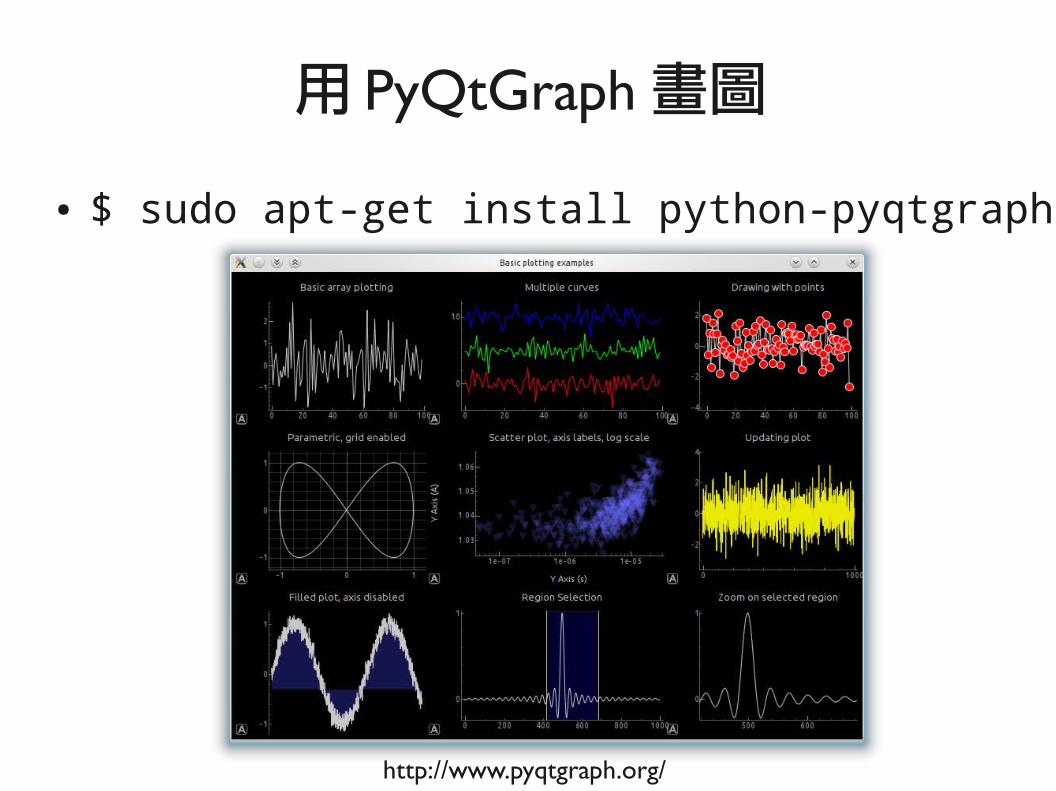
● $ sudo apt-get install python-pyqtgraph
用 PyQtGraph 畫圖
http://www.pyqtgraph.org/

import pyqtgraph as pg
import numpy as np
x = np.arange(0, 360)
y = np.sin(x * np.pi / 180.0)
pg.plot(x, y, title="SIN Plotting")
pg.QtGui.QApplication.exec_()
畫 SIN 波形


如何看畫圖結果?
使用 X11 Forwarding

直接用網路線對接
https://pihw.wordpress.com/guides/direct-network-connection/

● 把Pi設成 .2.2● $ sudo ifconfig eth0 192.168.2.2 netmask 255.255.255.0
● 把Windows
設成.2.1
網路設定
192.168.2.1
DNS 和 gateway 不用設

31
● 安裝 Xming,下一步到底
http://sourceforge.net/projects/xming/
在 Windows 安裝 X Server

32
● SSH > X11 > Enable X11 forwarding
在 Windows 設定 X11 Forwarding
保持空白

33
DEMOpyqtgraph_sin.py
$ cd /home/pi/pulse_sensor
$ python pyqtgraph_sin.py

x1 = np.arange(0, 360, 5)
● y1 = np.sin(x1 * np.pi / 180.0)
●
x2 = x1
y2 = np.cos(x2 * np.pi / 180.0)
●
p = pg.plot(x1, y1, pen='r')
p.plot(x2, y2, pen='b', symbol='o')
●
● pg.QtGui.QApplication.exec_()
●
畫兩條線


36
DEMOpyqtgraph_two_lines.py
$ cd /home/pi/pulse_sensor
$ python pyqtgraph_two_lines.py
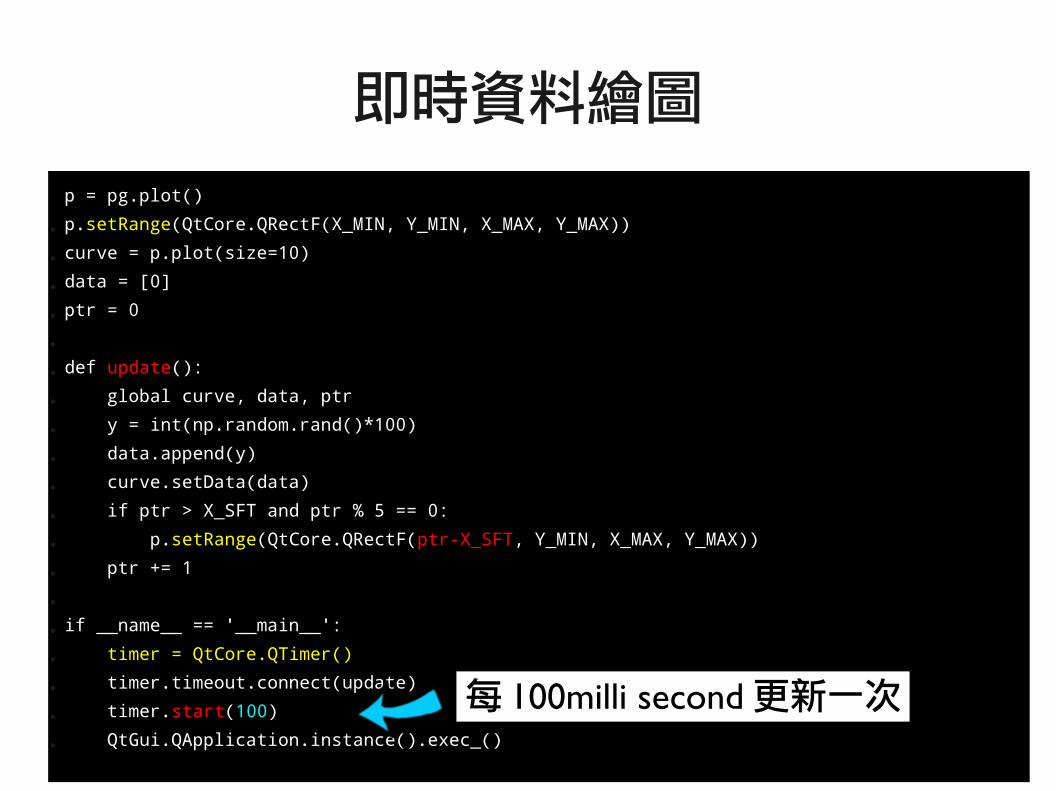
p = pg.plot()
● p.setRange(QtCore.QRectF(X_MIN, Y_MIN, X_MAX, Y_MAX))
● curve = p.plot(size=10)
● data = [0]
● ptr = 0
●
● def update():
● global curve, data, ptr
● y = int(np.random.rand()*100)
● data.append(y)
● curve.setData(data)
● if ptr > X_SFT and ptr % 5 == 0:
● p.setRange(QtCore.QRectF(ptr-X_SFT, Y_MIN, X_MAX, Y_MAX))
● ptr += 1
●
● if __name__ == '__main__':
● timer = QtCore.QTimer()
● timer.timeout.connect(update)
● timer.start(100)
● QtGui.QApplication.instance().exec_()
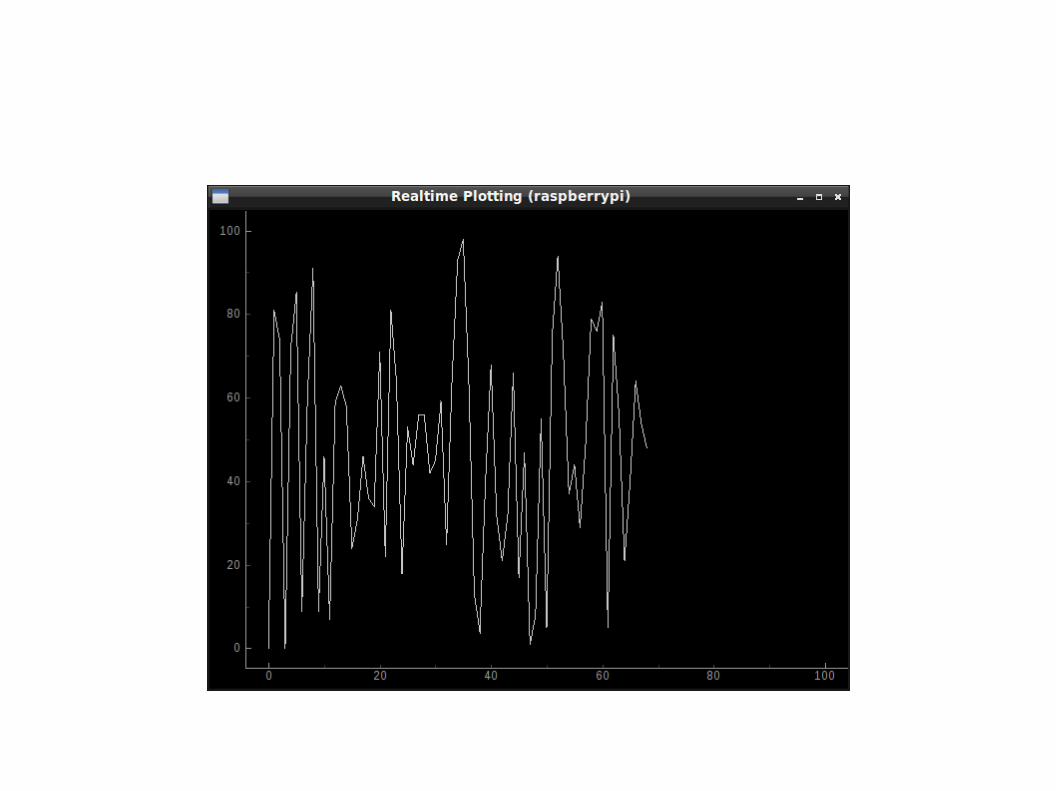
即時資料繪圖
每 100milli second 更新一次
39
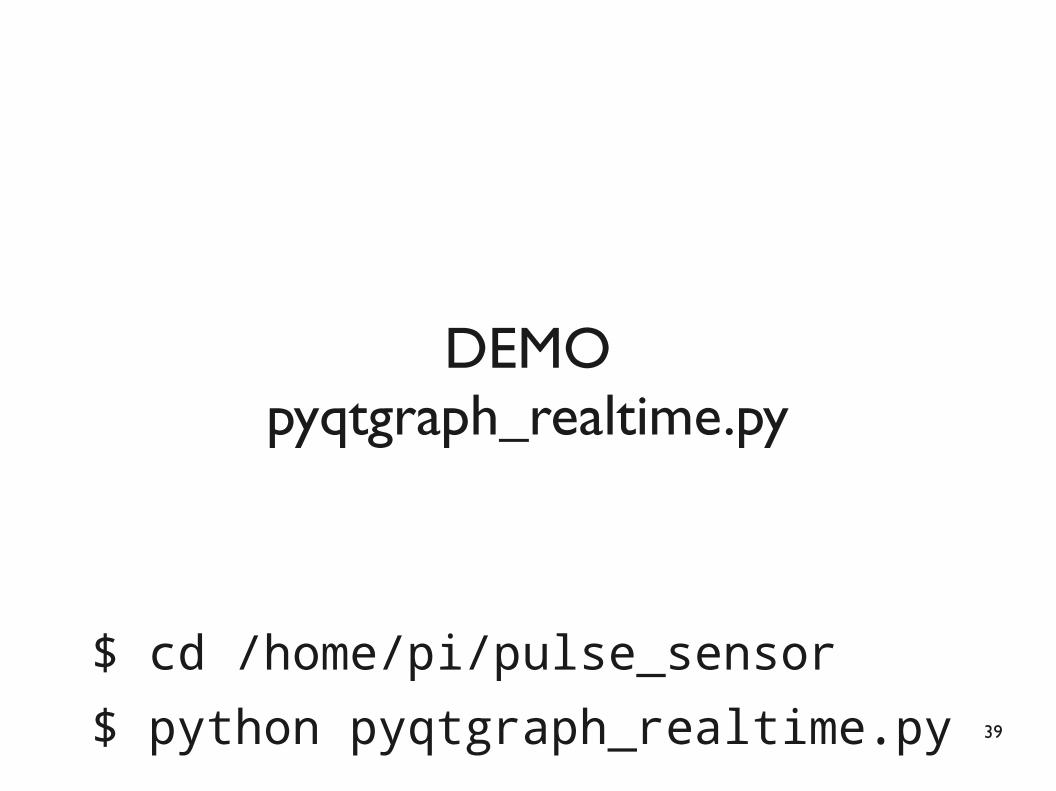
DEMOpyqtgraph_realtime.py
$ cd /home/pi/pulse_sensor
$ python pyqtgraph_realtime.py
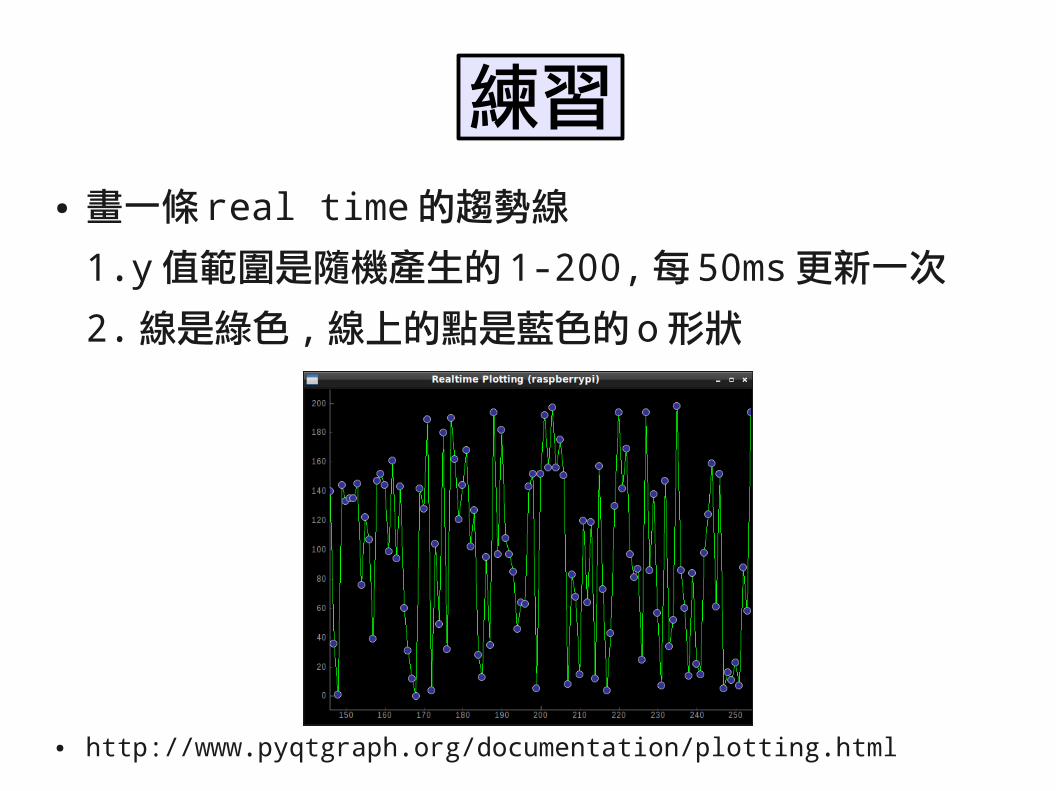
● 畫一條real time的趨勢線
1.y值範圍是隨機產生的1-200,每50ms更新一次
2.線是綠色,線上的點是藍色的o形狀
● http://www.pyqtgraph.org/documentation/plotting.html
練習

41
如何根據 Signal計算 IBI 與 BPM?

ECG Waves
http://www.merckmanuals.com/professional/cardiovascular-disorders/cardiovascular-tests-and-procedures/electrocardiography

43
● P wave:心房去極化
● PR interval:心房開始去極化,正常0.1s-0.2s● QRS complex:心室去極化的時間,正常<0.1s● QT interval:心室去極化+心室再極化,正常<0.43s● ST segment:心室早期的再極化
● T wave:心室再極化
● U wave:通常出現在有低鉀血症,低鎂血症或缺血患者
名詞解釋
http://www.merckmanuals.com/professional/cardiovascular-disorders/cardiovascular-tests-and-procedures/electrocardiography

心律分析
http://wwwu.tsgh.ndmctsgh.edu.tw/erm/article/EKG.ppt
心房興奮
心房收縮
心房舒張
心室興奮
心室收縮
心室舒張

45
https://ay12-14.moodle.wisc.edu/prod/pluginfile.php/48611/mod_resource/content/1/heart_as_pump.html

● 從原始訊號 (Signal) 看 ,R 是我們感興趣的
解讀原始訊號
RR Interval 表示 IBI, 通常在 500-1000ms
IBI 的平均數倒數後乘以 1000,再乘以 60就是 BPM

找出波峰和波谷 ,計算門檻值 (Thresh)
P: 波峰 (Peak)
https://pulsesensor.com/pages/pulse-sensor-amped-arduino-v1dot1
T: 波谷 (Trough)
Thresh=((P-T)/2)+T

48
● 如果進入到光感測器的量恆定,Signal會接近512● 對每一個Signal做分析:
● 找出任意的Beat值,條件是
1.Beat > Thresh
2.IBI > 250
– 如果符合條件,儲存IBI,並計算10個IBI的平均● 如果在2500ms內沒找到,重置所有變數再找
● 詳細說明:http://goo.gl/EQIWJ9
訊號分析演算法
49
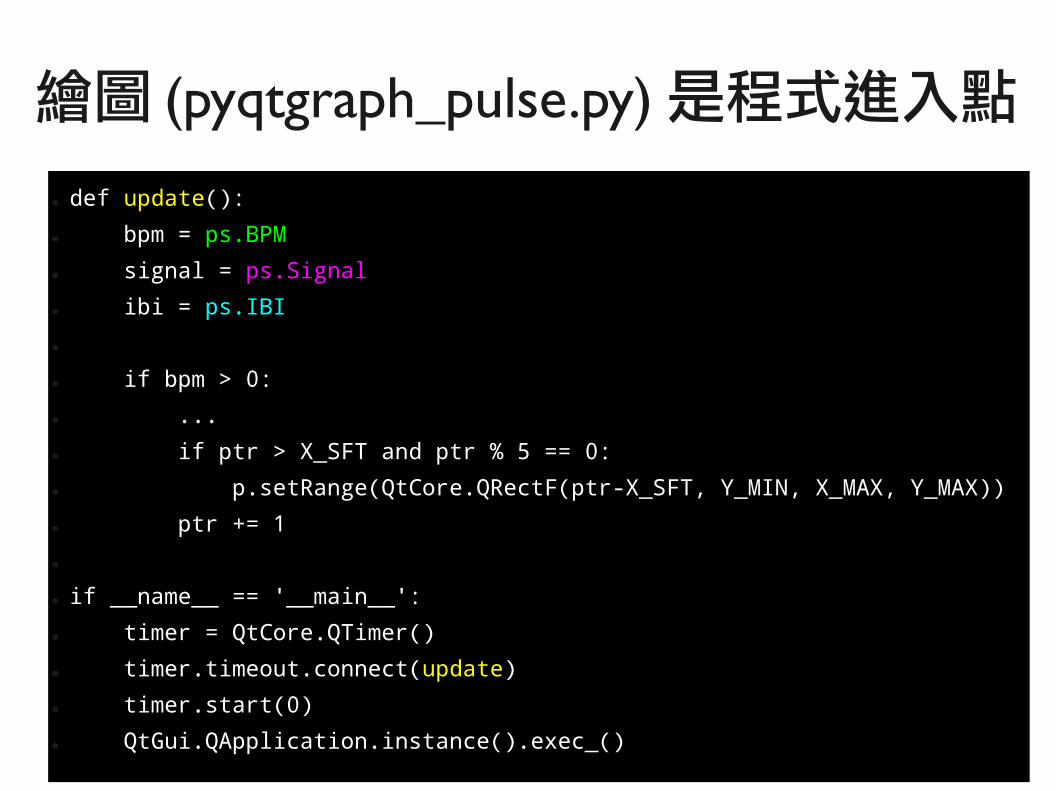
● def update():
● bpm = ps.BPM
● signal = ps.Signal
● ibi = ps.IBI
●
● if bpm > 0:
● ...
● if ptr > X_SFT and ptr % 5 == 0:
● p.setRange(QtCore.QRectF(ptr-X_SFT, Y_MIN, X_MAX, Y_MAX))
● ptr += 1
●
● if __name__ == '__main__':
● timer = QtCore.QTimer()
● timer.timeout.connect(update)
● timer.start(0)
● QtGui.QApplication.instance().exec_()
繪圖 (pyqtgraph_pulse.py) 是程式進入點

50
● class Pulsesensor:
● def __init__(self, channel = 0, bus = 0, device = 0)
● self.channel = channel
● self.BPM = 0
● self.adc = mcp3008(bus, device)
● self.Signal = 0
● self.IBI = 0
●
● def getBPMLoop(self)
● def startAsyncBPM(self):
● self.thread = threading.Thread(target=self.getBPMLoop)
self.thread.start()
●
● def stopAsyncBPM(self)
●
pulsesensor.py 是資料來源

51
● 對每一個Signal做分析:
● 找出任意的Beat值,條件是
1.Beat > Thresh
2.IBI > 250
if N > 250:
if self.Signal > thresh and Pulse == False and N > (self.IBI/5.0)*3:
self.IBI = sampleCounter – lastBeatTime
如果符合條件,儲存IBI,並計算10個IBI的平均
rate[-1] = self.IBI
runningTotal = sum(rate)
runningTotal /= len(rate)
self.BPM = 60000/runningTotal● 如果在2500ms內沒找到,重置所有變數再找
getBPMLoop()做訊號分析

52
DEMOread_pulse.py
$ cd /home/pi/pulse_sensor
$ python read_pulse.py
53
DEMOpyqtgraph_pulse.py
$ cd /home/pi/pulse_sensor
$ python pyqtgraph_pulse.py

藍色 :BPM
綠色 :Signal
紅色 :IBI

● $ ctrl + z
讓程式暫停下來
按 ctrl+z後會暫停

● $ jobs -l
找出目前的 PID
PID 為 826

● $ kill -9 <PID>
終止目前程序
PID 為 826

58
從圖中可看出什麼資訊嗎?

59
異常心電圖的解釋 ( 原文 )
http://www.merckmanuals.com/professional/cardiovascular-disorders/cardiovascular-tests-and-procedures/electrocardiography
Component Description Possible Causes
P waves Abnormal Left or right atrial hypertrophy
P waves Absent Atrial fibrillation
P-P interval Varying Sinus arrhythmia
P-P interval Long First-degree atrioventricular block
P-P interval Varying Mobitz type I atrioventricular block
QRS complex Wide Right or left bundle branch block
QT interval Long Myocardial infarction
QT interval Short Hypercalcemia
ST segment Depression Myocardial ischemia
ST segment Elevation Myocardial ischemia
T wave Tall Hyperkalemia
T wave Small,flattened Myocardial ischemia
U wave Prominent Hypokalemia

60
異常心電圖的解釋 ( 中文 )
http://www.merckmanuals.com/professional/cardiovascular-disorders/cardiovascular-tests-and-procedures/electrocardiography
Component Description Possible Causes
P waves 異常 左或右心房肥大
P waves 缺少 心房顫動
P-P interval 變異 竇性心律不齊
P-P interval 過長 第一級的心房傳導阻滯
P-P interval 變異 Mobitz型心房傳導阻滯
QRS complex 過寬 右或左的束支傳導阻滯
QT interval 過長 心肌梗死
QT interval 過短 高鈣血症
ST segment 下降 心肌缺血
ST segment 上升 心肌缺血
T wave 過高 高鈣血症
T wave 小,或扁平 心肌缺血
U wave 突出 低鉀血症
● 先讀取 BPM 數值 (假設數值是 80),增加一個LED,讓 BPM+10條件發生時 ,LED燈亮
● 當低於 BPM+10時 ,LED燈熄滅
練習

● 正確的脈博訊號是長怎樣?● 如何儲存與顯示脈博資訊?
問題與討論

63
Raspberry Pi Rocks the World
Thanks