quarterly economic newsletter - eve onlinecdn1.eveonline.com/community/qen/qen_q4-2009.pdf · in...
TRANSCRIPT
QUARTERLY ECONOMIC NEWSLETTER
EVE ONLINE4rd Quarter 2009

QUARTERLY ECONOMIC NEWSLETTER
4 5
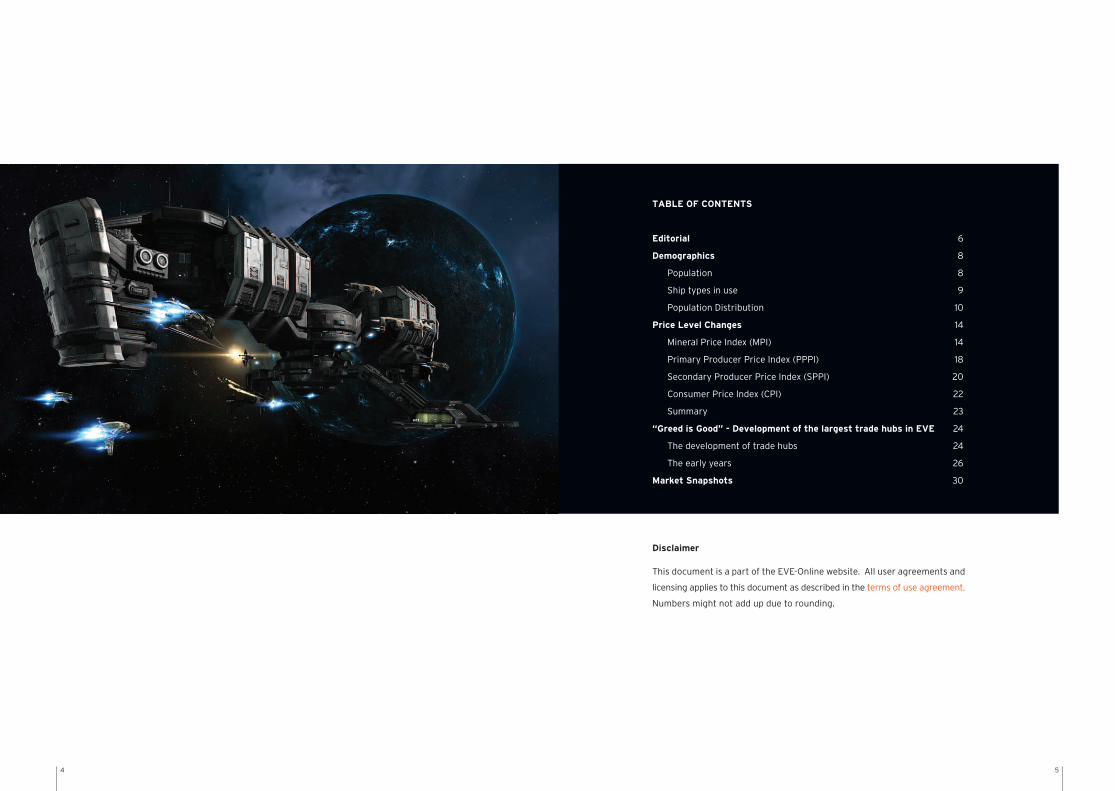
TABLE OF CONTENTS
Editorial 6
Demographics 8
Population 8
Ship types in use 9
Population Distribution 10
Price Level Changes 14
Mineral Price Index (MPI) 14
Primary Producer Price Index (PPPI) 18
Secondary Producer Price Index (SPPI) 20
Consumer Price Index (CPI) 22
Summary 23
“Greed is Good” - Development of the largest trade hubs in EVE 24
The development of trade hubs 24
The early years 26
Market Snapshots 30
Disclaimer
This document is a part of the EVE-Online website. All user agreements and
licensing applies to this document as described in the terms of use agreement.
Numbers might not add up due to rounding.
6 7
In the first Quarterly Economic Newsletter of
2009, we stated that it was a good year for
EVE despite the global financial crisis. That
turned out to be an understatement. In fact,
2009 was one of the most successful years for
EVE Online since its launch in May2003.
In Q1 2009 we saw the successful launch of
Apocrypha. New additions to the game, such as
the Wormholes and a new class of spaceships,
were welcomed by the players. This resulted
in continuous player base growth throughout
the first and second quarters of 2009. In May
the player base broke the 300,000 mark for
the first time.
In the third quarter there was increased com-
petition from new game releases, and the
news from real-life economic front lines was
grim. Worldwide economists predicted slower
consumer spending despite some signs of
improvements in the global economy. Despite
these difficult conditions, EVE steadily held
its ground until the release of Dominion on
December 1st.
The Dominion release was a very successful
EVE expansion that was well received by the
players. Changes in the sovereignty system
gave nullsec warfare a new spark, resulting in
interesting conflicts with grand battles involv-
ing several hundred participants each time.
The success of Dominion pushed EVE to
another historic milestone – 317,593. This may
look like an arbitrary number, but for CCP it
is an important one. This figure represents
the total population of Iceland as of Decem-
ber 2009. Just before Christmas, EVE Online
surpassed that number. Today there are more
paying accounts in EVE Online than there are
citizens in Iceland.
We can proudly say that 2009 was an out-
standing year or EVE – and many others seem
to agree. In January 2010, EVE Online was
declared “MMO of the Year” by mmorpg.com.
This is no small feat for a game that has been
on the market for more than six years.
EVE is a true sandbox, and the achievements
of EVE this year can both be attributed to the
hard work of everyone at CCP but not least to
the players themselves, who continue to make
EVE one of the most active, vibrant and excit-
ing MMOs out there. With such a great com-
munity and dedicated developers, we can state
that EVE will reach new heights in 2010.
EDITORIAL
8 9
POPULATION
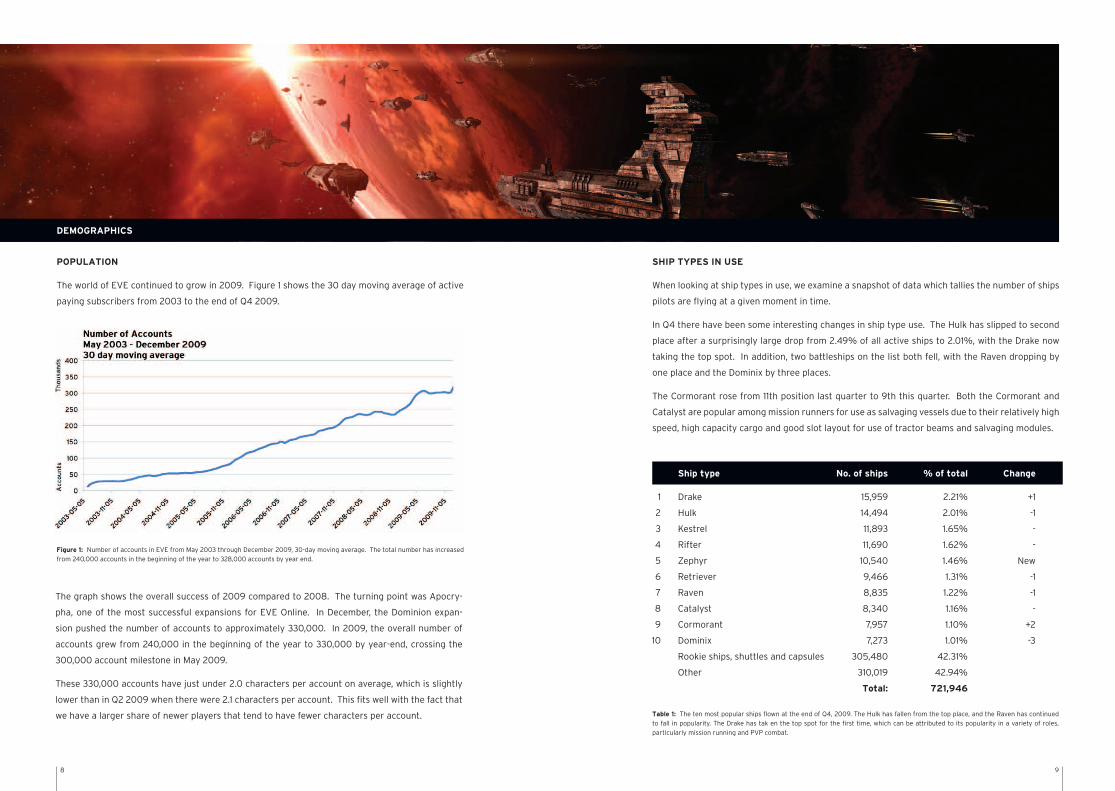
The world of EVE continued to grow in 2009. Figure 1 shows the 30 day moving average of active
paying subscribers from 2003 to the end of Q4 2009.
Figure 1: Number of accounts in EVE from May 2003 through December 2009, 30-day moving average. The total number has increased from 240,000 accounts in the beginning of the year to 328,000 accounts by year end.
Table 1: The ten most popular ships flown at the end of Q4, 2009. The Hulk has fallen from the top place, and the Raven has continued to fall in popularity. The Drake has tak en the top spot for the first time, which can be attributed to its popularity in a variety of roles, particularly mission running and PVP combat.
SHIP TYPES IN USE
When looking at ship types in use, we examine a snapshot of data which tallies the number of ships
pilots are flying at a given moment in time.
In Q4 there have been some interesting changes in ship type use. The Hulk has slipped to second
place after a surprisingly large drop from 2.49% of all active ships to 2.01%, with the Drake now
taking the top spot. In addition, two battleships on the list both fell, with the Raven dropping by
one place and the Dominix by three places.
The Cormorant rose from 11th position last quarter to 9th this quarter. Both the Cormorant and
Catalyst are popular among mission runners for use as salvaging vessels due to their relatively high
speed, high capacity cargo and good slot layout for use of tractor beams and salvaging modules.
Ship type No. of ships % of total Change
Drake 15,959 2.21% +1
Hulk 14,494 2.01% -1
Kestrel 11,893 1.65% -
Rifter 11,690 1.62% -
Zephyr 10,540 1.46% New
Retriever 9,466 1.31% -1
Raven 8,835 1.22% -1
Catalyst 8,340 1.16% -
Cormorant 7,957 1.10% +2
Dominix 7,273 1.01% -3
Rookie ships, shuttles and capsules 305,480 42.31%
Other 310,019 42.94%
Total: 721,946
1
2
3
4
5
6
7
8
9
10
DEMOGRAPHICS
The graph shows the overall success of 2009 compared to 2008. The turning point was Apocry-
pha, one of the most successful expansions for EVE Online. In December, the Dominion expan-
sion pushed the number of accounts to approximately 330,000. In 2009, the overall number of
accounts grew from 240,000 in the beginning of the year to 330,000 by year-end, crossing the
300,000 account milestone in May 2009.
These 330,000 accounts have just under 2.0 characters per account on average, which is slightly
lower than in Q2 2009 when there were 2.1 characters per account. This fits well with the fact that
we have a larger share of newer players that tend to have fewer characters per account.
10 11
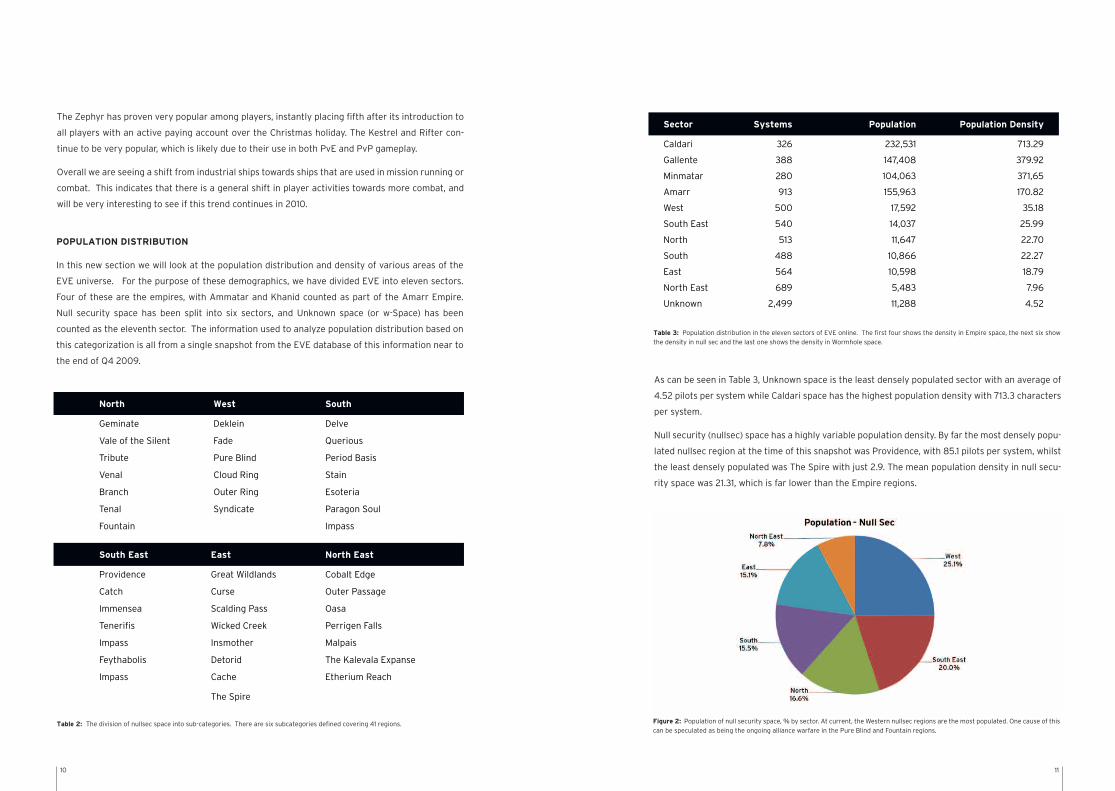
Table 2: The division of nullsec space into sub-categories. There are six subcategories defined covering 41 regions. Figure 2: Population of null security space, % by sector. At current, the Western nullsec regions are the most populated. One cause of this can be speculated as being the ongoing alliance warfare in the Pure Blind and Fountain regions.
Table 3: Population distribution in the eleven sectors of EVE online. The first four shows the density in Empire space, the next six show the density in null sec and the last one shows the density in Wormhole space.
POPULATION DISTRIBUTION
In this new section we will look at the population distribution and density of various areas of the
EVE universe. For the purpose of these demographics, we have divided EVE into eleven sectors.
Four of these are the empires, with Ammatar and Khanid counted as part of the Amarr Empire.
Null security space has been split into six sectors, and Unknown space (or w-Space) has been
counted as the eleventh sector. The information used to analyze population distribution based on
this categorization is all from a single snapshot from the EVE database of this information near to
the end of Q4 2009.
As can be seen in Table 3, Unknown space is the least densely populated sector with an average of
4.52 pilots per system while Caldari space has the highest population density with 713.3 characters
per system.
Null security (nullsec) space has a highly variable population density. By far the most densely popu-
lated nullsec region at the time of this snapshot was Providence, with 85.1 pilots per system, whilst
the least densely populated was The Spire with just 2.9. The mean population density in null secu-
rity space was 21.31, which is far lower than the Empire regions.
The Zephyr has proven very popular among players, instantly placing fifth after its introduction to
all players with an active paying account over the Christmas holiday. The Kestrel and Rifter con-
tinue to be very popular, which is likely due to their use in both PvE and PvP gameplay.
Overall we are seeing a shift from industrial ships towards ships that are used in mission running or
combat. This indicates that there is a general shift in player activities towards more combat, and
will be very interesting to see if this trend continues in 2010.
North West South
Geminate Deklein Delve
Vale of the Silent Fade Querious
Tribute Pure Blind Period Basis
Venal Cloud Ring Stain
Branch Outer Ring Esoteria
Tenal Syndicate Paragon Soul
Fountain Impass
Sector Systems Population Population Density
Caldari 326 232,531 713.29
Gallente 388 147,408 379.92
Minmatar 280 104,063 371,65
Amarr 913 155,963 170.82
West 500 17,592 35.18
South East 540 14,037 25.99
North 513 11,647 22.70
South 488 10,866 22.27
East 564 10,598 18.79
North East 689 5,483 7.96
Unknown 2,499 11,288 4.52
South East East North East
Providence Great Wildlands Cobalt Edge
Catch Curse Outer Passage
Immensea Scalding Pass Oasa
Tenerifis Wicked Creek Perrigen Falls
Impass Insmother Malpais
Feythabolis Detorid The Kalevala Expanse
Impass Cache Etherium Reach
The Spire
12 13
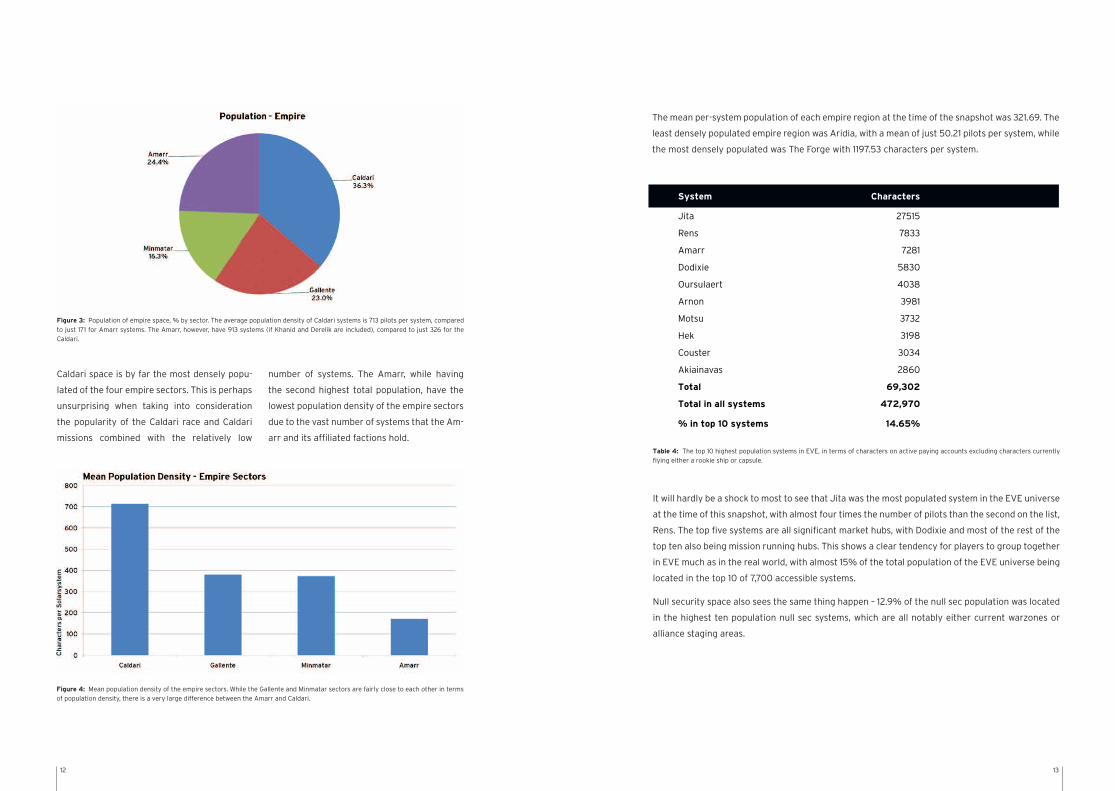
Figure 3: Population of empire space, % by sector. The average population density of Caldari systems is 713 pilots per system, compared to just 171 for Amarr systems. The Amarr, however, have 913 systems (if Khanid and Derelik are included), compared to just 326 for the Caldari.
Table 4: The top 10 highest population systems in EVE, in terms of characters on active paying accounts excluding characters currently flying either a rookie ship or capsule.
Figure 4: Mean population density of the empire sectors. While the Gallente and Minmatar sectors are fairly close to each other in terms of population density, there is a very large difference between the Amarr and Caldari.
Caldari space is by far the most densely popu-
lated of the four empire sectors. This is perhaps
unsurprising when taking into consideration
the popularity of the Caldari race and Caldari
missions combined with the relatively low
number of systems. The Amarr, while having
the second highest total population, have the
lowest population density of the empire sectors
due to the vast number of systems that the Am-
arr and its affiliated factions hold.
The mean per-system population of each empire region at the time of the snapshot was 321.69. The
least densely populated empire region was Aridia, with a mean of just 50.21 pilots per system, while
the most densely populated was The Forge with 1197.53 characters per system.
System Characters
Jita 27515
Rens 7833
Amarr 7281
Dodixie 5830
Oursulaert 4038
Arnon 3981
Motsu 3732
Hek 3198
Couster 3034
Akiainavas 2860
Total 69,302
Total in all systems 472,970
% in top 10 systems 14.65%
It will hardly be a shock to most to see that Jita was the most populated system in the EVE universe
at the time of this snapshot, with almost four times the number of pilots than the second on the list,
Rens. The top five systems are all significant market hubs, with Dodixie and most of the rest of the
top ten also being mission running hubs. This shows a clear tendency for players to group together
in EVE much as in the real world, with almost 15% of the total population of the EVE universe being
located in the top 10 of 7,700 accessible systems.
Null security space also sees the same thing happen – 12.9% of the null sec population was located
in the highest ten population null sec systems, which are all notably either current warzones or
alliance staging areas.
14 15
All price indices for EVE are calculated as Laspeyres indices, in which the base is updated monthly
based on total trade of individual items in the previous month. Within each index there is a variety
of items ranging from eight items for the Mineral Price Index to more than 3,800 for the Consumer
Price index.
MINERAL PRICE INDEX (MPI)
The Mineral Price Index (MPI) shows the price changes in all eight minerals used to produce ships
and other items in Eve. Over Q4 the MPI fell by 7.9%. Most of this drop, or 5.9 percentage points
of the 7.9, occurred in October. The remainder happened in November, while the index stabilized in
December and only moved by 0.1%
Despite a consistent price decline of mineral
prices during 2009, there are significant move-
ments of the price of individual minerals. The
mineral that contributed most to the mineral
deflation was Megacyte. Over the quarter its
price dropped by a third. Another important
contributor was Mexallon, which fell by 17.5%.
The price decline of Tritanium continued in Oc-
tober but stabilized in November and remained
stable in December. Pyerite pulled consider-
ably in the opposite direction throughout the
quarter, its price increasing by 26.1%, which is
the highest price increase for Pyerite during
2009. We split minerals into two categories:
low-end minerals and high-end minerals. The
low end minerals contain Pyerite, Tritanium,
Isogen and Mexallon, while the high-end cat-
egory includes Zydrine, Megacyte, Nocxium
and Morphite.
The increase in low-end mineral volume is con-
sistent with the release of Dominion in Decem-
ber, since expansions tend to cause significant
increases in market activity.
While Dominion did not introduce any new
ship types, or generally new things to build, it
did give ample reason for fighting. New sov-
ereignty mechanics were implemented which
no doubt enticed many to forcibly acquire new
territories. Additionally, changes in Tech II
production requirements meant that the value
of certain moons changed considerably, which
has caused many of those moons to change
hands at the cost of many lost ships. All this
creates increased demand for minerals.
The fall in Tritanium price in October is a con-
tinuation of the trend that was started in June
when asteroid reseeding and re-spawning was
changed, which resulted in an increase of the
supply of Tritanium. From May to October the
price of Tritanium fell by 35%, but the last de-
crease was in October as Tritanium prices in
November and December were very stable.
Mexallon prices spiked quite sharply in July but
have been falling steadily since August. The
PRICE LEVEL CHANGES
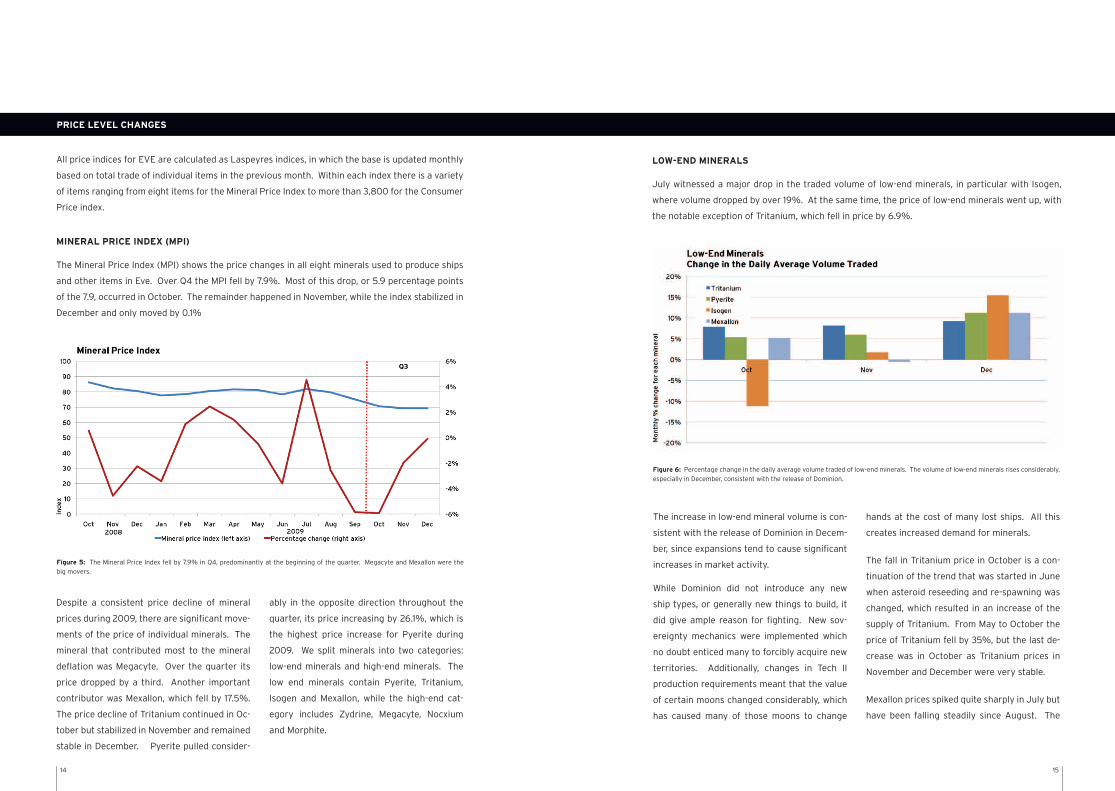
Figure 5: The Mineral Price Index fell by 7.9% in Q4, predominantly at the beginning of the quarter. Megacyte and Mexallon were the big movers.
Figure 6: Percentage change in the daily average volume traded of low-end minerals. The volume of low-end minerals rises considerably, especially in December, consistent with the release of Dominion.
LOW-END MINERALS
July witnessed a major drop in the traded volume of low-end minerals, in particular with Isogen,
where volume dropped by over 19%. At the same time, the price of low-end minerals went up, with
the notable exception of Tritanium, which fell in price by 6.9%.
16 17
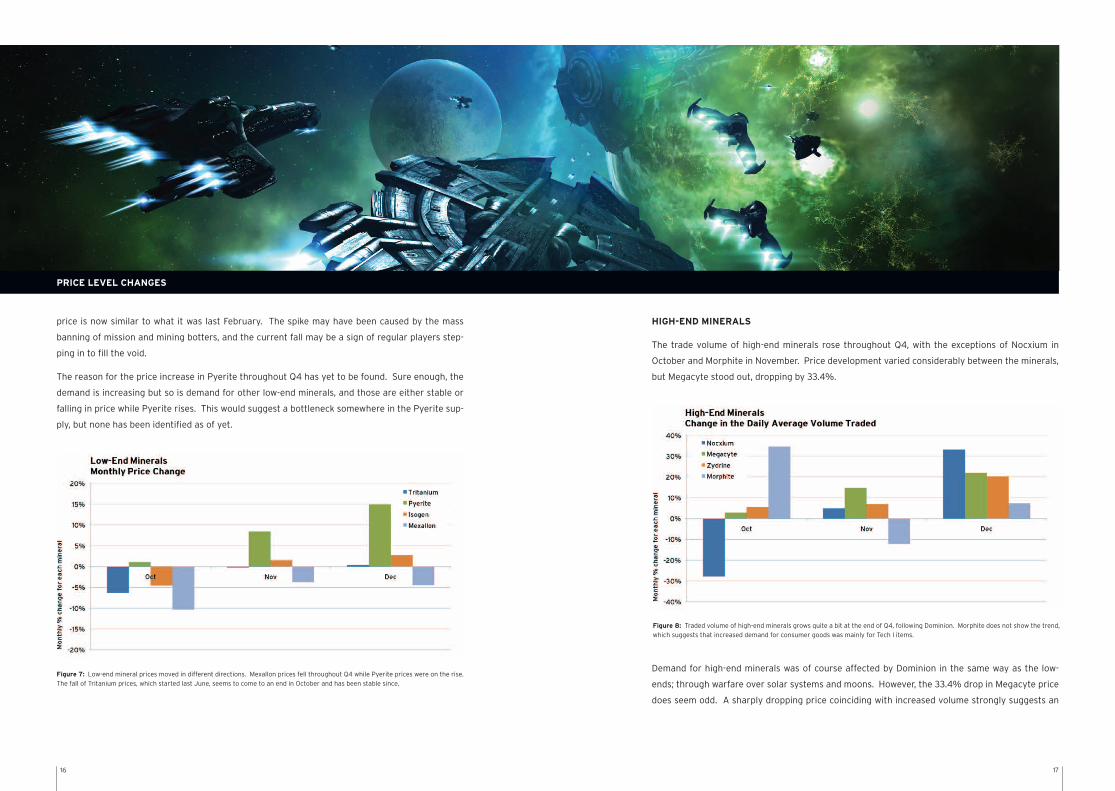
HIGH-END MINERALS
The trade volume of high-end minerals rose throughout Q4, with the exceptions of Nocxium in
October and Morphite in November. Price development varied considerably between the minerals,
but Megacyte stood out, dropping by 33.4%.
Figure 7: Low-end mineral prices moved in different directions. Mexallon prices fell throughout Q4 while Pyerite prices were on the rise. The fall of Tritanium prices, which started last June, seems to come to an end in October and has been stable since.
Figure 8: Traded volume of high-end minerals grows quite a bit at the end of Q4, following Dominion. Morphite does not show the trend, which suggests that increased demand for consumer goods was mainly for Tech I items.
PRICE LEVEL CHANGES
price is now similar to what it was last February. The spike may have been caused by the mass
banning of mission and mining botters, and the current fall may be a sign of regular players step-
ping in to fill the void.
The reason for the price increase in Pyerite throughout Q4 has yet to be found. Sure enough, the
demand is increasing but so is demand for other low-end minerals, and those are either stable or
falling in price while Pyerite rises. This would suggest a bottleneck somewhere in the Pyerite sup-
ply, but none has been identified as of yet.
Demand for high-end minerals was of course affected by Dominion in the same way as the low-
ends; through warfare over solar systems and moons. However, the 33.4% drop in Megacyte price
does seem odd. A sharply dropping price coinciding with increased volume strongly suggests an
18 19
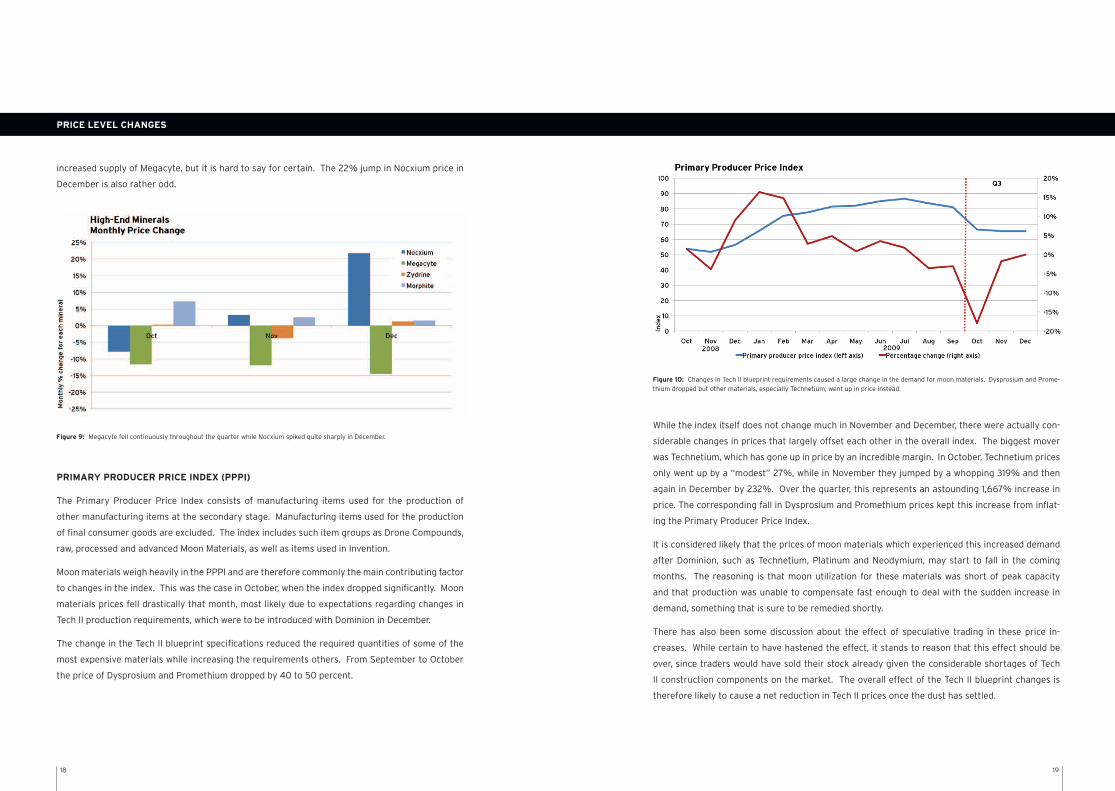
PRIMARY PRODUCER PRICE INDEX (PPPI)
The Primary Producer Price Index consists of manufacturing items used for the production of
other manufacturing items at the secondary stage. Manufacturing items used for the production
of final consumer goods are excluded. The index includes such item groups as Drone Compounds,
raw, processed and advanced Moon Materials, as well as items used in Invention.
Moon materials weigh heavily in the PPPI and are therefore commonly the main contributing factor
to changes in the index. This was the case in October, when the index dropped significantly. Moon
materials prices fell drastically that month, most likely due to expectations regarding changes in
Tech II production requirements, which were to be introduced with Dominion in December.
The change in the Tech II blueprint specifications reduced the required quantities of some of the
most expensive materials while increasing the requirements others. From September to October
the price of Dysprosium and Promethium dropped by 40 to 50 percent.
While the index itself does not change much in November and December, there were actually con-
siderable changes in prices that largely offset each other in the overall index. The biggest mover
was Technetium, which has gone up in price by an incredible margin. In October, Technetium prices
only went up by a “modest” 27%, while in November they jumped by a whopping 319% and then
again in December by 232%. Over the quarter, this represents an astounding 1,667% increase in
price. The corresponding fall in Dysprosium and Promethium prices kept this increase from inflat-
ing the Primary Producer Price Index.
It is considered likely that the prices of moon materials which experienced this increased demand
after Dominion, such as Technetium, Platinum and Neodymium, may start to fall in the coming
months. The reasoning is that moon utilization for these materials was short of peak capacity
and that production was unable to compensate fast enough to deal with the sudden increase in
demand, something that is sure to be remedied shortly.
There has also been some discussion about the effect of speculative trading in these price in-
creases. While certain to have hastened the effect, it stands to reason that this effect should be
over, since traders would have sold their stock already given the considerable shortages of Tech
II construction components on the market. The overall effect of the Tech II blueprint changes is
therefore likely to cause a net reduction in Tech II prices once the dust has settled.
Figure 9: Megacyte fell continuously throughout the quarter while Nocxium spiked quite sharply in December.
Figure 10: Changes in Tech II blueprint requirements caused a large change in the demand for moon materials. Dysprosium and Prome-thium dropped but other materials, especially Technetium, went up in price instead.
PRICE LEVEL CHANGES
increased supply of Megacyte, but it is hard to say for certain. The 22% jump in Nocxium price in
December is also rather odd.
20 21
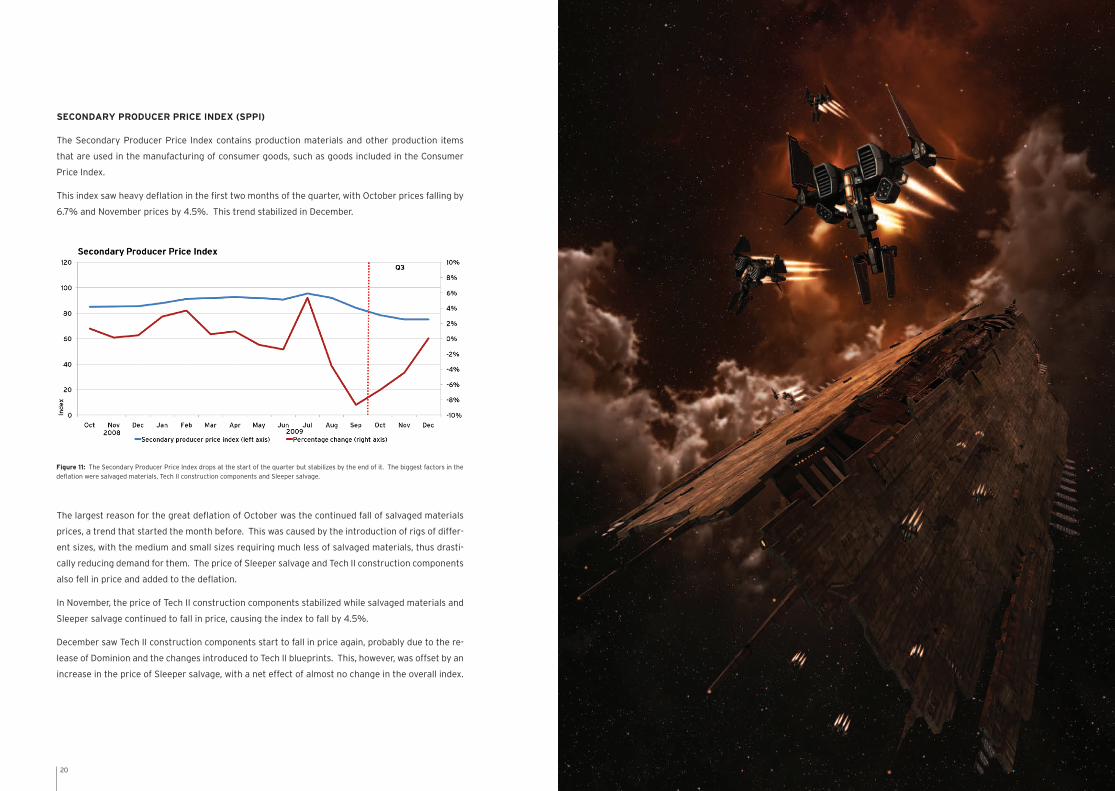
SECONDARY PRODUCER PRICE INDEX (SPPI)
The Secondary Producer Price Index contains production materials and other production items
that are used in the manufacturing of consumer goods, such as goods included in the Consumer
Price Index.
This index saw heavy deflation in the first two months of the quarter, with October prices falling by
6.7% and November prices by 4.5%. This trend stabilized in December.
The largest reason for the great deflation of October was the continued fall of salvaged materials
prices, a trend that started the month before. This was caused by the introduction of rigs of differ-
ent sizes, with the medium and small sizes requiring much less of salvaged materials, thus drasti-
cally reducing demand for them. The price of Sleeper salvage and Tech II construction components
also fell in price and added to the deflation.
In November, the price of Tech II construction components stabilized while salvaged materials and
Sleeper salvage continued to fall in price, causing the index to fall by 4.5%.
December saw Tech II construction components start to fall in price again, probably due to the re-
lease of Dominion and the changes introduced to Tech II blueprints. This, however, was offset by an
increase in the price of Sleeper salvage, with a net effect of almost no change in the overall index.
Figure 11: The Secondary Producer Price Index drops at the start of the quarter but stabilizes by the end of it. The biggest factors in the deflation were salvaged materials, Tech II construction components and Sleeper salvage.

22 23
CONSUMER PRICE INDEX (CPI)
The Consumer Price Index measures the overall price changes of consumer products. This is not
limited to consumables such as fuel, ammunition or PLEXes, but also includes assets such as ships,
modules, implants and starbase components. In summary, anything that is not primarily used to
produce other goods is included in the index, which contains over 3,800 individual items.
As is generally the trend with the other indices this quarter, the CPI deflated considerably for the
first two months of the quarter, while December was fairly stable.
Figure 12: Like the other indices, the CPI experiences much deflation at the start of Q4 and then stabilized in December. Nearly all prod-uct categories showed deflation in October while in December some were still going down while others were going up. Of those rising in price, Tech II ships and fuel were most notable.
Figure 13: Tech II prices were in a bit of a flux in Q4 due to changes in Tech II blueprint requirements introduced in December. Prices initially fell, probably due to speculation, but then spiked in December.
Rigs were the main contributor to the heavy deflationary pressure at the beginning of the quarter,
a continuation of the trend that started with the introduction of rigs of different sizes. The vast
majority of other items also saw price cuts and therefore added to the deflation.
November was very similar to October, with all product categories showing deflation and with rigs
and ships of all tech levels contributing the most to it.
The turnaround came in December, where the heavy deflation got turned over to moderate infla-
tion. The prices of some item categories did rise significantly this month, such as Tech II ships
and fuel.
Tech II ship prices fell by 4.4% in October and by 4% in November, but rose by 10.8% in December.
The dip at the beginning of the quarter is probably due to the fall of Dysprosium and Promethium,
which may have been an overreaction since the price rose again in December by 10.8%. This rise
is due to the rising prices of some moon materials, most notably Technetium, which is in much
greater demand after Dominion.
SUMMARY
This quarter was characterized by high deflation at the start, which turned to mild deflation in the
end. Overall, the most influential factors in the price level changes of the period were increased
activity following Dominion, changes in Tech II blueprints following that expansion, and the rig
changes introduced in Q3. The effect of the rig changes are probably over by now, but it could be
some time before the Tech II market stabilizes.
Looking at 2009 as a whole, it can be said that the first half of the year was characterized by
inflation, while the latter half was characterized by deflation. One of the biggest factors driving
this result was the starbase exploit correction in December 2008, which reduced the supply of
moon materials and raised prices. In addition, June saw the start of operation Unholy Rage, which
targeted real money trading, especially botters. This caused the price of certain items heavily
supplied by botters, such as implants and fuel, to rise in price but also reduced the mineral supply
from reprocessed mission loot. At the same time, respawning and reseeding of low-end asteroids
was increased, which mainly affected Tritanium and lowered its price by a large margin. Finally, the
introduction of rigs of different sizes, in August, had a big downward impact on the overall prices
of rigs and salvaged materials. Therefore the major cause of deflation in the latter part of the year
was changes in material requirements, or just lower production costs, and can be seen as a certain
technological change leading to increased efficency in the economy.

24 25
From the very beginning of EVE, trade and industrial activity have been pillars of the virtual uni-
verse. Yet no specific star system was designated as “the trade system.” The asymmetric distribu-
tion of resources and population within the game called for the establishment of trade centers.
In this section we will look at the development of trade in various regions and examine in some
detail what happens on the trade floor at the Caldari Navy Assembly Plant at Jita IV – 4, by far the
most popular trade hub located deep in the Forge region.
“GREED IS GOOD” - DEVELOPMENT OF THE LARGEST TRADE HUBS IN EVE
Table 5: Relative share of regions in total trade value.
Z
Rank Region Share
1 The Forge 53.0%
2 Domain 8.7%
3 Sinq Laison 5.8%
4 Heimatar 5.5%
5 Lonetrek 4.4%
6 The Citadel 3.9%
7 Metropolis 2.6%
8 Essence 2.4%
9 Tash-Murkon 2.1%
10 Placid 1.0%
THE DEVELOPMENT OF TRADE HUBS
Jita is the main trade hub of EVE, accounting
for 53% of all trade value. Table 5 shows the
share of each region in the total trade value,
and from that it is clear just how economically
vibrant this region is, followed by Domain (Am-
arr) and Sinq Laison.
But this has not always been the case. Prior
to the introduction of the “superhighways”,
several different regions had a higher relative
importance, and hence no single one had such
a dominant share as Jita has now.
Figure 14: The evolution of the share of total trade value by region. Only the largest regions are labeled.
Figure 14 shows the relative share of the trade value for each of the regions in EVE, from October
2003 through December 2009.
Ten regions stand out as having the largest share of the trade value, each holding a fairly stable
share from October 2003 through 2004. But early 2005 we start to see The Forge increase its
share rapidly, and by the end of 2005 it is the biggest trade region. Its share has increased continu-
ously ever since: in 2009, The Forge accounted for more than 50% of all trade in EVE.
26 27
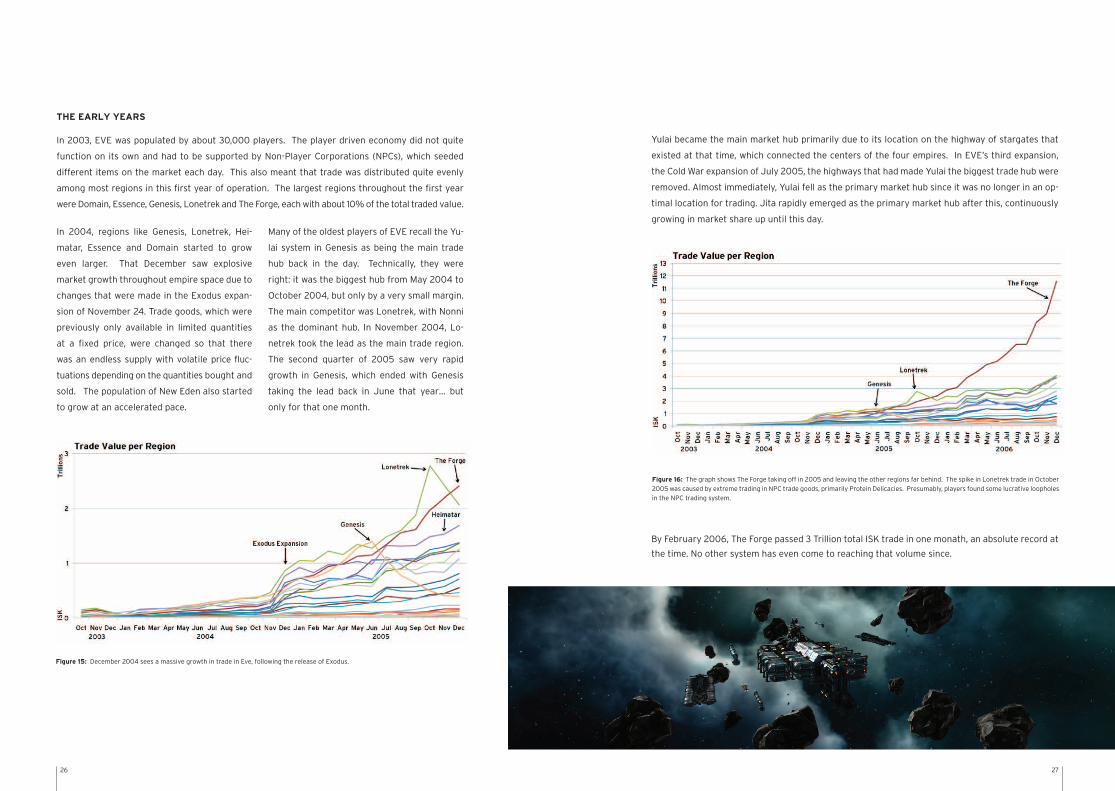
Yulai became the main market hub primarily due to its location on the highway of stargates that
existed at that time, which connected the centers of the four empires. In EVE’s third expansion,
the Cold War expansion of July 2005, the highways that had made Yulai the biggest trade hub were
removed. Almost immediately, Yulai fell as the primary market hub since it was no longer in an op-
timal location for trading. Jita rapidly emerged as the primary market hub after this, continuously
growing in market share up until this day.
By February 2006, The Forge passed 3 Trillion total ISK trade in one monath, an absolute record at
the time. No other system has even come to reaching that volume since.
Figure 16: The graph shows The Forge taking off in 2005 and leaving the other regions far behind. The spike in Lonetrek trade in October 2005 was caused by extreme trading in NPC trade goods, primarily Protein Delicacies. Presumably, players found some lucrative loopholes in the NPC trading system.
Figure 15: December 2004 sees a massive growth in trade in Eve, following the release of Exodus.
THE EARLY YEARS
In 2003, EVE was populated by about 30,000 players. The player driven economy did not quite
function on its own and had to be supported by Non-Player Corporations (NPCs), which seeded
different items on the market each day. This also meant that trade was distributed quite evenly
among most regions in this first year of operation. The largest regions throughout the first year
were Domain, Essence, Genesis, Lonetrek and The Forge, each with about 10% of the total traded value.
In 2004, regions like Genesis, Lonetrek, Hei-
matar, Essence and Domain started to grow
even larger. That December saw explosive
market growth throughout empire space due to
changes that were made in the Exodus expan-
sion of November 24. Trade goods, which were
previously only available in limited quantities
at a fixed price, were changed so that there
was an endless supply with volatile price fluc-
tuations depending on the quantities bought and
sold. The population of New Eden also started
to grow at an accelerated pace.
Many of the oldest players of EVE recall the Yu-
lai system in Genesis as being the main trade
hub back in the day. Technically, they were
right: it was the biggest hub from May 2004 to
October 2004, but only by a very small margin.
The main competitor was Lonetrek, with Nonni
as the dominant hub. In November 2004, Lo-
netrek took the lead as the main trade region.
The second quarter of 2005 saw very rapid
growth in Genesis, which ended with Genesis
taking the lead back in June that year… but
only for that one month.
28 29
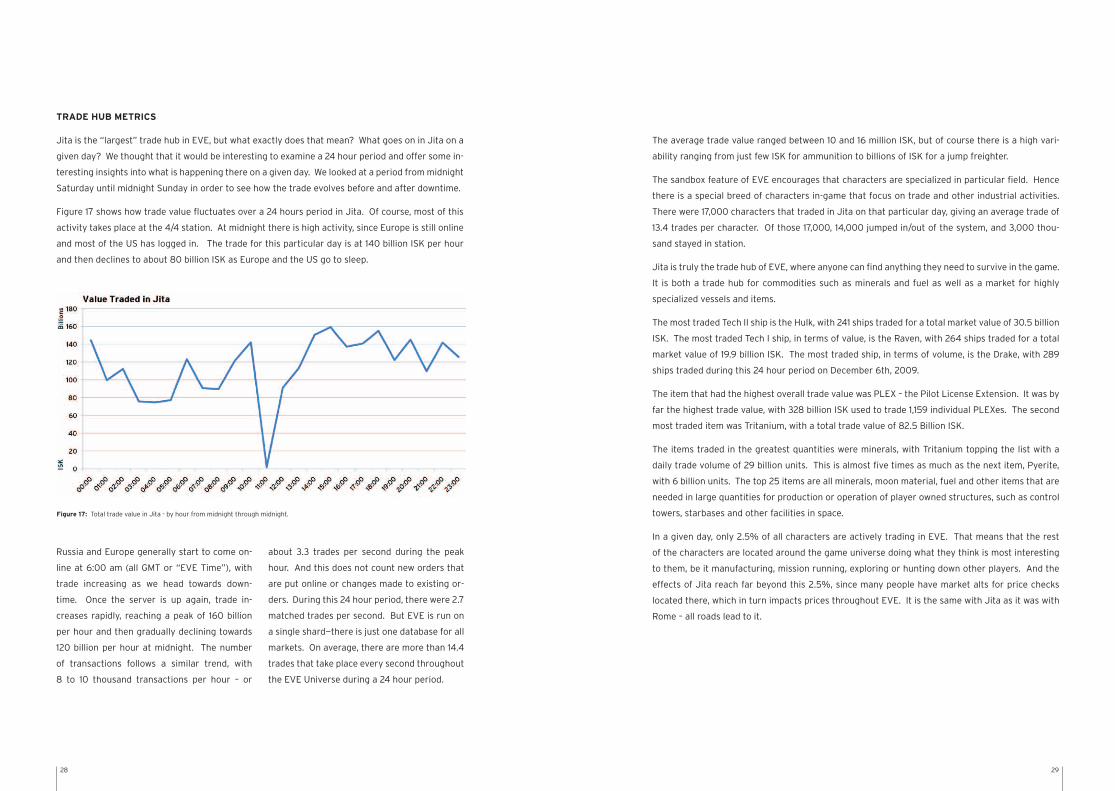
TRADE HUB METRICS
Jita is the “largest” trade hub in EVE, but what exactly does that mean? What goes on in Jita on a
given day? We thought that it would be interesting to examine a 24 hour period and offer some in-
teresting insights into what is happening there on a given day. We looked at a period from midnight
Saturday until midnight Sunday in order to see how the trade evolves before and after downtime.
Figure 17 shows how trade value fluctuates over a 24 hours period in Jita. Of course, most of this
activity takes place at the 4/4 station. At midnight there is high activity, since Europe is still online
and most of the US has logged in. The trade for this particular day is at 140 billion ISK per hour
and then declines to about 80 billion ISK as Europe and the US go to sleep.
Russia and Europe generally start to come on-
line at 6:00 am (all GMT or “EVE Time”), with
trade increasing as we head towards down-
time. Once the server is up again, trade in-
creases rapidly, reaching a peak of 160 billion
per hour and then gradually declining towards
120 billion per hour at midnight. The number
of transactions follows a similar trend, with
8 to 10 thousand transactions per hour – or
about 3.3 trades per second during the peak
hour. And this does not count new orders that
are put online or changes made to existing or-
ders. During this 24 hour period, there were 2.7
matched trades per second. But EVE is run on
a single shard—there is just one database for all
markets. On average, there are more than 14.4
trades that take place every second throughout
the EVE Universe during a 24 hour period.
Figure 17: Total trade value in Jita - by hour from midnight through midnight.
The average trade value ranged between 10 and 16 million ISK, but of course there is a high vari-
ability ranging from just few ISK for ammunition to billions of ISK for a jump freighter.
The sandbox feature of EVE encourages that characters are specialized in particular field. Hence
there is a special breed of characters in-game that focus on trade and other industrial activities.
There were 17,000 characters that traded in Jita on that particular day, giving an average trade of
13.4 trades per character. Of those 17,000, 14,000 jumped in/out of the system, and 3,000 thou-
sand stayed in station.
Jita is truly the trade hub of EVE, where anyone can find anything they need to survive in the game.
It is both a trade hub for commodities such as minerals and fuel as well as a market for highly
specialized vessels and items.
The most traded Tech II ship is the Hulk, with 241 ships traded for a total market value of 30.5 billion
ISK. The most traded Tech I ship, in terms of value, is the Raven, with 264 ships traded for a total
market value of 19.9 billion ISK. The most traded ship, in terms of volume, is the Drake, with 289
ships traded during this 24 hour period on December 6th, 2009.
The item that had the highest overall trade value was PLEX – the Pilot License Extension. It was by
far the highest trade value, with 328 billion ISK used to trade 1,159 individual PLEXes. The second
most traded item was Tritanium, with a total trade value of 82.5 Billion ISK.
The items traded in the greatest quantities were minerals, with Tritanium topping the list with a
daily trade volume of 29 billion units. This is almost five times as much as the next item, Pyerite,
with 6 billion units. The top 25 items are all minerals, moon material, fuel and other items that are
needed in large quantities for production or operation of player owned structures, such as control
towers, starbases and other facilities in space.
In a given day, only 2.5% of all characters are actively trading in EVE. That means that the rest
of the characters are located around the game universe doing what they think is most interesting
to them, be it manufacturing, mission running, exploring or hunting down other players. And the
effects of Jita reach far beyond this 2.5%, since many people have market alts for price checks
located there, which in turn impacts prices throughout EVE. It is the same with Jita as it was with
Rome – all roads lead to it.
30 31
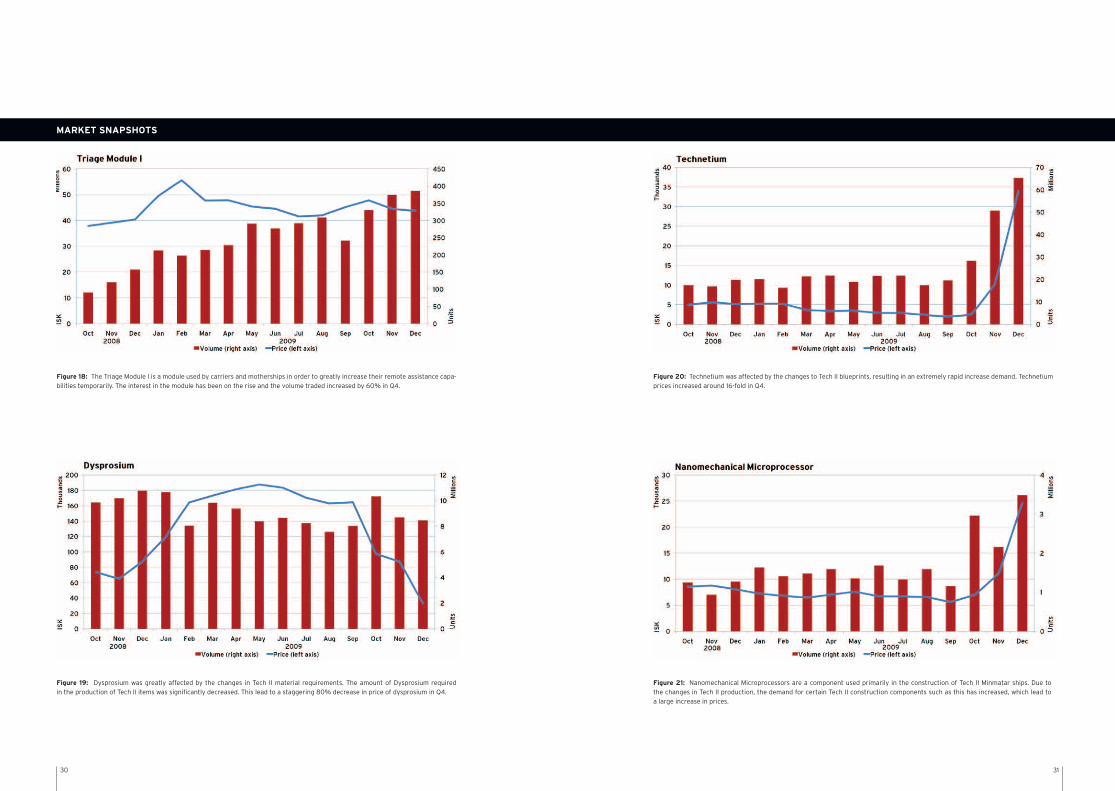
Figure 18: The Triage Module I is a module used by carriers and motherships in order to greatly increase their remote assistance capa-bilities temporarily. The interest in the module has been on the rise and the volume traded increased by 60% in Q4.
Figure 20: Technetium was affected by the changes to Tech II blueprints, resulting in an extremely rapid increase demand. Technetium prices increased around 16-fold in Q4.
Figure 19: Dysprosium was greatly affected by the changes in Tech II material requirements. The amount of Dysprosium required in the production of Tech II items was significantly decreased. This lead to a staggering 80% decrease in price of dysprosium in Q4.
Figure 21: Nanomechanical Microprocessors are a component used primarily in the construction of Tech II Minmatar ships. Due to the changes in Tech II production, the demand for certain Tech II construction components such as this has increased, which lead to a large increase in prices.
MARKET SNAPSHOTS
32 33
MARKET SNAPSHOTS
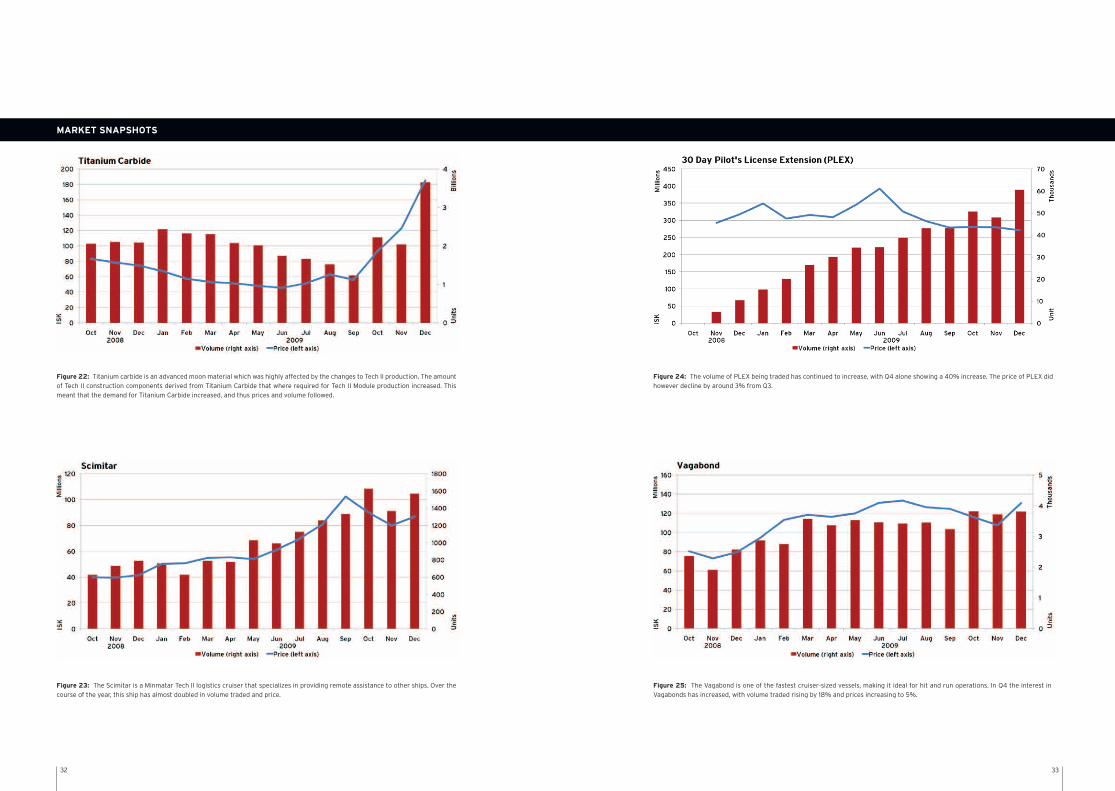
Figure 22: Titanium carbide is an advanced moon material which was highly affected by the changes to Tech II production. The amount of Tech II construction components derived from Titanium Carbide that where required for Tech II Module production increased. This meant that the demand for Titanium Carbide increased, and thus prices and volume followed.
Figure 24: The volume of PLEX being traded has continued to increase, with Q4 alone showing a 40% increase. The price of PLEX did however decline by around 3% from Q3.
Figure 23: The Scimitar is a Minmatar Tech II logistics cruiser that specializes in providing remote assistance to other ships. Over the course of the year, this ship has almost doubled in volume traded and price.
Figure 25: The Vagabond is one of the fastest cruiser-sized vessels, making it ideal for hit and run operations. In Q4 the interest in Vagabonds has increased, with volume traded rising by 18% and prices increasing to 5%.

34 35
MARKET SNAPSHOTS
Figure 26: The Hulk is the most popular specialized mining ship in EVE. During Q4, a campaign was launched by a group of players with the aim of attacking and destroying as many Hulk-class vessels as possible, which can be speculated as being one of the reasons behind the increase in the price of the Hulk towards the end of the Quarter. It is, however, worth noting that the volume of Hulks being traded did not increase to match this.
Figure 27: Enhanced Ward Consoles are salvage materials used in the production of Tech II rigs. The price of Enhanced Ward Consoles more than doubled in Q4, which is very much inline with the increased demand for Tech II shield rigs.
36 37
MARKET SNAPSHOTS
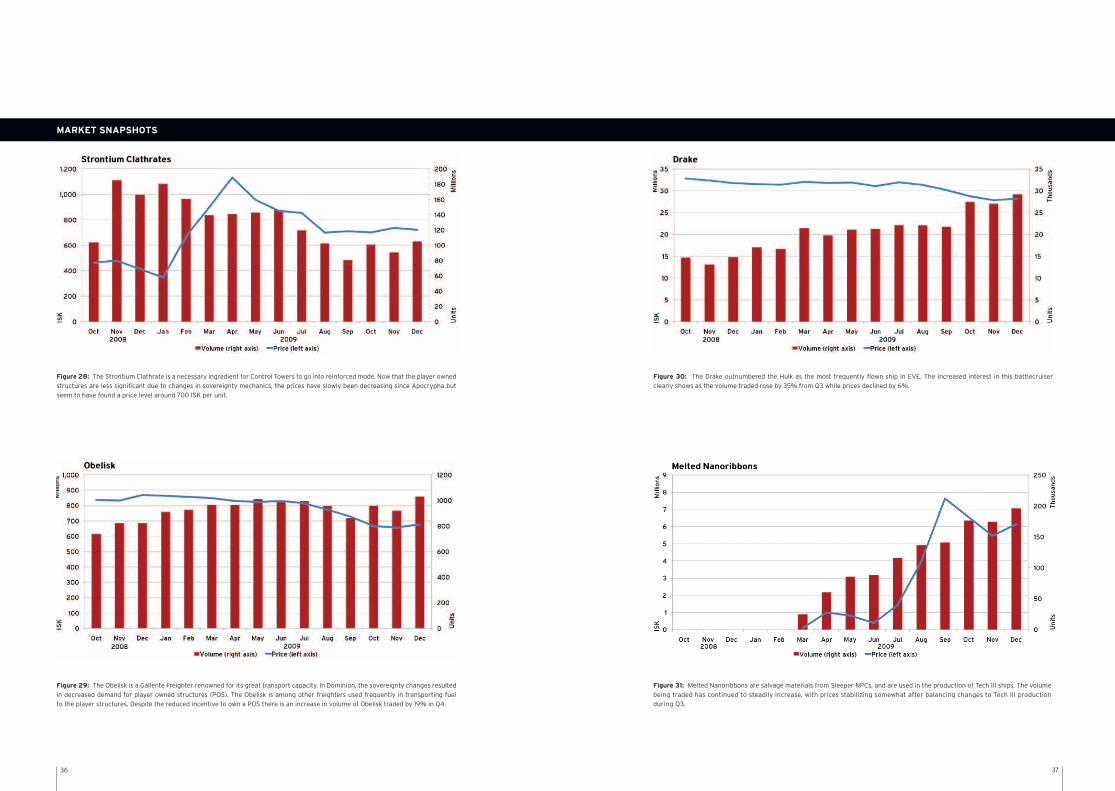
Figure 28: The Strontium Clathrate is a necessary ingredient for Control Towers to go into reinforced mode. Now that the player owned structures are less significant due to changes in sovereignty mechanics, the prices have slowly been decreasing since Apocrypha but seem to have found a price level around 700 ISK per unit.
Figure 30: The Drake outnumbered the Hulk as the most frequently flown ship in EVE. The increased interest in this battlecruiser clearly shows as the volume traded rose by 35% from Q3 while prices declined by 6%.
Figure 29: The Obelisk is a Gallente Freighter renowned for its great transport capacity. In Dominion, the sovereignty changes resulted in decreased demand for player owned structures (POS). The Obelisk is among other freighters used frequently in transporting fuel to the player structures. Despite the reduced incentive to own a POS there is an increase in volume of Obelisk traded by 19% in Q4.
Figure 31: Melted Nanoribbons are salvage materials from Sleeper NPCs, and are used in the production of Tech III ships. The volume being traded has continued to steadily increase, with prices stabilizing somewhat after balancing changes to Tech III production during Q3.
38 39
MARKET SNAPSHOTS
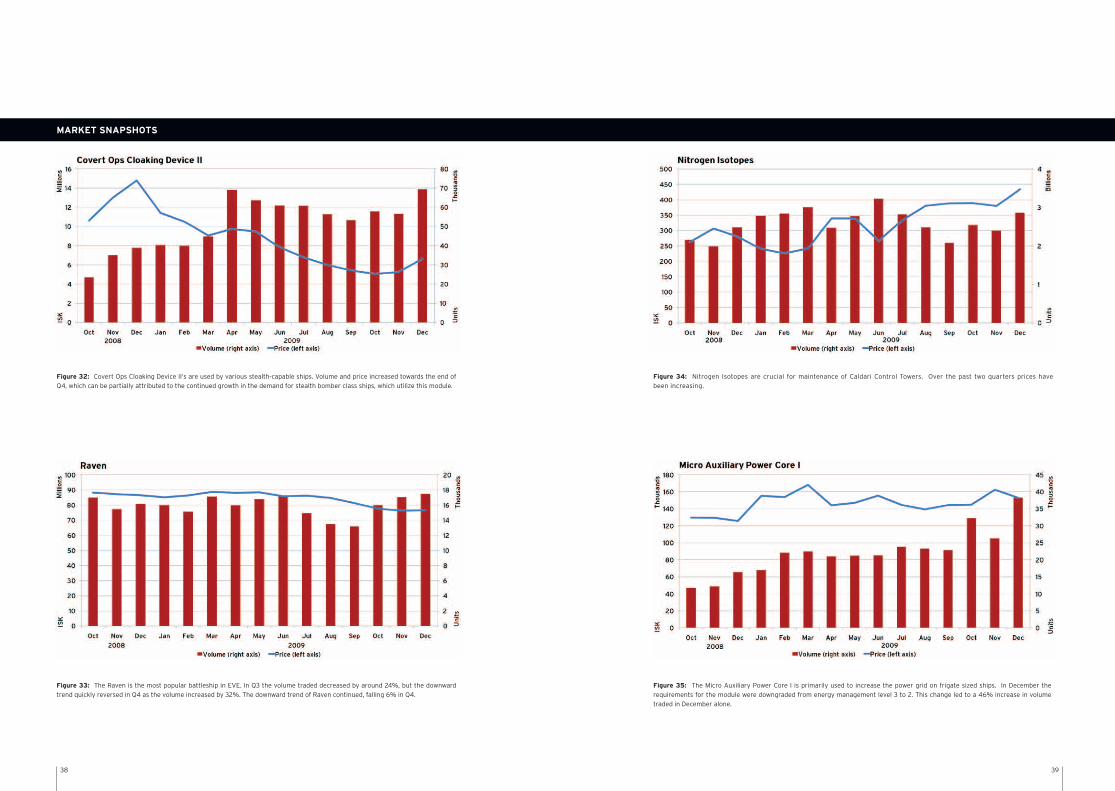
Figure 32: Covert Ops Cloaking Device II‘s are used by various stealth-capable ships. Volume and price increased towards the end of Q4, which can be partially attributed to the continued growth in the demand for stealth bomber class ships, which utilize this module.
Figure 34: Nitrogen Isotopes are crucial for maintenance of Caldari Control Towers. Over the past two quarters prices have been increasing.
Figure 33: The Raven is the most popular battleship in EVE. In Q3 the volume traded decreased by around 24%, but the downward trend quickly reversed in Q4 as the volume increased by 32%. The downward trend of Raven continued, falling 6% in Q4.
Figure 35: The Micro Auxiliary Power Core I is primarily used to increase the power grid on frigate sized ships. In December the requirements for the module were downgraded from energy management level 3 to 2. This change led to a 46% increase in volume traded in December alone.
40 41
MARKET SNAPSHOTS
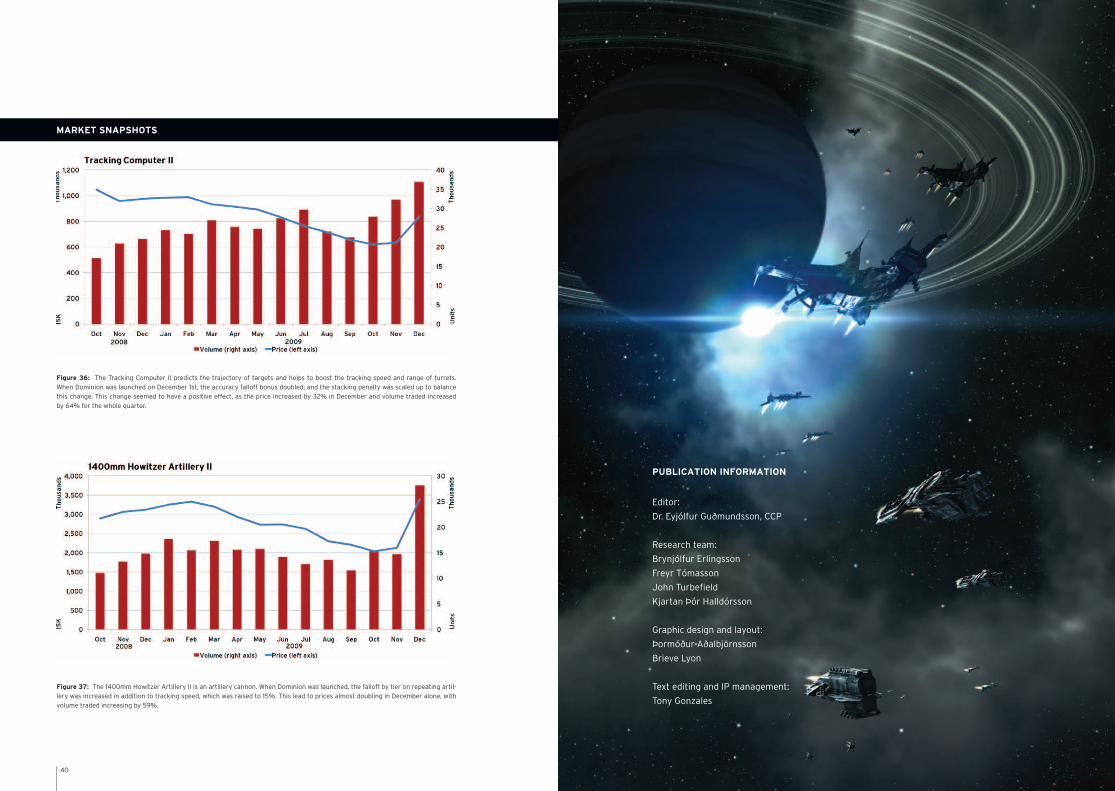
Figure 36: The Tracking Computer II predicts the trajectory of targets and helps to boost the tracking speed and range of turrets. When Dominion was launched on December 1st, the accuracy falloff bonus doubled, and the stacking penalty was scaled up to balance this change. This change seemed to have a positive effect, as the price increased by 32% in December and volume traded increased by 64% for the whole quarter.
Figure 37: The 1400mm Howitzer Artillery II is an artillery cannon. When Dominion was launched, the falloff by tier on repeating artil-lery was increased in addition to tracking speed, which was raised to 15%. This lead to prices almost doubling in December alone, with volume traded increasing by 59%.
PUBLICATION INFORMATION
Editor:
Dr. Eyjólfur Guðmundsson, CCP
Research team:
Brynjólfur Erlingsson
Freyr Tómasson
John Turbefield
Kjartan Þór Halldórsson
Graphic design and layout:
Þormóður Aðalbjörnsson
Brieve Lyon
Text editing and IP management:
Tony Gonzales

© 2010 CCP hf. All rights reserved. Reproduction without the written permission of the pub-lisher is expressly forbidden. EVE, EVE Online, CCP logo are registered trademarks of CCP hf.