quartz-seq2: a high-throughput single-cell rna-sequencing ... · (4)the fourth step is...
TRANSCRIPT
METHOD Open Access
Quartz-Seq2: a high-throughput single-cellRNA-sequencing method that effectivelyuses limited sequence readsYohei Sasagawa1†, Hiroki Danno1†, Hitomi Takada2†, Masashi Ebisawa1, Kaori Tanaka1, Tetsutaro Hayashi1,Akira Kurisaki2* and Itoshi Nikaido1,3*
Abstract
High-throughput single-cell RNA-seq methods assign limited unique molecular identifier (UMI) counts as geneexpression values to single cells from shallow sequence reads and detect limited gene counts. We thus developed ahigh-throughput single-cell RNA-seq method, Quartz-Seq2, to overcome these issues. Our improvements in thereaction steps make it possible to effectively convert initial reads to UMI counts, at a rate of 30–50%, and detectmore genes. To demonstrate the power of Quartz-Seq2, we analyzed approximately 10,000 transcriptomes from invitro embryonic stem cells and an in vivo stromal vascular fraction with a limited number of reads.
Keywords: High-throughput single-cell RNA-seq, Flow cytometry, Cell sorter, Quartz-Seq, Poly(A) tagging,Stromal vascular fraction, Mesenchymal stem cell
BackgroundSingle-cell transcriptome analysis is a powerful tool to iden-tify nongenetic cellular heterogeneity, which includes differ-ences in cell type due to differentiation and differences incell state within a cell population. In previous studies,various methods for single-cell RNA-seq were developed[1–19]. Some of these that generate read coverage across alltranscripts have been exploited to detect alternative tran-scription splicing isoforms [14, 17], and others using aunique molecular identifier (UMI) have been applied toquantify the number of transcripts expressed in a cell [1–3,6, 7, 9, 11–13, 20]. To extract substantial information on acell population, such as the composition of different celltypes or the distribution of cell states, it is necessary toanalyze hundreds or thousands of cells. Cell barcoding is akey technology for this, which enables us to deal with sam-ples from numerous cells in a single tube. Cell barcodingtechnology, which tags nucleotides unique to each cell to
target RNA molecules from that cell, is a key technology forincreasing the throughput of single-cell RNA-seq [16, 18].Mixing cDNA tagged with cell barcodes before whole-transcript amplification decreases the cost of reaction re-agents and the laboriousness of experimental steps. Thereare two types of cell barcoding technology according to themethod of cell sampling used. One method involves singlecells being selectively sorted to multi-well plates using flowcytometry, which allows us to remove dead or aggregatedcells. Besides, transcriptome data can be linked to cellularinformation obtained by flow cytometry. The other methodinvolves single cells and barcoded beads being captured inwater-in-oil droplets using droplet-generation microfluidicdevices [6, 7]. In this latter method, thousands of cells canprobabilistically be captured in half an hour. However, thetotal number of sequence reads generated by a deep sequen-cer is still limited. To increase the number of analyzed cells,each cell is assigned a limited number of initial sequencereads. For example, approximately 400 million initial fastqreads were sequenced for 3000–4000 cells in several previ-ous studies [6, 7]. In this case, the input data size for a singlecell involves shallow initial reads (100,000 fastq reads;Fig. 1b). UMI counts were converted from shallow initial se-quence reads for each cell, the conversion ratio of whichwas limited to approximately one-tenth [21]. Ideally, greater
* Correspondence: [email protected]; [email protected]†Equal contributors2Laboratory of Stem Cell Technology, Graduate School of Biological Sciences,Nara Institute of Science and Technology, Takayama-cho 8916-5, Ikoma, Nara,Japan1Bioinformatics Research Unit, Advanced Center for Computing andCommunication, RIKEN, Hirosawa 2-1, Wako, Saitama, JapanFull list of author information is available at the end of the article
© The Author(s). 2018 Open Access This article is distributed under the terms of the Creative Commons Attribution 4.0International License (http://creativecommons.org/licenses/by/4.0/), which permits unrestricted use, distribution, andreproduction in any medium, provided you give appropriate credit to the original author(s) and the source, provide a link tothe Creative Commons license, and indicate if changes were made. The Creative Commons Public Domain Dedication waiver(http://creativecommons.org/publicdomain/zero/1.0/) applies to the data made available in this article, unless otherwise stated.
Sasagawa et al. Genome Biology (2018) 19:29 https://doi.org/10.1186/s13059-018-1407-3

b
a
c
Fig. 1 Overview of Quartz-Seq2 experimental processes. a Quartz-Seq2 consists of five steps. (1) Each single cell in a droplet is sorted into lysis buffer ineach well of a 384-well PCR plate using flow cytometry analysis data. (2) Poly-adenylated RNA in each well is reverse-transcribed into first-strand cDNA withreverse transcription primer, which has a unique cell barcode (CB). We prepare 384 or 1536 kinds of cell barcode with a unique sequence based on theSequence–Levenshtein distance (SeqLv). The edit distance of SeqLv is 5. The RT primer also has a UMI sequence for reduction of PCR bias (MB) and a poly(dT) sequence for binding to poly(A) RNA. (3) Cell barcode-labeled cDNAs from all 384 wells are promptly collected by centrifugation using assembled col-lectors. (4) Collected first-strand cDNAs are purified and concentrated for subsequent whole-transcript amplification. In the poly(A) tailing step, purified cDNAis extended with a poly(A) tail by terminal deoxynucleotidyl transferase (TdT). Subsequently, second-strand cDNA is synthesized with a tagging primer,which has a poly(dT) sequence. The resulting second-strand cDNA has a PCR primer sequence (M) at both ends of it. The cDNA is amplifiable in a subse-quent PCR amplification. (5) For conversion from amplified cDNA to sequence library DNA, we fragment the amplified cDNA using the ultrasonicator Cov-aris. Such fragmented cDNA is ligated with a truncated Y-shaped sequence adaptor, which has an Illumina flow-cell binding sequence (P7) and a poolbarcode sequence (PB). The PB makes it possible to mix different sets of cell barcode-labeled cDNA. Ligated cDNA, which has CB and MB sequences, isenriched by PCR amplification. The resulting sequence library DNA contains P7 and P5 flow-cell binding sequences at respective ends of the DNA. Wesequence the cell barcode site and the UMI site at Read1, the pool barcode site at Index1, and the transcript sequence at Read2. b The relationshipbetween initial fastq reads and the number of single cells for sequence analysis in NextSeq500 runs. Typically, one sequence run with NextSeq 500/550High Output v2 Kit reads out 400–450 M fastq reads. The x-axis represents the input cell number for one sequence run. The y-axis represents the initial datasize (fastq reads) on average per cell. The red outline represents the typical range of shallow input read depth for a single cell. c We define the formula forcalculating the UMI conversion efficiency. Each parameter is defined as follows: UMIsc is the number of UMI counts, assigned to a single-cell sample, fastqscis the number of fastq reads derived from each single-cell sample, fastqnon-sc is the number of fastq reads derived from non-single-cell samples, whichinclude experimental byproducts such as WTA adaptors, WTA byproducts, and non-STAMPs. Initial fastq reads are composed of fastqsc and fastqnon-sc
Sasagawa et al. Genome Biology (2018) 19:29 Page 2 of 24
UMI counts should be generated from limited sequencereads because the increase in UMI count assigned to eachcell leads to the detection of low-copy genes and the identi-fication of cell type-specific genes using statistical tests.In this study, we developed a novel high-throughput
single-cell RNA-seq method, Quartz-Seq2. As Quartz-Seqis a sensitive and reproducible single-cell RNA-seq method,Quartz-Seq2 was developed based on it [15]. Quartz-Seq is based on a poly(A) tagging strategy. By the com-bination of molecular biological improvements, includ-ing major improvement of poly(A) tagging, Quartz-Seq2resulted in an increase in the effectiveness with whichthe initial sequence reads were converted to the expres-sion UMI counts (UMI conversion efficiency 30–50%).To demonstrate the highly effective use of initial readsin Quartz-Seq2, we analyzed a population of approxi-mately 9000 mouse embryonic stem (ES) cells as invitro cells and approximately 1000 cells from the stro-mal vascular fraction (SVF) as in vivo cells.
ResultsOutline of Quartz-Seq2 experimentTo increase the UMI conversion efficiency (Fig. 1), we im-proved several steps in the preparation of the single-cellRNA-seq library (Additional file 1: Figure S1), resulting inthe development of Quartz-Seq2. Below, we explain thefive steps of the Quartz-Seq2 procedure (Fig. 1).
(1)The first step is single-cell collection using a cellsorter. We selectively sort living single cells into lysisbuffer in a 384-well PCR plate without dead cells. Incell sorting, various types of channel information, suchas the intensity of fluorescence, are obtained for eachcell. This enables us to link the transcriptome to cellu-lar information from a cell sorter for each cell.
(2)The second step is cell barcoding. Each well containslysis buffer and reverse-transcription (RT) primer,which includes a cell barcode sequence (14- or 15-mer), a UMI sequence (8-mer), and an oligo-dT se-quence (24-mer). Using these RT primers, respectiveRNA from single cells is converted to cDNA withunique cell barcodes. Note that a long RT primer re-sulted in a severe problem regarding the synthesis ofbyproducts at the downstream reaction in our sys-tem (Additional file 1: Figure S2 and Supplementalnote). Therefore, we use a relatively short RT primer(73- or 74-mer), which allows us to skip the step ofremoving byproducts using exonuclease I. We designtwo types of RT primer set (v3.1, 384 barcodes; v3.2,1536 barcodes). Within each primer set, barcode se-quences are designed such that the minimum Se-quence–Levenshtein distance between twosequences should be greater than 5, which leads tothe correction of mutations of two nucleotides,
including substitution, insertion, or deletion in se-quence reads [22]. We also optimize the buffer andtemperature in the RT reaction, leading to an im-provement of RT efficiency from that of the originalQuartz-Seq (Additional file 1: Figure S3 and Supple-mental note). We apply a low enzyme concentrationin RT to Quartz-Seq2. These conditions reduce thecost and technical variability of Quartz-Seq2. We de-scribe the details of this in the “Reduction of enzymeconcentration in RT decreased the experimental costof Quartz-Seq2” section.
(3)The third step involves the pooling of cell-barcodedcDNA. By cell barcoding, Quartz-Seq2 can poolcDNA of up to 1536 individual cells into one mixture.We developed a rapid and high-throughput methodfor collecting small volumes of cDNA in multiwellplates. This method also achieves higher efficiency ofcollection than dispensing with pipettes and tips (Add-itional file 1: Figure S4 and Supplemental note). As theefficiency of cDNA purification after pooling was93.77%, we estimated that approximately 80% of cell-barcoded cDNA could be used for subsequent whole-transcript amplification in our system (Additional file 1:Figure S3a and Supplemental note).
(4)The fourth step is whole-transcript amplificationbased on an improved poly(A) tagging strategy. Poly(A) tagging is one of the methods of converting first-strand cDNA to amplifiable cDNA. First-strandcDNA is extended with a poly(A) tail by the terminaltransferase. Subsequently, second-strand cDNA issynthesized with tagging primers that contain a poly(dT) sequence, followed by PCR amplification. Here,we improve the efficiency of poly(A) tagging by 3.6-fold. This improvement is a crucial point in the de-velopment of Quartz-Seq2. We describe the detailsof this in the next subsection.
(5)The fifth step is library preparation for deepsequencing. Amplified cDNA is fragmented, ligatedwith the sequence adapter, and amplified by PCR. Insequencing using Illumina sequencers, a sequencefor a cell barcode and a UMI is read in Read1, whilea sequence for a region of a transcript (mRNA) isread in Read2.
Improvement of poly(A) tagging efficiencyWe previously reported Quartz-Seq based on the poly(A)tagging strategy, which has significant potential for detect-ing a large number of genes expressed in a cell [15]. How-ever, the efficiency of poly(A) tagging itself for single-cellRNA-seq has not been improved. We hypothesized thatthe improvement of poly(A) tagging would lead to highUMI conversion efficiency. Therefore, we attempted toimprove the efficiency of this tagging step. Poly(A) taggingis composed of two processes: (1) the first-strand cDNA is
Sasagawa et al. Genome Biology (2018) 19:29 Page 3 of 24

modified with a poly(A) tail by terminal deoxynucleotidyltransferase; and (2) the poly(A)-tailed cDNA is annealedwith a tagging primer, which has a poly(dT) sequence.Then, the second-strand cDNA is extended. The resultingsecond-strand cDNA is amplifiable cDNA, which has aPCR primer sequence at both ends of it.It is known that the DNA yield of amplified cDNA
generally reflects the quantitative performance ofsingle-cell RNA-seq methods [3, 13, 14]. Thus, we de-termined the effects of various buffers for the poly(A)tailing step on the amplified cDNA yield. We per-formed the poly(A) tailing reaction with variousbuffers using purified first-strand cDNA from 1 ng oftotal RNA (Fig. 2a; Additional file 1: Figure S5).Finally, we obtained amplified cDNA. We found thatthe use of T55 buffer in the poly(A) tailing reactionefficiently improved the cDNA yield (Fig. 2a). Theamount of amplified cDNA increased 2.88-fold usingT55 buffer compared with the level using Quartz-Seqbuffer (Fig. 2a). In these buffer conditions, we did notobserve any obvious byproducts derived from the RTprimer (Fig. 2a; Additional file 1: Figures S2 and S5and Supplemental note).Next, we added an “Increment” temperature condition
for the tagging and second-strand synthesis steps (see“Methods”). In this condition, the reaction temperatureof these steps was gradually increased. As a result, theamount of cDNA tended to increase, by approximately1.2-fold (Fig. 2a). Moreover, upon combining T55 bufferand the Increment condition, the amount of cDNA in-creased approximately 3.6-fold. We also confirmed thereproducibility of this phenomenon of cDNA incrementin additional experiments (Additional file 1: Figure S5).Moreover, we confirmed the amplified cDNA yield ofvarious genes by qPCR analysis as another assay. Specific-ally, we determined the qPCR scores of eight genes fromamplified cDNA and nonamplified cDNA (Additionalfile 1: Figure S5c). Spearman’s rank correlation coefficients(SCCs) between amplification and nonamplification wereapproximately 0.79 in the T55 + Increment condition.The SCC was approximately 0.66 in Quartz-Seq-likeconditions. We also observed clear increments of qPCRscores for almost all genes. These results show that thecombination of T55 buffer and this temperature condi-tion improved the efficiency of the poly(A) tagging step.We also found that other conditions (NBF40 + Incre-ment) improved the cDNA yield. Under these condi-tions, however, byproducts were clearly synthesized(Additional file 1: Figures S2c and S5b). Moreover, theamount of cDNA with T55 buffer was slightly greaterthan that with RH55 (Fig. 2; Additional file 1: FigureS5a). Therefore, we used the combination of T55 bufferand the Increment temperature condition for the poly(A) tagging strategy for Quartz-Seq2.
Reduction of enzyme concentration in RT decreased theexperimental cost of Quartz-Seq2The cost of experiments for the single-cell RNA-seqmethod is one of the most important benchmarks regardinghigh-throughput performance. The cost of experimentalpreparation per cell was approximately ¥2600 ($23) for ourpreviously reported Quartz-Seq, which does not use cellbarcoding (Additional file 1: Figure S6a). To improve onthis value, we first applied the “RT100” enzyme condition inRT to Quartz-Seq2. In this condition, we used approxi-mately 20 U reverse transcriptase in 2 μL of solution forRT. This enzyme concentration in the RT reaction isbroadly used for various molecular biological applications,including single-cell RNA-seq methods [3, 14, 15]. By usingthe cell barcoding strategy, the cost of experimental prepar-ation for Quartz-Seq2 under the RT100 condition was re-duced (¥122 or $1.08 per cell; Additional file 1: Figure S6a).We found that 65% of the cost of experimental steps is
derived from RT in Quartz-Seq2 under the RT100 condi-tion (Additional file 1: Figure S7a). To further reduce thecost of experimental preparation of sequence libraries on alarge scale, we investigated the effect of a low enzyme con-centration in RT in Quartz-Seq2. In the assessment assay,we noticed that a low enzyme concentration did not mark-edly affect the efficiency of RT in T100 buffer (Additionalfile 1: Figure S7b). We performed a similar experiment witha broader range of concentrations of enzymes in RT underconditions with T100 buffer (Fig. 2b; Additional file 1:Figure S7c). We found that the RT25 condition maintainedthe efficiency of RT at the 99% level on average, which wascomparable to that in the RT100 condition. Therefore, weprepared three technical replicates of a 384-well PCR platewith 10 pg of total RNA with the RT100 condition or the“RT25” low-enzyme condition. In the RT25 condition, thecDNA yield showed a tendency for a slight increase ofapproximately 1.17-fold, which although not being a majorimprovement, did at least not involve a decrease(Additional file 1: Figure S7d). The cost of experimentalpreparation per cell was approximately ¥46–63 ($0.40–0.56) in the RT25 condition (Additional file 1: Figure S6a).We thus mainly used the RT25 condition for Quartz-Seq2.
Evaluation of the quantitative performance of Quartz-Seq2using 10 pg of purified total RNAFinally, we adopted three molecular biological improve-ments (poly(A) tailing buffers (T55), the Incrementtemperature condition, and low-enzyme concentration(RT25) in RT) for Quartz-Seq2 (Additional file 1: FigureS1). To determine the technical variability and specificity ofQuartz-Seq2, we performed whole-transcript amplificationusing 10 pg of diluted mouse total RNA as a single cell-likeaveraged sample with the v3.1384 cell barcode RT primer ina 384-well plate (Fig. 2). In this experiment, we used theRT25 enzyme concentration for Quartz-Seq2. The effect of
Sasagawa et al. Genome Biology (2018) 19:29 Page 4 of 24

RT enzyme concentration on the quantitative performanceis specifically described in the last paragraph of this subsec-tion. We analyzed 10 pg of total RNA in all wells at
approximately 0.19 M fastq reads on average per well. Inthe case of the Quartz-Seq-like conditions, we detected18,407 ± 4040 UMI counts and 5728 ± 604 gene counts
ba
0
1
2
3
4
5
6
7
8
Qua
rtzB
NE
B2
T55
RH
55
Qua
rtzB
NE
B2
T55
RH
55
Byproducts (BA: 50-300bp)
cDNA (BA: 300-9,000bp)
Rel
ativ
e D
NA
yie
ld (
n=3)
TdTBuffer
p=0.00011
p=0.0053
p=0.038
p=0.00002
p=0.0002
Increment (-) Increment (+)Taggingcondition
20
120110100
90807060504030
010
100%
(R
T10
0)
50%
25%
(R
T25
)
12.5
%
6.25
% (
RT
6.25
)
3.12
5%
1.56
25%
0.78
12%
0.39
06%
0.09
76%
0.19
53%
0.04
88%
0.02
44%
0.01
22%
0.00
61%
0% (
RT
0)
Ave
rage
of r
elat
ive
RT
-qP
CR
sco
refr
om 1
0 ge
nes
(%)
(n=
5)
Data points using respective concentration of RT enzymes
c
mean: > 99%
Tot
al n
umbe
r of
UM
I cou
ntpe
r 10
pg
mou
se to
tal R
NA
Tot
al n
umbe
r of
det
ecte
d ge
nepe
r 10
pg
mou
se to
tal R
NA
Qua
rtz-
Seq
like
with
UM
I (n=
768)
Qua
rtz-
Seq
2(R
T25
) (n
=1,
152)
Qua
rtz-
Seq
like
with
UM
I (n=
768)
Qua
rtz-
Seq
2(R
T25
) (n
=1,
152)
h
[0.19 million fastq reads/10pg total RNA]d
0.00
0.05
0.10
0.15
0.20
−15 −10 -5 0Gene expression variability (log10(CV))
Den
sity
Quartz-Seq likewith UMI (n=768)
Quartz-Seq2(RT25) (n=1,152)
f
g
Spe
arm
an c
orre
latio
n of
gen
e ex
pres
sion
(10
pg to
tal R
NA
vs
10 p
g to
tal R
NA
)
Spe
arm
an c
orre
latio
n of
gen
e ex
pres
sion
(10
pg to
tal R
NA
vs
10 p
g to
tal R
NA
)
Spe
arm
an c
orre
latio
n be
twee
n U
MI c
ount
and
the
num
ber
of in
put m
olec
ule
Poisson
10-3
10-1
101
103
10-3 10110-1 103T
he v
aria
blity
of
gene
exp
ress
ion
(CV
2 )The mean of gene expression
Quartz-Seq2 (n=1,152)
0
20,000
40,000
60,000
0
2,500
5,000
7,500
10,000
1.0
0.8
0.6
0.4
1.0
0.8
0.7
0.9
0.5
0.6
1.0
0.8
0.6
0.4
Qua
rtz-
Seq
like
with
UM
I (n=
768)
Qua
rtz-
Seq
2(R
T25
) (n
=1,
152)
Qua
rtz-
Seq
like
with
UM
I (n=
768)
Qua
rtz-
Seq
2(R
T25
) (n
=1,
152)
<Technical reproducibility of gene expression> <Accuracy of gene expression>
Internal genes ERCC spike-inQ
uart
z-S
eq li
kew
ith U
MI (
n=76
8)
Qua
rtz-
Seq
2(R
T25
) (n
=1,
152)
1.0
0.8
0.6
0.4
Qua
rtz-
Seq
like
with
UM
I (n=
768)
Qua
rtz-
Seq
2(R
T25
) (n
=1,
152)
Spe
arm
an c
orre
latio
n of
gen
e ex
pres
sion
(10
pg to
tal R
NA
vs
1ug
tota
l RN
A)
ERCC spike-inInternal genes
e
101100 102 103 104100
101
102
103
104 SCC 0.855
Bulk polyA-RNA-seq (TPM + 1)
Ave
rage
d U
MI c
ount
(Sca
led)
Quartz-Seq2 (n=1,152)
-3.11±2.07-4.16±2.40
mean±S.D.
Fig. 2 Sequence performance of Quartz-Seq2 with molecular biological improvements. a Improvement of poly(A) tagging efficiency. The relative DNA yieldin various poly(A) tagging conditions using purified first-strand cDNA from 1 ng of total RNA. T55 buffer as the terminal deoxynucleotidyl transferase (TdT)buffer and the temperature condition “Increment” for the poly(A) tagging step improved the cDNA yield of whole-transcript amplification. Buffercompositions are indicated in Additional file 6: Table S5. QuartzB represents use of a Quartz-Seq-like buffer as a positive control, in accordance with theapproach described in the original Quartz-Seq paper. Finally, we quantified cDNA yield (300–9000 bp) and byproduct DNA yield (50–300 bp) using aBioanalyzer (Agilent). The presented p value was obtained using two-tailed Welch’s t-test. b Reverse transcription efficiency with serially diluted RT enzymes.The x-axis represents the average relative RT qPCR score from ten genes. Detailed concentrations of RT enzymes are presented in Additional file 1: FigureS7. c, f–h Comparison between Quartz-Seq2 in the RT25 condition and Quartz-Seq-like conditions regarding sequence performance. cWe analyzed 384wells with 10 pg of total RNA and used approximately 0.19 M fastq reads on average per well. We show the UMI count and gene count in box plots. d Ascatter plot between the mean of gene expression and the variability of gene expression with 10 pg of total RNA in 384 wells. Red lines represent thetheoretical variability of gene expression in the form of a Poisson distribution. e Gene expression reproducibility between bulk poly(A)-RNA-seq (1 μg of totalRNA) and Quartz-Seq2 (10 pg of total RNA, averaged over 384 wells). f Dispersion of gene expression. The x-axis represents gene expression variability. g Re-producibility of gene expression for internal gene and external control RNA. h Accuracy of gene expression for internal gene and external control RNA
Sasagawa et al. Genome Biology (2018) 19:29 Page 5 of 24
(n = 768 wells from two 384-well plates). In the case ofQuartz-Seq2, we achieved a UMI count of 44,100 ±7521 and a gene count of 7442 ± 484 (n = 1152 wellsfrom three 384-well plates; Fig. 2c). We observed simi-lar results at the level of individual 384-well plates(Additional file 1: Figure S8a). We also calculated theUMI conversion efficiency for the respective protocol atapproximately 0.19 million initial fastq reads on averageper well. We defined the formula for calculating the“UMI conversion efficiency”, which indicates how ef-fectively initial fastq reads can be converted to UMIcounts (Fig. 1c; Additional file 1: Figure S9). The UMIconversion efficiency levels of Quartz-Seq2 and Quartz-Seq-like were about 22.88% and 9.55%, respectively.The UMI conversion efficiency was reproducible amongindividual 384-well plates (Additional file 1: Figure S8a).In addition, the UMI conversion efficiency depended onthe Read2 length and the number of initial fastq reads(Additional file 1: Figure S8b). These results indicatedthat the combination of the molecular biological improve-ments for Quartz-Seq2 clearly improved the conversionratio from target RNA to sequence library DNA.We also validated the technical reproducibility of gene
expression. In the mean-CV (coefficient of variation)plot, the technical gene expression variability of Quartz-Seq2 became fairly close to the theoretical variability of aPoisson distribution (Fig. 2d). The mean of gene expres-sion variability for Quartz-Seq2 was lower than that forthe Quartz-Seq-like method (Fig. 2f ). To quantify thetechnical reproducibility of internal gene expression andexternal gene (ERCC spike-in RNA) expression, we useda pairwise comparison of technical replicates for eachprotocol. Regarding the reproducibility of internal geneexpression, the SCCs of Quartz-Seq2 and Quartz-Seq-like were 0.71 ± 0.01 and 0.59 ± 0.02, respectively. Re-garding the reproducibility of external gene expression,the SCCs of Quartz-Seq2 and Quartz-Seq-like were 0.90± 0.02 and 0.83 ± 0.04, respectively. Subsequently, wevalidated the accuracy of internal/external gene expres-sion. We observed that the average internal gene expres-sion of Quartz-Seq2 highly correlated with the internalgene expression of conventional RNA-seq (Fig. 2e). Wecalculated all combinations of pairwise correlation be-tween the internal gene expression of Quartz-Seq2 with10 pg of total RNA and that of conventional RNA-seqwith 1 μg of total RNA. Moreover, we calculated thepairwise correlation between the external gene expres-sion of Quartz-Seq2 and the input molecule count of ex-ternal genes (ERCC spike-in RNA). Regarding theaccuracy of internal gene expression, the SCCs ofQuartz-Seq2 and Quartz-Seq-like were 0.70 ± 0.01 and0.60 ± 0.02, respectively. Regarding the accuracy of ex-ternal gene expression, the SCCs of Quartz-Seq2 andQuartz-Seq-like were 0.90 ± 0.01 and 0.74 ± 0.03,
respectively. These results indicate that the combinationof the molecular biological improvements for Quartz-Seq2 clearly improved the technical reproducibility andaccuracy of gene expression.We noted that a low enzyme concentration improved the
quantitative performance of Quartz-Seq2. We validated thequantitative performance with 10 pg of total RNA in theRT100 and RT25 conditions at various input data sizes. Un-expectedly, we found that the RT25 condition improved thequantitative performance (Additional file 1: Figure S8a). Wecompared RT25 with RT100 at approximately 0.096 Mfastq reads on average per well. In the case of Quartz-Seq2in the RT25 condition, we achieved a UMI count of 30,117± 789 and a gene count of 6320 ± 35 (three 384-well plates).In the case of Quartz-Seq2 in the RT100 condition, weachieved a UMI count of 25,671 ± 1020 and a gene countof 5889 ± 35 (three 384-well plates). We also observed thatthe well-to-well technical variability for the UMI count andgene count clearly decreased in the RT25 condition (Add-itional file 1: Figure S8a). These results showed that theRT25 low-enzyme condition clearly reduced the experimen-tal cost and improved the quantitative performance. Wethus applied the RT25 condition in subsequent experimentsusing real single cells. Note that, in the RT1.5625-RT6.25condition, RT efficiency was maintained at an average levelof over 90% (Fig. 2b). The average RT efficiency rapidly de-creased below the RT1.56 low enzyme concentration. Inaddition, in actual experiments (not serially diluted experi-ments) at conditions below RT3.12, it was not guaranteedthat enzymes could be collected given the viscosity and lowvolume of the mixture. Therefore, we validated the RT6.25condition for subsequent analysis. It seems that UMIcounts, gene counts, and ERCC capture efficiency (alsocalled “ERCC spike-in RNA detection efficiency”) slightlyincreased in the RT6.25 condition, which although not be-ing a major improvement, did at least not involve a decrease(Additional file 1: Figure S10). The cost of experimentalpreparation per cell was approximately ¥31–48 ($0.27–0.43) in the RT6.25 condition (Additional file 1: Figure S6a,Additional file 2: Table S1). The RT6.25 low-enzyme condi-tion thus further reduced the experimental cost and slightlyimproved the quantitative performance.
Quartz-Seq2 shows higher efficiency of UMI conversionand detects more biological pathways than Drop-seqIn the high-throughput single-cell RNA-seq methods,the total number of sequence reads generated by a deepsequencer is limited. Ideally, greater UMI counts shouldbe generated from limited sequence reads because theincrease in UMI count assigned to each cell leads to thedetection of low-copy genes and the identification of celltype-specific genes using statistical tests. We comparedQuartz-Seq2 to the high-throughput single-cell RNA-seqmethod using two distinct cell types. To prepare these
Sasagawa et al. Genome Biology (2018) 19:29 Page 6 of 24

two distinct cell types, we cultured G6GR ES cells andDex-treated G6GR cells because it has been reportedthat almost all G6GR ES cells differentiated into primi-tive endoderm-like cells upon dexamethasone treatment[15, 23]. Drop-seq is one of the high-throughput single-cell RNA-seq methods and can capture thousands ofcells and barcoded beads in half an hour [6]. The Drop-seq experiments were validated by species-mixing ana-lysis (Additional file 1: Figure S11a, b). We performedQuartz-Seq2 and Drop-seq on a mixture of mouse EScells and Dex-treated mouse ES cells (primitive endo-derm (PrE) cells) and calculated the UMI conversion effi-ciency (Fig. 3a and Additional file 1: Figure S11c). The
effectiveness of Quartz-Seq2 ranged from 25 to 35% de-pending on the initial fastq read depth (Fig. 3), whichwas higher than that of Drop-seq.As Fig. 3a shows, Quartz-Seq2 detected more genes
with high UMI conversion efficiency. To examine thepower for identifying differentially expressed genes, weperformed principal component analysis (PCA) and clus-tering. We randomly selected single cells from ES clustercells and PrE cluster cells. The number of genes differen-tially expressed between two distinct cell types was cal-culated (ES and PrE cells; Additional file 1: Figure S11h). We also identified differentially expressed genes(DEGs) between bulk ES cells and PrE cells by using
a
0
10,000
20,000
30,000
40,000
50,000
60,000
70,000
80,000
90,000
0
1,000
2,000
3,000
4,000
5,000
6,000
7,000
8,000
9,000
10,000
0
5
10
15
20
25
30
35
40
Tot
al n
umbe
r of
U
MI c
ount
per
cel
l
Tot
al n
umbe
r of
gene
cou
nt p
er c
ell
UM
I con
vers
ion
effic
ienc
y (%
)Quartz-Seq2(384 indexes)
Drop-seq(our lab’s setup)
Method
Initial fastq readson averageper cell (in million)
0.24 0.240.1 0.1
Quartz-Seq2(384 indexes)
Drop-seq(our lab’s setup)
Method
Initial fastq readson averageper cell (in million)
0.24 0.240.1 0.1
Quartz-Seq2(384 indexes)
Drop-seq(our lab’s setup)
Method
Initial fastq readson averageper cell (in million)
0.24 0.240.1 0.1
cDifferentially expressed genes Reactome pathway
Drop-seq
Quartz-Seq2
Bulk RNA-seq
155
261
5,472
2,730
2,490
663
98
68
54
4
22
2
12
5
Drop-seq
Quartz-Seq2
Bulk RNA-seq
565 33 9
Drop-seq
Quartz-Seq2
dGO terms on highly variable genes
bn=384 n=500
A
B
C
Bulk RNA-seqDifferentially expressed genes (10,847)between bulk ES and bulk PrE cells
Single-cell RNA-seq methodsDifferentially expressed genesbetween ES and PrE cells
The
num
ber
of o
verla
ppin
gdi
ffere
ntia
lly e
xpre
ssed
gen
es [B
]
The number of analyzed single-cell (X: ES n=X, PrE n=X)
Drop-seq (from ESC n=259, PrE n=227) Quartz-Seq2 (from ESC n=192, PrE n=184)
Rat
io o
f diff
eren
tially
exp
ress
ed g
enes
[B/(
B+
C)]
The number of analyzed single-cell (X: ES n=X, PrE n=X)
n=384 n=500 n=384 n=500
0
1,000
2,000
3,000
4,000
5,000
6,000
5 10 20 40 80 1600
0.1
0.2
0.3
0.4
0.5
0.6
0.7
0.8
0.9
1.0
5 10 20 40 80 h
Fig. 3 Quartz-Seq2 with high UMI conversion efficiency identified more differentially expressed genes and biological pathways. a UMI counts, gene counts,and UMI conversion efficiency for Quartz-Seq2 and Drop-seq experiments. These values depended on the initial fastq reads on average per cell. Error barsrepresent standard deviations. bWe calculated overlapping differentially expressed genes between bulk RNA-seq data and single-cell RNA-seq data. Werandomly picked up the indicated number of single cells and calculated differentially expressed genes 20 times. c, d We randomly selected 100 ES cellsand 100 PrE cells for each method. c Venn diagram of genes that were differentially expressed between the ES cluster and the Dex-treated ES (PrE) cluster,as identified by Quartz-Seq2, Drop-seq, and bulk RNA-seq (left). The number of genes that differed in expression level between ES and PrE cells by at leasttwofold was determined (FDR < 0.05). We also present a Venn diagram of the Reactome pathway (right). d Venn diagram of Gene Ontology (GO) terms forgenes with highly variable expression, as identified by Quartz-Seq2 and Drop-seq
Sasagawa et al. Genome Biology (2018) 19:29 Page 7 of 24

conventional bulk RNA-seq. We then counted the num-ber of overlapping DEGs between single-cell RNA-seqmethods and bulk RNA-seq. We observed that this num-ber linearly correlated with the cell number (Fig. 3b).Quartz-Seq2 required fewer cells for the detection ofoverlapping DEGs. These results showd that more genesthat were differentially expressed between the two celltypes were identified with Quartz-Seq2 (Fig. 3b, c). Inaddition, more biological pathways particularly associ-ated with the differentially expressed genes were detectedwith Quartz-Seq2 (Fig. 3c). Furthermore, we calculatedthe highly variable expression of genes with Quartz-Seq2and Drop-seq, which potentially include not only genesthat are differentially expressed between cell types butalso genes for which expression changes depending onthe cell state in a cell type. Terms related to the cellcycle state were only enriched for the genes calculatedwith Quartz-Seq2 (Fig. 3d). Note that simulation-basedpower analysis also showed that Quartz-Seq2 detectedmore DEGs than Drop-seq (Additional file 1: FigureS12a; see “Methods”). These results suggest that highUMI conversion efficiency with limited initial reads leadsto more biological information being revealed, such asfunctional terms and biological pathways.
Superiority of Quartz-Seq2 regarding quantitativeperformance in the same experimental designcompared with other methodsTo obtain additional evidence for the superiority ofQuartz-Seq2 in terms of the UMI conversion efficiencyand gene count, we compared it to other methods. Usingmouse J1 ES cells, Ziegenhain et al. systematically com-pared the quantitative performance of several single-cellRNA sequencing (RNA-seq) methods (CEL-seq2(C1),SCRB-seq, MARS-seq, and Drop-seq) that use the UMItechnique [21]. Therefore, we cultured J1 ES cells under2i/LIF conditions in accordance with the procedure de-scribed in this previous paper [21]. We sorted J1 ES cellsinto five 384-well plates. Subsequently, we prepared se-quence library DNA of Quartz-Seq2 (RT25) with 1152wells (three 384-well plates) or 768 wells (two 384-wellplates) on different days. To compare our data with thoseobtained in the previous study mentioned above, we usedthe same analytical conditions as previously applied, suchas a HiSeq sequencer platform, Read2 length, the samegenome file, and the same transcript annotation file.First, we compared the quantitative performance be-
tween Quartz-Seq2 and other methods at 0.1 million initialfastq reads on average per cell (Fig. 4). The results indicatethat the UMI conversion efficiency levels of Quartz-Seq2were approximately 32.55% (day 1) and 32.25% (day 2); theUMI conversion efficiency of the other methods rangedfrom 7.11 to 22.45%. The average gene counts usingQuartz-Seq2 were approximately 6636 (day 1) and 6584
(day 2), while the average gene counts for the othermethods ranged from 2738 to 5164. We also validated thequantitative performance for external control RNA. Thelevels of ERCC capture efficiency for Quartz-Seq2 wereapproximately 6.12% (day 1) and 6.38% (day 2), while theERCC capture efficiencies for the other methods rangedfrom 0.76 to 3.22% (Fig. 4a; Additional file 1: Figure S13d).We also calculated the copy number of ERCC spike-inRNA at 50% detection probability. The copy number ofERCC spike-in RNA at 50% detection probability forQuartz-Seq2 was approximately 6.82 (day 1) and 6.57 (day2), while those for the other methods ranged from 13.26 to710.24 (Additional file 1: Figure S13d).We also performed simulation-based power analysis to
estimate the power for identifying differentially expressedgenes (Additional file 1: Figure S12b; see “Methods”). Thetrue positive rate (TPR) at the data point of 128 cellsranged from 0.91 to 0.92, and the false discovery rate(FDR) at the data point of 128 cells ranged from 0.07 to0.08. Therefore, the TPR and FDR for each method werecomparable to each other. We found that Quartz-Seq2 de-tected more simulated DEGs than the different methods.In particular, the UMI conversion efficiency and gene
count of the Quartz-Seq2 method were significantly betterthan those of the other methods at approximately 0.1 mil-lion initial reads. We also estimated the UMI and genecounts and the UMI conversion efficiency at various num-bers of initial fastq reads (Fig. 4a). We found that Quartz-Seq2 is greatly advantageous for detecting the UMI andgene counts from limited initial amounts of data (under0.2 million fastq reads). These results showed that thequantitative performance of Quartz-Seq2 was almost al-ways better than that of other methods under conditionswith a limited number of initial fastq reads.
Quartz-Seq2 achieves high UMI conversion efficiency atrelatively low costThe experimental cost for sequence library preparation isan important benchmark for single-cell RNA-seq methodsbecause it is highly correlated with the throughput ofsingle-cell RNA-seq methods within a limited budget. Inthe case of using 384 indexes, the library preparation costof Quartz-Seq2 (RT25) is ¥63 ($0.56) (Additional file 1: Fig-ure S6a). For Quartz-Seq2 with 384 indexes, we used threepurification columns per 384-well plate at the cDNA purifi-cation step. To reduce the amount of enzyme solution inthe downstream reaction after cDNA purification, we usedone purification column per 384-well plate (Additional file 2:Table S1). In the previous subsection, we also described thatthe RT6.25 low-enzyme condition improved the experimen-tal cost of Quartz-Seq2. The combination of the RT6.25low-enzyme condition and reduction of the number of puri-fication columns thus further improved the library prepar-ation cost of Quartz-Seq2 (RT6.25 + column1) to ¥37
Sasagawa et al. Genome Biology (2018) 19:29 Page 8 of 24

($0.32) (Additional file 1: Figure S6a). For comparison, thelibrary preparation costs of other methods that use a cellsorter range from ¥146 ($1.30) to ¥372 ($3.29) (Additionalfile 1: Figure S6a). Quartz-Seq2 is thus highly competitivewith regard to cost with other single-cell RNA-seq methodsthat use a cell sorter.To show the potential of Quartz-Seq2 for high-
throughput performance, we additionally carried outQuartz-Seq2 (RT6.25 + column1) and Quartz-Seq2(RT6.25) using J1 ES cells (Fig. 4b). We estimated that
the number of processable single cells per 1000 US dol-lars spent on Quartz-Seq2 ranges from 1785 to 3058(Fig. 4b). We also calculated the total cost, including thesequencing and library preparation costs, for eachmethod. The total cost per cell is extremely low (ap-proximately ¥71–131, or $0.63–1.16) for Drop-seq.The total cost per cell is ¥97–183 ($0.85–1.62) forQuartz-Seq2. Thus, the total cost of Quartz-Seq2, acell sorter-based method, approaches that typical ofdroplet-based methods (Additional file 1: Figure S6b).
Fig. 4 Quantitative comparison among Quartz-Seq2 and previously reported methods using embryonic stem cells. a We determined the UMI andgene counts with Quartz-Seq2 in the RT25 condition using J1 ES cells. We performed Quartz-Seq2 (RT25) with three sets of 384-well plates and two setsof 384-well plates on different days. We also estimated the UMI conversion efficiency of other single-cell RNA-seq methods (CEL-seq2(C1), SCRB-seq,MARS-seq, and Drop-seq) from a previous study that used mouse ES cells [21]. In our comparison, the Read2 length for transcript mapping was 45nucleotides for all of the methods, including Quartz-Seq2. We estimated the average UMI and gene counts and the UMI conversion efficiency withvarious numbers of initial fastq reads for each method. The findings indicate that, compared with the other methods, Quartz-Seq2 has a superior abilityto detect UMI and gene counts from limited initial amounts of data (under 0.2 million fastq reads). b To investigate the throughput capacity forestablishing sequence library DNA, we estimated the number of processable single cells per $1000 spent on each method: Quartz-Seq2 (384 indexes,RT25) yielded 1785 cells, Quartz-Seq2 (384 indexes, RT6.25) yielded 2325 cells, Quartz-Seq2 (384 indexes, RT6.25 + column1) yielded 3058 cells,Quartz-Seq2 (1536 indexes, RT25) yielded 2500 cells, CEL-seq2(C1) yielded 111 cells, SCRB-seq yielded 500 cells, MARS-seq yielded 769 cells, andDrop-seq yielded 10,000 cells. The UMI conversion efficiency was approximately 32.55% (n = 1152), 32.25% (n = 768), and 32.12% (n = 192) forQuartz-Seq2 (384 indexes, RT25), 35.48% (n = 2304) for Quartz-Seq2 (1536 indexes, RT25), 34.04% (n = 768) for Quartz-Seq2 (384 indexes, RT6.25),35.51% (n = 768) for Quartz-Seq2 (384 indexes, RT6.25 + column1), 22.4% for CEL-seq2(C1), 13.3% for SCRB-seq, 10.6% for MARS-seq, and 7.1% forDrop-seq. The average gene count was approximately 6636 (n = 1152), 6584 (n = 768), and 6529 (n = 192) for Quartz-Seq2 (384 indexes, RT25), 6712(n = 2304) for Quartz-Seq2 (1536 indexes, RT25), 6753 (n = 768) for Quartz-Seq2 (384 indexes, RT6.25), 6794 (n = 768) for Quartz-Seq2 (384 indexes,RT6.25 + column1), 5164 for CEL-seq2(C1), 4044 for SCRB-seq, 3252 for MARS-seq, and 2738 for Drop-seq
Sasagawa et al. Genome Biology (2018) 19:29 Page 9 of 24

In summary, the Quartz-Seq2 method achieves thehighest UMI conversion efficiency and high-sensitivitydetection of genes under conditions with limited numbersof initial reads, providing single-cell RNA-seq data in ahigh-throughput manner.
Demonstration of high-throughput Quartz-Seq2 analysisof 4484 mouse ES cells and differentiated conditionsTo demonstrate the capability of Quartz-Seq2 for quanti-fying the transcriptome of a large number of cells and
identifying rare cell populations, we analyzed approximately4484 cells from a mixture of mouse ES cells anddifferentiation-induced cells. Cells were prestained withHoechst 33,342 and/or Calcein-AM as an indicator of DNAcontent and culture condition (ES or PrE cells), respectively(Fig. 5a). Calcein-AM-positive and -negative cells weresorted to 12 384-well plates (4608 well in total) in a check-ered pattern (Fig. 5a). These conditions maximize the likeli-hood of detecting the cell doublets caused by mis-sorting.In this analysis, as an average for cells, 0.1 M initial fastq
a
d
b
unclassified, 0.33% (15)
ES (main), 44.6% (2,000)
ES/PrE doublets, 1.38% (62)
ES (Stmn2 high), 3.3% (148)PrE (main), 49.6% (2,225)Zscan4c/d high, 0.17% (8)
ES (low-quality cell), 0.57% (26)
ES cells
+Dex 72 hours
DissociationQuartz-Seq2 (1,536 indexes)
(four 384-well plates) x3 sets
Cell-sorter
(MoFlo)
Treated cells
(PrE cells)
Dissociation
Hoechst33342Calcein AM
Hoechst33342
Mixed cells
evenly
A1
P24P1
A24
Checkered pattern
CalceinAM (+ , - )
ES (main)
PrE (main)
Zscan4c/d
high
ES (Stmn2 high)c
ES (main
)
ES (Stm
n2 h
igh)
PrE (m
ain)
Zscan
4c/d
high
1.0
0
0.60.40.2
0.8
97.3% (4,484 cells / 4,608 wells)Class A
Class B
Class C
Class D
Mixture of cell-types ES (main), 2,000 cells ES (Stmn2 high), 148 cells PrE (main), 2,225 cells Zscan4c/d high, 8 cells
20 30 40 50 60 70
0.07
0.06
0.05
0.04
0.03
0.02
0.01
0.00
0.08
20 30 40 50 60 70
0.07
0.06
0.05
0.04
0.03
0.02
0.01
0.0020 30 40 50 60 70
0.07
0.06
0.05
0.04
0.03
0.02
0.01
0.00
0.09
0.08
20 30 40 50 60 70
0.08
0.06
0.04
0.02
0.00
0.12
0.10
20 30 40 50 60 70
0.07
0.06
0.05
0.04
0.03
0.02
0.01
0.00
Hoechst33342 Hoechst33342 Hoechst33342 Hoechst33342 Hoechst33342
eCalcein AM
1.6
1.4
1.2
1.0
0.8
0.6
0.4
0.2
0.00.0 0.5 1.0 1.5 2.0 0.0 0.5 1.0 1.5 2.0 0.0 0.5 1.0 1.5 2.0 0.0 0.5 1.0 1.5 2.0
Calcein AM Calcein AMCalcein AM
2.5
2.0
1.5
1.0
0.5
0.0
45
30
15
0.0
7000
6000
5000
4000
3000
2000
1000
0
ES (main), 2,000 cells ES (Stmn2 high), 148 cells PrE (main), 2,225 cells Zscan4c/d high, 8 cells
Calcein AM
0.0 0.5 1.0 1.5 2.0
6
5
4
3
2
1
0
Mixture of cell-types
Gen
es
Fig. 5 High-throughput Quartz-Seq2 analysis of 4484 cells from mouse embryonic stem cells and differentiated cells. a We successfully analyzed97.3% of 4608 wells. The procedures for cell suspension as used in this assay are shown. Cells cultured under ES-maintenance and Dex-treatmentconditions were separately dissociated into single cells, stained with Hoechst 33,342 and/or Calcein-AM, and mixed evenly. Calcein-AM-positiveand -negative cells were sorted to 384-well plates in a checkered pattern. White scale bars represent 100 μm. b Clustering of 4484 single cellsaccording to the transcriptome. Plotting of cells on t-SNE space with color labeling for each cluster. The percentage indicates the proportion ofcells for each cluster relative to all cells analyzed. Numbers in parentheses indicate the numbers of cells making up the cluster. c Marker genes foreach cluster identified by Quartz-Seq2. Cluster-specific or cluster-enriched genes were calculated for each cluster, and their expression is displayedas a color in a heatmap. No more than 50 cells are shown for simplicity. d Reconstructed distribution of Calcein-AM intensity for each cluster. Thex-axis represents the intensity of Calcein-AM dye staining. e Reconstructed distribution of Hoechst 33,342 intensity for each cluster. The y-axisrepresents the density of cells. The x-axis represents the intensity of Hoechst 33,342 dye staining
Sasagawa et al. Genome Biology (2018) 19:29 Page 10 of 24

reads were effectively converted to 35,915 ± 1188 UMIcounts in a final gene expression matrix. The UMI conver-sion efficiency was 35.91 ± 1.18%.Dimensionality reduction of the expression UMI matrix
resulting from Quartz-Seq2 showed clear separation of sixclusters, including the main populations of ES cells and PrEcells, as well as four small populations. We did not observea clear batch effect among the 12 384-well plates (Additionalfile 1: Figure S15). One cluster contained a relatively highproportion of mitochondrial RNA (Additional file 1: FigureS16), which was judged to reflect low-quality cells [24]. An-other cluster showed high values of detected UMI countsand gene counts, and expressed both ES and PrE markergenes, which were judged to represent doublets of an ES celland a PrE cell (Additional file 1: Figure S16). To characterizethe identified populations, we determined the genes thatwere specific or enriched for each cluster using binomialtests (Fig. 5c). Although cells in cluster 3 shared gene ex-pression with the main population of ES cells (cluster 1),some genes, including Stmn2 and Rhox5, were additionallyexpressed, suggesting that cluster 1 and cluster 3 shared thesame cell type but had different cell states. Cluster 5 was asmall population (0.17%; Fig. 6b) but was characterized bymany specific marker genes (Fig. 5c), including Zscan4c andZscan4d, which are known to be expressed in a subpopula-tion of mouse ES cells [25]. However, among our cultureconditions, these genes were more expressed in the Dex-treatment condition than in the ES-maintenance condition.Flow cytometry information on cells in cluster 5 alsoshowed no fluorescence of Calcein-AM, indicating thatthese cells were from the suspension of Dex-treated cells(Fig. 5d). These observations are consistent with a previousstudy demonstrating that Zscan4 was more expressed in adifferentiation condition induced by the withdrawal ofleukemia inhibitory factor [7].In the sampling of cells using a cell sorter, flow cytometry
information, including the intensity of Hoechst 33,342staining for each cell, was collected. Using this information,we reconstructed the distribution of Hoechst 33,342 stain-ing intensity for each cluster (Fig. 5e). The main populationof ES cells (cluster 1) showed an embryonic pattern of dis-tribution of DNA content, which is characterized by a highratio of cells in G2 and M phases to cells in the G1 phase.In contrast, the main population of PrE cells (cluster 4)showed a somatic pattern of distribution of DNA content.This was consistent with PrE cells being differentiated fromES cells. The cells in cluster 3, the gene expression of whichwas similar to that of the ES main population (cluster 1),showed an embryonic pattern rather than a somatic one.As the number of cells in cluster 5 that expressed Zscan4c/d was small, it was difficult to classify the observed patternas the embryonic or somatic type. These findings indicatethe usefulness of single-cell RNA-seq using flow cytometryfor the reconstruction of population information after
transcriptome-based clustering. For good interpretation ofthe distribution, a large number of cells for each cluster arerequired.
Quartz-Seq2 classified genes with variable expressionwithin a cell typeWhen cells were plotted on t-SNE (t-distributed stochasticneighbor embedding) space using transcriptome analysisand the intensity of Hoechst 33,342 staining was depictedusing a color-based scale, the gradient pattern was easilyobserved for clusters 1, 3, and 4 (Fig. 6a), suggesting thatQuartz-Seq2 was highly sensitive for detection of the cellcycle state. To examine this, we plotted the gene expres-sion of several cell cycle markers against the intensity ofHoechst 33,342 staining. We observed a strong relation-ship between the gene expression of several cell cyclemarkers and DNA content (Fig. 6b). Using the intensity ofHoechst 33,342 staining as reference for the cell cyclephase, we calculated the relationship between the cell cyclephase and all genes detected in Quartz-Seq2 experiments(see “Methods”). The results enabled us to identify numer-ous genes for which the expression level changed in rela-tion to the DNA content (Fig. 6c, d; Additional file 1:Figure S17). We call these genes “cell cycle associated vari-able genes”. These genes include cell cycle markers. Again,it was confirmed that the ratio of cells in G1 and S phasesto those in G2 and M phases differed between ES and PrEcells (Fig. 6c). As we showed that the efficiency of UMIconversion was high in the Quartz-Seq2 method, we ex-amined whether 10,000 initial reads are sufficient for cellcycle analysis (Additional file 1: Figure S18). In this ana-lysis, the final UMI count was 4774 ± 62 and the UMIconversion efficiency was 47.74 ± 0.66% (n = 3, 1536wells). Plotting cells on t-SNE space while using color todepict the intensity of Hoechst 33,342 staining revealed agradient pattern, which was positively correlated with theexpression of G2/M phase marker genes, including Ccnb1and Top2a, and negatively correlated with the expressionof G1 phase marker genes such as Ccne1 (Additional file 1:Figure S18). These observations demonstrate that Quartz-Seq2 with few initial sequence reads could analyze the cellcycle due to the high UMI conversion efficiency.Within a single cell type, there are two types of
cell state categories. One is the different stages ofthe cell cycle as mentioned above, and the other re-fers to cellular heterogeneity, which is only remotelyrelated to the cell cycle phases. This means thatgenes with variable expression in a cell type includecell cycle associated variable genes and “variablegenes the expression of which is less associated withthe cell cycle phase” (Additional file 1: Figure S24).We determined the number of the latter group ofgenes by subtracting the former group from thegenes with variable expression (Fig. 6e). For the main
Sasagawa et al. Genome Biology (2018) 19:29 Page 11 of 24

population of ES cells (cluster 1), we identified tensof variable genes the expression of which is less as-sociated with the cell cycle phase. These genes in-cluded Spp1, Rhox5, and S100a6, which werepreviously identified as genes with highly variable ex-pression by scRNA-seq (Fig. 6) [7, 13, 15]. We alsoidentified Stmn2, Dnmt3l, Tmsb4x, and several other
genes as novel variable genes the expression of whichis less associated with the cell cycle phase. Single-cellRT-qPCR also showed high variability for Stmn2 andRhox5 compared with that for Nanog (Fig. 6f ). Inprevious studies, Sgk1 and Actb were identified asgenes with variable expression by scRNA-seq, whichanalyzed cells only in the G1 phase or cells without
G1
S
G2/M
G1
S
G2/M
<ESC>
<PrE>
c d
a
600
500
400
300
200
100
01234
z threshold
The
num
ber
of d
etec
ted
gene
Common detectedESCPrE
UM
I cou
nt (
Nor
mal
ized
)
UM
I cou
nt (
Nor
mal
ized
)
UM
I cou
nt (
Nor
mal
ized
)
UM
I cou
nt (
Nor
mal
ized
)
Hoechst33342
Hoechst33342 Hoechst33342
Hoechst33342
Ccnb1 Ccne1
Ccnb1 Ccne1
ESC
PrE
ESC
PrE
28
32
36
40
44
48
56
52
60
Hoechst33342b
ES (main)
PrE (main)Cell cluster
e
Cell cycle associated variable genes
fU
MI c
ount
(N
orm
aliz
ed)
UM
I cou
nt (
Nor
mal
ized
)
Hoechst33342
Hoechst33342
Gnb2l1
Gnb2l1
ESC
PrE
Rhox5
Stmn2
Nanog
qPCR score
Den
sity
(ce
ll) Nanog
Stmn2
Rhox5
single-cell qPCRQuartz-Seq2
Den
sity
(ce
ll)D
ensi
ty (
cell)
qPCR score
qPCR score
UMI count
UMI count
UMI count
Den
sity
(ce
ll)D
ensi
ty (
cell)
Den
sity
(ce
ll)
Genes
Genes
40 b
ins
orde
red
byH
oech
st33
342
40 b
ins
orde
red
byH
oech
st33
342
UM
I cou
nt (
Nor
mal
ized
)
Hoechst33342
UM
I cou
nt (
Nor
mal
ized
)
Hoechst33342
UM
I cou
nt (
Nor
mal
ized
)
Hoechst33342
UM
I cou
nt (
Nor
mal
ized
)
Hoechst33342
ESC ESC
ESC ESC
Rhox5 Stmn2
Spp1 S100a6
Fig. 6 Quartz-Seq2 classified genes with variable expression within a cell type. a Plotting cells on t-SNE space with the colors representing the intensityof Hoechst 33,342 staining. b Dependence of expression of several genes on the intensity of Hoechst 33,342 staining (G2/M phase, Ccnb1; G1 phase,Ccne1; housekeeping gene, Gnb2l1). Upper panels: ES main population (cluster 1). Lower panels: PrE main population (cluster 4). c Identification of cellcycle-associated genes. Average gene expression of cells in a bin is depicted by color in the heatmap. Bins are arranged in order of Hoechst 33,342staining intensity. d The number of cell cycle-associated genes identified for each z-threshold. CV values from which the z-score was calculated are asfollows. ES cells (z = 4, 1.17; z = 3, 0.91; z = 2, 0.68; z = 1, 0.4). PrE cells (z = 4, 1.1; z = 3, 0.88; z = 2, 0.64; z = 1, 0.39). e Several examples of genes whoseexpression was variable but not associated with the phase of the cell cycle. f Single-cell qPCR detection of genes with variable expression
Sasagawa et al. Genome Biology (2018) 19:29 Page 12 of 24

measuring the intensity of Hoechst 33,342 [7, 15]. Inthis study, these were classified as cell cycle associ-ated variable genes (Additional file 1: Figure S17).These results show that Quartz-Seq2 globally classified
genes with variable expression within a cell type into cellcycle associated variable genes and variable genes the ex-pression of which is less associated with the cell cyclephase by using Hoechst 33,342 staining intensity data ob-tained by flow cytometry.
The global picture of cell-type composition in the stromalvascular fraction as revealed by Quartz-Seq2Compared with cultured cells, fresh tissue samples tend tobe composed of multiple cell types, whose sizes are highlyvariable. The use of fresh samples is one promising strat-egy to assess the robustness of high-throughput single-cellRNA-seq for various samples. Therefore, Quartz-Seq2 wasapplied to cells from the mouse stromal vascular fraction(SVF), which was taken from adipose tissue (Fig. 7a). SVFis thought to be one of the most important sources ofmesenchymal stem cells (MSCs) due to its potential foruse in cell therapies and the stimulation of endogenous re-pair [26–29]. However, the global picture of cell-type com-position in SVF has not been clarified. To achieve this, wefirst observed the distribution of cell size in the SVF popu-lation and found it to be broad (5–13 μm, average 6.43 ±1.35 μm; n = 200; Fig. 7a). This was confirmed by flow cy-tometry data that were obtained using a cell sorter. It isknown that the typical amount of total RNA in a mamma-lian cell is approximately 10 pg [15, 17]. Thus, the averageamount of total RNA in the SVF population of approxi-mately 1.7 pg is relatively small.We collected cells in multiple 384-well PCR plates and
analyzed their transcriptome using Quartz-Seq2. In thisanalysis, 38,450 ± 3513 initial fastq reads were converted toUMI counts in the final digital expression matrix. The UMIconversion efficiency was 26.85 ± 2.70% (n = 3). We ob-served broader distributions of UMI counts and genecounts in SVF than in ES and 10 pg of total RNA. The genecounts correlated well with side scatter (SSC) values, whichwere associated with cell size (Additional file 1: Figure S19).Dimensionality reduction and clustering of single-cell
transcriptome data showed the clear separation of 11 clus-ters (Fig. 7b). To annotate the cell type for each cluster, weidentified differentially expressed genes and functionalterms that were either specific or enriched for each cluster(Fig. 7c, d; Additional file 1: Figure S20). As Fig. 7c shows,clusters 1, 2, 5, and 8–11 expressed cluster-specific genes,and clusters 3, 4, 6, 7, and 9 shared expressed genes(marker class C) as well as differentially expressed genes ofclasses D–G. Taking these markers and functional termsas well as previous knowledge together, each cluster wasidentified as follows: two types of Cd34-positive MSC(cluster 1, 7.8% of cells from SVF population; cluster 8,
6.4%), two types of Cd4-positive T cells (cluster 3, 45.0%;cluster 4, 1.0%), Cxcr6-positive T cells (cluster 9, 1.71%), Bcells (cluster 5, 15.9%), killer T cells (cluster 6, 11.0%), nat-ural killer cells (cluster 7, 3.0%), macrophages (cluster 2,5.5%), dendritic cells (cluster 10, 0.86%), and plasmacytoiddendritic cells (cluster 11, 0.57%). We noted that the sizesof the T cells and B cells from clusters 3–5, which weremeasured using a cell sorter, were smaller than those ofMSCs and macrophages from clusters 1, 2, and 8 (Add-itional file 1: Figure S19). Using immunofluorescence ob-servation, we confirmed that the sizes of CD4-positive Tcells and CD79-positive B cells were smaller in SVF (Add-itional file 1: Figure S19). These results show that Quartz-Seq2 with flow cytometry data are useful for defining re-spective cell clusters with cell size information.Subsequently, we investigated the gene expression of re-
ceptors and ligands in cells from the SVF. The variety of re-ceptors expressed in each cluster was similar (Additionalfile 1: Figure S21). However, we found a wide variety of li-gands expressed in clusters 1 and 8 (Additional file 1: FigureS21). It is known that MSCs secrete many paracrine media-tors, which have a therapeutic effect [30, 31]. These resultssuggest that clusters 1 and 8 are MSCs, which secrete manyparacrine mediators.We focused on these two potential MSC clusters (1 and
8) because the heterogeneity of the MSC population hasbeen discussed in many papers [32, 33]. By using Quartz-Seq2, clusters 1 and 8 were shown to have the Cd31−/Cd34+/Cd45− phenotype (Additional file 1: Figure S22).In a previous study, qPCR-based single-cell transcript ana-lysis of the Cd31−/Cd34+/Cd45− population of SVF wasreported. By analyzing 140 genes, the authors identified theCd55+/Dpp4+/Cd31−/Cd34+/Cd45− cell population andshowed that the administration of this population was ef-fective for normalizing diabetic wound healing in mice[32]. They identified 13 marker genes for the Cd55+/Dpp4+/Cd31−/Cd34+/Cd45− population in mouse SVF. Wecompared the expression of those 13 genes between clus-ters 1 and 8 (Additional file 1: Figure S23). The resultsshowed that almost all of the genes were more highlyexpressed in cluster 1 than in cluster 8, suggesting that thecluster 1 population was similar to the Cd55+/Dpp4+/Cd31−/Cd34+/Cd45− population. To further analyze therelationship between our identified clusters and previouslyreported heterogeneity of the MSC population, we exam-ined the expression of typical MSC markers (CD90,CD105, PDGFRa, and Sca-1) [32, 34] as well assubpopulation-specific markers (Pou5f1, Nanog, Sox2,Tnnt2, andMyog) [35, 36]. PDGFRa (Pdgfra) and Sca1 wereexpressed in both clusters 1 and 8, whereas Cd90 wasexpressed at a higher level in cluster 8 than in cluster 1,and Cd105 was not strongly expressed in either cluster.Cd90 and Cd105 were, however, not specific to these MSCclusters. Neither pluripotent markers (Pou5f1, Nanog, and
Sasagawa et al. Genome Biology (2018) 19:29 Page 13 of 24

Sox2) nor skeletal and cardiomyogenic markers (Tnnt2 andMyog) were detected in either cluster (Additional file 1: Fig-ure S22). Collectively, our transcriptome analysis showed
that the MSC population is divided into two clusters, sug-gesting that there is less heterogeneity of MSCs in the SVFthan expected.
a
1
2
1110
9
87
6
5
4
3
01: Cd34+/Efemp1+ mesenchymal stem cell, 7.79% (82)unclassified, 1.33% (14)
02: Macrophage, 5.51% (58)03: Cd4+ T-cell, 44.96% (473)
08: Cd34+/Col15a1+ mesenchymal stem cell, 6.36% (67)
04: Cd4+ T-cell (proliferation), 0.95% (10)05: B-cell, 15.87% (167)06: Killer T-cell, 11.02% (116)07: Natural killer cell, 3.04% (32)
09: Cxcr6+ T-cell, 1.71% (18)10: Dendritic cell, 0.85% (9)11: Plasmacytoide dendritic cell, 0.57% (6)
91.31% (1,052 cells / 1,152 wells)
b
Dim
2
Dim1
1.0
0
0.60.40.2
0.8
Class A
Class B
Class C
Class D
1 2
11
1098765
43
Class EClass FClass G
Class K
Class J
Class I
Class H
e
dc488-FSC1-Height
0
64
128
192
256
488-
SS
C-H
e igh
t
0 64 128 192 256
S
L
Density (Cell)
Dia
met
er o
f cel
l (um
)
1 2
11
1098765
43
1.60.80.0
-0.8-1.6
EMT regulation
5
6
7
8
9
10
11
12
Organ formationEmbryonic pattern specificationCollagen trimerOsteoblast differentiationCell-cell junctionAngiogenesisMesenchymal cell differentiationRibosome biogenesisT cell receptor signal. pathwayMHC class I complexResponse to IFN-gammasnoRNA bindingLamellipodium organizationDendritic cell differentiationMast cell activationChemokine productionVEGF pathwayAntigen processing and presentationMitochondrial repiratory chainCell divisionDNA replication
Gen
es
GO
term
s
Cell-clusters Cell-clusters
0 468
Extracellular matrix organization Bmp2,Col14a1,Fbn1,Fgf2,Fn1,Itgb7,Mfap5,Ntn4,Pcolce2,Efemp1
-Log(P-value)
Clu
ster
1: C
d34+
/Efe
mp1
+C
lust
er 8
: Cd3
4+/C
ol15
a1+
[Reactome pathways]
-Log(P-value)
210
0 30 10 20
Bmp2,Fbn1,Fn1,Mfap5,Efemp1
Bmp2,Fbn1,Fn1,Mfap5,Efemp1
Igfbp4,Igfbp5,Igfbp6
Fgf2,Fn1,Ntn4
Bgn,Serpinh1,Col15a1,Col3a1,Col4a1,Col4a2,Col4a4,Col5a1,Col5a2,Col6a1,Col6a2,Col1a1,Col1a2,Ctsk,Lama2,Lamb1,Lox,Lum,Mmp2,Nid2,Pcolce,Sparc,Jam2Serpinh1,Col15a1,Col3a1,Col4a1,Col4a2,Col4a4,Col5a1,Col5a2,Col6a1,Col6a2,Col1a1,Col1a2,Lox,PcolceCol15a1,Col3a1,Col4a1,Col4a2,Col4a4,Col5a1,Col5a2,Col6a1,Col6a2,Col1a1,Col1a2,Ctsk,Mmp2Serpinh1,Col15a1,Col3a1,Col4a1,Col4a2,Col4a4,Col5a1,Col5a2,Col6a1,Col6a2,Col1a1,Col1a2,Pcolce
Col15a1,Col3a1,Col4a1,Col4a2,Col4a4,Col5a1,Col5a2,Col6a1,Col6a2,Col1a1,Col1a2
Col3a1,Col4a1,Col4a2,Col4a4,Col5a1,Col5a2,Col6a1,Col6a2,Col1a1,Col1a2,Lox
Col15a1,Col3a1,Col4a1,Col4a2,Col4a4,Col5a1,Col5a2,Col6a1,Col6a2,Col1a1,Col1a2,Ctsk,Lamb1,Mmp2
Col3a1,Col4a1,Col4a2,Col4a4,Col5a1,Col5a2,Col6a1,Col6a2,Col1a1,Col1a2,Lum,Jam2
Col3a1,Col4a1,Col4a2,Col4a4,Col5a1,Col5a2,Col1a1,Col1a2,Lama2,Lamb1
Bgn,Col3a1,Col5a1,Col5a2,Col6a1,Col6a2,Col1a1,Col1a2,Sparc
Molecules associated with elastic fibres
Elastic fibre formation
IGF transport
Non-integrin membrane-ECM interactions
Extracellular matrix organization
Collagen formation
Collagen degradation
Collagen biosynthesis and modifying enzymes
Collagen chain trimerization
Assembly of collagen fibrils and other multimeric structures
Degradation of the extracellular matrix
Integrin cell surface interactions
Non-integrin membrane-ECM interactions
ECM proteoglycans
[Reactome pathways]
[Differentially expressed genes]
[Differentially expressed genes]
Fig. 7 Quartz-Seq2 analysis of stromal vascular fraction (SVF) from mouse adipose tissue. a Morphology of SVF cells. Adipose tissuefrom a cell suspension of SVF was prepared. Upper panels present a photograph of adipose tissues and dissociated SVF samples.Yellow scale bar represents 1 cm. White scale bar represents 10 μm. Lower panels represent the distribution of cell size informationwith different platforms (left, diameter of cell size using photography; right, flow cytometry information using a cell sorter). Thediameter of cell size for SVF samples was 6.43 ± 1.35 μm (n = 200). b Clustering of cells included in SVF. The transcriptome ofapproximately 1000 cells was quantified by Quartz-Seq2 and clustering on t-SNE space was performed. In accordance with the genesand functional terms enriched in each cluster, the cell type was annotated. The percentage indicates the proportion of cells for eachcluster relative to all cells analyzed. Numbers in parentheses indicate the numbers of cells constituting the cluster. c Marker genes foreach cluster were identified by Quartz-Seq2. Cluster-specific or cluster-enriched genes were calculated for each cluster, with theirexpression being displayed as color in a heatmap. No more than 50 cells are shown for simplicity. d The results of Gene Ontology(GO)-PCA analysis. Functional terms enriched in the genes with high factor loadings of PCA were calculated and the enrichment isdisplayed as color in the heatmap. No more than 50 cells are shown for simplicity. e Reactome pathway with genes differentiallyexpressed between cluster 1 and cluster 8
Sasagawa et al. Genome Biology (2018) 19:29 Page 14 of 24
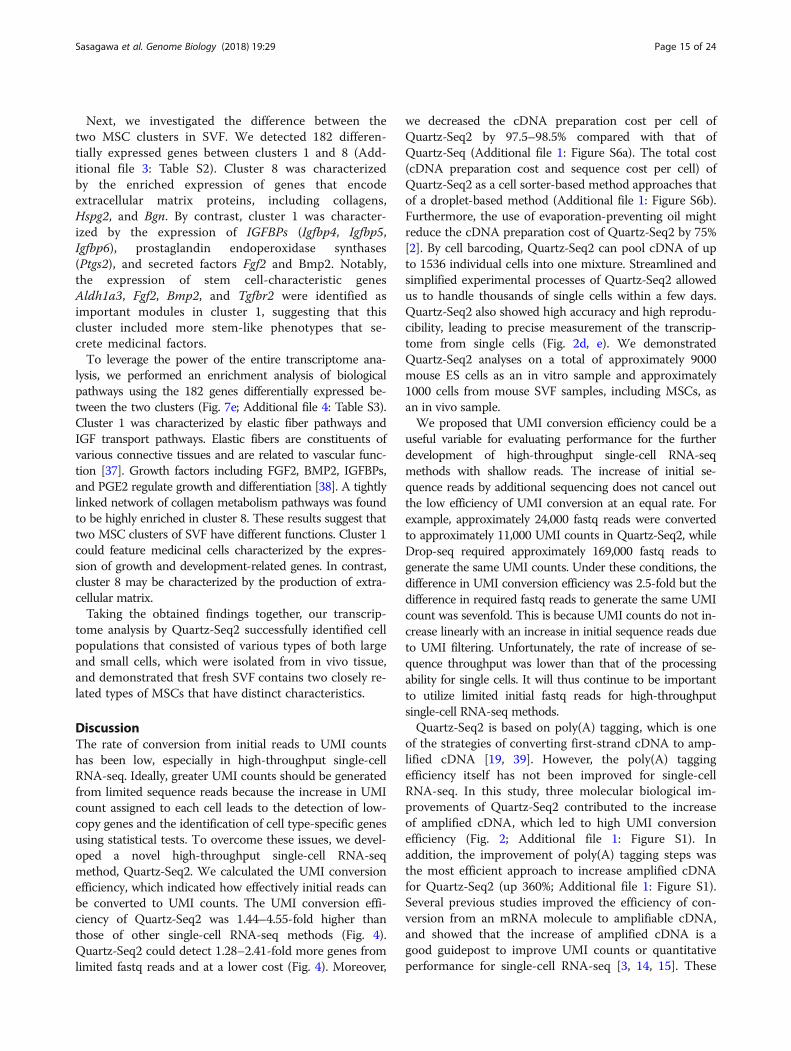
Next, we investigated the difference between thetwo MSC clusters in SVF. We detected 182 differen-tially expressed genes between clusters 1 and 8 (Add-itional file 3: Table S2). Cluster 8 was characterizedby the enriched expression of genes that encodeextracellular matrix proteins, including collagens,Hspg2, and Bgn. By contrast, cluster 1 was character-ized by the expression of IGFBPs (Igfbp4, Igfbp5,Igfbp6), prostaglandin endoperoxidase synthases(Ptgs2), and secreted factors Fgf2 and Bmp2. Notably,the expression of stem cell-characteristic genesAldh1a3, Fgf2, Bmp2, and Tgfbr2 were identified asimportant modules in cluster 1, suggesting that thiscluster included more stem-like phenotypes that se-crete medicinal factors.To leverage the power of the entire transcriptome ana-
lysis, we performed an enrichment analysis of biologicalpathways using the 182 genes differentially expressed be-tween the two clusters (Fig. 7e; Additional file 4: Table S3).Cluster 1 was characterized by elastic fiber pathways andIGF transport pathways. Elastic fibers are constituents ofvarious connective tissues and are related to vascular func-tion [37]. Growth factors including FGF2, BMP2, IGFBPs,and PGE2 regulate growth and differentiation [38]. A tightlylinked network of collagen metabolism pathways was foundto be highly enriched in cluster 8. These results suggest thattwo MSC clusters of SVF have different functions. Cluster 1could feature medicinal cells characterized by the expres-sion of growth and development-related genes. In contrast,cluster 8 may be characterized by the production of extra-cellular matrix.Taking the obtained findings together, our transcrip-
tome analysis by Quartz-Seq2 successfully identified cellpopulations that consisted of various types of both largeand small cells, which were isolated from in vivo tissue,and demonstrated that fresh SVF contains two closely re-lated types of MSCs that have distinct characteristics.
DiscussionThe rate of conversion from initial reads to UMI countshas been low, especially in high-throughput single-cellRNA-seq. Ideally, greater UMI counts should be generatedfrom limited sequence reads because the increase in UMIcount assigned to each cell leads to the detection of low-copy genes and the identification of cell type-specific genesusing statistical tests. To overcome these issues, we devel-oped a novel high-throughput single-cell RNA-seqmethod, Quartz-Seq2. We calculated the UMI conversionefficiency, which indicated how effectively initial reads canbe converted to UMI counts. The UMI conversion effi-ciency of Quartz-Seq2 was 1.44–4.55-fold higher thanthose of other single-cell RNA-seq methods (Fig. 4).Quartz-Seq2 could detect 1.28–2.41-fold more genes fromlimited fastq reads and at a lower cost (Fig. 4). Moreover,
we decreased the cDNA preparation cost per cell ofQuartz-Seq2 by 97.5–98.5% compared with that ofQuartz-Seq (Additional file 1: Figure S6a). The total cost(cDNA preparation cost and sequence cost per cell) ofQuartz-Seq2 as a cell sorter-based method approaches thatof a droplet-based method (Additional file 1: Figure S6b).Furthermore, the use of evaporation-preventing oil mightreduce the cDNA preparation cost of Quartz-Seq2 by 75%[2]. By cell barcoding, Quartz-Seq2 can pool cDNA of upto 1536 individual cells into one mixture. Streamlined andsimplified experimental processes of Quartz-Seq2 allowedus to handle thousands of single cells within a few days.Quartz-Seq2 also showed high accuracy and high reprodu-cibility, leading to precise measurement of the transcrip-tome from single cells (Fig. 2d, e). We demonstratedQuartz-Seq2 analyses on a total of approximately 9000mouse ES cells as an in vitro sample and approximately1000 cells from mouse SVF samples, including MSCs, asan in vivo sample.We proposed that UMI conversion efficiency could be a
useful variable for evaluating performance for the furtherdevelopment of high-throughput single-cell RNA-seqmethods with shallow reads. The increase of initial se-quence reads by additional sequencing does not cancel outthe low efficiency of UMI conversion at an equal rate. Forexample, approximately 24,000 fastq reads were convertedto approximately 11,000 UMI counts in Quartz-Seq2, whileDrop-seq required approximately 169,000 fastq reads togenerate the same UMI counts. Under these conditions, thedifference in UMI conversion efficiency was 2.5-fold but thedifference in required fastq reads to generate the same UMIcount was sevenfold. This is because UMI counts do not in-crease linearly with an increase in initial sequence reads dueto UMI filtering. Unfortunately, the rate of increase of se-quence throughput was lower than that of the processingability for single cells. It will thus continue to be importantto utilize limited initial fastq reads for high-throughputsingle-cell RNA-seq methods.Quartz-Seq2 is based on poly(A) tagging, which is one
of the strategies of converting first-strand cDNA to amp-lified cDNA [19, 39]. However, the poly(A) taggingefficiency itself has not been improved for single-cellRNA-seq. In this study, three molecular biological im-provements of Quartz-Seq2 contributed to the increaseof amplified cDNA, which led to high UMI conversionefficiency (Fig. 2; Additional file 1: Figure S1). Inaddition, the improvement of poly(A) tagging steps wasthe most efficient approach to increase amplified cDNAfor Quartz-Seq2 (up 360%; Additional file 1: Figure S1).Several previous studies improved the efficiency of con-version from an mRNA molecule to amplifiable cDNA,and showed that the increase of amplified cDNA is agood guidepost to improve UMI counts or quantitativeperformance for single-cell RNA-seq [3, 14, 15]. These
Sasagawa et al. Genome Biology (2018) 19:29 Page 15 of 24
results suggest that improved poly(A) tagging was themost important feature for the high UMI conversion effi-ciency of Quartz-Seq2.Several improvements proposed in this study could con-
tribute to the further development of other single-cellRNA-seq methods, as follows. (1) We showed that a de-crease of enzyme concentration in RT solution led to de-creases in technical error and cDNA preparation cost. (2)We applied the Sequence–Levenshtein distance for the de-sign of cell barcodes containing RT primer sets. The use ofprimer sets designed in this study allows the user to correctmutations of at most two nucleotides of a cell barcode, in-cluding substitution, insertion, or deletion; the correctioncapability of these primer sets is higher than that of barcodesets used in previous studies [1, 3]. Such correction of thecell barcode increased the average UMI count by 3–5%. (3)We hope that the spin-down collection system developed inthis study can be applied to other cell sorter-based single-cell RNA-seq methods [2, 3, 11, 12]. (4) In Quartz-Seq2, weimproved the efficiency of poly(A) tagging itself (Fig. 2).Several single-cell RNA-seq methods, including Quartz-Seq,are based on poly(A) tagging [4, 5, 10, 15, 19, 40]. Such im-provement may directly contribute to these methods havingincreased quantitative performance.We achieved a marked improvement in UMI conver-
sion efficiency at a low cost from initial reads to UMIcounts, allowing us to analyze three- to tenfold more sin-gle cells in limited sequence experiments. However, it isdifficult to sort more than 20,000 single cells in a daywhen using one cell sorter. While there is greater scal-ability for cell sampling in droplet-based single-cellRNA-seq methods than in cell sorter-based methods,these latter methods can utilize additional informationobtained in flow cytometry [41, 42], which cannot be de-termined from transcriptome data alone. These twotypes of method provide complementary approaches forinvestigating complex biological phenomena. C1 Single-Cell Auto Prep System (Fluidigm) is another widely usedplatform for single-cell RNA-seq methods [43]. CEL-seq2 shows high UMI conversion efficiency, so it is avery convenient method for users of the C1 platform asa single-cell RNA-seq method based on UMI count [3].Quartz-Seq2 cannot be performed with the C1 platform,but it can assimilate 1536 cell barcodes in a cell sorter ina high-throughput manner. We think that both methodscan be effective as long as the most appropriate one isselected for each situation.In this study, we showed that Quartz-Seq2 has advan-
tages in gene detection and the identification of bio-logical pathways via high UMI conversion efficiency(Fig. 3). Moreover, we analyzed thousands of single cellsfrom all cell cycle phases within a cell type (Fig. 6).These specifications with Quartz-Seq2 allow us to per-form the global classification of genes with variable
expression in a cell type into cell cycle associated vari-able genes and variable genes the expression of which isless associated with the cell cycle phase.While Hoechst 33,342 is used as an indicator of
DNA content, FUCCI reporter systems monitor theratio of activities for two different cell cycle-associated proteins. Therefore, the latter has anadvantage in cell cycle analysis via providing moredetailed resolution, although the introduction of re-porter constructs into the cells cannot be applied forall purposes, especially for the analysis of humansamples. A previous study utilizing the FUCCI fluor-escent reporter system reported that competence torespond to specific differentiation signaling waslimited to only an early or a late window of the G1
phase in human ES cells [44]. In the future, combin-ing Quartz-Seq2 and FUCCI/FUCCI2 or otherfluorescent reporter systems should lead to an un-derstanding of the global picture of differentiationdynamics regarding competence, response, transition,and commitment because Quartz-Seq2 can analyzechanges of cell state for thousands of cells.In summary, Quartz-Seq2 can be used to obtain
continuous data on cell states because of the largenumber of cells with which it deals and the high effi-ciency of use of initial sequence reads. Quartz-Seq2can facilitate investigation of the cell state within acell type, such as gradated or stochastic changes ofthe cell population in organism development and dis-ease progression.
ConclusionsIn this study, we developed a high-throughput single-cellRNA-seq method, Quartz-Seq2, which can analyze cellsnumbering up to 1536 that are pooled together in a sin-gle sample. Quartz-Seq2 allows us to effectively utilizeinitial sequence reads from a next-generation sequencer.The UMI conversion efficiency in Quartz-Seq2 rangedfrom 32 to 35%, which is much higher than for othersingle-cell RNA-seq methods (7–22%). This was causedby the improvements in several molecular biologicalsteps including poly(A) tagging. The technical gene ex-pression variability of Quartz-Seq2 was close to the the-oretical variability of a Poisson distribution. As weshowed in the analysis of SVF and the ES/PrE mixture,cell types in the population were identified with markergenes and functional terms that characterized each celltype. We identified two types of Cd34-positive MSCs inSVF, namely, those that express numerous transcriptionfactor-encoding and secreted protein-encoding genesspecific to each. Quartz-Seq2 can also be used to providecontinuous data on cell states because of the large num-ber of cells with which it deals and the high efficiency inthe use of initial sequence reads. Quartz-Seq2 should
Sasagawa et al. Genome Biology (2018) 19:29 Page 16 of 24

facilitate investigations of the cell state within a cell type,such as gradated or stochastic changes of cell popula-tions in organism development and disease progression.
MethodsCell cultureMouse ES cells were cultured as described previously [15].Briefly, 1.0 × 10⁵ cells were seeded on a 60-mm dish coatedwith gelatin (0.1%). Cells were maintained in GMEM-basedmedium containing 10% FBS and 1000 units/ml leukemiainhibitory factor (Millipore ESGRO). The cell line used inthis study was G6GRGFP, which was established in aprevious study [23]. It has been reported that almost allG6GRGFP differentiated into primitive endoderm-like cellsupon dexamethasone treatment [15, 23]. To differentiate EScells into primitive endoderm-like cells, 1.0 × 10⁵ cells wereseeded on a 60-mm dish coated with gelatin and culturedin GMEM-based medium containing 10% FBS, 1000 units/ml LIF, and 100 mM dexamethasone for 72 h. We con-firmed that almost all of the Dex-treated G6GR ES cells dif-ferentiated into primitive endoderm-like cells. Moreover, wecultured J1 ES cells in accordance with a procedure de-scribed in a previous report [21].
Cell stainingTo identify dead or damaged cells, propidium iodide (PI)was added to the cell suspension (final concentration 1–2μg/ml). As an indicator of an undifferentiated state in asuspension containing a mixture of cells, Calcein-AM wasused. Suspensions for cells cultured under maintenanceand differentiation conditions were prepared independ-ently, and cells in the maintenance condition were treatedwith 1 μg/ml Calcein-AM for 10 min on ice. After washingwith PBS, cell suspensions of ES cells and PrE cells at thesame concentration were mixed. Hoechst 33,342 was usedas an indicator of the DNA content in a cell. The proce-dures were performed as described previously [15].
Single-cell preparation for stromal vascular fractionThese experiments were carried out in accordance withthe protocol approved by the Committee on Animal Re-search at Nara Institute of Science and Technology andthe RIKEN Animal Experiment Committee. Subcutane-ous fat tissues from three- to four-month-old ICR malemice (n = 3 per sample, two biological replicate samples)were minced into small pieces and incubated with 0.4 U/mL collagenase NB4G (Serva) at 37 °C for 35 min in ashaking water bath. The digested solution was sequen-tially filtered through 100- and 40-μm cell strainers(Corning), followed by centrifugation at 250×g for 5 minto remove mature adipocytes. The pellet was treated witherythrocyte lysis buffer (BD Biosciences) and centrifugedat 180×g for 5 min. The nucleated cells were suspendedin HBSS with 0.1% BSA, filtered through a 20-μm cell
strainer (pluriSelect), and then kept on ice (Cell solutionA). The cell aggregates that did not pass through the 20-μm strainer were further treated with Accutase (ThermoFisher Scientific) at 37 °C for 15 min to dissociate theminto single cells, centrifuged at 180×g for 5 min, and sus-pended in HBSS with 0.1% BSA (Cell solution B). Cellsolutions A and B were mixed and again filtered throughthe 20-μm cell strainer, followed by centrifugation at180×g for 5 min. The pellet was resuspended with HBSSwith 0.1% BSA, stained with PI, and used for single-cellanalysis.
RNA preparationTotal RNA was purified from cultured cells using Direct-zol RNA MiniPrep kit (Zymo Research) with TRIzol RNAIsolation Reagents (Thermo). We measured the concentra-tion of purified total RNA using a NanoDrop 1000 Spec-trophotometer (Thermo). We confirmed that the RNAintegrity number of total RNA was over 9.5 using an Agi-lent RNA 6000 Nano Kit (Agilent). Estimation of the aver-age amount of total RNA per single cell for respectivesamples was performed in accordance with our previousstudy [15]. For high-throughput single-cell RNA-seq, weprepared total RNA from a single cell with ERCC spike-inRNA. First, we diluted the ERCC spike-in RNA tenfold.We then added 6 μL of 1:10 diluted ERCC spike-in RNAper 10 μg of total RNA. We used diluted 10 pg of totalRNA with ERCC spike-in RNA for the technical validationof Quartz-Seq2. For single cells, we used the same concen-tration of ERCC spike-in RNA.
Bulk RNA-seq methods for populations of cellsWe prepared sequence library DNA with 1 μg of totalRNA using NEBNext Poly(A) mRNA Magnetic IsolationModule and NEBNext Ultra Directional RNA Library PrepKit. The total RNA did not contain ERCC spin-in mix I. Inaddition, we used SuperScript III instead of ProtoScript inthe RT step and KAPA HiFi DNA polymerase instead ofNEBNext High-Fidelity PCR DNA polymerase in the PCRstep. The resulting sequence library DNA was analyzed byHiSeq2500.
Design of cell barcodesThe selection of 384 or 1536 sequences for v3.1 and v3.2barcode primer sets was performed as described below.First, 1582 or 4714 candidate sequences were createdusing the DNABarcodes package of R Bioconductor forthe v3.1 set with 14-mer and the v3.2 set with 15-mer,respectively (version 1.0.0). To reduce the loss of readsconverted into UMI counts, we applied the Sequence–Levenshtein distance as an edit distance in order tomaximize the ability to correct errors that occur duringthe synthesis of oligonucleotides or sequencing [22]. Theminimum distance between any two sequences was
Sasagawa et al. Genome Biology (2018) 19:29 Page 17 of 24
controlled to 5, leading to the correction of a maximumof two errors of substitution, insertion, or deletion. Asthe base composition of the created sequences was notuniform, we selected 384 or 1536 sequences from among1582 or 4714 created sequences so that the variance ofbase composition decreased. These sequences are listedin Additional file 5: Table S4.
Single-cell collection using flow cytometryStained cells were analyzed using flow cytometry SH800(Sony) or MoFlo Astrios EQ (Beckman Coulter). ForSH800, we used 130-μm microfluidic sorting chips. ForMoFlo Astrios EQ, we used 100-μm nozzle sizes. Eachcell sorter was equipped with a custom-made splash-guard to prevent contamination from unexpected drop-lets between the target well and neighboring wells. Weused two sets of RT primer for Quartz-Seq2. The set ofv3.1 RT primers has 384 kinds of unique cell barcodes,with a length of 14 nucleotides (OPC purification, FAS-MAC). The set of v3.2 RT primers has 1536 kinds ofunique cell barcodes, with a length of 15 nucleotides(OPC purification, Sigma). The set of v3.1 RT primerscorresponds to one set of the 384-well PCR plate withlysis buffer, the wells of which have unique barcodes.The set of v3.2 RT primers corresponds to four sets ofthe 384-well PCR plate with lysis buffer. The RT primerposition in the 384-well plate and the sequence were asdescribed in Additional file 5: Table S4. Single cells wereisolated in the 384-well PCR plate with 1 μL of lysis buf-fer (0.1111 μM respective RT primers, 0.12 mM dNTPmix, 0.3% NP-40, 1 unit/μL RNasin plus) containingERCC spike-in RNA. During single-cell sorting, the 384-well PCR plate was kept on a 384 aluminum stand at 4 °C. For Moflo Astrios EQ, we used G5498B-060 Insert384 Eppendorf twin.tec PCR as a 384 aluminum stand(Agilent). For SH800, we used an SH800 384 aluminumstand (Sony). Immediately after the cell collection, theplate was temporarily sealed with LightCycler 480Sealing Foil (Roche) and the sealed 384-well PCR platewas centrifuged at 10,000 g and 4 °C for 1 min usingTOMY MX307, equipped with a Rack-in-Rotor and cen-trifugation rack PCR96-02. These steps were very im-portant to collect the droplet with a single cell in lysisbuffer in an efficient manner. By altering the volume oflysis buffer from 0.4 μL (as described in the originalQuartz-Seq paper) to 1 μL (Quartz-Seq2), bubbling oflysis buffer was not required before single-cell sortingand the lysis buffer could easily be handled. We thenpeeled open the temporary seal and re-sealed it with Agi-lent PlateLoc Thermal Microplate Sealer (Agilent). Weagitated the plate at 2600 rpm and 4 °C for 1 min usingThermoMixer C (Eppendorf ), after which we centrifugedthe plate again. The resulting 384-well plate was thenimmediately cryopreserved at −80 °C and maintained
under such conditions until subsequent RT for cell bar-coding. After cryopreservation, we performed subsequentwhole-transcript amplification using the cryopreserved384-well PCR plate within a few months.
Whole-transcript amplification of Quartz-Seq2Cryopreserved 384-well plates with single-cell lysate werecentrifuged at 10,000 g and 4 °C for 1 min. Subsequently,we denatured total RNA in each 384 plate at 70 °C for 90 sand hybridized the RT primer to poly-adenylated RNA at35 °C for 15 s using the C1000/S1000 thermal cycler. Theresulting plates were again centrifuged at 10,000 g and 4 °C for 1 min. Next, the plates were placed on the 384aluminum plate at 0 °C. We peeled away the seal andadded 1 μL of RT premix (2× Thermopol buffer, 5 units/μL SuperScript III, 0.55 units/μL RNasin plus) to 1 μL oflysis buffer for each well using a Mantis microfluidic dis-pensing system (Formulatrix) or a 384 Transfer Plate sys-tem (1859-384S, Watson). The above RT solution wasused for the RT25 condition. For the RT100 condition, weused the following RT solution: 2× Thermopol buffer, 20units/μL SuperScript III, and 2.2 units/μL RNasin plus.We sealed the plates again and agitated them at 2600 rpmand 4 °C for 1 min. The plates were then centrifuged at10,000 g and 4 °C for 1 min. We then performed RT at 35°C for 5 min and 50 °C for 50 min. The RT was stopped at70 °C for 15 min. Then, the plates were placed on a pre-chilled aluminum block, after which we peeled off theirseals. Subsequently, we turned the plates upside down onthe assembled collector type A or type B (Additional file 1:Figure S4). We mainly used type A. We centrifuged theplates with an assemble collector at 3010 g and 4 °C for 3min with swing-bucket rotors. Subsequently, we collectedthe cDNA solution into a disposable reservoir. Typically,we obtained 650–700 μL of cDNA solution from one 384-well PCR plate. We purified and concentrated the cDNAsolution using the DNA Clean & Concentrator™-5 kit(Zymo Research). We used three purification columns forone 384-well PCR plate in the case of the v3.1 RT primersystem (384-cell barcode). Purified cDNA was extractedinto 20 μL of nuclease-free water from one column purifi-cation and transferred into an eight-linked PCR tube(TaKaRa). The PCR tubes were placed on an aluminumPCR stand at 0 °C. We added 25 μL of TdT solution (1×Thermopol buffer, 2.4 mM dATP, 0.0384 units/μL RNaseH (Invitrogen), 26.88 units/μL terminal transferase(Roche)) into 20 μL of extracted cDNA using a pipette at 0°C. The resulting 45 μL of TdT solution was mixed with apipette at 0 °C or ThermoMixer at 2000 g and 0 °C for 1min. Immediately thereafter, the PCR tubes were centri-fuged at 10,000 g and 0 °C for 1 min. We used a C1000/S1000 thermal cycler equipped with the 96-Deep Well Re-action Module for the following steps. The PCR tubeswere placed on the block of the thermal cycler, which had
Sasagawa et al. Genome Biology (2018) 19:29 Page 18 of 24

been prechilled to 0 °C. We then performed a poly(A) tail-ing reaction at 37 °C for 75 s. The solution was inactivatedat 65 °C for 10 min. The PCR tubes were placed on analuminum PCR stand at 0 °C. We then dispensed approxi-mately 11 μL of solution into four wells from 45 μL ofTdT solution. We added 46.16 μL of PCR I premix(1.08492× MightyAmp Buffer version 2, 0.06932 μM Tag-ging primer, 0.05415 units/μL MightyAmp DNA polymer-ase) to 11 μL of TdT solution for the respective wells ofthe PCR tube. MightyAmp DNA polymerase, which wasused in Quartz-Seq and Quartz-Seq2, are marketed asTerra PCR Direct polymerase [15]. We performed gentleinversion mixing on the resulting solution in the PCRtube. The tubes were then centrifuged at 10,000 g and 4 °Cfor 1 min. Subsequently, the solution was mixed withThermoMixer at 2000 rpm and 4 °C for 2 min. Then, wespun down the tube again. Next, we denatured the solu-tion at 98 °C for 130 s and hybridized tagging primer topoly(A)-tailed cDNA at 40 °C for 1 min. After that, we per-formed the Increment step by heating to 68 °C at 0.2 °Cevery second and performed second-strand synthesis at 68°C for 5 min. The tubes were placed on an aluminum PCRstand at 0 °C. We added 50.232 μL of PCR II premix(0.99697× MightyAmp Buffer version.2, 1.8952 μM gMprimer) to 56.16 μL of PCR I solution. We performed gen-tle inversion mixing on the resulting solution in the PCRtube. The tubes were then centrifuged at 10,000 g and 4 °Cfor 1 min. Subsequently, the solution was mixed withThermoMixer at 2000 rpm and 4 °C for 2 min, after whichwe spun down the tube again. We then placed it on theblock of the thermal cycler at 68 °C. Subsequently, weamplified the cDNA for 11 cycles under the following con-ditions: 98 °C for 10 s, 65 °C for 15 s, and 68 °C 5 min. Wethen incubated the tube at 68 °C for an additional 5 min.Finally, we transferred all of the PCR solution, derivedfrom one 384-well PCR plate, to a 50-mL polypropylenecentrifuge tube (Watson). Typically, we obtained approxi-mately 1.2 mL of PCR solution per 384-well PCR plate.We added 32 μL of 3 M sodium acetate (pH 5.2) and 6420μL PB-Buffer (Qiagen) to the PCR solution. The mixturewas then purified using a MinElute Spin Column (Qiagen).Purified cDNA was extracted into 40 μL of nuclease-freewater. We additionally purified the cDNA with 32 μL ofAmpure XP beads. Finally, we obtained 32 μL of purifiedcDNA. We checked the length distribution of amplifiedcDNA with an Agilent High Sensitivity DNA Kit (Agilent).The typical average size of the amplified cDNA in Quartz-Seq2 was approximately 1400 bp (Additional file 1: FigureS2c). Primer sequences are listed in Additional file 5:Table S4.In the case of the usage of the v3.2 RT primer in
Quartz-Seq2, we modified the above steps as follows. AfterRT, we collected cDNA solution into a disposable reser-voir from four sets of 384-well plates, which corresponded
to 1536 wells. We purified and concentrated the cDNA so-lution using eight purification columns for four 384-wellPCR plates in the case of the v3.2 RT primer system. Inthe PCR step, we amplified cDNA for nine cycles with thefollowing conditions: 98 °C for 10 s, 65 °C for 15 s, and 68°C for 5 min. Finally, we transferred all of the PCR solutionderived from four 384-well plates to a 50-mL polypropyl-ene centrifuge tube (Watson). Typically, we obtained ap-proximately 3.5 mL of PCR solution per four 384-wellPCR plates. We added 88 μL of 3 M sodium acetate (pH5.2) and 17.6 mL of PB-Buffer (Qiagen) to the PCR solu-tion. The mixture was purified using the MinElute SpinColumn (Qiagen). Subsequently, cDNA was again purifiedusing Ampure XP magnetic beads.For the Quartz-Seq1-like reaction, we performed the
following procedure in accordance with our previousstudy. We added 1 μL of RT premix (2× PCR buffer, 5units/μL SuperScript III, 0.55 units/μL RNasin plus) to 1μL of lysis buffer. We then performed RT at 35 °C for 5min and 45 °C for 20 min. This RT was stopped at 70 °Cfor 15 min. We added 5 μL of ExoIB solution (1.6× Exo-nuclease I buffer, 3.2× PCR buffer, 16 mM DTT) and 20μL of TdT solution (1× PCR buffer, 3 mM dATP, 0.0384units/μL RNase H (Invitrogen), 33.6 units/μL terminaltransferase (Roche)) into 20 μL of extracted cDNA usinga pipette at 0 °C. The PCR tubes were placed on theblock of the thermal cycler that had been prechilled to 0°C. We performed a poly(A) tailing reaction at 37 °C for75 s. We then denatured the solution at 98 °C for 130 sand hybridized tagging primer to poly(A)-tailed cDNA at40 °C for 1 min. After that, we performed second-strandsynthesis at 68 °C for 5 min. Subsequently, we amplifiedthe cDNA via a PCR reaction for 12 cycles.
Preparation of truncated sequence adaptorThe truncated sequence adaptor was composed of anrYshapeP5 primer (HPLC-purified) and rYshapeP7LTprimers (HPLC-purified), which had a TruSeqLT-compatible pool barcode. We prepared 100 μM respect-ive primers with adaptor buffer (10 mM Tris-HCl pH7.8, 0.1 mM EDTA pH 8.0, 50 mM NaCl). We added 5μL of 100 μM rYshapeP5 primer and rYshapeP7LTxx pri-mer into a single PCR tube. We denatured the solutionat 90 °C for 90 s. After that, we achieved annealing bycooling to 10 °C by 0.5 °C every 30 s and then maintain-ing the sample at 4 °C. We then placed the tube on analuminum PCR stand at 0 °C. Subsequently, we addedadaptor buffer, which was prechilled at 0 °C, to 10 μL of50 μM truncated adaptor. Finally, we obtained about 50μL of 10 μM truncated adaptor. We cryopreserved 1 μLof 10 μM truncated adaptor in a PCR tube at −80 °Cuntil usage in the adaptor ligation step. Primer sequencesare listed in Additional file 5: Table S4.
Sasagawa et al. Genome Biology (2018) 19:29 Page 19 of 24

Sequence library preparation of Quartz-Seq2We added 130 μL of nuclease-free water including 5–10ng of amplified cDNA into a Crimp-Cap microTUBEwith AFA Fiber. We then performed cDNA fragmenta-tion using an LE220 Focused-ultrasonicator (Covaris)under the following conditions: duty factor 15%, peak in-cident power 450 W, cycles per burst 200, and treatmenttime 80 s. We purified and concentrated the cDNA solu-tion using the DNA Clean & Concentrator™-5 kit. Puri-fied cDNA was extracted into 10 μL of nuclease-freewater from one column purification and transferred intoan eight-linked PCR tube (TaKaRa).We then added 2 μL of End-Repair premix (1.4 μL of End
repair & A-tailing buffer and 0.6 μL of End repair & A-tailing Enzyme (KAPA Biosystems)) to 10 μL of fragmentedcDNA solution. Subsequently, we mixed the solution bypipetting on an aluminum PCR stand at 0 °C. The PCRtubes were placed on the block of the thermal cycler, whichhad been prechilled to 20 °C. We then incubated the tubesat 37 °C for 60 min and 65 °C for 30 min. After this, weadded 2 μL of adaptor buffer (1.5 μM truncated adaptor, 10mM Tris-HCl pH 7.8, 0.1 mM EDTA pH 8.0, 50 mM NaCl)and 8 μL of ligation premix (6 μL of ligation buffer, 2 μL ofDNA ligase (KAPA Biosystems)) at 4 °C. The 22 μL ofligation solution was well mixed by pipetting at 4 °C. Then,we performed adaptor ligation at 20 °C for 15 min. Afterligation, we added 18 μL of Ampure XP beads to 22 μL ofadaptor ligation solution and mixed them well. Adaptor-ligated cDNA was extracted into 20 μL of nuclease-freewater. We added 32 μL of PCR premix (25 μL of 2×KAPAHiFi ready mix, 1.75 μL of 10 μM TPC2 primer (HPLC-purified), 10 μM P5-gMac hybrid primer (HPLC-purified))to 18 μL of adaptor-ligated cDNA. We denatured the solu-tion at 98 °C for 45 s. Subsequently, we amplified cDNA foreight cycles under the following conditions: 98 °C for 15 s,60 °C for 30 s, and 72 °C for 1 min. Finally, we additionallyincubated the tube at 72 °C for 5 min.We added 40 μL of Ampure XP beads to 50 μL of PCR
solution. Purified sequence-library DNA was eluted into20–30 μL of nuclease-free water. We checked the DNAconcentration and DNA size of sequence library DNAusing the Agilent High Sensitivity DNA Kit (Agilent) andQuantiFluor® dsDNA System (Promega). We also preparedsequence library DNA with Tn5 transposase, in accord-ance with a modified version of a procedure used in a pre-vious study [6]. Specifically, the modifications were asfollows. We used 0.75 ng of amplified cDNA for the Nex-tera XT library preparation kit. We amplified sequence li-brary DNA with the P5-gMac hybrid primer and theNextera XT primer, which has the P7 sequence.
Deep sequencing for Quartz-Seq2We analyzed the sequence library DNA from Quartz-Seq2 using NextSeq500 (Illumina) and HiSeq2500
(Illumina). For the Read1 sequence, we used a customsequence primer named Read1DropQuartz primer(HPLC-purified). In the case of the v3.1 RT primer, se-quence specification was as follows (Read1, 22 cycles;Index1, 6 cycles; Read2, 64–118 cycles). In the case of thev3.2 RT primer, sequence specification was as follows(Read1, 23 cycles; Index1, 6 cycles; Read2, 63 cycles).When Read1 length was within 64 nucleotides we mainlyused the NextSeq 500/550 High Output v2 Kit (75 cycles),which can be used for sequencing up to 92 nucleotides.For long sequences (over 64 nucleotides), we analyzed se-quence library DNA using the HiSeq Rapid SBS Kit v2. Se-quence analysis with HiSeq2500 was supported by theGenomic Network Analysis Support facility (GeNAS) inRIKEN and Phyloinformatics Unit of RIKEN Center forLife Science Technologies (formerly GRAS) in RIKEN.
Amplification-free single-cell qPCR analysisAmplification-free single-cell qPCR was performed in ac-cordance with our previous study with the followingmodifications [15]. We collected a single cell into 1 μLof lysis buffer (2.5 μM random hexamer, 1 mM dNTPmix, 0.3% NP40, 2 units/μL RNasin plus) of a 384-wellPCR plate (Eppendorf ) using SH800. The resulting 384-well PCR plate was cryopreserved at −80 °C. We dena-tured total RNA in the 384-well PCR plate at 70 °C for1.5 min using a C1000/S1000 thermal cycler and hybrid-ized the random primer to RNA at 0 °C for 2 min. Weadded 1 μL of RT solution (2× SSIV buffer, 10 mM DTT,2 units/μL RNasin plus, 20 units/μL SuperScript IV) tothe lysis buffer. Subsequently, we performed RT at 23 °Cfor 10 min and 50 °C for 10 min. The RT was stopped at80 °C for 10 min. The resulting solution was diluted withqPCR solution (10 mM Tris-HCl pH 8.0, 0.05% Tween-20). The obtained diluted solution was then used forqPCR detection with QuantiTect SYBR Green PCR Mas-ter Mix and the LightCycler480 system. For primer setsfor each gene, see Additional file 5: Table S4.
Drop-seq experiments and data analysisDrop-seq was performed as reported previously [6] andin line with an online protocol (http://mccarrolllab.com/dropseq/), but with the following modifications: flowrates for oil and aqueous suspensions were 14,000 μl/hand 4000 μl/h, respectively. The diameter of dropletswas 95–100 μm. Microfluidic devices were fabricated byFluidware Technologies (Japan). The lot number of bar-coded beads was 051415 (ChemGenes). Data analysis forDrop-seq was performed as described online (http://mccarrolllab.com/dropseq/). The versions of the softwareand databases were as follows: STAR: v2.5.1b; mousegenome, GRCm38/mm10; genome annotation, gencodeGRCm38.p4 vM9; and Drop-seq tools, v1.11.
Sasagawa et al. Genome Biology (2018) 19:29 Page 20 of 24
Quartz-Seq2 read alignment and generation of digitalexpression dataThe structure of the sequence library and data processingwas designed based on those of Drop-seq ([6] and online asreferenced above). BCL files generated by Illumina Next-Seq500 were converted to fastq files by bcl2fastq2(v2.17.1.14) with demultiplexing pool barcodes. The–mask-short-adapter-reads parameter was set to 20. Ifneeded, fastq reads were randomly downsampled by seqtksoftware (version sgdp). We mainly trimmed read2 lengthto 62 nucleotides for Quartz-Seq2 by using FASTX-Toolkit(version 0.0.14). Fastq files for Read1 and Read2 were con-verted to a bam file by FastqToSam of Picard tools (version1.134). Extracting cell barcodes and UMI (also called asmolecular barcode) and filtering out of reads with low bar-code quality were performed using Drop-seq tools (version1.11). The resulting bam files were re-converted to fastqfiles by SamToFastq of Picard tools, and mapped to themouse genome (GRCm38/mm10) using STAR (version2.5.1b). After sorting the resulting bam files using SortSamof Picard tools, the unaligned bam and aligned bam weremerged by MergeBamAlignment of Picard tools. Then,gene names were assigned to each record using TagRead-WithGeneExon of Drop-seq tools and gtf file (version gen-code GRCm38.p4 vM9). For the correction of errors of cellbarcodes considering the Sequence–Levenshtein distance, acustom-made Python program (correct_bacode.py) wasused, which enabled the correction of up to two nucleotideerrors of substitution, insertion, or deletion. This programused Python2 (version 2.7.11+), PypeR (version 1.1.2), R(version 3.2.3), Bioconductor (version 3.2), and the Biocon-ductor package DNABarcodes (version 1.0.0). Finally, theUMI for each gene for each cell was counted using Digita-lExpression of Drop-seq tools, which generated the digitalexpression matrix. To generate a non-UMI-filtered matrix,a custom-made Python program that counts reads for eachgene for each cell was used. To compare the quantitativeperformance between Quartz-Seq2 and reported data inFig. 4, we used Ensembl75 as a reference transcript. More-over, we trimmed the read2 length to 45 nucleotides for thecomparison.
Dimensionality reduction, clustering, and term analysisCells with low detected gene counts were removed for fur-ther analysis (Quartz-Seq2 on ES/PrE mixture, 4000 genes;Quartz-Seq2 on SVF, 500 genes). Total counts of each cellwere normalized to 10,000 or the mean of total UMIcounts for cells. UMI counts had 1 added to them andwere then log-transformed (natural logarithm), after whichthey were scaled to have mean and variance for each geneof 0 and 1, respectively. For PCA, UMI counts for all de-tected genes (for ES/PrE mixture) or genes with highlyvariable expression (for SVF) were used. For t-SNE, thetop 10 to 40 principal components of matrices produced
by PCA were used. For clustering, the DBSCAN algorithmwas used. The values of the parameter epsilon were 0.69for Quartz-Seq2 on the 4500 mouse ES/PrE mixture, 5 forQuartz-Seq2 on the 384 mouse ES/PrE mixture, 3 forDrop-seq on the 500 mouse ES/PrE mixture, and 2.2 forSVF analysis. Significantly enriched Gene Ontology (GO)terms with the top principal components were calculatedusing the GO-PCA package [45].
Identification of differentially expressed genes for eachclusterMarker genes for each cluster were identified basedon a generalized linear model. The difference in de-viance between two models, in which the gene wasor was not differentially expressed between two clus-ters, was calculated for the genes. To filter out noise,pseudocount 1 was added to the averaged gene ex-pression in clusters and only genes with fold changeof 2 or more between two clusters were further ana-lyzed. P values were calculated as 1 − cumulativedensity function of a chi-squared continuous randomvariable for difference in deviance. After correctionsfor multiple testing, genes with FDR of less than0.05 were identified as differentially expressed genesfor the cluster. For comparison between differentiallyexpressed genes identified by scRNA-seq methodsand those identified by bulk RNA-seq, this pseudo-count was not added.
Identification of variable genes in the same cell-typeTo identify genes for which the expression changes depend-ing on the phase of the cell cycle, we used the intensity ofHoechst 33,342 staining measured using a cell sorter. First,cells were discretized into 40 equal-sized buckets based onthe rank of Hoechst 33,342 staining intensity. Then, the CVof averaged UMI counts for a gene in each bin was calcu-lated. After z-scaling of this, genes with high z-scores wereidentified. To identify genes whose expression fluctuates ina manner not relating to the cell cycle phase, we calculatedthe CV of UMI counts for a gene in each cell and the CVof averaged UMI counts for a gene in each bin. After z-scaling of such data, the genes for which the difference be-tween two scaled CVs was large were identified as “variablegenes the expression of which is less associated with the cellcycle phase”.
Enrichment analysis on pathway and GO termsPathways that were particularly enriched for the differen-tially expressed genes were calculated using the Reacto-mePA package of R Bioconductor (version 1.14.4) [46]and Metascape (http://metascape.org/) [47]. The cut-offparameter for the q value was 0.05. Terms that wereenriched for genes with highly variable expression werecalculated using DAVID, the Database for Annotation,
Sasagawa et al. Genome Biology (2018) 19:29 Page 21 of 24
Visualization and Integrated Discovery (version 6.8) [48,49]. Ontology used for calculation was GOTERM_BP_-FAT, GOTERM_MF_FAT, and GOTERM_CC_FAT. Theterms with FDR < 0.05 were identified as enriched terms.
Quantitative analysis for external RNA moleculesTo calculate the ERCC capture efficiency, we deter-mined the slope of regression between the inputERCC molecules and detected UMI counts for eachERCC. We tested our calculation using digital expres-sion matrix (GSM1599501) of the inDrop single-cellsequence method as a control, and confirmed thatour calculated ERCC capture efficiency (7.2%) ap-proximately matched their reported ERCC capture ef-ficiency (7.1%). To calculate the copy number ofERCC spike-in RNA at the 50% detection probability,the method of Svensson et al. was used [50]. We con-firmed that our calculated results and those in thepaper by Svensson et al. were approximately similar.For calculation of ERCC capture efficiency and thecopy number of ERCC spike-in RNA at the 50% de-tection probability for previous data, we used the con-centration of ERCC spike-in RNA, which wasreported by the original authors. For the paper byZiegenhain et al. [21], we confirmed the concentrationby personal communication.
Simulation-based power analysisPowsimR was used to perform power analysis [51]. Theparameters of the negative binomial distribution,namely, mean, dispersion, and dropout probability, wereestimated by the function estimateParam with the fol-lowing parameters: sigma = 1.96, distribution = “NB,”RNAseq = “singlecell”, and normalization = “scran”. Tosimulate differential expression between two groupsusing these parameters, the number of genes is repre-sented by the number of detected genes (count > 0) ineach method. Differentially expressed genes set up sim-ulations with number of detected genes, 23.6% genesbeing differentially expressed, log fold change samplefrom a narrow gamma distribution (shape 1.02, rate0.78). That parameter was derived from parameter esti-mates based on bulk RNA-seq data from mouse ES andPE cells (n = 3). The function simulateDE was used torun power analysis with the following parameters:DEmethod = MAST and normalization = scran. The re-sults of power simulation were plotted using R withggplot2 packages.
Data resourcesRaw and processed data files for Quartz-Seq2 andDrop-seq experiments are available under GEO (ac-cession GSE99866; https://www.ncbi.nlm.nih.gov/geo/query/acc.cgi?acc=GSE99866) for single-cell RNA-seq
data and DRA002954 for bulk-RNA-seq data. Acustom-made python program (correct_bacode.py) hasbeen deposited under GitHub (DOI: https://doi.org/10.5281/zenodo.1118151, https://github.com/rikenbit/correct_barcode/).
Additional files
Additional file 1: Supplemental note and supplemental figures.(PDF 12818 kb)
Additional file 2: Table S1. Cost calculation for Quartz-seq2. (XLSX 97 kb)
Additional file 3: Table S2. Differentially expressed genes betweenclusters 1 and 8. (XLSX 85 kb)
Additional file 4: Table S3. Enrichment analysis of biologicalpathways using the genes differentially expressed between clusters1 and 8. (XLSX 404 kb)
Additional file 5: Table S4. Primer sequences. (XLSX 148 kb)
Additional file 6: Table S5. Buffer composition for the poly-tailing step.(XLSX 33 kb)
Abbreviationsbp: Base pair; CV: Coefficient of variation; DEG: Differentially expressed gene;Dex: Dexamethasone; ES: Embryonic stem; FDR: False discovery rate;GO: Gene Ontology; MSC: Mesenchymal stem cell; PCA: Principal componentanalysis; PCC: Pearson’s correlation coefficient; PCR: Polymerase chainreaction; PrE: Primitive endoderm; RT: Reverse transcription; SCC: Spearman’srank correlation coefficient; SSC: Side scatter; SVF: Stromal vascular fraction;TdT: Terminal deoxynucleotidyl transferase; TPR: True positive rate;t-SNE: t-Distributed stochastic neighbor embedding; UMI: Uniquemolecular identifier
AcknowledgementsWe greatly appreciate the Drop-seq team’s useful comments about our technicalintroduction to Drop-seq. We thank Mr. Akihiro Matsushima and Mr. Manabu Ishiifor their assistance with the infrastructure for the data analysis. We are also gratefulto Dr. Christoph Ziegenhain and Dr. Wolfgang Enard for giving us their quantitativedata from single-cell RNA-seq methods. We also thank Dr. Rudolf Jaenisch and Dr.Yoichi Shinkai for giving us the J1 ES cell line. Advice and comments from Dr.Tempei Sato were also of great help in the culture of J1 ES cells. We thank Dr.Yutaka Suzuki for his assistance with the bulk RNA-seq. We are also grateful to Dr.Mika Yoshimura and Dr. Haruka Ozaki (RIKEN) for their assistance with the bulkRNA-seq analysis. Moreover, we thank the staff at the Phyloinformatics Unit ofRIKEN Center for Life Science Technologies (formerly GRAS) for their assistance withthe HiSeq2500 sequencer. Our thanks also go to Sony’s cell sorter team forspecially customizing the 384-well sorting mode of the SH800. Finally, we thankEdanz Group (www.edanzediting.com/ac) for editing a draft of this manuscript.
FundingThis work was supported by the Projects for Technological Development,Research Center Network for Realization of Regenerative Medicine by Japan,the Japan Agency for Medical Research and Development (AMED), and theJapan Science and Technology Agency (JST). The sequence analyses of bulkRNA-seq were supported by MEXT KAKENHI (number 221S0002) and JSPSKAKENHI grant number JP24651218 and JSPS KAKENHI grant numberJP15K16329. The sequence operations of Quartz-Seq2 using HiSeq2500 weresupported by the Platform Project for Supporting Drug Discovery and LifeScience Research (Platform for Drug Discovery, Informatics, and Structural LifeScience) from AMED. This work was partially supported by JST CREST grantnumber JPMJCR16G3, Japan.
Availability of data and materialsThe data have been deposited under GEO accession number GSE99866 andDRA accession number DRA002954 [52, 53]. A custom-made python program(correct_bacode.py) has been deposited under GitHub (DOI: https://doi.org/10.5281/zenodo.1118151, https://github.com/rikenbit/correct_barcode/).
Sasagawa et al. Genome Biology (2018) 19:29 Page 22 of 24

Authors’ contributionsYS, HD, and IN designed the study. YS designed and developed the Quartz-Seq2reaction. YS and KT performed experiments of single-cell RNA-seq. HD, YS, and INdesigned and performed data analysis. HT and AK designed and performedexperiments on the mouse stromal vascular fraction. ME and KT assisted with theexperiments. TH assisted with the development of the spin-down collectionsystem. YS, HD, HT, AK, and IN wrote the manuscript. All authors read andapproved the final manuscript.
Ethics approval and consent to participateMouse experiments were carried out in accordance with the protocolapproved by the Committee on Animal Research at Nara Institute of Scienceand Technology (IRB approval number 1702) and the RIKEN AnimalExperiment Committee.
Consent for publicationNot applicable.
Competing interestsThe authors declare that they have no competing interests.
Author details1Bioinformatics Research Unit, Advanced Center for Computing andCommunication, RIKEN, Hirosawa 2-1, Wako, Saitama, Japan. 2Laboratory ofStem Cell Technology, Graduate School of Biological Sciences, Nara Instituteof Science and Technology, Takayama-cho 8916-5, Ikoma, Nara, Japan.3Single-cell Omics Research Unit, RIKEN Center for Developmental Biology,2-2-3 Minatojima-minamimachi, Chuo-ku, Kobe, Japan.
Received: 20 July 2017 Accepted: 14 February 2018
References1. Zheng GXY, Terry JM, Belgrader P, Ryvkin P, Bent ZW, Wilson R, et al.
Massively parallel digital transcriptional profiling of single cells. NatCommun. 2017;8:14049.
2. Muraro MJ, Dharmadhikari G, Grün D, Groen N, Dielen T, Jansen E, et al. Asingle-cell transcriptome atlas of the human pancreas. Cell Syst. 2016;3:385–94.
3. Hashimshony T, Senderovich N, Avital G, Klochendler A, de Leeuw Y, AnavyL, et al. CEL-Seq2: sensitive highly-multiplexed single-cell RNA-Seq. GenomeBiol. 2016;17:892.
4. Fan X, Zhang X, Wu X, Guo H, Hu Y, Tang F, et al. Single-cell RNA-seqtranscriptome analysis of linear and circular RNAs in mouse preimplantationembryos. Genome Biol. 2015;16:236.
5. Nakamura T, Yabuta Y, Okamoto I, Aramaki S, Yokobayashi S, Kurimoto K, etal. SC3-seq: a method for highly parallel and quantitative measurement ofsingle-cell gene expression. Nucleic Acids Res. 2015;43:e60.
6. Macosko EZ, Basu A, Satija R, Nemesh J, Shekhar K, Goldman M, et al. Highlyparallel genome-wide expression profiling of individual cells using nanoliterdroplets. Cell. 2015;161:1202–14.
7. Klein AM, Mazutis L, Akartuna I, Tallapragada N, Veres A, Li V, et al. Dropletbarcoding for single-cell transcriptomics applied to embryonic stem cells.Cell. 2015;161:1187–201.
8. Fan HC, Fu GK, Fodor SPA. Combinatorial labeling of single cells for geneexpression cytometry. Science. 2015;347:1258367.
9. Bose S, Wan Z, Carr A, Rizvi A, Vieira G, Pe’er D, et al. Scalable microfluidicsfor single-cell RNA printing and sequencing. Genome Biol. 2015;16:120.
10. Streets AM, Zhang X, Cao C, Pang Y, Wu X, Xiong L, et al. Microfluidic single-cellwhole-transcriptome sequencing. Proc Natl Acad Sci U S A. 2014;111:7048–53.
11. Jaitin DA, Kenigsberg E, Keren-Shaul H, Elefant N, Paul F, Zaretsky I, et al.Massively parallel single-cell RNA-Seq for marker-free decomposition oftissues into cell types. Science. 2014;343:776–9.
12. Soumillon M, Cacchiarelli D, Semrau S, van Oudenaarden A, Mikkelsen TS.Characterization of directed differentiation by high-throughput single-cellRNA-Seq. bioRxiv. 2014; https://doi.org/10.1101/003236
13. Islam S, Zeisel A, Joost S, La Manno G, Zajac P, Kasper M, et al.Quantitative single-cell RNA-seq with unique molecular identifiers. NatMethods. 2013;11:163–6.
14. Picelli S, Björklund ÅK, Faridani OR, Sagasser S, Winberg G, Sandberg R.Smart-seq2 for sensitive full-length transcriptome profiling in single cells.Nat Methods. 2013;10:1096–8.
15. Sasagawa Y, Nikaido I, Hayashi T, Danno H, Uno KD, Imai T, et al. Quartz-Seq:a highly reproducible and sensitive single-cell RNA sequencing method,reveals non-genetic gene-expression heterogeneity. Genome Biol. 2013;14:R31.
16. Hashimshony T, Wagner F, Sher N, Yanai I. CEL-Seq: single-cell RNA-Seq bymultiplexed linear amplification. Cell Rep. 2012;2:666–73.
17. Ramsköld D, Luo S, Wang Y-C, Li R, Deng Q, Faridani OR, et al. Full-lengthmRNA-Seq from single-cell levels of RNA and individual circulating tumorcells. Nat Biotechnol. 2012;30:777–82.
18. Islam S, Kjallquist U, Moliner A, Zajac P, Fan JB, Lonnerberg P, et al.Characterization of the single-cell transcriptional landscape by highlymultiplex RNA-seq. Genome Res. 2011;21:1160–7.
19. Tang F, Barbacioru C, Wang Y, Nordman E, Lee C, Xu N, et al. mRNA-Seqwhole-transcriptome analysis of a single cell. Nat Methods. 2009;6:377–82.
20. Grün D, Kester L, van Oudenaarden A. Validation of noise models for single-cell transcriptomics. Nat Methods. 2014;11:637–40.
21. Ziegenhain C, Vieth B, Parekh S, Reinius B, Guillaumet-Adkins A, Smets M, etal. Comparative analysis of single-cell RNA sequencing methods. Mol Cell.2017;65:631–4.
22. Buschmann T. DNABarcodes: an R package for the systematic constructionof DNA sample tags. Bioinformatics. 2017;33(6):920–2.
23. Shimosato D, Shiki M, Niwa H. Extra-embryonic endoderm cells derived fromES cells induced by GATA Factors acquire the character of XEN cells. BMCDev Biol. 2007;7:80.
24. Ilicic T, Kim JK, Kolodziejczyk AA, Bagger FO, McCarthy DJ, Marioni JC, et al.Classification of low quality cells from single-cell RNA-seq data. GenomeBiol. 2016;17:57.
25. Zalzman M, Falco G, Sharova LV, Nishiyama A, Thomas M, Lee S-L, et al.Zscan4 regulates telomere elongation and genomic stability in ES cells.Nature. 2010;464:858–63.
26. Pak J, Lee JH, Park KS, Park M, Kang L-W, Lee SH. Current use of autologousadipose tissue-derived stromal vascular fraction cells for orthopedicapplications. J Biomed Sci. 2017;24:1496.
27. Trounson A, McDonald C. Stem cell therapies in clinical trials: progress andchallenges. Cell Stem Cell. 2015;17:11–22.
28. Baer PC, Geiger H. Adipose-derived mesenchymal stromal/stem cells: tissuelocalization, characterization, and heterogeneity. Stem Cells Int. 2012;2012:1–11.
29. Lindroos B, Suuronen R, Miettinen S. The potential of adipose stem cells inregenerative medicine. Stem Cell Rev. 2010;7:269–91.
30. Kwon HM, Hur S-M, Park K-Y, Kim C-K, Kim Y-M, Kim H-S, et al. Multipleparacrine factors secreted by mesenchymal stem cells contribute toangiogenesis. Vascul Pharmacol. 2014;63:19–28.
31. Madrigal M, Rao KS, Riordan NH. A review of therapeutic effects ofmesenchymal stem cell secretions and induction of secretory modificationby different culture methods. J Transl Med. 2014;12:71.
32. Rennert RC, Januszyk M, Sorkin M, Rodrigues M, Maan ZN, Duscher D,et al. Microfluidic single-cell transcriptional analysis rationally identifiesnovel surface marker profiles to enhance cell-based therapies. NatCommun. 2016;7:11945.
33. Baer PC. Adipose-derived mesenchymal stromal/stem cells: an update ontheir phenotype in vivo and in vitro. World J Stem Cells. 2014;6:256.
34. Mabuchi Y, Houlihan DD, Akazawa C, Okano H, Matsuzaki Y. Prospectiveisolation of murine and human bone marrow mesenchymal stem cellsbased on surface markers. Stem Cells Int. 2013;2013:1–7.
35. Dromard CC, Barreau C, Andr M, Berger-Muller S, Casteilla L, Planat-Benard V.Mouse adipose tissue stromal cells give rise to skeletal and cardiomyogeniccell sub-populations. Front Cell Dev Biol. 2014;2:697.
36. Heneidi S, Simerman AA, Keller E, Singh P, Li X, Dumesic DA, et al.Awakened by cellular stress: isolation and characterization of a novelpopulation of pluripotent stem cells derived from human adipose tissue.PLoS One. 2013;8:e64752.
37. Wachi H. Role of elastic fibers on cardiovascular disease. J Health Sci. 2011;57:449–57.
38. Hughes-Fulford M, Li C-F. The role of FGF-2 and BMP-2 in regulation ofgene induction, cell proliferation and mineralization. J Orthop Surg Res.2011;6:8.
39. Kurimoto K. An improved single-cell cDNA amplification method forefficient high-density oligonucleotide microarray analysis. Nucleic AcidsRes. 2006;34:e42.
40. Yang L, Ma Z, Cao C, Zhang Y, Wu X, Lee R, et al. MR-Seq: measuring asingle cell’s transcriptome repeatedly by RNA-seq. Sci Bull. 2017;62(6):391–8.
Sasagawa et al. Genome Biology (2018) 19:29 Page 23 of 24
41. Velten L, Haas SF, Raffel S, Blaszkiewicz S, Islam S, Hennig BP, et al. Humanhaematopoietic stem cell lineage commitment is a continuous process. NatCell Biol. 2017;19(4):271–81.
42. Kowalczyk MS, Tirosh I, Heckl D, Rao TN, Dixit A, Haas BJ, et al. Single-cellRNA-seq reveals changes in cell cycle and differentiation programs uponaging of hematopoietic stem cells. Genome Res. 2015;25:1860–72.
43. Wu AR, Neff NF, Kalisky T, Dalerba P, Treutlein B, Rothenberg ME, et al.Quantitative assessment of single-cell RNA-sequencing methods. NatMethods. 2013;11:41–6.
44. Pauklin S, Vallier L. The cell-cycle state of stem cells determines cell fatepropensity. Cell. 2013;155:135–47.
45. Wagner F. GO-PCA: an unsupervised method to explore gene expressiondata using prior knowledge. PLoS One. 2015;10:e0143196.
46. Yu G, He Q-Y. ReactomePA: an R/Bioconductor package for reactomepathway analysis and visualization. Mol Biosyst. 2016;12:477–9.
47. Tripathi S, Pohl MO, Zhou Y, Rodriguez-Frandsen A, Wang G, Stein DA, et al.Meta- and orthogonal integration of influenza “OMICs” data defines a rolefor UBR4 in virus budding. Cell Host Microbe. 2015;18:723–35.
48. Huang DW, Sherman BT, Lempicki RA. Systematic and integrativeanalysis of large gene lists using DAVID bioinformatics resources. NatProtoc. 2008;4:44–57.
49. Huang DW, Sherman BT, Lempicki RA. Bioinformatics enrichment tools:paths toward the comprehensive functional analysis of large gene lists.Nucleic Acids Res. 2008;37:1–13.
50. Svensson V, Natarajan KN, Ly L-H, Miragaia RJ, Labalette C, Macaulay IC, et al.Power analysis of single-cell RNA-sequencing experiments. Nat Methods.2017;6:150.
51. Vieth B, Ziegenhain C, Parekh S, Enard W, Hellmann I. powsimR: poweranalysis for bulk and single cell RNA-seq experiments. Bioinformatics. 2017;33:3486–8.
52. Danno H, Sasagawa Y, Nikaido I. Quartz-Seq2: a high-throughput single-cellRNA-sequencing method that effectively uses limited sequence reads. GeneExpression Omnibus. 2017. https://www.ncbi.nlm.nih.gov/geo/query/acc.cgi?acc=GSE99866.
53. Danno H, Sasagawa Y, Nikaido I. Validation of single-cell RNA-seq methods.DDBJ Sequence Read Archive. 2015. https://trace.ddbj.nig.ac.jp/DRASearch/study?acc=DRP003704.
• We accept pre-submission inquiries
• Our selector tool helps you to find the most relevant journal
• We provide round the clock customer support
• Convenient online submission
• Thorough peer review
• Inclusion in PubMed and all major indexing services
• Maximum visibility for your research
Submit your manuscript atwww.biomedcentral.com/submit
Submit your next manuscript to BioMed Central and we will help you at every step:
Sasagawa et al. Genome Biology (2018) 19:29 Page 24 of 24