rare event detection algorithm user's...
TRANSCRIPT

Rare Event Detection Algorithm User’s Guide

ii Rare Event Detection Algorithm User’s Guide
Copyright © 2008 Aperio Technologies, Inc. Part Number/Revision: MAN‐0123, Revision A
Date: September 2, 2008 This document applies to software versions Release 9.1 and later.
All rights reserved. This document may not be copied in whole or in part or reproduced in any other media without the express written permission of Aperio Technologies, Inc. Please note that under copyright law, copying includes translation into another language.
User Resources For the latest information on Aperio Technologies products and services, please visit the Aperio Technologies website at: http://www.aperio.com.
Disclaimers This manual is not a substitute for the detailed operator training provided by Aperio Technologies, Inc., or for other advanced instruction. Aperio Technologies Field Representatives should be contacted immediately for assistance in the event of any instrument malfunction. Installation of hardware should only be performed by a certified Aperio Technologies Service Engineer.
ImageServer is intended for use with the SVS file format (the native format for digital slides created by scanning glass slides with the ScanScope scanner). Educators will use Aperio software to view and modify digital slides in Composite WebSlide (CWS) format.
Aperio products are FDA cleared for specific clinical applications, and are intended for research use for other applications.
Trademarks and Patents ScanScope is a registered trademark and ImageServer, TMALab, ImageScope, and Spectrum are trademarks of Aperio Technologies, Inc. All other trade names and trademarks are the property of their respective holders.
Aperio products are protected by U.S. Patents: 6,711,283; 6,917,696; 7,035,478; and 7,116,440; and licensed under one or more of the following U.S. Patents: 6,101,265; 6,272,235; 6,522,774; 6,775,402; 6,396,941; 6,674,881; 6,226,392; 6,404,906; 6,674,884; and 6,466,690.
Contact Information Headquarters: Aperio Technologies, Inc.
1360 Park Center Drive Vista, CA 92081 United States
European Office: Aperio 3 The Sanctuary Eden Office Park Ham Green Bristol BS20 0DD, UK
United States of America
Tel: 866-478-4111 (toll free) Fax: 760-539-1116 Customer Service Tel: 866-478-4111 (toll free) Technical Support Tel: 866-478-3999 (toll free) Email: [email protected]
Europe Tel: +44 (0) 1275 375123 Fax: +44(0) 1275 373501 Customer Service Tel: +44 (0) 1275 375123 Technical Support Tel: +44 (0) 1275 375123 Email: [email protected]
Contents
CHAPTER 1 - INTRODUCTION ....................................................................... 1 The Rare Event Detection Algorithm......................................................................1
Prerequisites ............................................................................................................4 For More Information.............................................................................................4
FDA Cleared Image Analysis Algorithms .............................................................5 Intended Use ...............................................................................................................5
CHAPTER 2 - QUICK REFERENCE.................................................................... 7 Algorithm Input Parameters.....................................................................................7 Algorithm Results ......................................................................................................8
Understanding the Results ....................................................................................8
CHAPTER 3 - RARE EVENT DETECTION ANALYSIS ............................................. 11 Color Concepts..........................................................................................................11 Running an Analysis ...............................................................................................12
INDEX................................................................................................... 19
Rare Event Detection Algorithm User’s Guide iii

Contents
iv Rare Event Detection Algorithm User’s Guide

1 Introduction
This chapter introduces you to the Rare Event Detection algorithm. For general information on using an algorithm, please see the Aperio Image Analysis User’s Guide.
The process of analyzing digital images begins with the ScanScope, which creates digital slides by scanning glass slides. Using Aperio image analysis algorithms to analyze digital slides provides several benefits:
Increases productivity – Image analysis can be used to automate repetitive tasks.
Improves healthcare –Image analysis can be used to detect histological patterns reliably on large data sets and quantify the staining accurately and consistently.
Development of new computer‐based methods – Image analysis helps you answer questions that are beyond the capabilities of manual microscopy, such as “What is the significance of multiple stains at the cell level and colocalization of stains?”
Workflow integration – The Spectrum digital pathology information management software suite integrates image analysis seamlessly into your digital pathology workflow, requiring no additional work by the lab or pathologist. With the click of a button, the algorithm is executed while you review the digital slide.
The Rare Event Detection Algorithm Humans have an incredible vision system, but when it comes to looking for a needle in a hay stack they not only take a long time to process a lot of data, but also fatigue easily and become less reliable. There are many tasks where pathologists have to look for a rare event—for example, detection of micrometastasis of tumor cells in circulating blood. A computer program tuned to find the rare events can process an entire slide quickly and reliably without fatigue. When a pathologist then looks at the slide, the computer program can instantaneously present all the rare events found. This saves the pathologists time as well as providing more reliable test results.
The Rare Event Detection algorithm allows you to define the objects you are looking for by color (defined in the Hue Saturation Intensity color space) and
Rare Event Detection Algorithm User’s Guide 1

Chapter 1 – Introduction
size. The algorithm uses color segmentation and morphological image processing methods to detect and count objects of interest. Size and color‐saturation thresholds are used to identify objects such as potential tumor cells and reject background staining artifacts. The roundness threshold is used to count only the most circular objects.
As an example of a rare event detection application, the default parameter set is used to detect micrometastasis of tumor cells in circulating blood.
The illustration below shows a digital slide displayed in the ImageScope main window, with red‐stained tumor cells in a background of blue‐stained blood cells.
2 Rare Event Detection Algorithm User’s Guide

Chapter 1 – Introduction
After the analysis is run, the mark‐up image shows the objects detected (in green boxes in this example):
The illustration below shows the analysis output for the image. Summary results are shown on the left and measurements for individual tumor cells are shown on the right. Each object can be inspected by scrolling through the list on the right, clicking each object, and viewing the object in the image window for easy verification of the analysis results.
The summary results show 30 objects detected and a total number of 12,840 pixels for those objects in the area analyzed.
Rare Event Detection Algorithm User’s Guide 3
Chapter 1 – Introduction
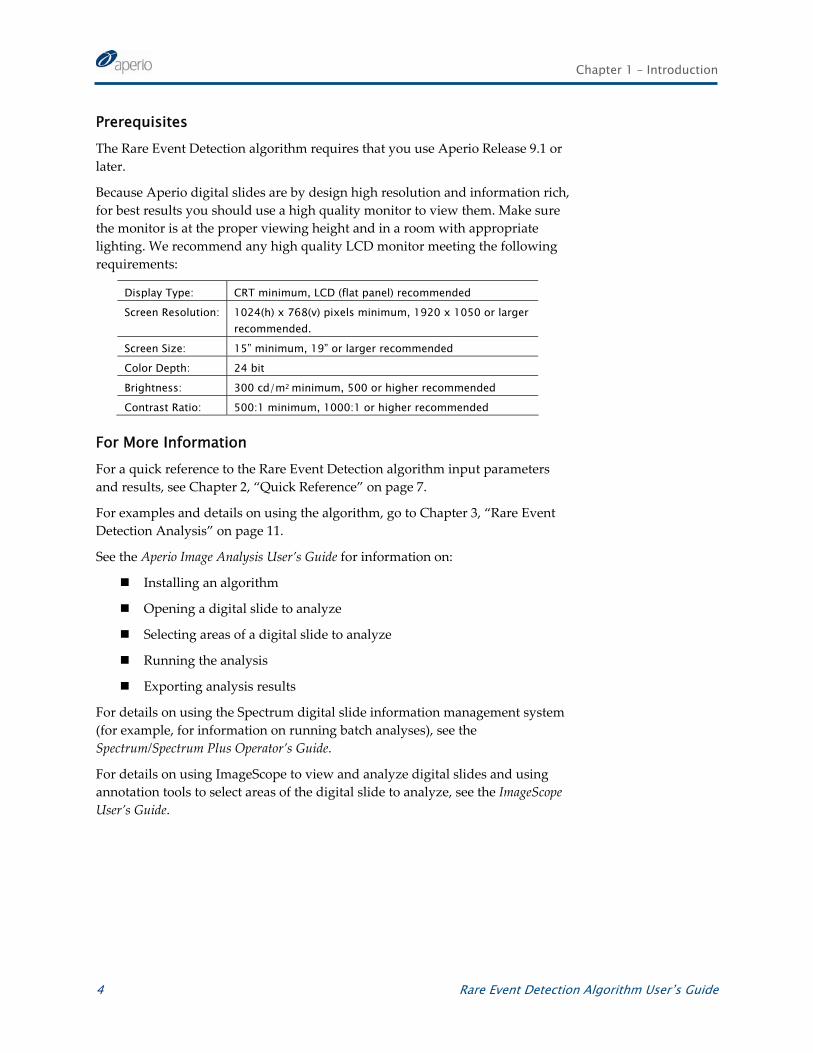
Prerequisites The Rare Event Detection algorithm requires that you use Aperio Release 9.1 or later.
Because Aperio digital slides are by design high resolution and information rich, for best results you should use a high quality monitor to view them. Make sure the monitor is at the proper viewing height and in a room with appropriate lighting. We recommend any high quality LCD monitor meeting the following requirements:
Display Type: CRT minimum, LCD (flat panel) recommended
Screen Resolution: 1024(h) x 768(v) pixels minimum, 1920 x 1050 or larger recommended.
Screen Size: 15” minimum, 19” or larger recommended
Color Depth: 24 bit
Brightness: 300 cd/m2 minimum, 500 or higher recommended
Contrast Ratio: 500:1 minimum, 1000:1 or higher recommended
For More Information For a quick reference to the Rare Event Detection algorithm input parameters and results, see Chapter 2, “Quick Reference” on page 7.
For examples and details on using the algorithm, go to Chapter 3, “Rare Event Detection Analysis” on page 11.
See the Aperio Image Analysis User’s Guide for information on:
Installing an algorithm
Opening a digital slide to analyze
Selecting areas of a digital slide to analyze
Running the analysis
Exporting analysis results
For details on using the Spectrum digital slide information management system (for example, for information on running batch analyses), see the Spectrum/Spectrum Plus Operator’s Guide.
For details on using ImageScope to view and analyze digital slides and using annotation tools to select areas of the digital slide to analyze, see the ImageScope User’s Guide.
4 Rare Event Detection Algorithm User’s Guide

Chapter 1 – Introduction
FDA Cleared Image Analysis Algorithms Several Aperio algorithms have been cleared by the FDA for clinical use when used on ScanScope models that are labeled as approved medical devices, and are intended for research use for other applications. These algorithms have their own user guides. Please see the Intended Use section of the user guides for the specific cleared applications you wish to use for details on in vitro diagnostic use.
Intended Use Algorithms are intended to be used by trained pathologists who have an understanding of the conditions they are testing for in running the algorithm analysis.
Each algorithm has input parameters that must be adjusted by an expert user who understands the goal of running the analysis and can evaluate the algorithm performance in meeting that goal.
You will adjust (tune) the parameters until the algorithm results are sufficiently accurate for the purpose for which you intend to use the algorithm. You will want to test the algorithm on a variety of images so its performance can be evaluated across the full spectrum of expected imaging conditions. To be successful, it is usually necessary to limit the field of application to a particular tissue type and a specific histological preparation. A more narrowly defined application and consistency in slide preparation generally equates to a higher probability of success in obtaining satisfactory algorithm results.
If you get algorithm analysis results that are not what you expected, please see the appendix “Troubleshooting” in the Aperio Image Analysis User’s Guide for assistance.
Rare Event Detection Algorithm User’s Guide 5

Chapter 1 – Introduction
6 Rare Event Detection Algorithm User’s Guide

2 Quick Reference
This chapter contains a quick reference to all Rare Event Detection algorithm inputs and outputs. See the following chapter for details on using the algorithm.
If you are already familiar with using the Rare Event Detection algorithm, and need just a reminder of the different algorithm input and output parameters, please refer to the sections below. For more detailed information on using the algorithm, see the following chapter.
Algorithm Input Parameters The following inputs are accepted by the Rare Event Detection algorithm:
View Width – Width of processing box.
View Height – Height of processing box.
Overlap Size – Size of the overlap region for each view. This should be greater than the maximum linear dimension of an object. The image is processed in blocks (views) and overlap is provided to ensure that objects are completely detected and counted only once.
Image Zoom – 1.0 (recommended) for processing of all pixels. Can be reduced to 0.5 for faster processing; however, the results may not be as accurate.
Markup Compression Type – You can select among “Same as processed image,” JPEG, or JPEG2000 for the markup image.
Compression Quality – For the compressed markup image, you can select a compression quality of 0 to 95. Higher quality takes longer and yields larger files.
Hue Value – This value is used to select the color of the objects of interest, from zero to 1. Some examples of color values are: 0 for Red, 0.1 for Brown, 0.33 for Green, and 0.66 for Blue. For details on determining this value based on the color you want to detect, see “Color Concepts” on page 11.
Hue Width – This value selects the range of hues, centered on the Hue Value, that will satisfy the hue detection process. By increasing this number, you specify that a larger range of hues will be accepted for determining objects. By decreasing this number, you “tighten” the range
Rare Event Detection Algorithm User’s Guide 7
Chapter 2 – Quick Reference
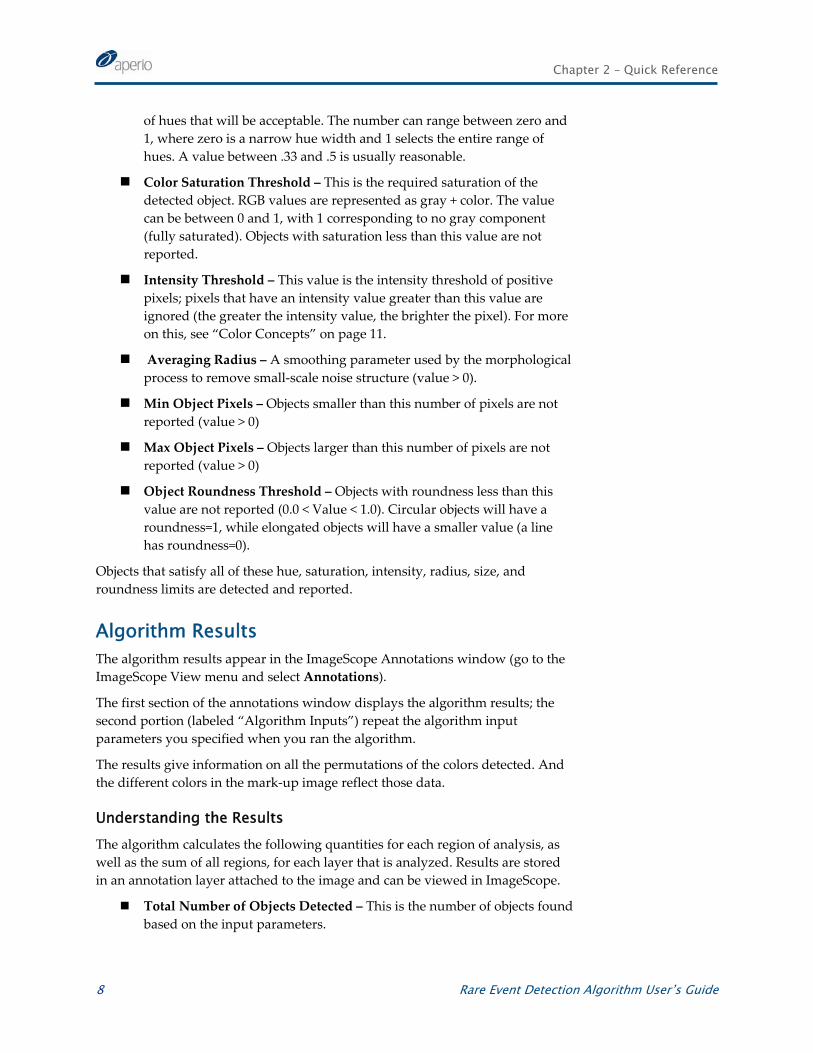
of hues that will be acceptable. The number can range between zero and 1, where zero is a narrow hue width and 1 selects the entire range of hues. A value between .33 and .5 is usually reasonable.
Color Saturation Threshold – This is the required saturation of the detected object. RGB values are represented as gray + color. The value can be between 0 and 1, with 1 corresponding to no gray component (fully saturated). Objects with saturation less than this value are not reported.
Intensity Threshold – This value is the intensity threshold of positive pixels; pixels that have an intensity value greater than this value are ignored (the greater the intensity value, the brighter the pixel). For more on this, see “Color Concepts” on page 11.
Averaging Radius – A smoothing parameter used by the morphological process to remove small‐scale noise structure (value > 0).
Min Object Pixels – Objects smaller than this number of pixels are not reported (value > 0)
Max Object Pixels – Objects larger than this number of pixels are not reported (value > 0)
Object Roundness Threshold – Objects with roundness less than this value are not reported (0.0 < Value < 1.0). Circular objects will have a roundness=1, while elongated objects will have a smaller value (a line has roundness=0).
Objects that satisfy all of these hue, saturation, intensity, radius, size, and roundness limits are detected and reported.
Algorithm Results The algorithm results appear in the ImageScope Annotations window (go to the ImageScope View menu and select Annotations).
The first section of the annotations window displays the algorithm results; the second portion (labeled “Algorithm Inputs”) repeat the algorithm input parameters you specified when you ran the algorithm.
The results give information on all the permutations of the colors detected. And the different colors in the mark‐up image reflect those data.
Understanding the Results The algorithm calculates the following quantities for each region of analysis, as well as the sum of all regions, for each layer that is analyzed. Results are stored in an annotation layer attached to the image and can be viewed in ImageScope.
Total Number of Objects Detected – This is the number of objects found based on the input parameters.
8 Rare Event Detection Algorithm User’s Guide
Chapter 2 – Quick Reference
Total Number of Object Pixels – Total area (in pixels) of the detected objects.
Additional Results – The input parameters are also reported, along with actual algorithm results. This enables you to verify at a future date what parameters were used for processing. The term Zoom Corrected can appear on some of the reported results: If Zoom less than one is used for processing, then certain parameters are adjusted in an effort to provide results that are consistent with Zoom=1 processing. For example, Averaging Radius=8 for Zoom=1 will convert to Averaging Radius=4 for Zoom=0.5.
If the results of the analysis are not what you expect or are otherwise unsatisfactory, see the appendix “Troubleshooting” in the Aperio Image Analysis User’s Guide for some tips on identifying problems.
Rare Event Detection Algorithm User’s Guide 9

Chapter 2 – Quick Reference
10 Rare Event Detection Algorithm User’s Guide

3 Rare Event Detection Analysis
Although you can use several different tools to perform an algorithm analysis, this section shows a simple analysis using ImageScope to analyze digital slide that resides in the Spectrum digital slide information system.
Color Concepts The Rare Event Detection algorithm finds objects by comparing pixels against the input parameters set for the algorithm. An important group of these parameters relate to color.
This section discusses some of the concepts behind these parameters.
You are probably familiar with the common artist color wheel. The Rare Event Detection algorithm uses a form of it called the HSI (Hue, Saturation, Intensity) wheel that quantifies the RGB (red, blue, green) color space:
In the example above, imagine every color residing on this wheel, with the color red being assigned the value zero. The actual color is called the hue. As you move around the rim of the circle, you move from one hue to another. Each hue has a numeric representation on this wheel. Green is 0.33 (as it is a third of the way
Rare Event Detection Algorithm User’s Guide 11

Chapter 3 – Rare Event Detection Analysis
around the circle from red, which is 0.00), and Blue is 0.66 (two thirds of the way around the circle). Each hue on the circle has a number assigned to it. Brown, which is almost halfway between Red and Green, has a value of 0.1.
The Hue Value parameter used by this algorithm is the number associated with the hue you want to use based on its position on the wheel.
Saturation represents the “purity” of the color, with the rim of the wheel representing complete saturation. For example, fully saturated Red is the color on the rim of the wheel, a less saturated Red (for example, Pink) resides on the red vector, but closer to the center of the wheel.
Hue Width is the wedge on the wheel that represents all hues that will satisfy the object detection based on the Hue Value. The smaller the Hue Width, the more restrictive is the definition of the hues that are acceptable. For example, if you want objects to be detected only if they are precisely Brown, then you might specify a Hue Width of zero. If slightly reddish brown to slightly greenish brown are all acceptable to identify an object, then you might specify a Hue Width of .5. You can think of this as a hue threshold value.
Intensity is a measure of brightness and is the average of the R,G,B values of a pixel.
Intensity ranges from zero (black) to 255 (bright white), so that a large intensity value means that the pixel is brighter. Intensity is the opposite of density, which is proportional to the amount o f light that is blocked by the stained tissue.
The illustration below shows intensity as it relates to the HSI color space:
Running an Analysis 1. Open a digital slide in ImageScope. If you are using the Spectrum digital
slide information system, one way to do this is to go to the main Spectrum page and select List All Digital Slides to see the list of digital slides, and then click on a digital slide thumbnail to open it in ImageScope.
12 Rare Event Detection Algorithm User’s Guide
Chapter 3 – Rare Event Detection Analysis
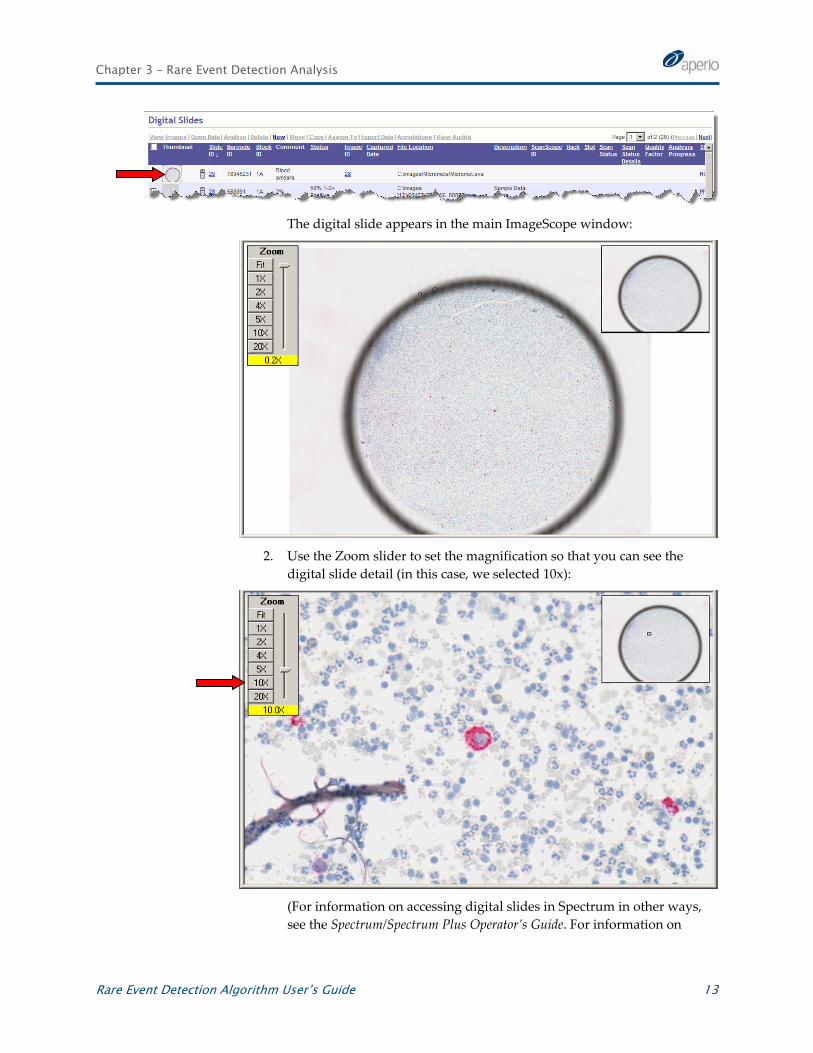
The digital slide appears in the main ImageScope window:
2. Use the Zoom slider to set the magnification so that you can see the
digital slide detail (in this case, we selected 10x):
(For information on accessing digital slides in Spectrum in other ways, see the Spectrum/Spectrum Plus Operator’s Guide. For information on
Rare Event Detection Algorithm User’s Guide 13

Chapter 3 – Rare Event Detection Analysis
opening and analyzing local digital slides that reside on your workstation or local area network, see the ImageScope User’s Guide.)
3. Go to the ImageScope View menu and select Analysis. The Server Job window appears:
If an algorithm macro does not already exist for the Rare Event Detection algorithm, you or the Spectrum administrator will need to create one—see the Aperio Image Analysis User’s Guide for details on doing so.
4. Click Test to fine‐tune the algorithm input parameters (if you know they are already correct for your application, you can just click Analyze to run the algorithm).
14 Rare Event Detection Algorithm User’s Guide

Chapter 3 – Rare Event Detection Analysis
5. After clicking Test, the Algorithm window appears:
6. Adjust the algorithm parameters in the Algorithms window as discussed
earlier in this document by clicking on a number and typing a new value or using the slider if one is provided for that parameter.
7. If you want to see a visual representation of the analysis as well as a quantitative one, select Generate Markup Image on the Algorithms window.
8. To analyze all of the image currently shown in the ImageScope window, select Current Screen under the Region of Analysis section of the Algorithms window.
Rare Event Detection Algorithm User’s Guide 15

Chapter 3 – Rare Event Detection Analysis
9. Click Run.
After the analysis is complete, because we requested a markup image, the ImageScope main window shows the results of the analysis. The detected objects in this example appear in green boxes:
16 Rare Event Detection Algorithm User’s Guide

Chapter 3 – Rare Event Detection Analysis
10. To see the quantitative results, go to the ImageScope View menu and select Annotations. The summary results are shown on the left and measurements for individual objects are shown on the right.
For example, here are the results of the analysis shown above in which 30 different objects were detected:
Each object can be inspected by scrolling through the list on the right, clicking each object, and viewing the object in the image window.
11. If you are happy with the results after fine‐tuning the parameters, you can save the input parameters as a new macro. Click Save Macro on the Algorithm parameter window to save the macro on Spectrum.
12. Type a name that will help you identify this macro in the future in the Save box and click OK:
Rare Event Detection Algorithm User’s Guide 17

Chapter 3 – Rare Event Detection Analysis
18 Rare Event Detection Algorithm User’s Guide

Index
Aperio release requirements, 4 averaging radius, 8 color concepts, 11 compression quality, 7 FDA clearances, 5 hue, 7, 11
saturation, 12 value, 12 width, 7, 12
image zoom, 7 adjustments, 9
input parameters, 7 intended use, 5 intensity, 12
threshold, 8
markup compression, 7 maximum object pixels, 8 minimum object pixels, 8 monitor requirements, 4 number of object pixels, 9 number of objects detected, 8 object roundness, 8 overlap region size, 7 prerequisites, 4 quick reference, 7 results, 8 running analysis, 12 saturation, 12
threshold, 8
Rare Event Detection Algorithm User’s Guide 19

Rare Event Detection Algorithm User’s Guide
MAN-0123, Revision A