benefits of investment in offshore wind · the macroeconomic benefits of investment in offshore...
TRANSCRIPT
1
Centre for Economics and Business Research Ltd. Unit 1, 4 Bath Street, London EC1V 9DX
t: 020 7324 2850 f: 020 7324 2855 w: www.cebr.com
The macroeconomic benefits of investment in offshore wind A scenario‐based assessment of the economic impacts on the UK of alternative realisations of offshore wind capacity
Report for Mainstream Renewable Power
June 2012

2
© Centre for Economics and Business Research Ltd, 2012
Disclaimer
Whilst every effort has been made to ensure the accuracy of the material in this document, neither Centre for Economics and Business Research Ltd nor the report’s authors will be liable for any loss or damages incurred through the use of the report.
Authorship and acknowledgements
This report has been produced by Cebr, an independent economics and business research consultancy established in 1992. The study was led by Oliver Hogan, Cebr Head of Mircoeconomics with analytical and research support from Cebr Economists Osman Ismail, Shehan Mohamed and Colin Edwards and insights from Douglas McWilliams, CEO. The views expressed herein are those of the authors only and are based upon independent research by them.
This study has been commissioned by Mainstream Renewable Power (Mainstream and has utilised a combination of data provided or pointed out to us by Mainstream and those available in the public domain through DECC, ONS, Nomis and a range of other sources.
The report does not necessarily reflect the views of Mainstream.
London, June 2012

3
© Centre for Economics and Business Research Ltd, 2012
Contents
Contents .................................................................................................................................................. 3
Foreword: The Value of Wind ................................................................................................................. 4
Executive Summary ................................................................................................................................. 6
Key Conclusions of the Report .............................................................................................................................................. 6 But even larger impacts can be expected given current economic circumstances… ........................................................... 7
1 Introduction and background ...................................................................................................... 10
1.1 Offshore wind in context .................................................................................................................................... 10 1.2 Government policy on offshore wind ................................................................................................................. 11 1.3 Purpose and structure of this report .................................................................................................................. 11
2 Methodology and assumptions .................................................................................................... 13
2.1 Development of the offshore wind capacity scenarios....................................................................................... 13 2.2 Embedding offshore wind investments within an economic impacts framework .............................................. 25 2.3 Input‐output modelling and alternative multiplier concepts ............................................................................. 31
3 UK offshore wind: size, economic contribution and impacts ...................................................... 35
3.1 Contribution of offshore wind to UK GDP .......................................................................................................... 35 3.2 Contribution of offshore wind to UK employment ............................................................................................. 39 3.3 Contribution to UK balance of trade and impacts on other industries ............................................................... 41 3.4 Effects on multipliers in electricity and fossil fuel sectors .................................................................................. 41
4 Conclusions and next steps .......................................................................................................... 44
4
© Centre for Economics and Business Research Ltd, 2012
Foreword: The Value of Wind
Eddie O’Connor Founder and Chief Executive, Mainstream Renewable Power
I have been developing and building wind and solar plant in markets around the world since 1997. In 2008 together with a group of uniquely experienced and talented colleagues, I founded Mainstream.
Mainstream is now the UK’s leading independent offshore wind company, with over 5000 MW in development. In most, but not all, of the other markets in which we operate, government or the regulator has offered a revenue or capital support scheme to incentivise renewable energy development. Critics of renewable energy have argued that the provision of such schemes “prove” that wind and solar energy are uneconomic, inefficient and costly. What I know, from insights gained over the last 15 years, and from evidence gathered from global markets, is that the benefits to electricity consumers or taxpayers delivered by wind and solar energy outweigh the costs.
At Mainstream, we refer to these benefits as the “Value of Wind”. Part of our mission as a company is to ensure that the Value of Wind can be more readily understood, and used to help shift policy discussion from the costs to the benefits of renewable energy. This report from Cebr, and its companion paper from Dr Mark Cooper, to be published later this year, continues that mission. They clearly illustrate the value of the investment in, and support for, offshore wind to the UK economy.
I want to highlight one aspect of the value of this investment – the price lowering effect of wind energy. Operators of electricity systems are familiar with “Merit Order” operation, the standard method of all utilities to satisfy consumer demand by utilising plant with the lowest marginal cost of generation. Wind and solar plant – with zero fuel cost – are zero marginal cost plant and sit at the top of the merit order. The most efficient thermal plant is next to be brought on line, and as customer demand increases towards peak the least efficient, and most expensive fossil plant gets used. The “Merit Order effect” is the term used to describe the displacement of more expensive marginal cost thermal plant by wind or solar which has zero marginal cost.1
In February 2011, the Irish grid operator Eirgrid and the Sustainable Energy Authority of Ireland published a joint study demonstrating the price lowering effects of wind.2 Ireland has roughly twice the installed amount of wind plant on its electricity system as the UK, despite having a peak demand of around one tenth of the UK’s. Like the UK, Ireland relies largely on imported gas for additional generation.
Eirgrid showed that the generation of electricity by wind plant on the Irish system in 2011 lowered total wholesale costs by €74m. Not only was this more than enough to offset the cost of the support scheme for wind (€50m) but it was also sufficient to offset the additional constraint costs associated with increased wind on the system, delivering an overall net benefit to the Irish consumer. In a direct rebuttal of critics of wind energy, the study concluded that wind was not contributing to higher wholesale electricity prices in Ireland.
The British electricity market is opaque. It is very difficult to observe the Merit Order effect when the utilities, which dominate the market, mainly supply to themselves, and savings due to increased
1 Krohn, S., P. Morthorst and S. Awerbuch (2009), “The Economics of Wind Energy”, European Wind Energy Association. 2 Clifford, E. (EirGrid) and M. Clancy (SEAI) (2011), “Impact of Wind Generation on Wholesale Electricity Costs in 2011”, Sustainable Energy Authority of Ireland and Eirgrid. See also “Cleantech Ireland: An assessment of the sector and the impact on the national economy”, Ernst & Young and Oxford Economics, 2012.

5
© Centre for Economics and Business Research Ltd, 2012
renewables penetration are internalised. However, the current market reforms proposed by the UK Government and by Ofgem should help to increase transparency, thus enabling greater clarity of the positive price impact of renewables, to more effectively counter the monotonous and wrong‐headed criticism of opponents of renewables, that they increase the cost of electricity for consumers.
In the absence of this clarity, we have commissioned Cebr and Mark Cooper to look at one emerging part of the UK’s electricity sector to illustrate its present – and future – contribution to the UK economy. Offshore wind has the potential to transform electricity generation by delivering – in a decarbonised power sector ‐ a very large amount of carbon and fuel‐free power to consumers, and by enabling the UK to capture significant additional value from the wider industrial benefits that the sector will deliver. In 2010 the Offshore Valuation Group published the first ever study of the UK’s offshore renewable energy resource. It showed that by 2050 the UK could be a net exporter of energy, generating the electricity equivalent of 1bn barrels of oil a year from its offshore resources.
We have set out to build on the work of the Offshore Valuation Initiative in this project. The “Value of Offshore Wind” to the UK is truly significant. Cebr shows that the net economic benefit to UK plc from investment in offshore wind, both in terms of contribution to GDP, and to the country’s balance of trade is considerable. Mark Cooper will show that, in addition to these effects, the risk reduction to the UK electricity system provided by offshore wind will deliver further savings and wider economic and policy benefits.
With a proper interconnected electricity network linking the UK to neighbouring markets, we can export renewable energy into a single European electricity market, further adding to the economic benefits. In late May, it was reported that Germany’s power‐transmission companies have announced plans to build four electricity “Autobahns” to link wind farms off the north coast with manufacturing centres in the south.3 Building a North Sea grid to connect to these “Autobahns” and link UK and German offshore wind farms with load centres here and in Germany would give this country significant trading opportunities, deliver much needed infrastructure projects, and further transform the low carbon economies of both countries.
We have embarked on a once off transition from fossil fuels towards a low carbon economy. All forms of renewable energy, from solar energy to tidal energy, will contribute to delivering this transition in the UK. Offshore wind provides this country with a clear global comparative advantage, and will assist in providing affordable electricity to consumers and enhancing the country’s energy security.
As Cebr show, and as Mark Cooper will show when his work is published in September, wind energy, and particularly offshore wind, offers a clear low carbon growth path for the UK economy, and a clear low carbon growth strategy for the UK Government. Their work is a very valuable addition to the debate on this country’s energy policy and I welcome its publication.
June 2012
This is an abbreviated version of the Foreword. The full version can be found on the Mainstream Website. (www.mainstreamrp.com)
3 “Germany plans to build wind power grid” Financial Times 30 May 2012
6
© Centre for Economics and Business Research Ltd, 2012
Executive Summary
In 2010 the Offshore Valuation Group set out to measure the value of the UK’s offshore renewable energy resource.4 The Group concluded that, by harnessing less than a third of that resource, the UK could, by 2050:
• Generate the electricity equivalent of 1bn barrels of oil a year;
• Reduce its CO2 emissions by 1bn tonnes; and
• Create over 145,000 new jobs.
This report by the Centre for Economics and Business Research (Cebr) builds on that work by exploring the impact of planned investment in offshore wind electricity generation in the UK. It concludes5 that that investment can be expected:
• By 2015, to increase UK GDP by 0.2%, and create over 45,000 full time jobs, delivering employment and economic growth at a time of economic fragility.
• By 2020, to double that GDP contribution to 0.4%, and the number of people employed to over 97,000.
• By 2030, in addition to adding 0.6% GDP growth, and creating 173,000 jobs, the sector will deliver an increase in net exports of £18.8 billion, sufficient to fill nearly 75% of the UK’s current balance of trade deficit. These benefits will accrue from pursuing current moderate build out rates of offshore wind. A more aggressive, but achievable, approach could see an annual 1% uplift to GDP, the creation of over 200,000 jobs and an increase in net exports of £22.5 billion – almost enough to entirely plug the country’s balance of trade deficit.
At the request of Mainstream Renewable Power (Mainstream), Cebr has investigated the economic impact of investment in offshore wind capacity. The fruit of our lengthy investigation is contained within the pages of this report, and is summarised in this preamble. The assessment is scenario‐based and produces different estimates of the expected impacts for different realisations of offshore wind capacity.
Key Conclusions of the Report
Cebr’s investigations of the economic value of investment in offshore wind to UK plc points to three broad conclusions:
1. Contribution to GDP: Under the current balanced approach to meeting renewable energy and CO2 emissions targets, investment in offshore wind capacity can be expected to contribute 0.2% of GDP by 2020, or 0.3% under the more aggressive ‘Accelerated Growth’ scenario. However, once (domestic) multiplier impacts are taken into account, these can be expected to rise to 0.3% under the central scenario and 0.6% of GDP under the more aggressive scenario. With the UK currently in the midst of a double‐dip recession, these levels of contribution would be sufficient to turn UK growth positive.
4 The Offshore Valuation, Offshore Valuation Group, 2010. 5 Based on Cebr’s analysis of foreign trade multipliers for offshore wind investment.
7
© Centre for Economics and Business Research Ltd, 2012
2. Employment Creation: Investment in offshore wind capacity under the central scenario can be expected to generate over 40,000 full time equivalent jobs by 2020 and over 61,000 jobs by 2030. Once (domestic) multiplier impacts are taken into account, the total number of jobs generated can, by 2020, be expected to rise to 185,000 under the aggressive scenario and to 97,000 under the central scenario.
3. Balance of Trade Benefits: Under our Accelerated Growth scenario, by 2030, the estimated increase in net exports is £22.5 billion, sufficient to almost entirely plug the UK’s current balance of trade deficit (recorded at £25.6 billion in 2009, the year corresponding with our forecasts). These positive trade impacts are driven by our assumptions about reduced fossil fuel imports and offshore wind electricity exports as a result of greater offshore wind capacity. They are also driven by our assumptions about the development of the supply chain for offshore wind investments, the increase in UK content of UK offshore wind investments (relative to imports) and the share of continental European offshore wind investment that can be expected to be captured by the UK industry as these supply chain developments occur.
These three conclusions are the final products of a programme of advanced modelling of economic impacts by Cebr as well as the development of the detailed characteristics of different scenarios involving alternative realisations of offshore wind capacity on the UK system.
But even larger impacts can be expected given current economic circumstances…
The UK – and much of the Western World ‐ is going through a major competitive challenge as two‐thirds of the world industrialises rapidly, while still working hours and paying themselves wages based on their history as poor countries. This implies very low unit labour costs, particularly in light of their productivity potential. Meanwhile, the growing demands from these newly industrialising economies are placing a strain on the balance between supply and demand for primary products, raising and sustaining higher commodity prices and, thus, raising the cost base – in production and consumption ‐ of already struggling Western economies.
The newly industrialising nations have, therefore, turned the terms of trade dramatically against the UK and the other countries being challenged. While the evidence suggests that this is some sort of disequilibrium, it could easily persist for at least a generation (20‐30 years) and possibly twice that. Singapore, for instance, has had a higher GDP per capita than the UK on and off since the late 1990s (pre‐Asian crisis) yet the latest 2010 data from the U.S. Bureau of Labour Statistics still shows that hourly compensation in manufacturing in Singapore is still only 55% of the UK level and progress in narrowing the gap is surprisingly slow – the percentage was 52.7% in 1997.
Countries facing this competitive challenge could, in theory, devalue themselves into eventual prosperity (using their currencies) but there is an inflation constraint that means that this is not possible in practice. Any devaluation at sufficient speed to enable the declining economy to achieve what would previously have been thought of as a state of full employment (or a non‐accelerating inflation rate of unemployment) would, particularly when the terms of trade are being turned against the declining economy, lead to excess inflation and a risk of inflation becoming embedded.
Therefore, for the UK, the Bank of England’s inflation target effectively acts as a lower bound on the value of the Pound, limiting any scope for currency devaluation. The (previously successful) UK economy is forced to either cope with long term underutilisation of resources or adjust in a way that

8
© Centre for Economics and Business Research Ltd, 2012
results in lower labour costs, whilst also improving the supply curve of labour.6 Without action of this kind, medium to long term underutilisation of resources is highly likely for an uncompetitive economy. The amount of capital stock in the system might decay to the point where it is no longer in surplus and human skills and abilities are bound to degenerate as a result of persistent long term unemployment.
The implication is that economic growth in Western economies is likely to be depressed as they adjust to the competitive challenge placed on them by newly emerging economies like China. The impact of this on growth is likely to be most keenly felt in countries, like many in Europe, with rigid labour markets and high labour costs, particularly where these are combined with high taxes.
The current economic circumstances and the challenges facing the UK and most of Europe highlight the importance of taking actions that will turn the terms of trade back in their favour in order to improve their trade balance (net exports). Such actions are acting directly on the factor that is constraining growth and consequently can be expected to have particularly important multiplier effects.
This provided the motivation for undertaking a foreign trade multiplier (FTM) analysis of the impact of increasing levels of offshore wind investments and exports. It is Cebr’s contention that, given the aforementioned positive impacts on the UK’s balance of trade, these significant multiplier impacts can be expected to derive from investment in offshore wind.
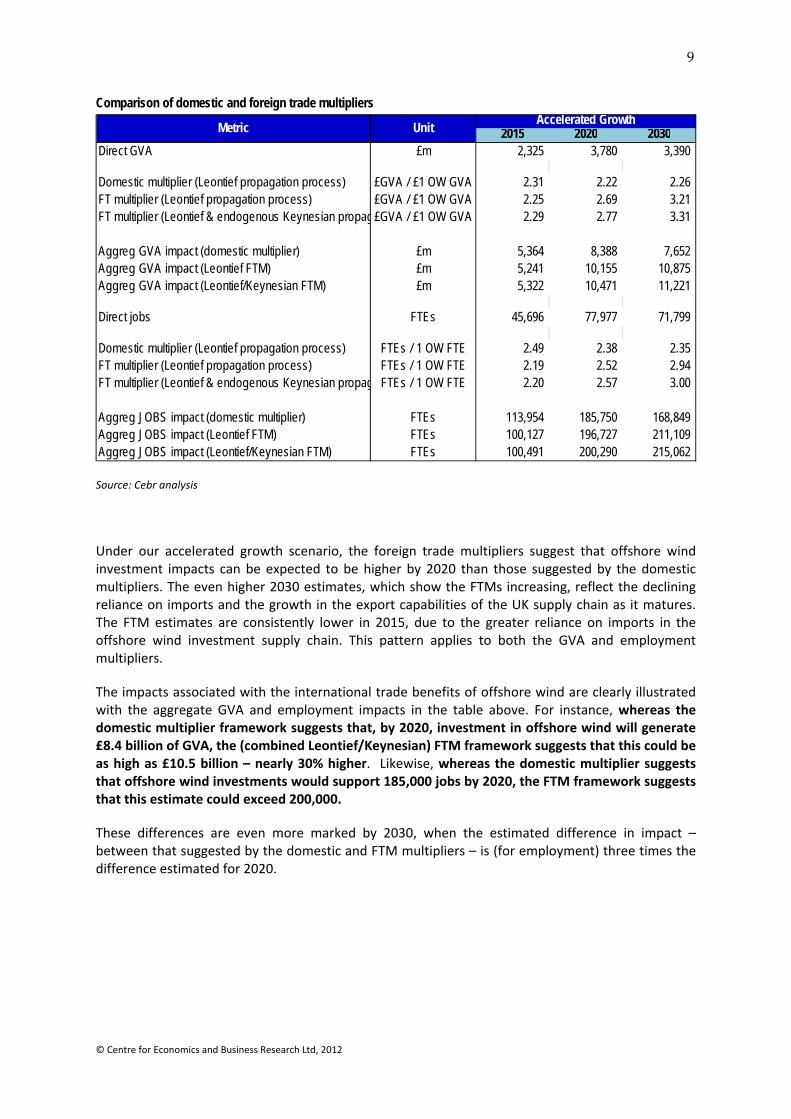
The table below compares the domestic multipliers – on which the key conclusions above are based – with two estimates of the foreign trade multiplier for offshore wind, along with the corresponding absolute impacts suggested by these multipliers, in GVA and employment terms. We focus on the aggressive Accelerated Growth scenario by way of illustration.
6 That is, providing incentives to boost the incentive to work. In economic terms, reducing welfare payments has the double effect of improving the supply curve of labour and reducing the cost of welfare which enables taxes to be cut to less uncompetitive levels. But many would have scruples about dealing with competitive problems by making the worst off even worse off.
9
© Centre for Economics and Business Research Ltd, 2012
Comparison of domestic and foreign trade multipliers
Source: Cebr analysis
Under our accelerated growth scenario, the foreign trade multipliers suggest that offshore wind investment impacts can be expected to be higher by 2020 than those suggested by the domestic multipliers. The even higher 2030 estimates, which show the FTMs increasing, reflect the declining reliance on imports and the growth in the export capabilities of the UK supply chain as it matures. The FTM estimates are consistently lower in 2015, due to the greater reliance on imports in the offshore wind investment supply chain. This pattern applies to both the GVA and employment multipliers.
The impacts associated with the international trade benefits of offshore wind are clearly illustrated with the aggregate GVA and employment impacts in the table above. For instance, whereas the domestic multiplier framework suggests that, by 2020, investment in offshore wind will generate £8.4 billion of GVA, the (combined Leontief/Keynesian) FTM framework suggests that this could be as high as £10.5 billion – nearly 30% higher. Likewise, whereas the domestic multiplier suggests that offshore wind investments would support 185,000 jobs by 2020, the FTM framework suggests that this estimate could exceed 200,000.
These differences are even more marked by 2030, when the estimated difference in impact – between that suggested by the domestic and FTM multipliers – is (for employment) three times the difference estimated for 2020.
2015 2020 2030Direct GVA £m 2,325 3,780 3,390
Domestic multiplier (Leontief propagation process) £GVA / £1 OW GVA 2.31 2.22 2.26 FT multiplier (Leontief propagation process) £GVA / £1 OW GVA 2.25 2.69 3.21 FT multiplier (Leontief & endogenous Keynesian propag£GVA / £1 OW GVA 2.29 2.77 3.31
Aggreg GVA impact (domestic multiplier) £m 5,364 8,388 7,652 Aggreg GVA impact (Leontief FTM) £m 5,241 10,155 10,875 Aggreg GVA impact (Leontief/Keynesian FTM) £m 5,322 10,471 11,221
Direct jobs FTEs 45,696 77,977 71,799
Domestic multiplier (Leontief propagation process) FTEs / 1 OW FTE 2.49 2.38 2.35 FT multiplier (Leontief propagation process) FTEs / 1 OW FTE 2.19 2.52 2.94 FT multiplier (Leontief & endogenous Keynesian propag FTEs / 1 OW FTE 2.20 2.57 3.00
Aggreg JOBS impact (domestic multiplier) FTEs 113,954 185,750 168,849 Aggreg JOBS impact (Leontief FTM) FTEs 100,127 196,727 211,109 Aggreg JOBS impact (Leontief/Keynesian FTM) FTEs 100,491 200,290 215,062
Metric Unit Accelerated Growth
10
© Centre for Economics and Business Research Ltd, 2012
1 Introduction and background
This is a report by Centre for Economics and Business Research (Cebr) on the macroeconomic benefits of investment in offshore wind electricity generating capacity. The assessment is scenario‐based, producing estimates of the impacts on the UK economy of alternative realisations of offshore wind capacity. The analysis and this report were commissioned by Mainstream Renewable Power (Mainstream).
1.1 Offshore wind in context
Energy policy in the UK is currently shaped by a suite of policy commitments and Government targets relating to climate change, energy security and energy affordability.
The Climate Change Act (2008) provides the framework for the UK to respond to the challenges posed by climate change. That framework includes a commitment to having reduced, by 80%, the UK’s annual net greenhouse gas emissions in 2050 relative to 2009 levels. To this end, the Act allows the Government to set five‐year carbon budgets, which establish short‐term, legally‐binding emissions limits for the UK economy. This is designed to smooth the trajectory along the path to the long‐term 2050 objective by meeting clearly delineated incremental targets.
The Carbon Plan (2011) brings together Government climate change strategies, establishing a plan of action for achieving the emissions reductions legislated by the four published carbon budgets. It notes that the power sector is currently the single largest source of greenhouse gas emissions in the UK (accounting for 27% of emissions in 2010), and suggests that in order to ensure compliance with 2050 targets, deep cuts in the power sector’s emissions intensity will have to take place during the 2020s. The Government’s modelling suggests that, given the trajectory of future UK energy demand, as well as fossil fuel plant closures scheduled over that period, between 60 to 80 GW of new electricity capacity will need to be built by 2030. In order to ensure compliance with 2050 emissions targets, 40‐70 GW of this capacity will need to be provided by low carbon technologies.7
Offshore wind is expected to play an important role in meeting these renewable capacity needs. The 2010 Offshore Valuation Group report provides an assessment of the magnitude of the UK’s practical offshore energy resource, concluding that offshore renewables are potentially as valuable as the offshore fossil fuel resource which has been utilised over the past few decades. While the North Sea hydrocarbon stock has been largely depleted, given the UK’s long coastline, shallow waters and high winds, investment in offshore renewables could open up access to a permanent energy flow.8 It examines the resource in the context of the UK’s energy policy, with reference to the decarbonisation and renewables targets, and emphasises that offshore renewables are a vital piece of the puzzle for reaching the 2050 goals.
These Government targets are framed by EU‐wide obligations as set out in the Renewables Directive (2009). This legislation sets targets for each EU Member State, specifying what proportion of energy consumption in 2020 must be sourced from renewable technologies. In the case of the UK, this represents a legally‐binding commitment to produce 15% of its energy from renewable sources.
The UK Renewable Energy Roadmap (2011) concludes that this 15% target is achievable for the UK, whilst spelling out the targeted policy actions required to ensure that the renewables sector has the
7 The Carbon Plan: Delivering our low-carbon future (2011), Department for Energy and Climate Change, p.72. 8 The Offshore Valuation (2010), The Offshore Valuation Group, p. 10.
11
© Centre for Economics and Business Research Ltd, 2012
capacity to deliver the required power generation capacity out to 2020 and beyond. In the case of offshore wind generation, the Roadmap acknowledges the importance of the technology to delivering the energy sector decarbonisation necessary under the Carbon Budgets.
1.2 Government policy on offshore wind
In recognition of the strategic importance of harnessing the offshore wind resource, the Department for Energy and Climate Change (DECC) has established a Taskforce with offshore wind industry stakeholders. The purpose of this Taskforce is the identification of potential cost savings for the delivery of offshore wind investments, with the specific goal of delineating a pathway to the achievement of a levelised cost for offshore wind of £100/MWh of energy generated. The Taskforce is due to report to DECC by June 2012. This cost level would make the technology competitive with other low‐carbon technologies during the period when low‐emission generation needs to be added to the UK at considerable pace (and, therefore, scale) in order to meet the Government’s emissions targets.
The importance of providing the right incentives for investment in a decarbonised electricity supply was also recognised by the Government through its initiation of the 2010‐12 Electricity Market Reform process. A major focus in the legislative consultation process was the need for a market structure that would provide these incentives. Much of the UK’s nuclear and coal plant is due to come offline within the next decade, and replacing this capacity with low‐carbon and renewable sources is a pressing concern to prevent the UK becoming ‘locked‐in’ to a new round of emissions‐intensive generation.
Energy security is also an important motivation for the market reform proposals. Maintaining or extending the UK’s hydrocarbon dependency would involve the country’s energy supply being ever more exposed to volatile fossil fuel price fluctuations. Increasing the penetration of renewables on the system would lessen this exposure, while also maintaining a viable trajectory towards meeting future emissions target.
1.3 Purpose and structure of this report
The Carbon Trust provides a third motivation for producing the right incentives for investment in low‐carbon resources, namely the economic benefits of such investments. Their study of the commercial potential of different renewable technologies concluded that “…the majority of the job creation potential is in offshore wind power. Offshore wind power combines both a large global and domestic market with the potential for the UK to develop a strong base, building on existing skills and attracting key manufacturers. The UK could be a global market leader.”9
In a study examining the UK’s prospects for exploiting offshore wind specifically, the Carbon Trust concluded that meeting EU emissions targets could require 29 GW of capacity by 2020, a scale of deployment which is deemed feasible, but which requires urgent policy actions on the incentives to ensure it is delivered through investment. The report presented the Carbon Trust’s estimate that reaching this scale would deliver between 80,000 and 100,000 jobs, and £12.5 billion in annual revenues by 2020.10
9 “Focus for success: A new approach to commercialising low carbon technologies” (2009), The Carbon Trust, p. 6 10 Offshore wind power: big challenge, big opportunity (2008), The Carbon Trust, p. 72

12
© Centre for Economics and Business Research Ltd, 2012
The purpose of this report is to build on this existing knowledge and estimates of the economic benefits that can be expected to flow from investments in offshore wind capacity. Cebr’s study focuses on the impacts of the investment programme itself, producing jobs estimates analogous to the aforementioned Carbon Trust’s. While we do not consider the post‐delivery revenue streams from the investment’s utilisation, we do incorporate wind farm maintenance and operating expenditures as a final demand stimulus.11 The following subsection provides an overview of our study and methodology.
This report is structured as follows:
1. Section 2 provides an outline of the methods and assumptions used in our assessment of the economic impacts of investment in offshore wind in the UK.
2. Section 3 presents the results of our analysis.
3. Section 4 concludes the report.
11 We note that, in an economic impact assessment of offshore wind electricity generation, for instance, these operating and maintenance expenditures would be incorporated as part of the offshore wind electricity supply chain. In this study, our focus is on the subsets of the range of industries that benefit from the demand stimulus provided by investments in offshore wind farms and in their maintenance and operation. Operating and maintenance expenditures are thus, for the purposes of this study, treated as annual wind farm investments, which can also be expected to provide a growing source of economic value and jobs.
13
© Centre for Economics and Business Research Ltd, 2012
2 Methodology and assumptions
This section of the report sets out the methods and assumptions used to determine an appropriate structure for the UK offshore wind investment ‘industry’, the topic of section 2.1. We proceed in section 2.2 to describe the manner in which we embedded this industry within the economic framework underlying Cebr’s macroeconomic impact models. Section 2.3 outlines the methodologies on which these impact models are based.
2.1 Development of the offshore wind capacity scenarios
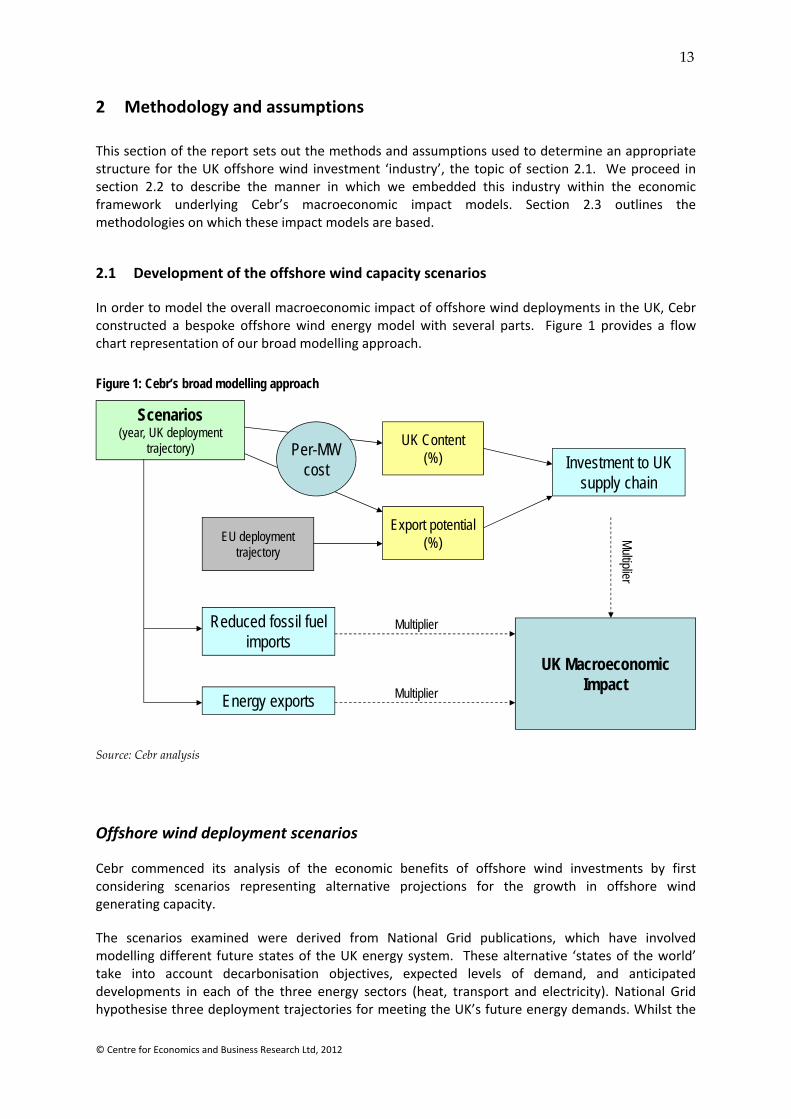
In order to model the overall macroeconomic impact of offshore wind deployments in the UK, Cebr constructed a bespoke offshore wind energy model with several parts. Figure 1 provides a flow chart representation of our broad modelling approach.
Figure 1: Cebr’s broad modelling approach
Source: Cebr analysis
Offshore wind deployment scenarios
Cebr commenced its analysis of the economic benefits of offshore wind investments by first considering scenarios representing alternative projections for the growth in offshore wind generating capacity.
The scenarios examined were derived from National Grid publications, which have involved modelling different future states of the UK energy system. These alternative ‘states of the world’ take into account decarbonisation objectives, expected levels of demand, and anticipated developments in each of the three energy sectors (heat, transport and electricity). National Grid hypothesise three deployment trajectories for meeting the UK’s future energy demands. Whilst the
UK Macroeconomic Impact
Investment to UK supply chain
Reduced fossil fuel imports
Energy exports
Scenarios(year, UK deployment
trajectory) UK Content(%)
Export potential (%)EU deployment
trajectory
Per-MWcost
Multiplier
Multiplier
Multiplier
14
© Centre for Economics and Business Research Ltd, 2012
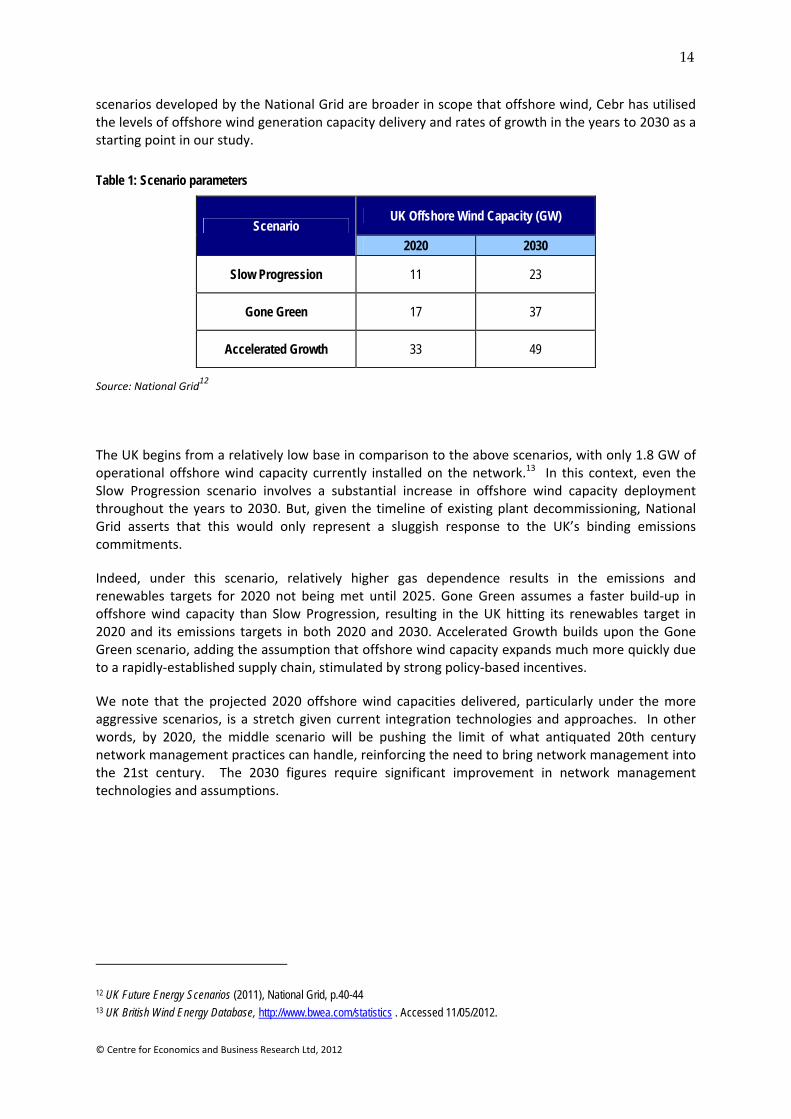
scenarios developed by the National Grid are broader in scope that offshore wind, Cebr has utilised the levels of offshore wind generation capacity delivery and rates of growth in the years to 2030 as a starting point in our study.
Table 1: Scenario parameters
Scenario UK Offshore Wind Capacity (GW)
2020 2030
Slow Progression 11 23
Gone Green 17 37
Accelerated Growth 33 49
Source: National Grid12
The UK begins from a relatively low base in comparison to the above scenarios, with only 1.8 GW of operational offshore wind capacity currently installed on the network.13 In this context, even the Slow Progression scenario involves a substantial increase in offshore wind capacity deployment throughout the years to 2030. But, given the timeline of existing plant decommissioning, National Grid asserts that this would only represent a sluggish response to the UK’s binding emissions commitments.
Indeed, under this scenario, relatively higher gas dependence results in the emissions and renewables targets for 2020 not being met until 2025. Gone Green assumes a faster build‐up in offshore wind capacity than Slow Progression, resulting in the UK hitting its renewables target in 2020 and its emissions targets in both 2020 and 2030. Accelerated Growth builds upon the Gone Green scenario, adding the assumption that offshore wind capacity expands much more quickly due to a rapidly‐established supply chain, stimulated by strong policy‐based incentives.
We note that the projected 2020 offshore wind capacities delivered, particularly under the more aggressive scenarios, is a stretch given current integration technologies and approaches. In other words, by 2020, the middle scenario will be pushing the limit of what antiquated 20th century network management practices can handle, reinforcing the need to bring network management into the 21st century. The 2030 figures require significant improvement in network management technologies and assumptions.
12 UK Future Energy Scenarios (2011), National Grid, p.40-44 13 UK British Wind Energy Database, http://www.bwea.com/statistics . Accessed 11/05/2012.
15
© Centre for Economics and Business Research Ltd, 2012
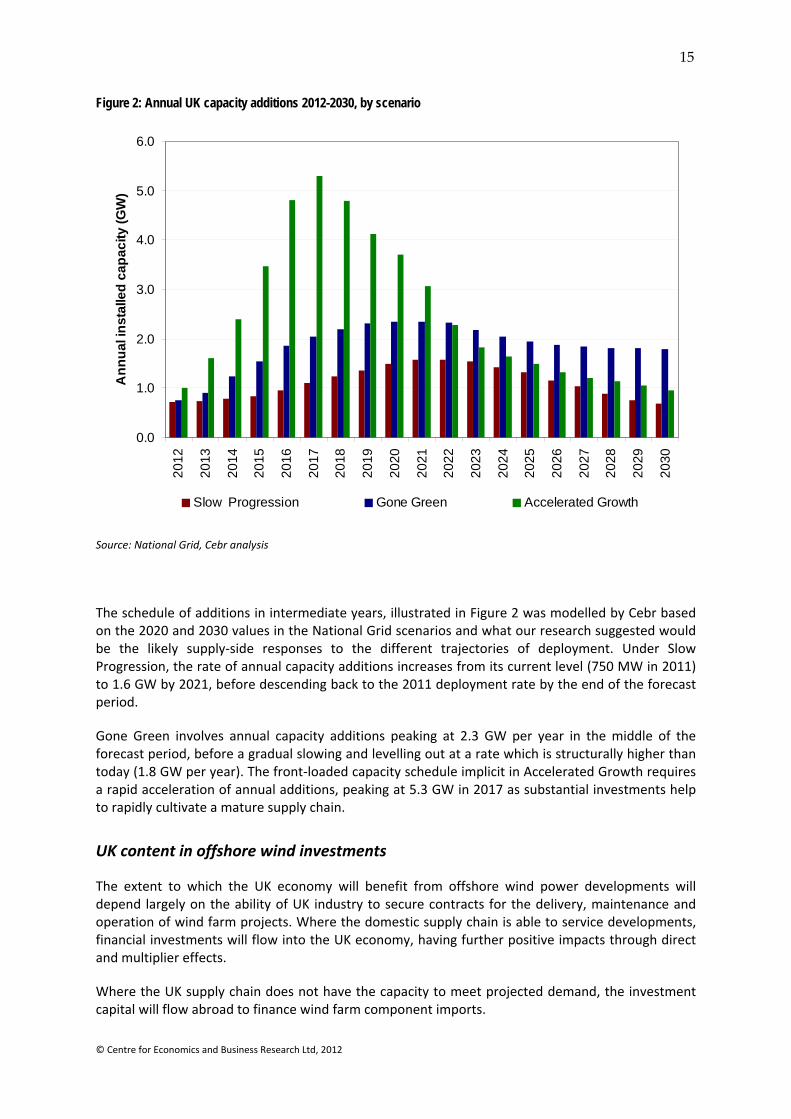
Figure 2: Annual UK capacity additions 2012-2030, by scenario
Source: National Grid, Cebr analysis
The schedule of additions in intermediate years, illustrated in Figure 2 was modelled by Cebr based on the 2020 and 2030 values in the National Grid scenarios and what our research suggested would be the likely supply‐side responses to the different trajectories of deployment. Under Slow Progression, the rate of annual capacity additions increases from its current level (750 MW in 2011) to 1.6 GW by 2021, before descending back to the 2011 deployment rate by the end of the forecast period.
Gone Green involves annual capacity additions peaking at 2.3 GW per year in the middle of the forecast period, before a gradual slowing and levelling out at a rate which is structurally higher than today (1.8 GW per year). The front‐loaded capacity schedule implicit in Accelerated Growth requires a rapid acceleration of annual additions, peaking at 5.3 GW in 2017 as substantial investments help to rapidly cultivate a mature supply chain.
UK content in offshore wind investments
The extent to which the UK economy will benefit from offshore wind power developments will depend largely on the ability of UK industry to secure contracts for the delivery, maintenance and operation of wind farm projects. Where the domestic supply chain is able to service developments, financial investments will flow into the UK economy, having further positive impacts through direct and multiplier effects.
Where the UK supply chain does not have the capacity to meet projected demand, the investment capital will flow abroad to finance wind farm component imports.
0.0
1.0
2.0
3.0
4.0
5.0
6.0
2012
2013
2014
2015
2016
2017
2018
2019
2020
2021
2022
2023
2024
2025
2026
2027
2028
2029
2030
Ann
ual i
nsta
lled
capa
city
(GW
)
Slow Progression Gone Green Accelerated Growth
16
© Centre for Economics and Business Research Ltd, 2012
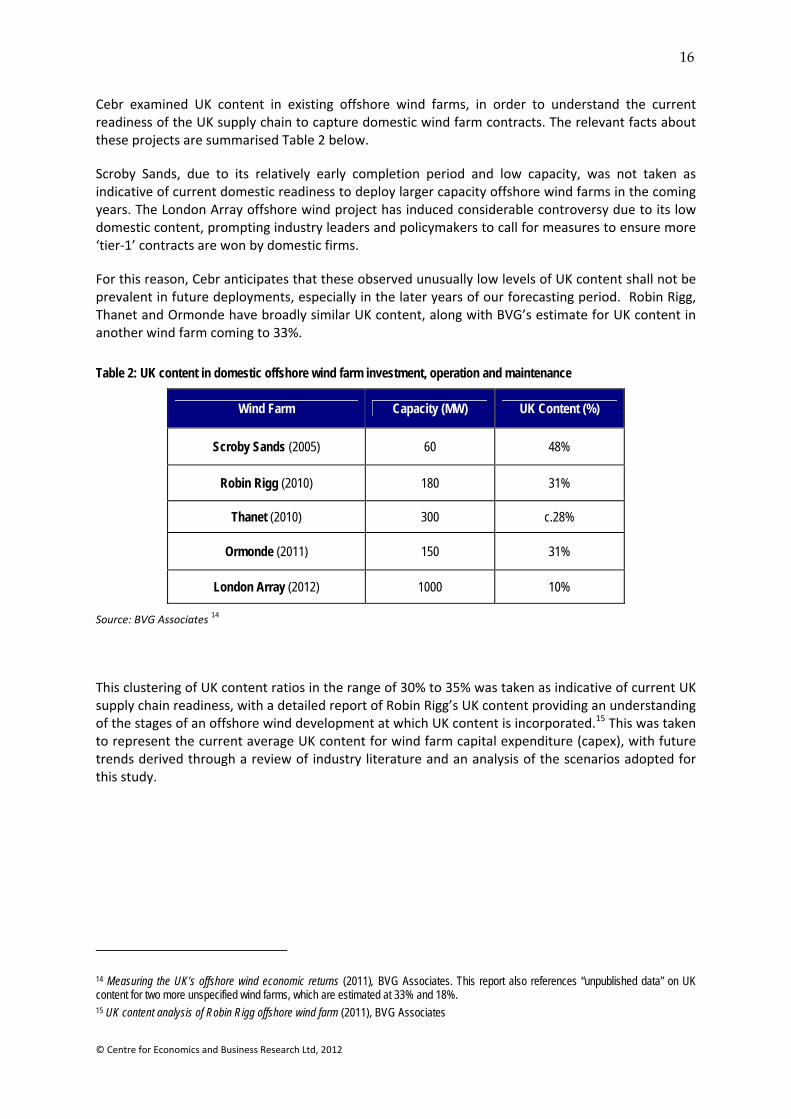
Cebr examined UK content in existing offshore wind farms, in order to understand the current readiness of the UK supply chain to capture domestic wind farm contracts. The relevant facts about these projects are summarised Table 2 below.
Scroby Sands, due to its relatively early completion period and low capacity, was not taken as indicative of current domestic readiness to deploy larger capacity offshore wind farms in the coming years. The London Array offshore wind project has induced considerable controversy due to its low domestic content, prompting industry leaders and policymakers to call for measures to ensure more ‘tier‐1’ contracts are won by domestic firms.
For this reason, Cebr anticipates that these observed unusually low levels of UK content shall not be prevalent in future deployments, especially in the later years of our forecasting period. Robin Rigg, Thanet and Ormonde have broadly similar UK content, along with BVG’s estimate for UK content in another wind farm coming to 33%.
Table 2: UK content in domestic offshore wind farm investment, operation and maintenance
Wind Farm Capacity (MW) UK Content (%)
Scroby Sands (2005) 60 48%
Robin Rigg (2010) 180 31%
Thanet (2010) 300 c.28%
Ormonde (2011) 150 31%
London Array (2012) 1000 10%
Source: BVG Associates 14
This clustering of UK content ratios in the range of 30% to 35% was taken as indicative of current UK supply chain readiness, with a detailed report of Robin Rigg’s UK content providing an understanding of the stages of an offshore wind development at which UK content is incorporated.15 This was taken to represent the current average UK content for wind farm capital expenditure (capex), with future trends derived through a review of industry literature and an analysis of the scenarios adopted for this study.
14 Measuring the UK’s offshore wind economic returns (2011), BVG Associates. This report also references “unpublished data” on UK content for two more unspecified wind farms, which are estimated at 33% and 18%. 15 UK content analysis of Robin Rigg offshore wind farm (2011), BVG Associates
17
© Centre for Economics and Business Research Ltd, 2012
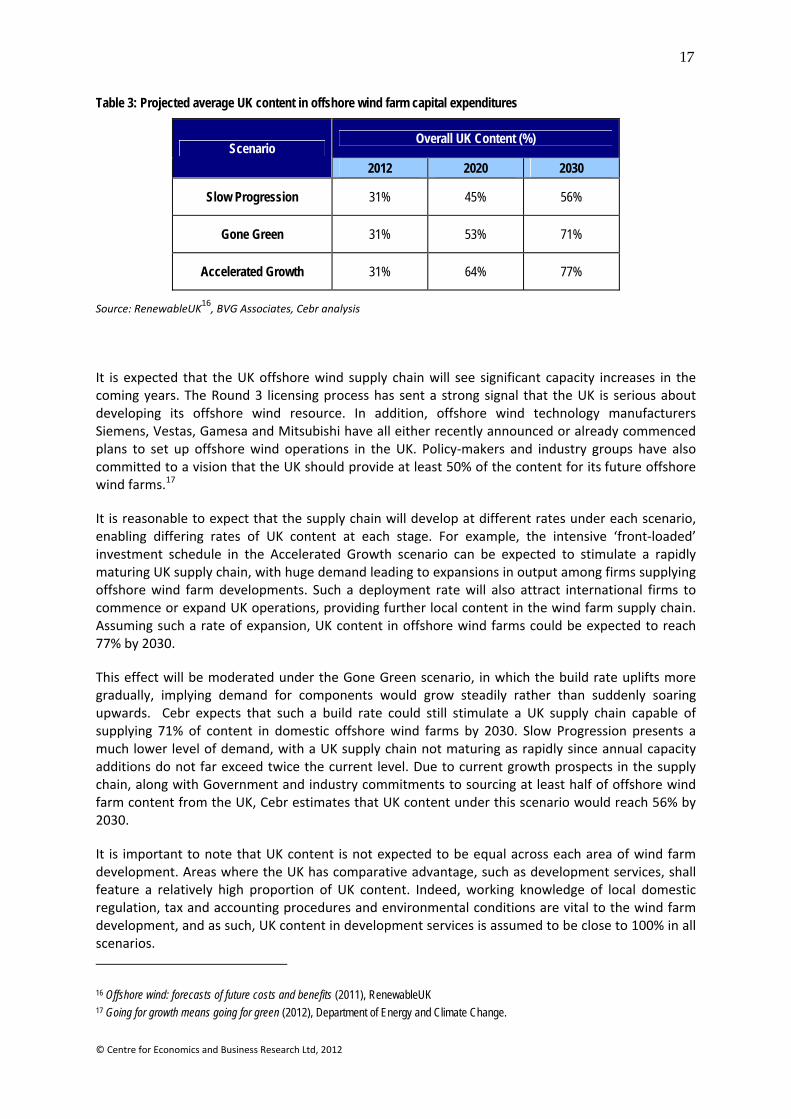
Table 3: Projected average UK content in offshore wind farm capital expenditures
Scenario Overall UK Content (%)
2012 2020 2030
Slow Progression 31% 45% 56%
Gone Green 31% 53% 71%
Accelerated Growth 31% 64% 77%
Source: RenewableUK16, BVG Associates, Cebr analysis
It is expected that the UK offshore wind supply chain will see significant capacity increases in the coming years. The Round 3 licensing process has sent a strong signal that the UK is serious about developing its offshore wind resource. In addition, offshore wind technology manufacturers Siemens, Vestas, Gamesa and Mitsubishi have all either recently announced or already commenced plans to set up offshore wind operations in the UK. Policy‐makers and industry groups have also committed to a vision that the UK should provide at least 50% of the content for its future offshore wind farms.17
It is reasonable to expect that the supply chain will develop at different rates under each scenario, enabling differing rates of UK content at each stage. For example, the intensive ‘front‐loaded’ investment schedule in the Accelerated Growth scenario can be expected to stimulate a rapidly maturing UK supply chain, with huge demand leading to expansions in output among firms supplying offshore wind farm developments. Such a deployment rate will also attract international firms to commence or expand UK operations, providing further local content in the wind farm supply chain. Assuming such a rate of expansion, UK content in offshore wind farms could be expected to reach 77% by 2030.
This effect will be moderated under the Gone Green scenario, in which the build rate uplifts more gradually, implying demand for components would grow steadily rather than suddenly soaring upwards. Cebr expects that such a build rate could still stimulate a UK supply chain capable of supplying 71% of content in domestic offshore wind farms by 2030. Slow Progression presents a much lower level of demand, with a UK supply chain not maturing as rapidly since annual capacity additions do not far exceed twice the current level. Due to current growth prospects in the supply chain, along with Government and industry commitments to sourcing at least half of offshore wind farm content from the UK, Cebr estimates that UK content under this scenario would reach 56% by 2030.
It is important to note that UK content is not expected to be equal across each area of wind farm development. Areas where the UK has comparative advantage, such as development services, shall feature a relatively high proportion of UK content. Indeed, working knowledge of local domestic regulation, tax and accounting procedures and environmental conditions are vital to the wind farm development, and as such, UK content in development services is assumed to be close to 100% in all scenarios.
16 Offshore wind: forecasts of future costs and benefits (2011), RenewableUK 17 Going for growth means going for green (2012), Department of Energy and Climate Change.
18
© Centre for Economics and Business Research Ltd, 2012
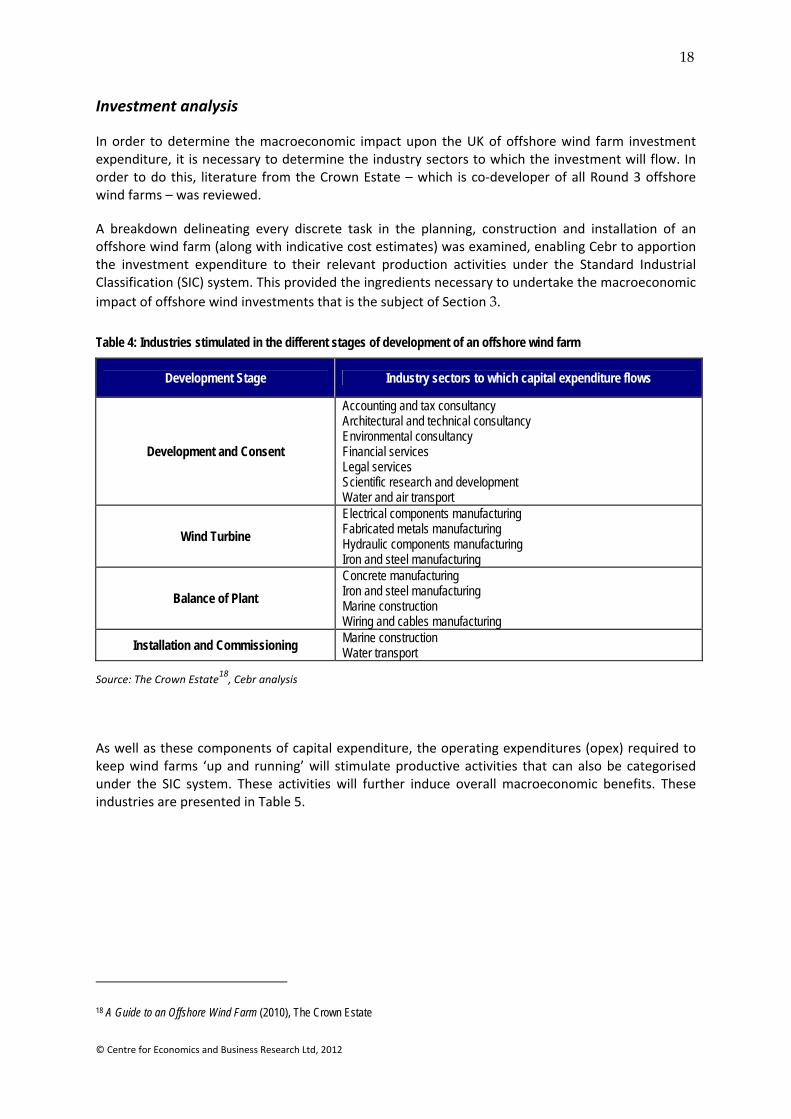
Investment analysis
In order to determine the macroeconomic impact upon the UK of offshore wind farm investment expenditure, it is necessary to determine the industry sectors to which the investment will flow. In order to do this, literature from the Crown Estate – which is co‐developer of all Round 3 offshore wind farms – was reviewed.
A breakdown delineating every discrete task in the planning, construction and installation of an offshore wind farm (along with indicative cost estimates) was examined, enabling Cebr to apportion the investment expenditure to their relevant production activities under the Standard Industrial Classification (SIC) system. This provided the ingredients necessary to undertake the macroeconomic impact of offshore wind investments that is the subject of Section 3.
Table 4: Industries stimulated in the different stages of development of an offshore wind farm
Development Stage Industry sectors to which capital expenditure flows
Development and Consent
Accounting and tax consultancy Architectural and technical consultancy Environmental consultancy Financial services Legal services Scientific research and development Water and air transport
Wind Turbine Electrical components manufacturing Fabricated metals manufacturing Hydraulic components manufacturing Iron and steel manufacturing
Balance of Plant Concrete manufacturing Iron and steel manufacturing Marine construction Wiring and cables manufacturing
Installation and Commissioning Marine construction Water transport
Source: The Crown Estate18, Cebr analysis
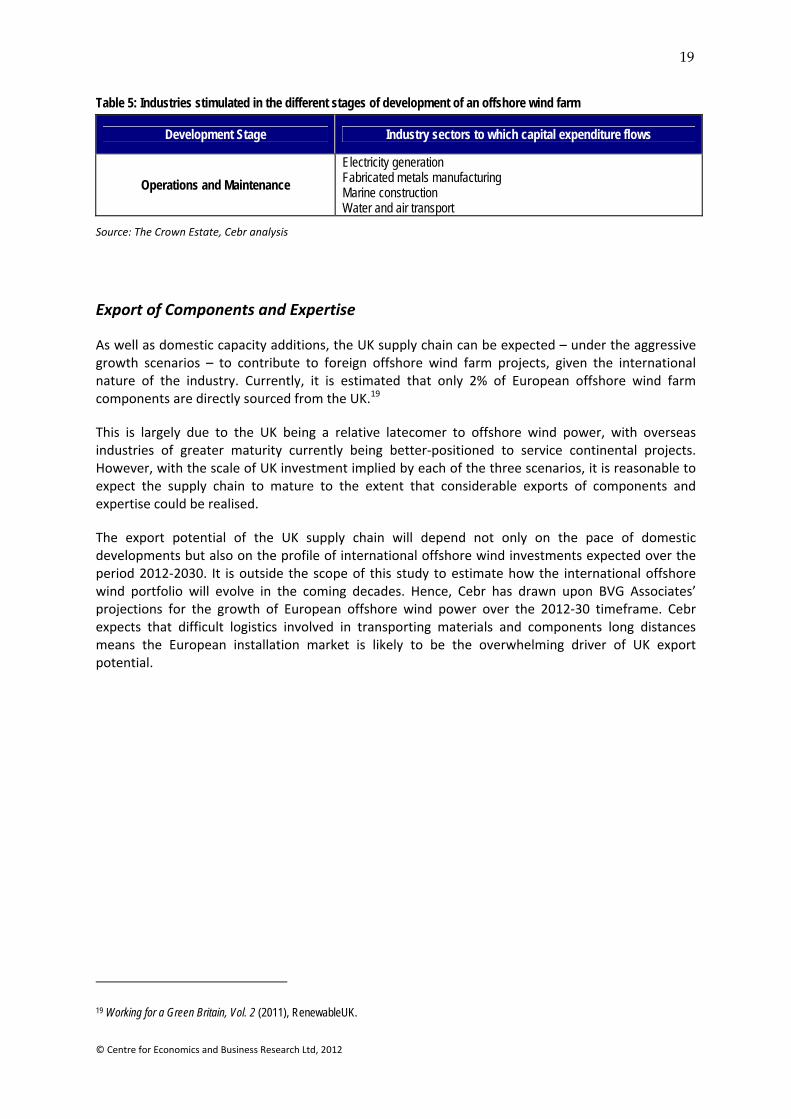
As well as these components of capital expenditure, the operating expenditures (opex) required to keep wind farms ‘up and running’ will stimulate productive activities that can also be categorised under the SIC system. These activities will further induce overall macroeconomic benefits. These industries are presented in Table 5.
18 A Guide to an Offshore Wind Farm (2010), The Crown Estate
19
© Centre for Economics and Business Research Ltd, 2012
Table 5: Industries stimulated in the different stages of development of an offshore wind farm
Development Stage Industry sectors to which capital expenditure flows
Operations and Maintenance Electricity generation Fabricated metals manufacturing Marine construction Water and air transport
Source: The Crown Estate, Cebr analysis
Export of Components and Expertise
As well as domestic capacity additions, the UK supply chain can be expected – under the aggressive growth scenarios – to contribute to foreign offshore wind farm projects, given the international nature of the industry. Currently, it is estimated that only 2% of European offshore wind farm components are directly sourced from the UK.19
This is largely due to the UK being a relative latecomer to offshore wind power, with overseas industries of greater maturity currently being better‐positioned to service continental projects. However, with the scale of UK investment implied by each of the three scenarios, it is reasonable to expect the supply chain to mature to the extent that considerable exports of components and expertise could be realised.
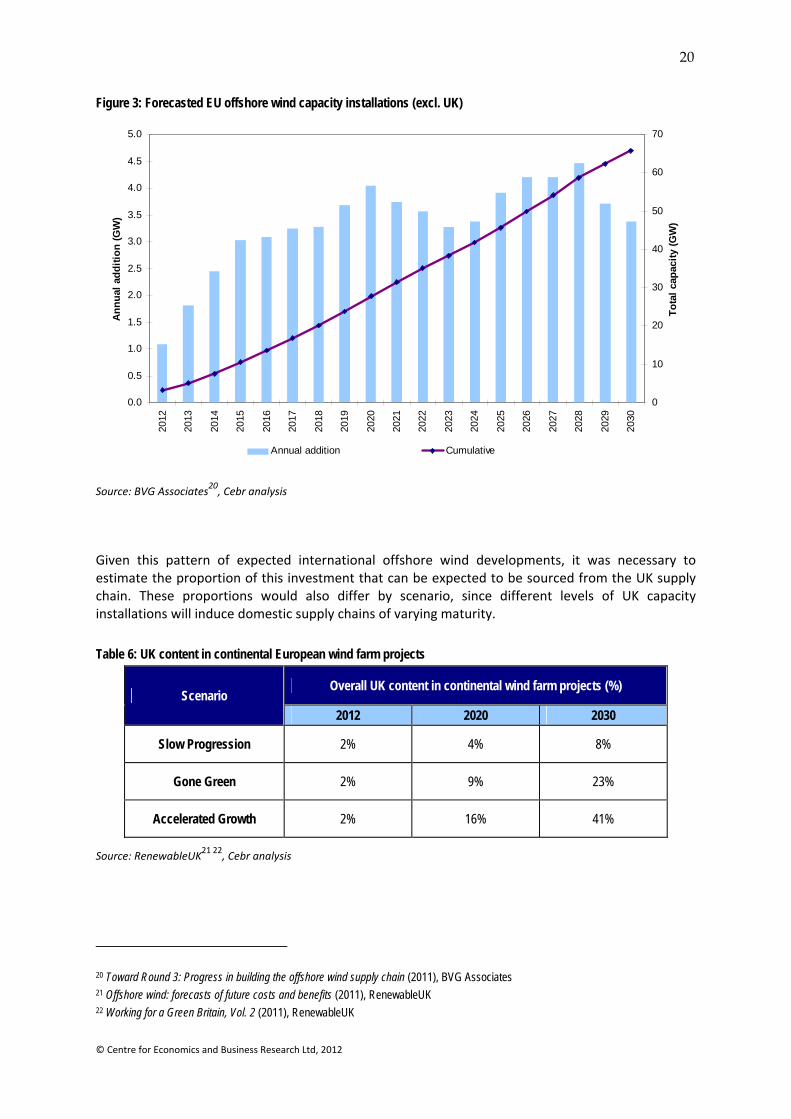
The export potential of the UK supply chain will depend not only on the pace of domestic developments but also on the profile of international offshore wind investments expected over the period 2012‐2030. It is outside the scope of this study to estimate how the international offshore wind portfolio will evolve in the coming decades. Hence, Cebr has drawn upon BVG Associates’ projections for the growth of European offshore wind power over the 2012‐30 timeframe. Cebr expects that difficult logistics involved in transporting materials and components long distances means the European installation market is likely to be the overwhelming driver of UK export potential.
19 Working for a Green Britain, Vol. 2 (2011), RenewableUK.
20
© Centre for Economics and Business Research Ltd, 2012
Figure 3: Forecasted EU offshore wind capacity installations (excl. UK)
Source: BVG Associates20, Cebr analysis
Given this pattern of expected international offshore wind developments, it was necessary to estimate the proportion of this investment that can be expected to be sourced from the UK supply chain. These proportions would also differ by scenario, since different levels of UK capacity installations will induce domestic supply chains of varying maturity.
Table 6: UK content in continental European wind farm projects
Scenario Overall UK content in continental wind farm projects (%)
2012 2020 2030
Slow Progression 2% 4% 8%
Gone Green 2% 9% 23%
Accelerated Growth 2% 16% 41%
Source: RenewableUK21 22, Cebr analysis
20 Toward Round 3: Progress in building the offshore wind supply chain (2011), BVG Associates 21 Offshore wind: forecasts of future costs and benefits (2011), RenewableUK 22 Working for a Green Britain, Vol. 2 (2011), RenewableUK
0.0
0.5
1.0
1.5
2.0
2.5
3.0
3.5
4.0
4.5
5.0
2012
2013
2014
2015
2016
2017
2018
2019
2020
2021
2022
2023
2024
2025
2026
2027
2028
2029
2030
Annu
al a
dditi
on (G
W)
0
10
20
30
40
50
60
70
Tota
l cap
acity
(GW
)
Annual addition Cumulative
21
© Centre for Economics and Business Research Ltd, 2012
The UK supply chain under the Slow Progression scenario would not be expected to have sufficient capacity to source a large percentage of European offshore wind projects. On the other hand, the Gone Green scenario would present a supply chain with the capability to provide significant amounts of components and expertise to international projects, reaching an overall UK content of 23% in 2030.
The Accelerated Growth scenario would induce a supply chain which would grow rapidly to meet domestic capacity additions in the years 2012‐20. In the following decade, the rate of annual UK capacity additions falls – this would leave a mature domestic supply chain with ample capacity to export a very large proportion of continental wind farm content.
As with UK content in domestic wind farm investments, the proportion sourced by the UK supply chain will not be equal across all stages of development. Areas of UK comparative advantage such as development services would also be expected to feature relatively heavily in exports.
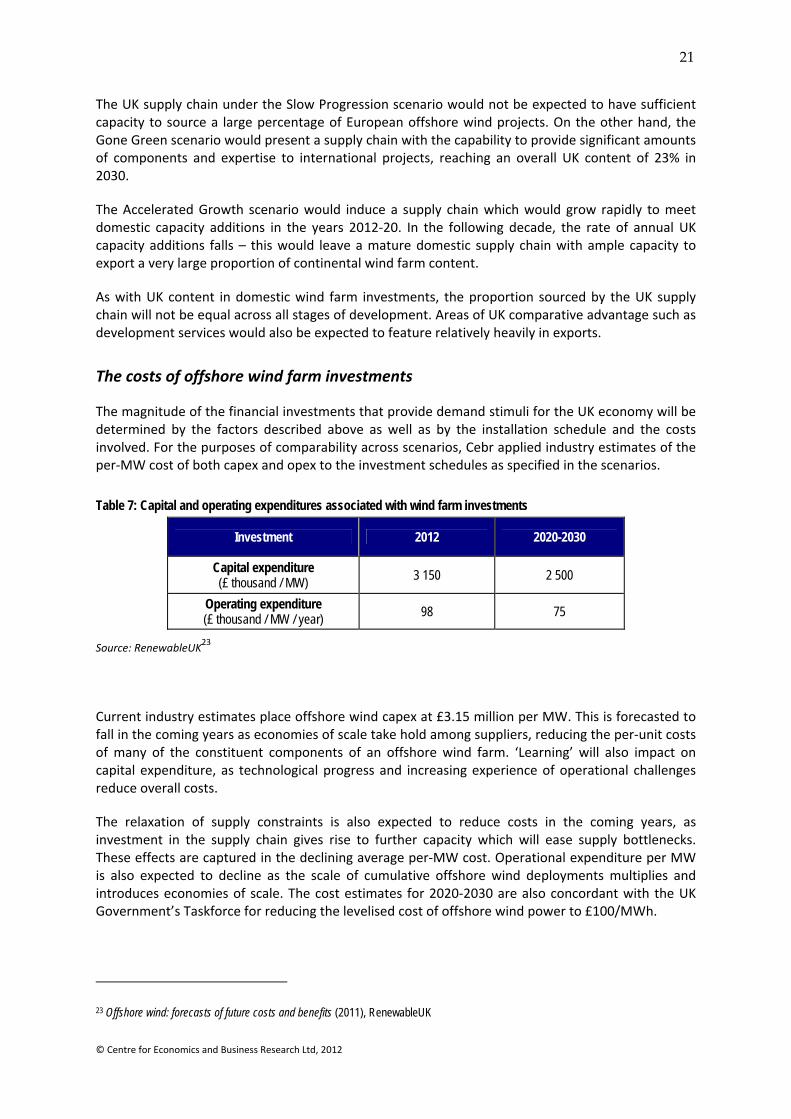
The costs of offshore wind farm investments
The magnitude of the financial investments that provide demand stimuli for the UK economy will be determined by the factors described above as well as by the installation schedule and the costs involved. For the purposes of comparability across scenarios, Cebr applied industry estimates of the per‐MW cost of both capex and opex to the investment schedules as specified in the scenarios.
Table 7: Capital and operating expenditures associated with wind farm investments
Investment 2012 2020-2030
Capital expenditure (£ thousand / MW) 3 150 2 500
Operating expenditure (£ thousand / MW / year) 98 75
Source: RenewableUK23
Current industry estimates place offshore wind capex at £3.15 million per MW. This is forecasted to fall in the coming years as economies of scale take hold among suppliers, reducing the per‐unit costs of many of the constituent components of an offshore wind farm. ‘Learning’ will also impact on capital expenditure, as technological progress and increasing experience of operational challenges reduce overall costs.
The relaxation of supply constraints is also expected to reduce costs in the coming years, as investment in the supply chain gives rise to further capacity which will ease supply bottlenecks. These effects are captured in the declining average per‐MW cost. Operational expenditure per MW is also expected to decline as the scale of cumulative offshore wind deployments multiplies and introduces economies of scale. The cost estimates for 2020‐2030 are also concordant with the UK Government’s Taskforce for reducing the levelised cost of offshore wind power to £100/MWh.
23 Offshore wind: forecasts of future costs and benefits (2011), RenewableUK
22
© Centre for Economics and Business Research Ltd, 2012
In order to derive the total investment magnitude for each given year or scenario, Cebr applied the capex cost to the annual offshore wind capacity additions scheduled for that year, whilst the opex cost was applied to the total cumulative offshore wind capacity in any year under the given scenario.
Reduced fossil fuel imports
The introduction of a large proportion of offshore wind power to the UK can also be expected to have positive economic impacts in the form of reduced fossil fuel imports. As of 2010, 76% of the UK’s electricity production was sourced from coal, oil and gas.24 Since the UK’s own stock of fossil fuels has been largely depleted, this means an increasingly large share of our energy production relying on imported fossil fuels. For example, 44% of the UK’s gas consumption for electricity generating purposes in 201025 – a proportion which is expected to increase as the North Sea reserve dwindles.
This fuel import dependency leaves the UK economy vulnerable to international fuel price fluctuations, since a rise in the wholesale cost of fossil fuels causes a sudden escalation in the cost of meeting UK consumer and industry energy demands. Introducing offshore wind power to the transmission network would dampen this effect, given its operational non‐reliance on fuel inputs to generate electricity.
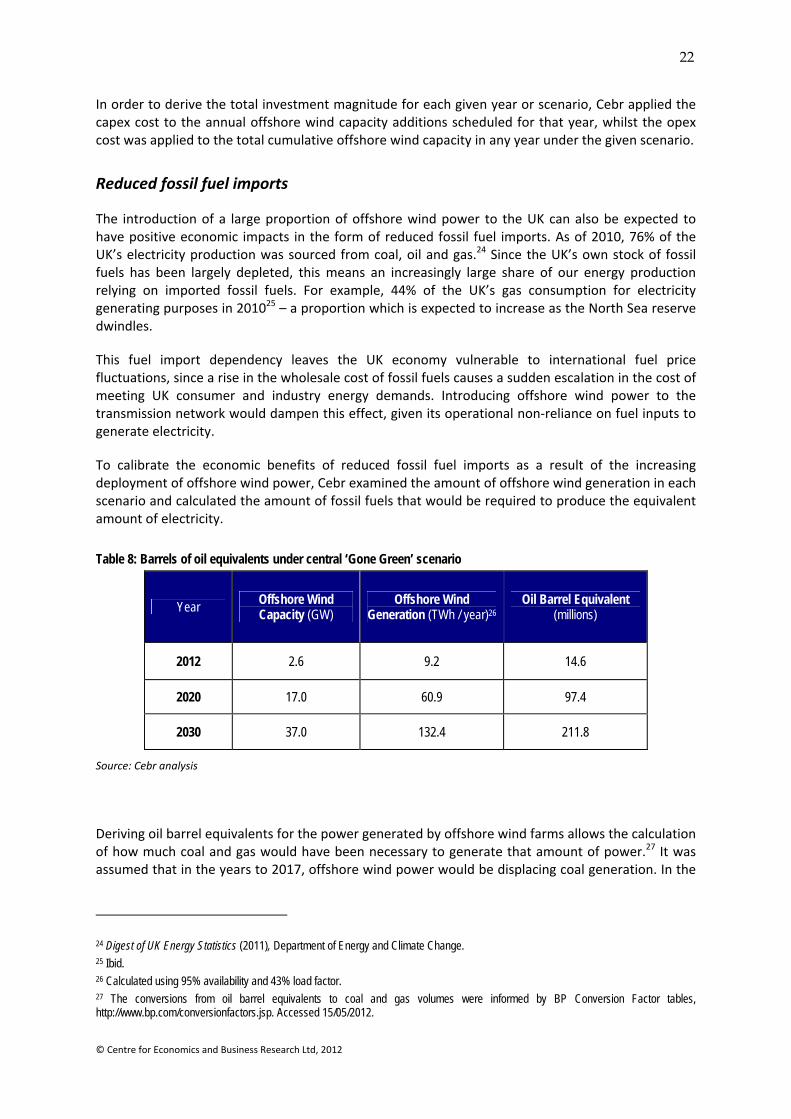
To calibrate the economic benefits of reduced fossil fuel imports as a result of the increasing deployment of offshore wind power, Cebr examined the amount of offshore wind generation in each scenario and calculated the amount of fossil fuels that would be required to produce the equivalent amount of electricity.
Table 8: Barrels of oil equivalents under central ‘Gone Green’ scenario
Year Offshore Wind Capacity (GW)
Offshore Wind Generation (TWh / year)26
Oil Barrel Equivalent (millions)
2012 2.6 9.2 14.6
2020 17.0 60.9 97.4
2030 37.0 132.4 211.8
Source: Cebr analysis
Deriving oil barrel equivalents for the power generated by offshore wind farms allows the calculation of how much coal and gas would have been necessary to generate that amount of power.27 It was assumed that in the years to 2017, offshore wind power would be displacing coal generation. In the
24 Digest of UK Energy Statistics (2011), Department of Energy and Climate Change. 25 Ibid. 26 Calculated using 95% availability and 43% load factor. 27 The conversions from oil barrel equivalents to coal and gas volumes were informed by BP Conversion Factor tables, http://www.bp.com/conversionfactors.jsp. Accessed 15/05/2012.

23
© Centre for Economics and Business Research Ltd, 2012
years 2018‐2022, an increasing proportion of gas is displaced, until 2023 when coal drops out and the entirety of fuel displacement is of gas.
The percentages of coal and gas which will be imported in future are calculated assuming that past trends in UK production, demand and exports continue. Given the trend of diminishing North Sea gas production and coal mining, the proportion of fuel which the UK will need to source from abroad is expected to reach 88% by 2030.
After calculating the amount of fossil fuels required in order to generate the energy provided by offshore wind power in each scenario, and estimating the extent to which that fuel is likely to be imported, we were able to place monetary values on the imports displaced by offshore wind generation. These values were calculated using the Department of Energy and Climate Change’s central wholesale fuel price forecasts.
Export of offshore wind‐generated electricity
Increasing interconnection between national transmission networks has been a valuable avenue for balancing electricity supply and demand. At times where supply exceeds demand, power can be exported through interconnectors; while at times of supply shortfall, energy can be imported from other networks to meet domestic demand. Currently, the UK has operational interconnectors with Ireland (with 500 MW capacity), France (with 2 GW capacity), and the Netherlands (with 1 GW capacity).28
As the penetration of renewables on national networks increases, the issue of increased variability can lead to greater reliance on interconnection in order to balance supply of and demand for energy.29 This increased interconnection can provide considerable benefit to the UK economy by allowing for ever‐increasing exports of electricity, especially in future scenarios where offshore wind power is prevalent on the UK system.
Wind energy supply cannot be switched off easily when domestic demand is not sufficient to warrant full‐capacity generation. As a result, we assumed an increasing level of interconnection in each scenario, as a balancing measure as well as backup capacity measure for the increased renewables penetration required to meet the UK’s binding emissions targets. These assumptions are shown in Table 9.
28 National Grid interconnector data, http://www.nationalgrid.com/uk/Interconnectors . Accessed 15/05/2012. 29 In line with industry practice, we refer to the “variability” of wind and other renewables, to differentiate them from nuclear and fossil plant which can be “intermittent”. The distinction is between the former which have a variable, but predictable, power output, and the latter which have a steady, but sometimes unpredictable, power output.
24
© Centre for Economics and Business Research Ltd, 2012
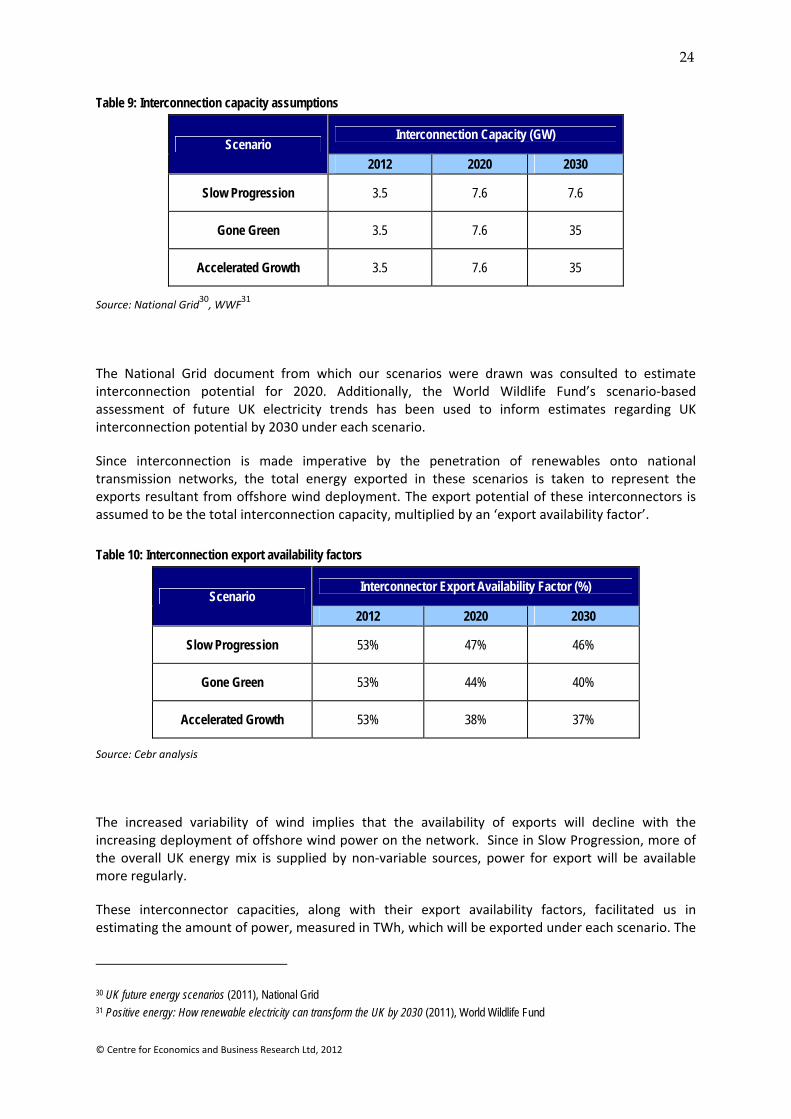
Table 9: Interconnection capacity assumptions
Scenario Interconnection Capacity (GW)
2012 2020 2030
Slow Progression 3.5 7.6 7.6
Gone Green 3.5 7.6 35
Accelerated Growth 3.5 7.6 35
Source: National Grid30, WWF31
The National Grid document from which our scenarios were drawn was consulted to estimate interconnection potential for 2020. Additionally, the World Wildlife Fund’s scenario‐based assessment of future UK electricity trends has been used to inform estimates regarding UK interconnection potential by 2030 under each scenario.
Since interconnection is made imperative by the penetration of renewables onto national transmission networks, the total energy exported in these scenarios is taken to represent the exports resultant from offshore wind deployment. The export potential of these interconnectors is assumed to be the total interconnection capacity, multiplied by an ‘export availability factor’.
Table 10: Interconnection export availability factors
Scenario Interconnector Export Availability Factor (%)
2012 2020 2030
Slow Progression 53% 47% 46%
Gone Green 53% 44% 40%
Accelerated Growth 53% 38% 37%
Source: Cebr analysis
The increased variability of wind implies that the availability of exports will decline with the increasing deployment of offshore wind power on the network. Since in Slow Progression, more of the overall UK energy mix is supplied by non‐variable sources, power for export will be available more regularly.
These interconnector capacities, along with their export availability factors, facilitated us in estimating the amount of power, measured in TWh, which will be exported under each scenario. The
30 UK future energy scenarios (2011), National Grid 31 Positive energy: How renewable electricity can transform the UK by 2030 (2011), World Wildlife Fund
25
© Centre for Economics and Business Research Ltd, 2012
magnitude of this power transmission was factored by DECC’s central wholesale energy price projections to derive the total monetary value of this exported energy.
2.2 Embedding offshore wind investments within an economic impacts framework
This subsection describes the manner in which we embedded the offshore wind investment ‘industry’ within the economic framework underlying Cebr’s macroeconomic impact models.
To formulate a working definition of the offshore wind industry that was relevant for this study, we used as our guide the structure of the economy on which the UK Office for National Statistics (ONS) bases its system of national accounts. Products and services, as well as economic activities are broken down according to Standard Industrial Classifications (SIC), the most recent being SIC 2007. This approach facilitates estimation of the size and economic impact of UK outbound travel within the framework of the ONS’ supply‐and‐use tables, the most detailed official record of how sectors of the economy interact with other sectors, with consumers and with international markets in producing the nation’s GDP and national income.
We analysed offshore wind by adapting these tables to assign the industry a role within them. This involved the reassignment of elements of other industries to the newly created UK offshore wind industry, and re‐mapping the relationships between the group of subsets of industries that constitute the industry with the industries and sectors that make up the rest of the economy.
Baseline final demand stimuli
Investment in offshore wind capacity creates a final demand stimulus for the products and services required to realise that investment. Likewise, the operation of wind farms, once installed, creates a final demand stimulus for a different (more limited) set of products and services. Based on the methods outlined in section 2.1, we established the profiles of capital and operating expenditures associated with investment in offshore wind capacity.
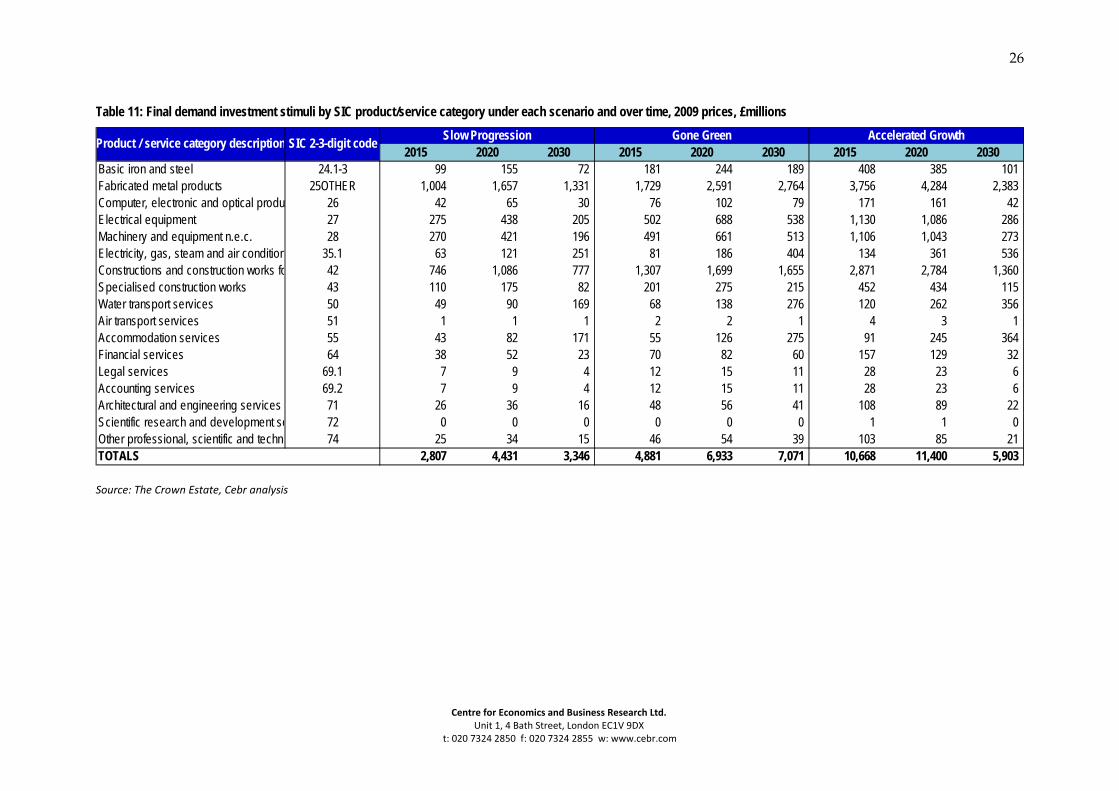
These expenditure profiles are shown in Table 11 below, where they are categorised by SIC product category and presented for each of the years 2015, 2020 and 2030 under each of the aggregate offshore wind capacity scenarios.
In line with the analysis in the previous section, operating expenditures are concentrated in five of the 18 product categories below, while capital expenditures are spread across 15 of these categories. Note that, because the latest ONS supply‐and‐use data are for the year 2009, we downwardly adjusted the raw 2010 data for inflation between 2009 and 2010.
The trends in expenditure under all scenarios reflects the balance of effects over time between the concentration of offshore wind investments in the period 2018‐2020, the declining cost of certain offshore wind farm component expenditures and the pace of the development of the UK supply chain, the assumptions for all of which were developed in the previous section.
26
Centre for Economics and Business Research Ltd. Unit 1, 4 Bath Street, London EC1V 9DX
t: 020 7324 2850 f: 020 7324 2855 w: www.cebr.com
Table 11: Final demand investment stimuli by SIC product/service category under each scenario and over time, 2009 prices, £millions
Source: The Crown Estate, Cebr analysis
2015 2020 2030 2015 2020 2030 2015 2020 2030Basic iron and steel 24.1-3 99 155 72 181 244 189 408 385 101 Fabricated metal products 25OTHER 1,004 1,657 1,331 1,729 2,591 2,764 3,756 4,284 2,383 Computer, electronic and optical produ 26 42 65 30 76 102 79 171 161 42 Electrical equipment 27 275 438 205 502 688 538 1,130 1,086 286 Machinery and equipment n.e.c. 28 270 421 196 491 661 513 1,106 1,043 273 Electricity, gas, steam and air condition 35.1 63 121 251 81 186 404 134 361 536 Constructions and construction works fo 42 746 1,086 777 1,307 1,699 1,655 2,871 2,784 1,360 Specialised construction works 43 110 175 82 201 275 215 452 434 115 Water transport services 50 49 90 169 68 138 276 120 262 356 Air transport services 51 1 1 1 2 2 1 4 3 1 Accommodation services 55 43 82 171 55 126 275 91 245 364 Financial services 64 38 52 23 70 82 60 157 129 32 Legal services 69.1 7 9 4 12 15 11 28 23 6 Accounting services 69.2 7 9 4 12 15 11 28 23 6 Architectural and engineering services 71 26 36 16 48 56 41 108 89 22 Scientific research and development se 72 0 0 0 0 0 0 1 1 0 Other professional, scientific and techni 74 25 34 15 46 54 39 103 85 21 TOTALS 2,807 4,431 3,346 4,881 6,933 7,071 10,668 11,400 5,903
Product / service category description SIC 2-3-digit code Slow Progression Gone Green Accelerated Growth
27
Centre for Economics and Business Research Ltd. Unit 1, 4 Bath Street, London EC1V 9DX
t: 020 7324 2850 f: 020 7324 2855 w: www.cebr.com
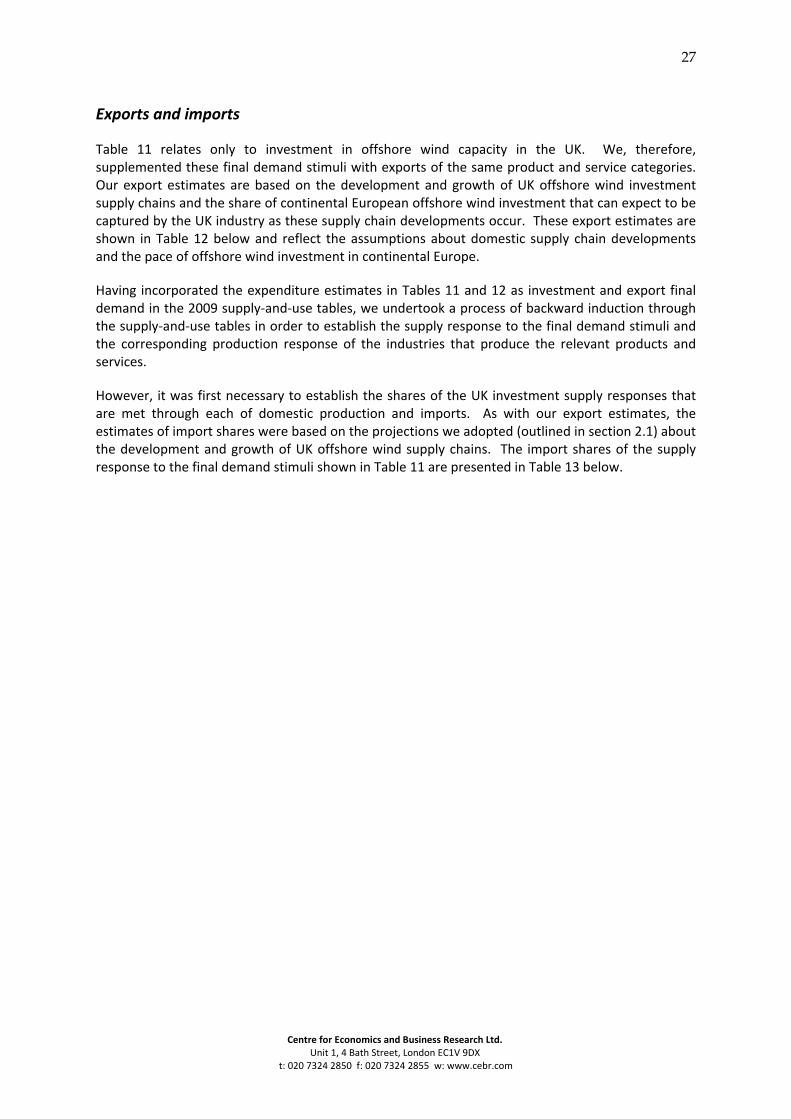
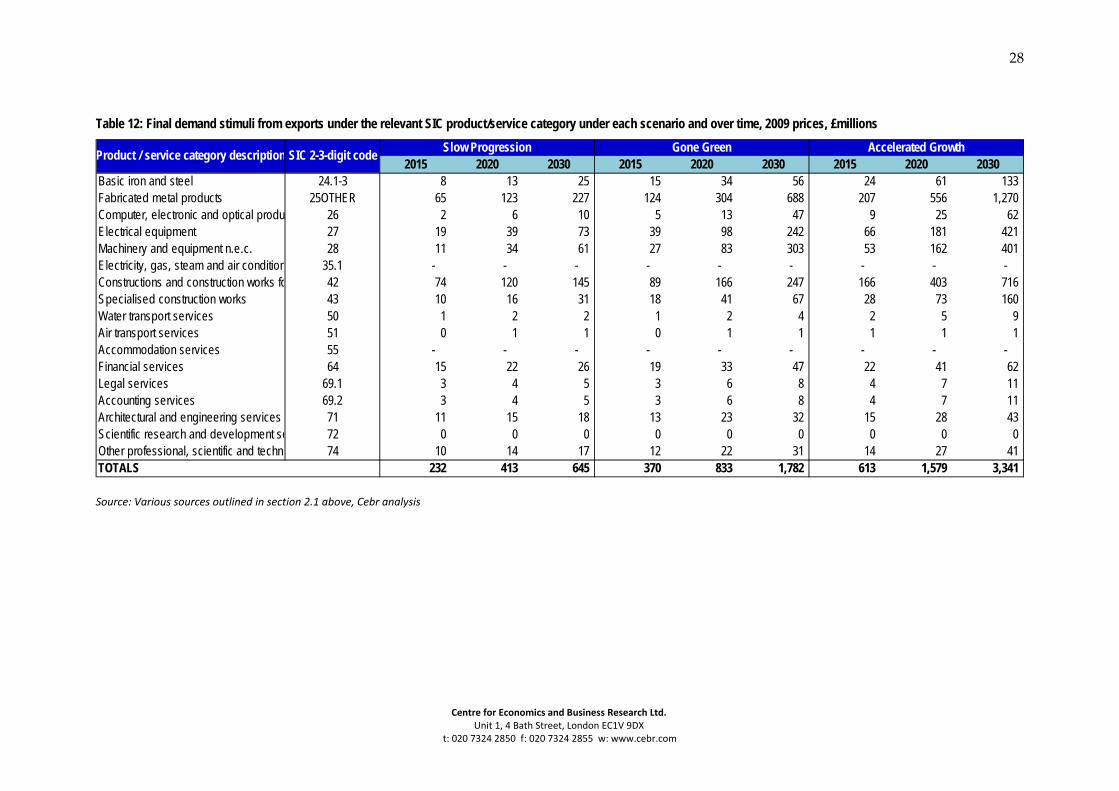
Exports and imports
Table 11 relates only to investment in offshore wind capacity in the UK. We, therefore, supplemented these final demand stimuli with exports of the same product and service categories. Our export estimates are based on the development and growth of UK offshore wind investment supply chains and the share of continental European offshore wind investment that can expect to be captured by the UK industry as these supply chain developments occur. These export estimates are shown in Table 12 below and reflect the assumptions about domestic supply chain developments and the pace of offshore wind investment in continental Europe.
Having incorporated the expenditure estimates in Tables 11 and 12 as investment and export final demand in the 2009 supply‐and‐use tables, we undertook a process of backward induction through the supply‐and‐use tables in order to establish the supply response to the final demand stimuli and the corresponding production response of the industries that produce the relevant products and services.
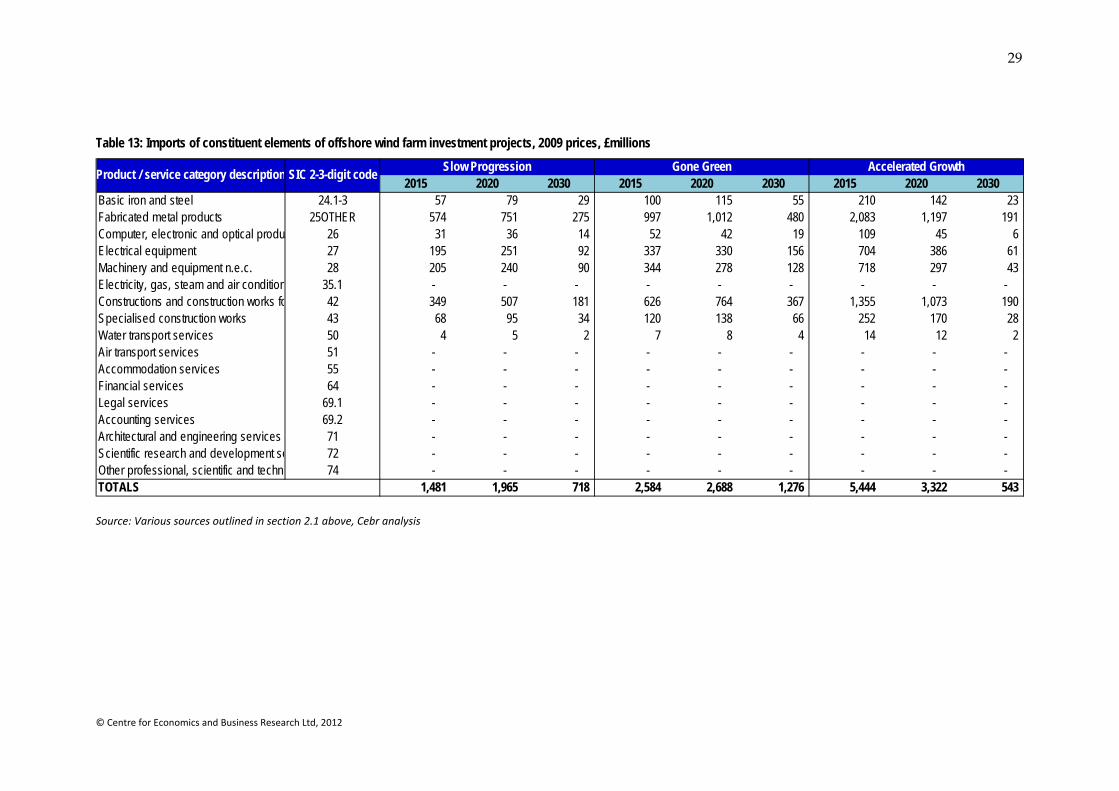
However, it was first necessary to establish the shares of the UK investment supply responses that are met through each of domestic production and imports. As with our export estimates, the estimates of import shares were based on the projections we adopted (outlined in section 2.1) about the development and growth of UK offshore wind supply chains. The import shares of the supply response to the final demand stimuli shown in Table 11 are presented in Table 13 below.
28
Centre for Economics and Business Research Ltd. Unit 1, 4 Bath Street, London EC1V 9DX
t: 020 7324 2850 f: 020 7324 2855 w: www.cebr.com
Table 12: Final demand stimuli from exports under the relevant SIC product/service category under each scenario and over time, 2009 prices, £millions
Source: Various sources outlined in section 2.1 above, Cebr analysis
2015 2020 2030 2015 2020 2030 2015 2020 2030Basic iron and steel 24.1-3 8 13 25 15 34 56 24 61 133 Fabricated metal products 25OTHER 65 123 227 124 304 688 207 556 1,270 Computer, electronic and optical produ 26 2 6 10 5 13 47 9 25 62 Electrical equipment 27 19 39 73 39 98 242 66 181 421 Machinery and equipment n.e.c. 28 11 34 61 27 83 303 53 162 401 Electricity, gas, steam and air condition 35.1 - - - - - - - - - Constructions and construction works fo 42 74 120 145 89 166 247 166 403 716 Specialised construction works 43 10 16 31 18 41 67 28 73 160 Water transport services 50 1 2 2 1 2 4 2 5 9 Air transport services 51 0 1 1 0 1 1 1 1 1 Accommodation services 55 - - - - - - - - - Financial services 64 15 22 26 19 33 47 22 41 62 Legal services 69.1 3 4 5 3 6 8 4 7 11 Accounting services 69.2 3 4 5 3 6 8 4 7 11 Architectural and engineering services 71 11 15 18 13 23 32 15 28 43 Scientific research and development se 72 0 0 0 0 0 0 0 0 0 Other professional, scientific and techni 74 10 14 17 12 22 31 14 27 41 TOTALS 232 413 645 370 833 1,782 613 1,579 3,341
Product / service category description SIC 2-3-digit code Slow Progression Gone Green Accelerated Growth
29
© Centre for Economics and Business Research Ltd, 2012
Table 13: Imports of constituent elements of offshore wind farm investment projects, 2009 prices, £millions
Source: Various sources outlined in section 2.1 above, Cebr analysis
2015 2020 2030 2015 2020 2030 2015 2020 2030Basic iron and steel 24.1-3 57 79 29 100 115 55 210 142 23 Fabricated metal products 25OTHER 574 751 275 997 1,012 480 2,083 1,197 191 Computer, electronic and optical produ 26 31 36 14 52 42 19 109 45 6 Electrical equipment 27 195 251 92 337 330 156 704 386 61 Machinery and equipment n.e.c. 28 205 240 90 344 278 128 718 297 43 Electricity, gas, steam and air condition 35.1 - - - - - - - - - Constructions and construction works fo 42 349 507 181 626 764 367 1,355 1,073 190 Specialised construction works 43 68 95 34 120 138 66 252 170 28 Water transport services 50 4 5 2 7 8 4 14 12 2 Air transport services 51 - - - - - - - - - Accommodation services 55 - - - - - - - - - Financial services 64 - - - - - - - - - Legal services 69.1 - - - - - - - - - Accounting services 69.2 - - - - - - - - - Architectural and engineering services 71 - - - - - - - - - Scientific research and development se 72 - - - - - - - - - Other professional, scientific and techni 74 - - - - - - - - - TOTALS 1,481 1,965 718 2,584 2,688 1,276 5,444 3,322 543
Product / service category description SIC 2-3-digit code Slow Progression Gone Green Accelerated Growth
30
Centre for Economics and Business Research Ltd. Unit 1, 4 Bath Street, London EC1V 9DX
t: 020 7324 2850 f: 020 7324 2855 w: www.cebr.com
Domestic production and intermediate demand responses and completion of the embedding process
Having established the share of UK offshore wind investments that are met through domestic production – by subtracting imports from the offshore wind expenditures in Table 11 – we used the inter‐industry relationships in the combined use matrix of the supply‐and‐use tables to map the intermediate demand responses of the industries that produce the products and services required to deliver, operate and maintain offshore wind investments.32
Aggregating the offshore wind data across the specific product and service categories (in Table 11) and the corresponding SIC‐based industries provided what was required to adapt the supply‐and‐use tables by assigning the newly created UK offshore wind ‘industry’ a role within them. These adapted supply‐and‐use tables provided the basis for estimating (using the input‐output analysis described in section 2.3 below) the size of the economic contributions that this industry can be expected to make as offshore wind investment in the UK increases. By linking our supply‐and‐use (and input‐output) models to the scenario capability of our bespoke offshore wind energy model, we were able to assess how these economic contributions could be expected to change over time and under alternative assumptions about rates of overall offshore wind investment.
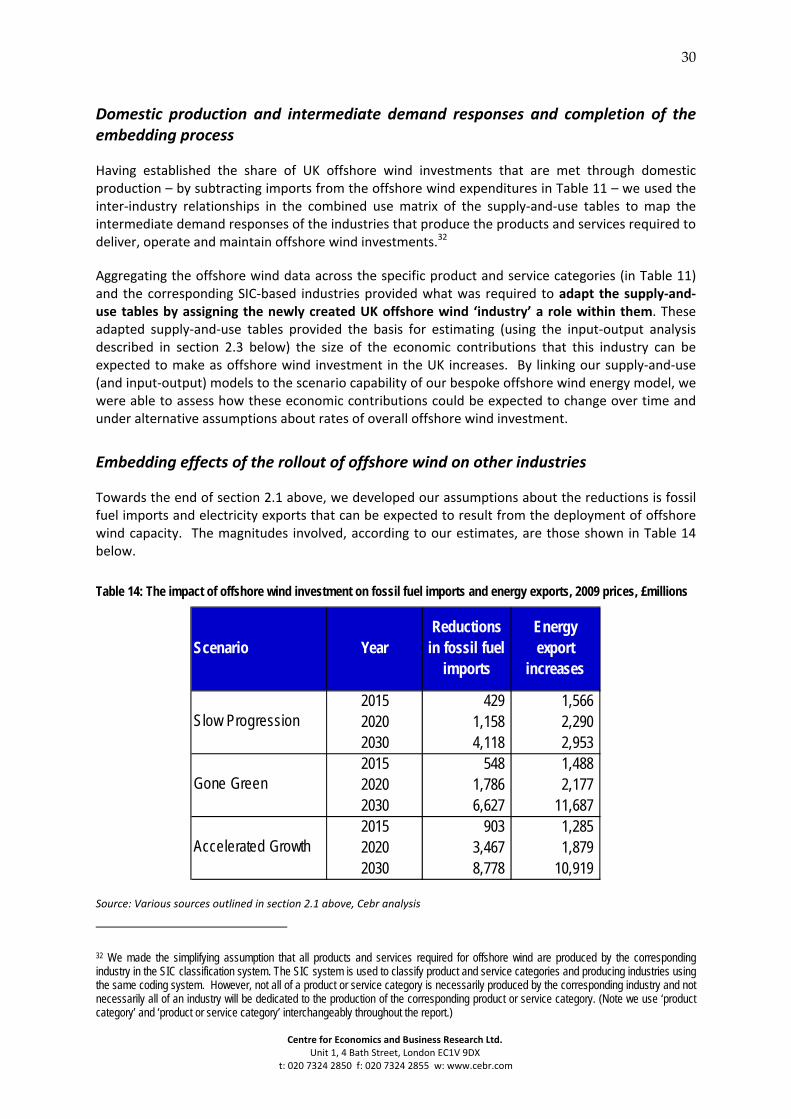
Embedding effects of the rollout of offshore wind on other industries
Towards the end of section 2.1 above, we developed our assumptions about the reductions is fossil fuel imports and electricity exports that can be expected to result from the deployment of offshore wind capacity. The magnitudes involved, according to our estimates, are those shown in Table 14 below.
Table 14: The impact of offshore wind investment on fossil fuel imports and energy exports, 2009 prices, £millions
Source: Various sources outlined in section 2.1 above, Cebr analysis
32 We made the simplifying assumption that all products and services required for offshore wind are produced by the corresponding industry in the SIC classification system. The SIC system is used to classify product and service categories and producing industries using the same coding system. However, not all of a product or service category is necessarily produced by the corresponding industry and not necessarily all of an industry will be dedicated to the production of the corresponding product or service category. (Note we use ‘product category’ and ‘product or service category’ interchangeably throughout the report.)
Scenario YearReductions
in fossil fuel imports
Energy export
increases
2015 429 1,566 2020 1,158 2,290 2030 4,118 2,953 2015 548 1,488 2020 1,786 2,177 2030 6,627 11,687 2015 903 1,285 2020 3,467 1,879 2030 8,778 10,919
Slow Progression
Gone Green
Accelerated Growth
31
© Centre for Economics and Business Research Ltd, 2012
To incorporate these and the balance of trade effects resulting directly from offshore wind investments (see earlier part of this subsection 2.2) into our economic impact assessment, it was first necessary to embed them within the supply‐and‐use tables.
Fossil fuel import reductions were assumed to effect three industries – the supply and production activities relating to each of two fossil fuels – coal and gas – and of electricity. The impacts on these industries and the manner of embedding them into our economic framework is summarised as follows:
Fossil fuel (coal and gas): total supply to the UK market in the relevant SIC product categories are assumed to be reduced by the total fossil fuel displacement that results from offshore wind. This includes mainly imports but also an element of domestically sourced supply. Domestic production of these fossil fuels was, therefore, reduced by the corresponding amount and, through the backward induction process, the intermediate demand responses of these industries could be established. We incorporated assumptions about the dwindling North Sea reserve in our fossil fuel displacement forecasts.
Electricity: The electricity industry’s intermediate demands for coal and gas were adjusted downwards to the extent of the expected displacement of these fossil fuels by offshore wind, both imported and domestically produced. The impact is an alteration in the structure of the supply chain for UK electricity production, which feeds into our economic impact assessment below. Because, as mentioned previously, the scope of the study did not cover the post‐investment impacts of offshore wind (that is, what happens when offshore wind becomes operational), we did not attempt to assess the impact on the value of domestic production of electricity.
2.3 Input‐output modelling and alternative multiplier concepts
Having assigned a role for the industry that will grow to provide for offshore wind farm development and operation within the supply‐and‐use framework, we had the foundation for establishing the size of the economic contributions made by this industry under each of our scenarios and over time. We estimate these contributions using standard metrics relating to gross value added (GVA33) and percentages of UK GDP, and absolute and percentage shares of UK employment.
To measure broader economic contributions that can be expected to occur through the multiplier process, we used the approaches of a number of well‐known authorities in the area. The appropriateness of these alternatives depends on how the prevailing macroeconomic circumstances and policies are to be interpreted. The alternative approaches and the relevant economic circumstances are outlined as follows.
33 GVA or gross value added is a measure of the value from production in the national accounts and can be thought of as the value of industrial output less intermediate consumption. That is, the value of what is produced less the value of the intermediate goods and services used as inputs to produce it. GVA is also commonly known as income from production and is distributed in three directions – to employees, to shareholders and to government. GVA is linked as a measurement to GDP – both being a measure of economic output. That relationship is (GVA + Taxes on products - Subsidies on products = GDP). Because taxes and subsidies on individual product categories are only available at the whole economy level (rather than at the sectoral or regional level), GVA tends to be used for measuring things like gross regional domestic product and other measures of economic output of entities that are smaller than the whole economy.
32
© Centre for Economics and Business Research Ltd, 2012
Leontief matrix multipliers for the domestic economy
Multipliers show the ratio of an induced change in national income to an initial change in the level of final demand spending, where the multiplier effect denotes the phenomenon whereby some initial increase (or decrease) in the rate of spending will bring about a more than proportionate increase (or decrease) in national income. The Keynesian approach barely requires a mention but is very much grounded in macroeconomic analysis, offering little capability to analyse impacts of entities that are smaller than the whole economy.
Input‐output analysis, due largely to the work of Wassily Leontief34, while macroeconomic in the sense that it involves analysing the economy as a whole, owes its foundations and techniques to the microeconomic analysis of production and consumption.35 According to ten Raa (2005), some people argue that input‐output analysis is at the interface of both, defining it as the study of industries or sectors of the economy.
The well‐known Leontief inverse matrix, which shows the inter‐industry dependencies of an economy, is the basis for producing so‐called ‘ordinary’ (or traditional) input‐output multipliers. These are some of the most important tools for measuring the total impact on output, employment and income when there is a change in final demand.
The Leontief inverse matrix can also be described as the output requirements matrix for final demand, that is, it shows the input requirements from the other sectors of the economy per unit of output produced in the sector under examination in response to a final demand stimulus. The matrix can be used to produce two types of multiplier – the Type I multiplier incorporating direct and indirect (supply chain) impacts and the Type II multiplier incorporating induced (through higher incomes and resulting greater consumption) impacts as well.36
Cebr’s baseline multiplier model is based on this Leontief input‐output modelling approach. The model is, however, based on a so‐called ‘domestic use’ table, from which imports are extracted from intermediate demands in order to focus on the domestic economy impacts of final demand stimuli. However, in given sets of circumstances, this will not tell the full story. The current economic circumstances suggest that it is appropriate to explicitly incorporate international trade in our analysis, through the calculation of foreign trade multipliers. We explain why in the following paragraphs.
Foreign trade multipliers
A foreign trade multiplier (FTM) shows the ratio of an induced change in national income to an initial change in the amount of exports. There are numerous methods used to calculate them but we have chosen 2 (for comparison purposes) that build on Cebr’s existing input‐output models. The relevant issues are briefly discussed later. First we explain why foreign trade multipliers – normally associated with fixed exchange rate regimes – to which the UK has not been officially subject since its exit from the ERM on “Black Wednesday” in 1992 – are a relevant consideration again, and particularly for this study.
34 See, for example, Leontief, Wassily W. Input-Output Economics. 2nd ed., New York: Oxford University Press, 1986. 35 See ten Raa, Thijs (2005), The Economics of Input-Output Analysis, Cambridge University Press. 36 We would note that all multipliers presented in this report are Type II multipliers, capturing the direct, indirect and induced impacts of the final demand stimulus from the boost to investment and export final demands that can be expected to result from increasing levels of offshore wind deployment. Examples of decomposed multipliers are featured in Figure 4 and Figure 5 below.
33
© Centre for Economics and Business Research Ltd, 2012
Motivation for using FTMs
The UK – and much of the Western World ‐ is going through a major competitive challenge as two‐thirds of the world industrialises rapidly, while still working hours and paying themselves wages based on their history as poor countries. This implies very low unit labour costs, particularly in light of their productivity potential. Meanwhile, the growing demands from these newly industrialising economies are placing a strain on the balance between supply and demand for primary products, raising and sustaining higher commodity prices and, thus, raising the cost base – in production and consumption ‐ of already struggling Western economies.
The newly industrialising nations have, therefore, turned the terms of trade dramatically against the UK and the other countries being challenged. While the evidence suggests that this is some sort of disequilibrium, it could easily persist for at least a generation (20‐30 years) and possibly twice that. Singapore, for instance, has had a higher GDP per capita than the UK on and off since the late 1990s (pre‐Asian crisis) yet the latest 2010 data from the U.S. Bureau of Labour Statistics still shows that hourly compensation in manufacturing in Singapore is still only 55% of the UK level and progress in narrowing the gap is surprisingly slow – the percentage was 52.7% in 1997.
Countries facing this competitive challenge could, in theory, devalue themselves into eventual prosperity (using their currencies) but there is an inflation constraint that means that this is not possible in practice. Any devaluation at sufficient speed to enable the declining economy to achieve what would previously have been thought of as a state of full employment (or a non‐accelerating inflation rate of unemployment) would, particularly when the terms of trade are being turned against the declining economy, lead to excess inflation and a risk of inflation becoming embedded.
Therefore, for the UK, the Bank of England’s inflation target effectively acts as a lower bound on the value of the Pound, limiting any scope for currency devaluation. The (previously successful) UK economy is forced to either cope with long term underutilisation of resources or adjust in a way that results in lower labour costs, whilst also improving the supply curve of labour.37 Without action of this kind, medium to long term underutilisation of resources is highly likely for an uncompetitive economy. The amount of capital stock in the system might decay to the point where it is no longer in surplus and human skills and abilities are bound to degenerate as a result of persistent long term unemployment.
The implication is that economic growth in Western economies is likely to be depressed as they adjust to the competitive challenge placed on them by newly emerging economies like China. The impact of this on growth is likely to be most keenly felt in countries, like many in Europe, with rigid labour markets and high labour costs, particularly where these are combined with high taxes.
The current economic circumstances and the challenges facing the UK and most of Europe highlight the importance of taking actions that will turn the terms of trade back in their favour in order to improve their trade balance (net exports). Such actions are acting directly on the factor that is constraining growth and consequently can be expected to have particularly important multiplier effects.
This provided the motivation for undertaking a foreign trade multiplier analysis of the impact of increasing levels of offshore wind investments and exports. It is Cebr’s contention that, given the
37 That is, providing incentives to boost the incentive to work. In economic terms, reducing welfare payments has the double effect of improving the supply curve of labour and reducing the cost of welfare which enables taxes to be cut to less uncompetitive levels. But many would have scruples about dealing with competitive problems by making the worst off even worse off.
34
© Centre for Economics and Business Research Ltd, 2012
aforementioned positive impacts on the UK’s balance of trade, these significant multiplier impacts can be expected to derive from investment in offshore wind.
Methods used to calculate FTMs
We noted above the limitations of the Keynesian approach in terms of the capability to work at the sectoral level, while Miazawa (1960)38 points to defects in the treatment of imported intermediate goods which casts doubt over the usefulness of the approach for FTM analysis.39
The author also points to the limitations of the standard Leontief matrix multiplier approach to FTMs. The Leontief approach is devoted entirely to the analysis of intermediate products in the circular flow and, unlike the Keynesian model, lacks analysis of the multiplier process via the consumption function. Formally, he notes, the Leontief system can regard the household sector as an industry whose output is labour for which they receive compensation and whose inputs are consumption goods.40 But, according to Miazawa, the correct procedure for dealing with consumption is not to regard it as a fictional production activity, but to incorporate the Keynesian consumption function in its disaggregated form.
While the Keynesian approach to the foreign trade multiplier takes account of imports of intermediate goods required for the production of consumption goods, the entire propagation (multiplier) process is projected into the income‐spending or expenditure aspect only, with no explicit distinction between leakage (through imports) in the expenditure process and in the production process. Meanwhile, the Leontief matrix approach, in regarding the household sector as an industry just like the other ‘actual’ industries, assumes that households’ input‐output ratios are constant. But, Miazawa notes, consumers are not a technologically determined production process, but choice‐making organisms and the factors of choice‐making (that is, the consumption coefficients) are not as stable as the input coefficients for the standard industries.
In Miazawa’s foreign trade multiplier, the import of intermediate goods is taken into account at the proper place, namely, in the circular flow of intermediate products. His formula consists of the Leontief FTM inverse matrix and an inverse matrix showing the effects of endogenous changes in the consumption demand of the household sector. This can be interpreted as the multiplier combining Leontief’s production‐based propagation process and the Keynesian consumption‐based propagation process. This, in turn, overcomes the difficulties with using either the Keynesian approach or the Leontief approach in isolation.
38 Miazawa, Kenichi (1960), “Foreign trade multiplier analysis, input-output analysis and the consumption function”, Quarterly Journal of Economics, 74(1), Oxford 39 In the Keynesian fundamental equation for an open economy, Y + M = C + I + E, the external sector is combined inconsistently with the domestic sector in the circular flow of income. Y stands for GDP (or national income) excluding intermediate goods, while M stands for imported goods including intermediate products. (Miazawa, 1960) 40 This is indeed the approach that is frequently employed in practice and is the basis for the domestic and baseline multiplier estimates that feature in section 3 below.
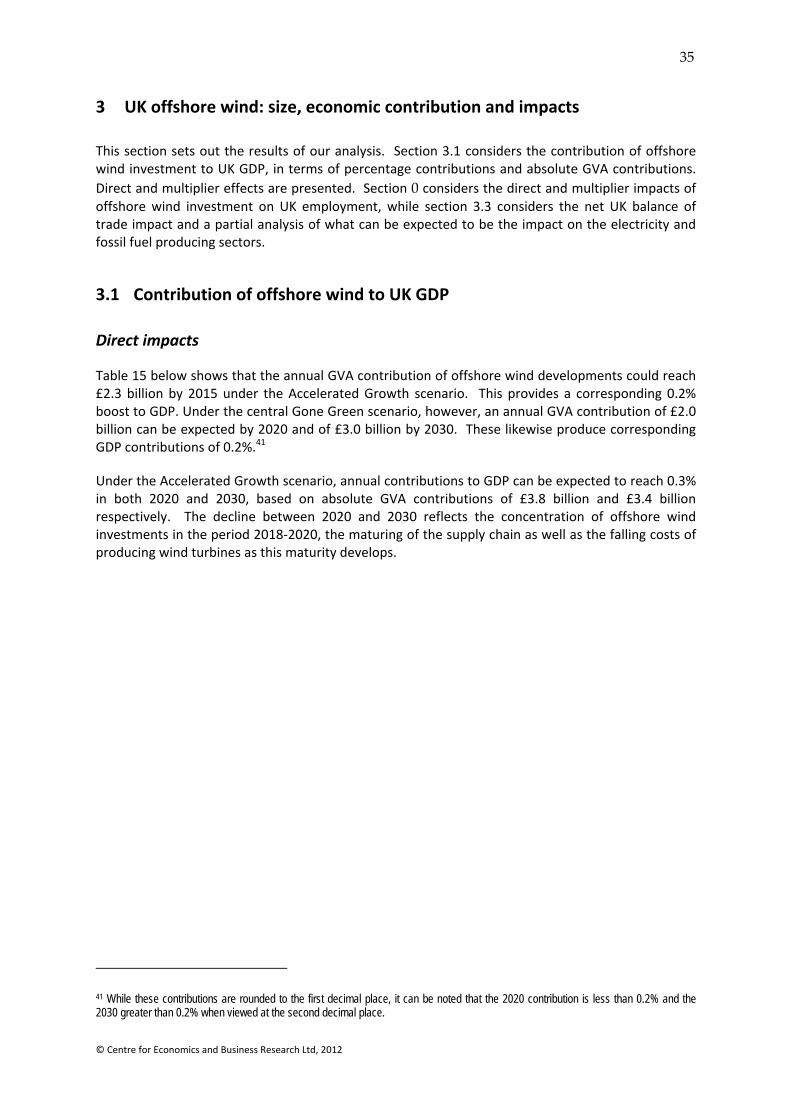
35
© Centre for Economics and Business Research Ltd, 2012
3 UK offshore wind: size, economic contribution and impacts
This section sets out the results of our analysis. Section 3.1 considers the contribution of offshore wind investment to UK GDP, in terms of percentage contributions and absolute GVA contributions. Direct and multiplier effects are presented. Section 0 considers the direct and multiplier impacts of offshore wind investment on UK employment, while section 3.3 considers the net UK balance of trade impact and a partial analysis of what can be expected to be the impact on the electricity and fossil fuel producing sectors.
3.1 Contribution of offshore wind to UK GDP
Direct impacts
Table 15 below shows that the annual GVA contribution of offshore wind developments could reach £2.3 billion by 2015 under the Accelerated Growth scenario. This provides a corresponding 0.2% boost to GDP. Under the central Gone Green scenario, however, an annual GVA contribution of £2.0 billion can be expected by 2020 and of £3.0 billion by 2030. These likewise produce corresponding GDP contributions of 0.2%.41
Under the Accelerated Growth scenario, annual contributions to GDP can be expected to reach 0.3% in both 2020 and 2030, based on absolute GVA contributions of £3.8 billion and £3.4 billion respectively. The decline between 2020 and 2030 reflects the concentration of offshore wind investments in the period 2018‐2020, the maturing of the supply chain as well as the falling costs of producing wind turbines as this maturity develops.
41 While these contributions are rounded to the first decimal place, it can be noted that the 2020 contribution is less than 0.2% and the 2030 greater than 0.2% when viewed at the second decimal place.
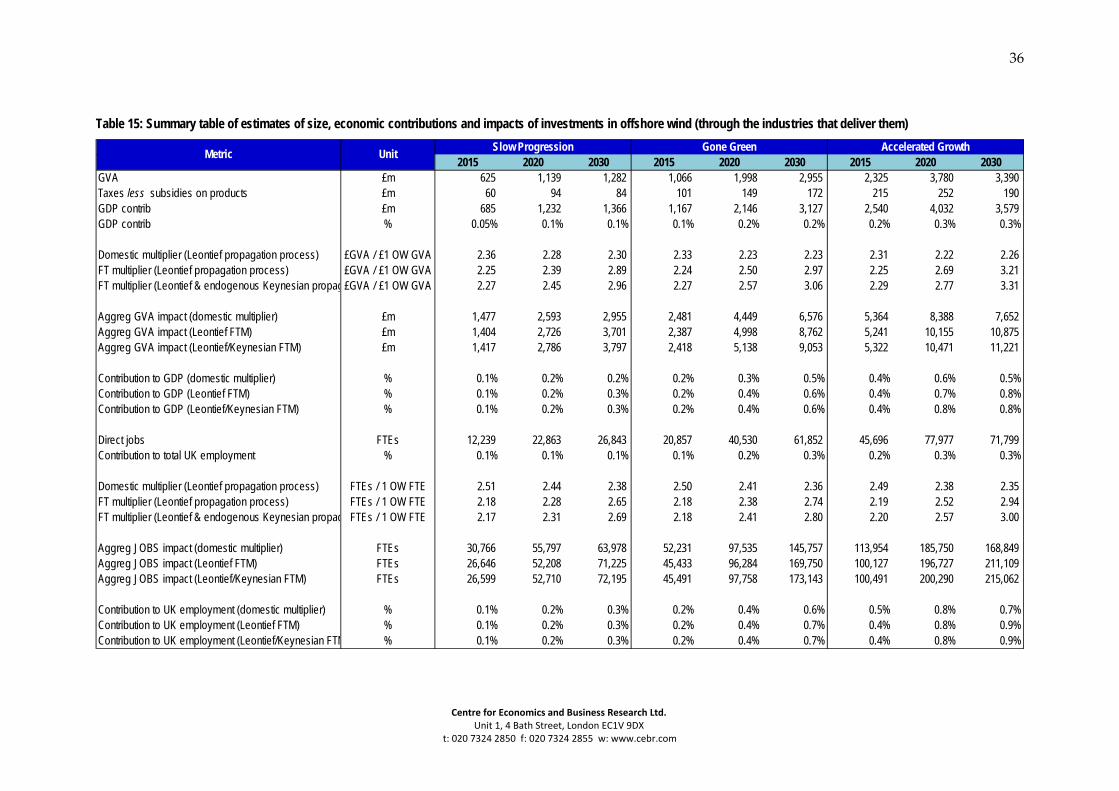
36
Centre for Economics and Business Research Ltd. Unit 1, 4 Bath Street, London EC1V 9DX
t: 020 7324 2850 f: 020 7324 2855 w: www.cebr.com
Table 15: Summary table of estimates of size, economic contributions and impacts of investments in offshore wind (through the industries that deliver them)
2015 2020 2030 2015 2020 2030 2015 2020 2030GVA £m 625 1,139 1,282 1,066 1,998 2,955 2,325 3,780 3,390 Taxes less subsidies on products £m 60 94 84 101 149 172 215 252 190 GDP contrib £m 685 1,232 1,366 1,167 2,146 3,127 2,540 4,032 3,579 GDP contrib % 0.05% 0.1% 0.1% 0.1% 0.2% 0.2% 0.2% 0.3% 0.3%
Domestic multiplier (Leontief propagation process) £GVA / £1 OW GVA 2.36 2.28 2.30 2.33 2.23 2.23 2.31 2.22 2.26 FT multiplier (Leontief propagation process) £GVA / £1 OW GVA 2.25 2.39 2.89 2.24 2.50 2.97 2.25 2.69 3.21 FT multiplier (Leontief & endogenous Keynesian propag£GVA / £1 OW GVA 2.27 2.45 2.96 2.27 2.57 3.06 2.29 2.77 3.31
Aggreg GVA impact (domestic multiplier) £m 1,477 2,593 2,955 2,481 4,449 6,576 5,364 8,388 7,652 Aggreg GVA impact (Leontief FTM) £m 1,404 2,726 3,701 2,387 4,998 8,762 5,241 10,155 10,875 Aggreg GVA impact (Leontief/Keynesian FTM) £m 1,417 2,786 3,797 2,418 5,138 9,053 5,322 10,471 11,221
Contribution to GDP (domestic multiplier) % 0.1% 0.2% 0.2% 0.2% 0.3% 0.5% 0.4% 0.6% 0.5%Contribution to GDP (Leontief FTM) % 0.1% 0.2% 0.3% 0.2% 0.4% 0.6% 0.4% 0.7% 0.8%Contribution to GDP (Leontief/Keynesian FTM) % 0.1% 0.2% 0.3% 0.2% 0.4% 0.6% 0.4% 0.8% 0.8%
Direct jobs FTEs 12,239 22,863 26,843 20,857 40,530 61,852 45,696 77,977 71,799 Contribution to total UK employment % 0.1% 0.1% 0.1% 0.1% 0.2% 0.3% 0.2% 0.3% 0.3%
Domestic multiplier (Leontief propagation process) FTEs / 1 OW FTE 2.51 2.44 2.38 2.50 2.41 2.36 2.49 2.38 2.35 FT multiplier (Leontief propagation process) FTEs / 1 OW FTE 2.18 2.28 2.65 2.18 2.38 2.74 2.19 2.52 2.94 FT multiplier (Leontief & endogenous Keynesian propag FTEs / 1 OW FTE 2.17 2.31 2.69 2.18 2.41 2.80 2.20 2.57 3.00
Aggreg JOBS impact (domestic multiplier) FTEs 30,766 55,797 63,978 52,231 97,535 145,757 113,954 185,750 168,849 Aggreg JOBS impact (Leontief FTM) FTEs 26,646 52,208 71,225 45,433 96,284 169,750 100,127 196,727 211,109 Aggreg JOBS impact (Leontief/Keynesian FTM) FTEs 26,599 52,710 72,195 45,491 97,758 173,143 100,491 200,290 215,062
Contribution to UK employment (domestic multiplier) % 0.1% 0.2% 0.3% 0.2% 0.4% 0.6% 0.5% 0.8% 0.7%Contribution to UK employment (Leontief FTM) % 0.1% 0.2% 0.3% 0.2% 0.4% 0.7% 0.4% 0.8% 0.9%Contribution to UK employment (Leontief/Keynesian FTM % 0.1% 0.2% 0.3% 0.2% 0.4% 0.7% 0.4% 0.8% 0.9%
Metric Unit Slow Progression Gone Green Accelerated Growth
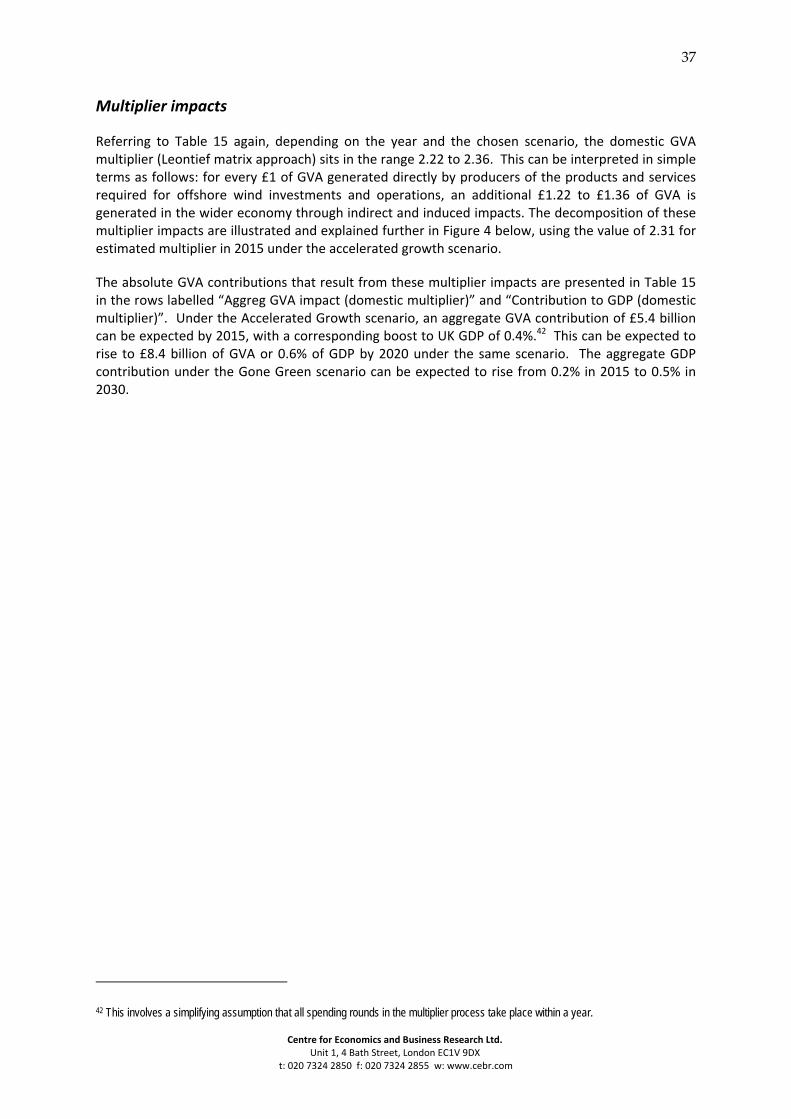
37
Centre for Economics and Business Research Ltd. Unit 1, 4 Bath Street, London EC1V 9DX
t: 020 7324 2850 f: 020 7324 2855 w: www.cebr.com
Multiplier impacts
Referring to Table 15 again, depending on the year and the chosen scenario, the domestic GVA multiplier (Leontief matrix approach) sits in the range 2.22 to 2.36. This can be interpreted in simple terms as follows: for every £1 of GVA generated directly by producers of the products and services required for offshore wind investments and operations, an additional £1.22 to £1.36 of GVA is generated in the wider economy through indirect and induced impacts. The decomposition of these multiplier impacts are illustrated and explained further in Figure 4 below, using the value of 2.31 for estimated multiplier in 2015 under the accelerated growth scenario.
The absolute GVA contributions that result from these multiplier impacts are presented in Table 15 in the rows labelled “Aggreg GVA impact (domestic multiplier)” and “Contribution to GDP (domestic multiplier)”. Under the Accelerated Growth scenario, an aggregate GVA contribution of £5.4 billion can be expected by 2015, with a corresponding boost to UK GDP of 0.4%.42 This can be expected to rise to £8.4 billion of GVA or 0.6% of GDP by 2020 under the same scenario. The aggregate GDP contribution under the Gone Green scenario can be expected to rise from 0.2% in 2015 to 0.5% in 2030.
42 This involves a simplifying assumption that all spending rounds in the multiplier process take place within a year.
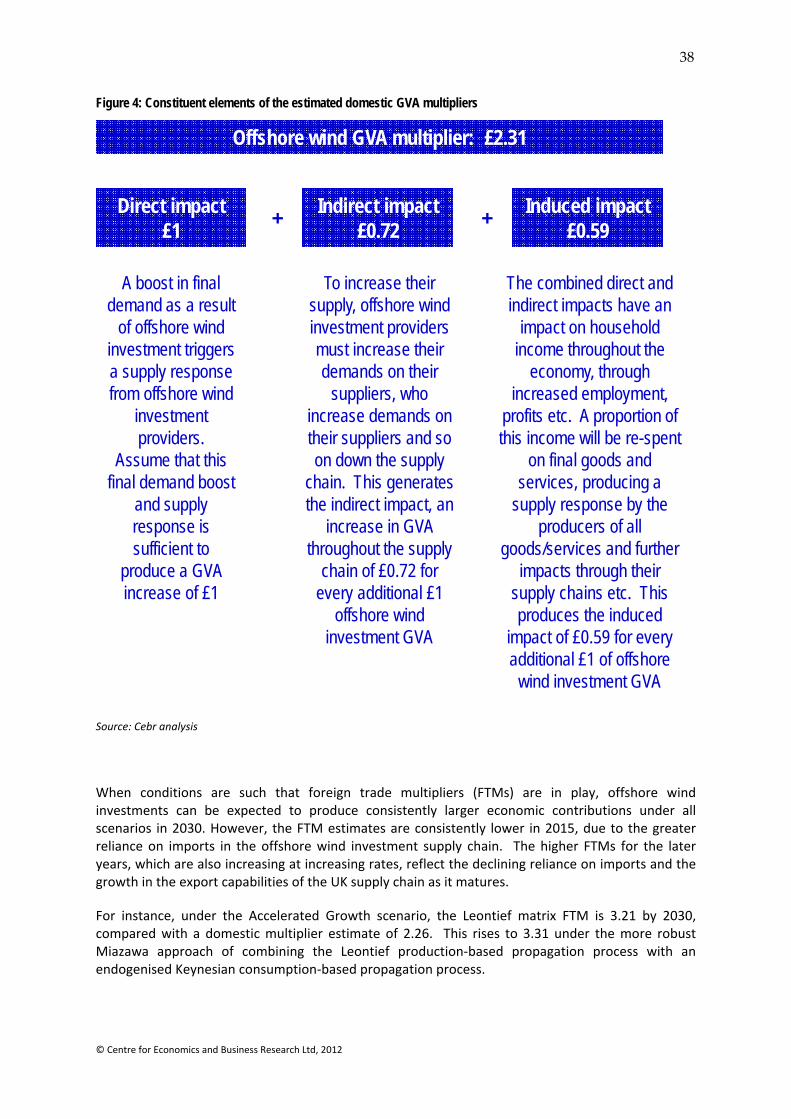
38
© Centre for Economics and Business Research Ltd, 2012
Figure 4: Constituent elements of the estimated domestic GVA multipliers
Source: Cebr analysis
When conditions are such that foreign trade multipliers (FTMs) are in play, offshore wind investments can be expected to produce consistently larger economic contributions under all scenarios in 2030. However, the FTM estimates are consistently lower in 2015, due to the greater reliance on imports in the offshore wind investment supply chain. The higher FTMs for the later years, which are also increasing at increasing rates, reflect the declining reliance on imports and the growth in the export capabilities of the UK supply chain as it matures.
For instance, under the Accelerated Growth scenario, the Leontief matrix FTM is 3.21 by 2030, compared with a domestic multiplier estimate of 2.26. This rises to 3.31 under the more robust Miazawa approach of combining the Leontief production‐based propagation process with an endogenised Keynesian consumption‐based propagation process.
Direct impact £1
Indirect impact £0.72
Induced impact £0.59
A boost in final demand as a result
of offshore wind investment triggers a supply response from offshore wind
investment providers.
Assume that this final demand boost
and supply response is sufficient to
produce a GVA increase of £1
+
To increase their supply, offshore wind investment providers must increase their demands on their
suppliers, who increase demands on their suppliers and so on down the supply
chain. This generates the indirect impact, an
increase in GVA throughout the supply
chain of £0.72 for every additional £1
offshore wind investment GVA
+
The combined direct and indirect impacts have an
impact on household income throughout the
economy, through increased employment,
profits etc. A proportion of this income will be re-spent
on final goods and services, producing a
supply response by the producers of all
goods/services and further impacts through their
supply chains etc. This produces the induced
impact of £0.59 for every additional £1 of offshore
wind investment GVA
Offshore wind GVA multiplier: £2.31
39
© Centre for Economics and Business Research Ltd, 2012
3.2 Contribution of offshore wind to UK employment
Direct impacts
Table 15 above also shows that the employment contribution of offshore wind developments could reach about 46 thousand full‐time equivalent jobs (FTEs) by 2015 under the Accelerated Growth scenario. This would constitute a 0.2% contribution to total UK employment.43 Under the central Gone Green scenario, however, the contribution can be expected to reach over 40 thousand FTE jobs by 2020 and almost 62 thousand by 2030. The latter would constitute a 0.3% contribution to total UK employment.
Under the Accelerated Growth scenarios, percentage contributions to UK employment can be expected to reach 0.3% in both 2020 and 2030, based on absolute FTE job numbers of 78 thousand and 72 thousand respectively.44 The decline between 2020 and 2030 reflects the same factors that resulted in the decline in forecasted GVA over the same period under the same scenario, namely the concentration of offshore wind investments in the period 2018‐2020 and the maturing of the supply chain.
Multiplier impacts
The domestic employment multiplier (Leontief matrix approach) sits in the range 2.35 to 2.51. This can interpreted in simple terms as follows: for every one FTE job generated directly by producers of the products and services required for offshore wind investments and operations, an additional 1.35 to 1.51 FTE jobs can be expected to be generated in the wider economy through indirect and induced impacts. The decomposition of this multiplier impact are illustrated and explained in the same manner as the GVA multiplier in Figure 5 below, using the value of 2.49 for estimated multiplier in 2015 under the accelerated growth scenario.
The absolute employment contributions that result from these multiplier impacts are presented in Table 15 in the rows labelled “Aggreg JOBS impact (domestic multiplier)” and “Contribution to UK employment (domestic multiplier)”. Under the Accelerated Growth scenario, an aggregate employment contribution of 114 thousand FTE jobs can be expected by 2015, with a corresponding boost to UK employment of 0.5%.45 This can be expected to rise to 186 thousand FTE jobs or 0.8% of total UK employment by 2020 under the same scenario. The aggregate employment contribution under the Gone Green scenario can be expected to rise from 0.2% in 2015 to 0.6% in 2030.
43 This is based on 2009 employment data. Given that unemployment has been rising since, this direct percentage contribution to UK employment can be expected to be slightly higher (at least when viewed at the second decimal place). 44 We note again that, while these contributions are rounded to the first decimal place, it can be noted that the 2020 contribution is greater than 0.3% and the 2030 less than 0.3% when viewed to the second decimal place. 45 This involves the same aforementioned simplifying assumption that all spending rounds in the multiplier process take place within a year.
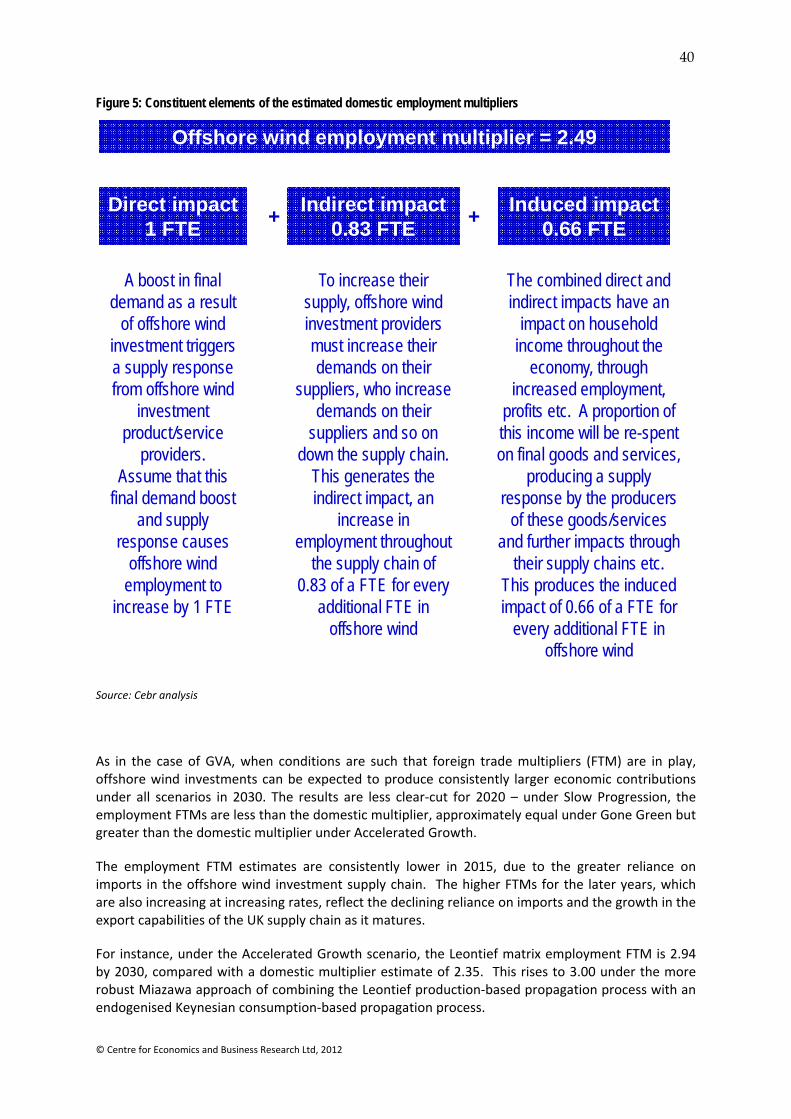
40
© Centre for Economics and Business Research Ltd, 2012
Figure 5: Constituent elements of the estimated domestic employment multipliers
Source: Cebr analysis
As in the case of GVA, when conditions are such that foreign trade multipliers (FTM) are in play, offshore wind investments can be expected to produce consistently larger economic contributions under all scenarios in 2030. The results are less clear‐cut for 2020 – under Slow Progression, the employment FTMs are less than the domestic multiplier, approximately equal under Gone Green but greater than the domestic multiplier under Accelerated Growth.
The employment FTM estimates are consistently lower in 2015, due to the greater reliance on imports in the offshore wind investment supply chain. The higher FTMs for the later years, which are also increasing at increasing rates, reflect the declining reliance on imports and the growth in the export capabilities of the UK supply chain as it matures.
For instance, under the Accelerated Growth scenario, the Leontief matrix employment FTM is 2.94 by 2030, compared with a domestic multiplier estimate of 2.35. This rises to 3.00 under the more robust Miazawa approach of combining the Leontief production‐based propagation process with an endogenised Keynesian consumption‐based propagation process.
Direct impact 1 FTE
Indirect impact 0.83 FTE
Induced impact 0.66 FTE
A boost in final demand as a result
of offshore wind investment triggers a supply response from offshore wind
investment product/service
providers. Assume that this
final demand boost and supply
response causes offshore wind
employment to increase by 1 FTE
+
To increase their supply, offshore wind investment providers must increase their demands on their
suppliers, who increase demands on their
suppliers and so on down the supply chain.
This generates the indirect impact, an
increase in employment throughout
the supply chain of 0.83 of a FTE for every
additional FTE in offshore wind
+
The combined direct and indirect impacts have an
impact on household income throughout the
economy, through increased employment,
profits etc. A proportion of this income will be re-spent on final goods and services,
producing a supply response by the producers
of these goods/services and further impacts through
their supply chains etc. This produces the induced impact of 0.66 of a FTE for
every additional FTE in offshore wind
Offshore wind employment multiplier = 2.49
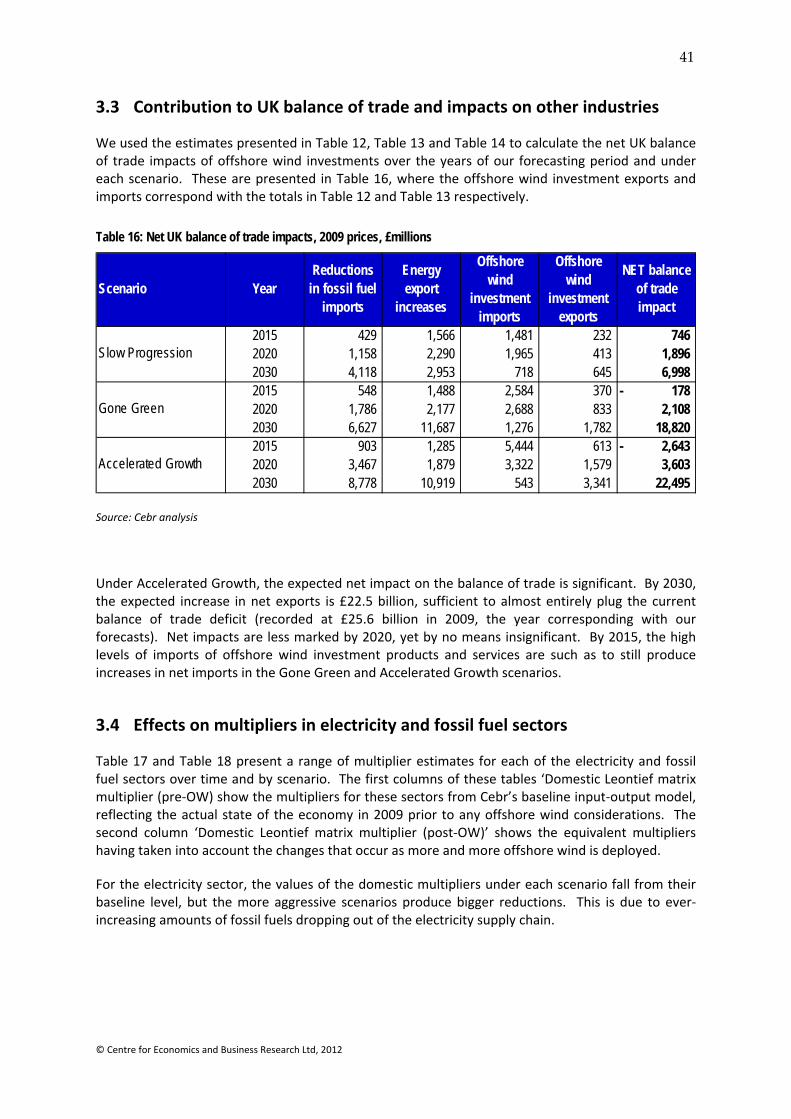
41
© Centre for Economics and Business Research Ltd, 2012
3.3 Contribution to UK balance of trade and impacts on other industries
We used the estimates presented in Table 12, Table 13 and Table 14 to calculate the net UK balance of trade impacts of offshore wind investments over the years of our forecasting period and under each scenario. These are presented in Table 16, where the offshore wind investment exports and imports correspond with the totals in Table 12 and Table 13 respectively.
Table 16: Net UK balance of trade impacts, 2009 prices, £millions
Source: Cebr analysis
Under Accelerated Growth, the expected net impact on the balance of trade is significant. By 2030, the expected increase in net exports is £22.5 billion, sufficient to almost entirely plug the current balance of trade deficit (recorded at £25.6 billion in 2009, the year corresponding with our forecasts). Net impacts are less marked by 2020, yet by no means insignificant. By 2015, the high levels of imports of offshore wind investment products and services are such as to still produce increases in net imports in the Gone Green and Accelerated Growth scenarios.
3.4 Effects on multipliers in electricity and fossil fuel sectors
Table 17 and Table 18 present a range of multiplier estimates for each of the electricity and fossil fuel sectors over time and by scenario. The first columns of these tables ‘Domestic Leontief matrix multiplier (pre‐OW) show the multipliers for these sectors from Cebr’s baseline input‐output model, reflecting the actual state of the economy in 2009 prior to any offshore wind considerations. The second column ‘Domestic Leontief matrix multiplier (post‐OW)’ shows the equivalent multipliers having taken into account the changes that occur as more and more offshore wind is deployed.
For the electricity sector, the values of the domestic multipliers under each scenario fall from their baseline level, but the more aggressive scenarios produce bigger reductions. This is due to ever‐increasing amounts of fossil fuels dropping out of the electricity supply chain.
Scenario YearReductions
in fossil fuel imports
Energy export
increases
Offshore wind
investment imports
Offshore wind
investment exports
NET balance of trade impact
2015 429 1,566 1,481 232 746 2020 1,158 2,290 1,965 413 1,896 2030 4,118 2,953 718 645 6,998 2015 548 1,488 2,584 370 178- 2020 1,786 2,177 2,688 833 2,108 2030 6,627 11,687 1,276 1,782 18,820 2015 903 1,285 5,444 613 2,643- 2020 3,467 1,879 3,322 1,579 3,603 2030 8,778 10,919 543 3,341 22,495
Slow Progression
Gone Green
Accelerated Growth
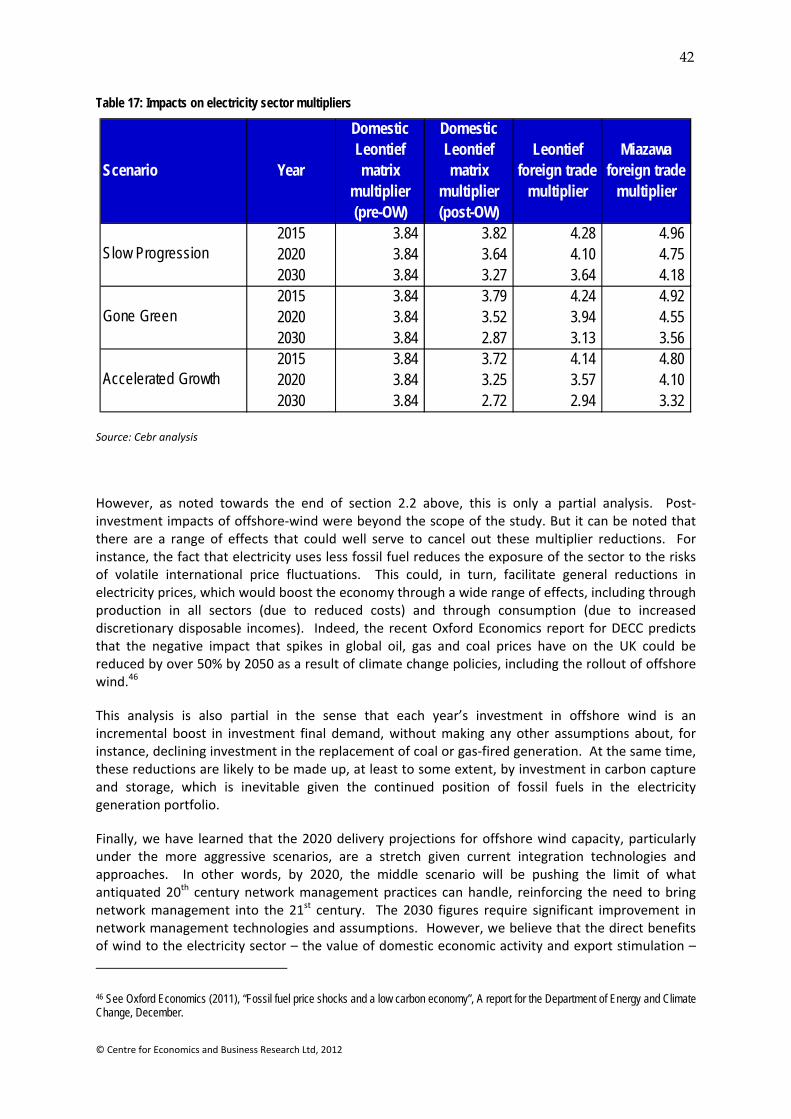
42
© Centre for Economics and Business Research Ltd, 2012
Table 17: Impacts on electricity sector multipliers
Source: Cebr analysis
However, as noted towards the end of section 2.2 above, this is only a partial analysis. Post‐investment impacts of offshore‐wind were beyond the scope of the study. But it can be noted that there are a range of effects that could well serve to cancel out these multiplier reductions. For instance, the fact that electricity uses less fossil fuel reduces the exposure of the sector to the risks of volatile international price fluctuations. This could, in turn, facilitate general reductions in electricity prices, which would boost the economy through a wide range of effects, including through production in all sectors (due to reduced costs) and through consumption (due to increased discretionary disposable incomes). Indeed, the recent Oxford Economics report for DECC predicts that the negative impact that spikes in global oil, gas and coal prices have on the UK could be reduced by over 50% by 2050 as a result of climate change policies, including the rollout of offshore wind.46
This analysis is also partial in the sense that each year’s investment in offshore wind is an incremental boost in investment final demand, without making any other assumptions about, for instance, declining investment in the replacement of coal or gas‐fired generation. At the same time, these reductions are likely to be made up, at least to some extent, by investment in carbon capture and storage, which is inevitable given the continued position of fossil fuels in the electricity generation portfolio.
Finally, we have learned that the 2020 delivery projections for offshore wind capacity, particularly under the more aggressive scenarios, are a stretch given current integration technologies and approaches. In other words, by 2020, the middle scenario will be pushing the limit of what antiquated 20th century network management practices can handle, reinforcing the need to bring network management into the 21st century. The 2030 figures require significant improvement in network management technologies and assumptions. However, we believe that the direct benefits of wind to the electricity sector – the value of domestic economic activity and export stimulation –
46 See Oxford Economics (2011), “Fossil fuel price shocks and a low carbon economy”, A report for the Department of Energy and Climate Change, December.
Scenario Year
Domestic Leontief matrix
multiplier (pre-OW)
Domestic Leontief matrix
multiplier (post-OW)
Leontief foreign trade
multiplier
Miazawa foreign trade
multiplier
2015 3.84 3.82 4.28 4.96 2020 3.84 3.64 4.10 4.75 2030 3.84 3.27 3.64 4.18 2015 3.84 3.79 4.24 4.92 2020 3.84 3.52 3.94 4.55 2030 3.84 2.87 3.13 3.56 2015 3.84 3.72 4.14 4.80 2020 3.84 3.25 3.57 4.10 2030 3.84 2.72 2.94 3.32
Slow Progression
Gone Green
Accelerated Growth
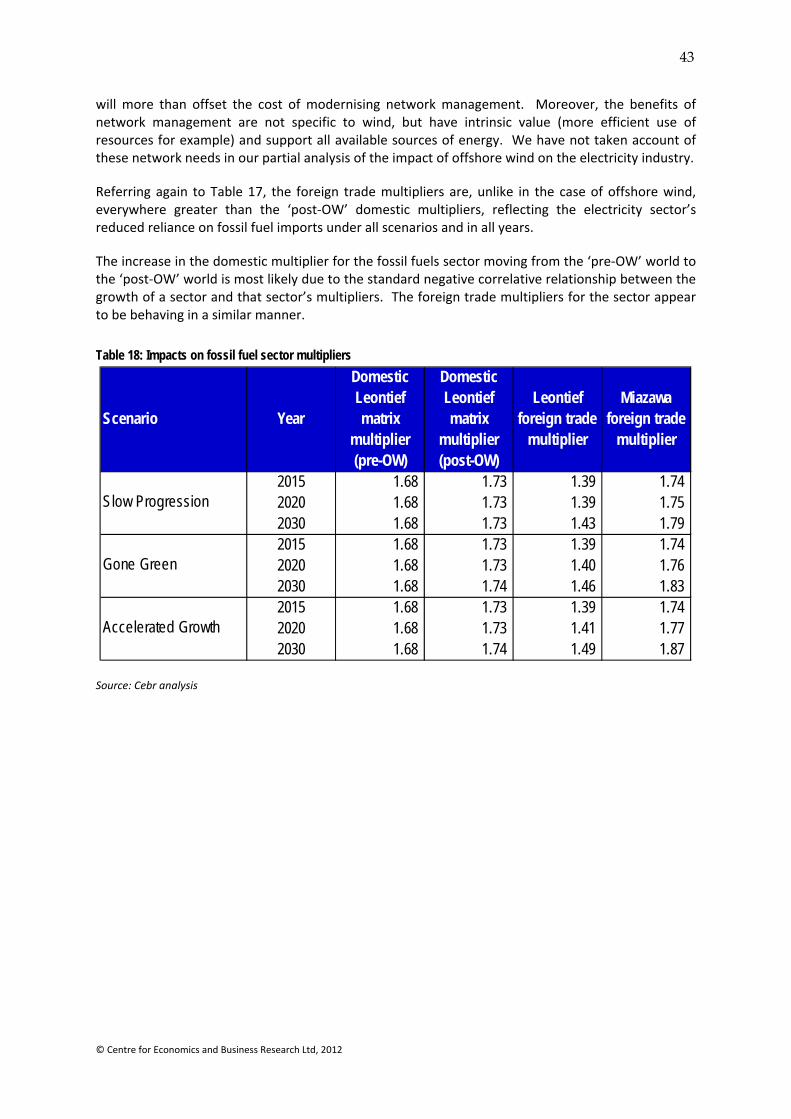
43
© Centre for Economics and Business Research Ltd, 2012
will more than offset the cost of modernising network management. Moreover, the benefits of network management are not specific to wind, but have intrinsic value (more efficient use of resources for example) and support all available sources of energy. We have not taken account of these network needs in our partial analysis of the impact of offshore wind on the electricity industry.
Referring again to Table 17, the foreign trade multipliers are, unlike in the case of offshore wind, everywhere greater than the ‘post‐OW’ domestic multipliers, reflecting the electricity sector’s reduced reliance on fossil fuel imports under all scenarios and in all years.
The increase in the domestic multiplier for the fossil fuels sector moving from the ‘pre‐OW’ world to the ‘post‐OW’ world is most likely due to the standard negative correlative relationship between the growth of a sector and that sector’s multipliers. The foreign trade multipliers for the sector appear to be behaving in a similar manner.
Table 18: Impacts on fossil fuel sector multipliers
Source: Cebr analysis
Scenario Year
Domestic Leontief matrix
multiplier (pre-OW)
Domestic Leontief matrix
multiplier (post-OW)
Leontief foreign trade
multiplier
Miazawa foreign trade
multiplier
2015 1.68 1.73 1.39 1.74 2020 1.68 1.73 1.39 1.75 2030 1.68 1.73 1.43 1.79 2015 1.68 1.73 1.39 1.74 2020 1.68 1.73 1.40 1.76 2030 1.68 1.74 1.46 1.83 2015 1.68 1.73 1.39 1.74 2020 1.68 1.73 1.41 1.77 2030 1.68 1.74 1.49 1.87
Slow Progression
Gone Green
Accelerated Growth
44
© Centre for Economics and Business Research Ltd, 2012
4 Conclusions and next steps
This report constitutes one element of an ongoing research project that moves beyond existing research. The three areas of the research establish the basic pillars on which UK policy toward offshore wind should be built for the long‐term. As a whole, the research project provides a comprehensive, integrated analysis of the prospects for long‐term development of offshore wind resources and presents evidence suggesting that the UK should rely on a substantial contribution from offshore wind in the medium to long term. The three areas of research, of which this report forms one part, are as follows:
1. Using an investment portfolio approach, the research shows that offshore wind is a very attractive investment to include in a diversified, low carbon generation resource portfolio. Including a substantial amount of offshore wind can help in the achievement of the long‐term goals of the electricity sector by lowering risk in the mid‐term and cost in the long‐term.47
2. From the point of view of growing the economy in the 21st century, the research shows that offshore wind provides an attractive opportunity for the UK to take a leadership role, expand output and promote regional and global exports in a sector that is destined to play an increasingly important part in the global economy. Offshore wind is an important technological investment that will expand the UK economy in the decarbonised global economy of the 21st century. These issues related to the direct and wider economic impacts of offshore wind were the subject of this report by Cebr.
3. From the point of view of implementation, the research project will identify the obstacles to achieving these positive results and describes the steps necessary to overcome them. There are effective policies that can be implemented in the near and mid‐term that would drive the sector and the economy forward.
In short, the project builds on earlier analyses of the long‐term role of renewables to show that a substantial expansion of offshore wind generation is feasible (technologically), beneficial (economically), efficient (in resource utilisation) and administratively practicable. One of the most important conclusions is that the sooner policy is put in place to expand the role of offshore wind in the UK electricity sector and economy, the smoother the transition to a low carbon economy will be, the lower its cost and the bigger the economic benefits can be expected to be.
This Cebr report shows that the net economic benefit to UK plc from investment in offshore wind, both in terms of contribution to GDP, employment and to the country’s balance of trade is considerable. Mark Cooper, in his forthcoming paper, will show that in addition to these effects, the risk reduction to the UK electricity system provided by offshore wind will deliver further savings and wider economic and policy benefits.
47 This is the subject of the forthcoming part of the study by Mark Cooper, Senior Fellow for Economic Analysis, Institute for Energy and the Environment, Vermont Law School.