red hat openstack platform 13 監視ツール設定ガイド · fluentd...
TRANSCRIPT

Red Hat OpenStack Platform 13
監視ツール設定ガイド
OpenStack のロギングおよび監視ツールについてのガイド
Last Updated: 2020-05-14


Red Hat OpenStack Platform 13 監視ツール設定ガイド
OpenStack のロギングおよび監視ツールについてのガイド
OpenStack [email protected]

法律上の通知法律上の通知
Copyright © 2020 Red Hat, Inc.
The text of and illustrations in this document are licensed by Red Hat under a Creative CommonsAttribution–Share Alike 3.0 Unported license ("CC-BY-SA"). An explanation of CC-BY-SA isavailable athttp://creativecommons.org/licenses/by-sa/3.0/. In accordance with CC-BY-SA, if you distribute this document or an adaptation of it, you mustprovide the URL for the original version.
Red Hat, as the licensor of this document, waives the right to enforce, and agrees not to assert,Section 4d of CC-BY-SA to the fullest extent permitted by applicable law.
Red Hat, Red Hat Enterprise Linux, the Shadowman logo, the Red Hat logo, JBoss, OpenShift,Fedora, the Infinity logo, and RHCE are trademarks of Red Hat, Inc., registered in the United Statesand other countries.
Linux ® is the registered trademark of Linus Torvalds in the United States and other countries.
Java ® is a registered trademark of Oracle and/or its affiliates.
XFS ® is a trademark of Silicon Graphics International Corp. or its subsidiaries in the United Statesand/or other countries.
MySQL ® is a registered trademark of MySQL AB in the United States, the European Union andother countries.
Node.js ® is an official trademark of Joyent. Red Hat is not formally related to or endorsed by theofficial Joyent Node.js open source or commercial project.
The OpenStack ® Word Mark and OpenStack logo are either registered trademarks/service marksor trademarks/service marks of the OpenStack Foundation, in the United States and othercountries and are used with the OpenStack Foundation's permission. We are not affiliated with,endorsed or sponsored by the OpenStack Foundation, or the OpenStack community.
All other trademarks are the property of their respective owners.
概要概要
本ガイドでは、Red Hat OpenStack Platform 環境でのロギングと監視の設定方法について説明します。

. . . . . . . . . . . . . . . . . . . . . . . . . . . . . . . . . . . . . . . . . . . . . . . . . . . . . . . . . . . . . . . . . . . . . . . . . . . . . . . . . . . . . . . . . . . . . . . . . . . . . . . . . . . . . . . . . . . . . . . . . . . . . . . . . . . . . . . . . . . . . . . . . . . . . . . . . . . . . . . . . . . . . . . . . . . . . . . . . . . . . . . . . . . . . . . . . . . . . . . . . . . . . . . . . . . . . . . . . . . . . . . . . . . . . . . . . . . . . . . . . . . . . . . . . . . . . . . . . . . . . . . . . . . . . . . . . . . . . . . .
. . . . . . . . . . . . . . . . . . . . . . . . . . . . . . . . . . . . . . . . . . . . . . . . . . . . . . . . . . . . . . . . . . . . . . . . . . . . . . . . . . . . . . . . . . . . . . . . . . . . . . . . . . . . . . . . . . . . . . . . . . . . . . . . . . . . . . . . . . . . . . . . . . . . . . . . . . . . . . . . . . . . . . . . . . . . . . . . . . . . . . . . . . . . . . . . . . . . . . . . . . . . . . . . . . . . . . . . . . . . . . . . . . . . . . . . . . . . . . . . . . . . . . . . . . . . . . . . . . . . . . . . . . . . . . . . . . . . . . . .
. . . . . . . . . . . . . . . . . . . . . . . . . . . . . . . . . . . . . . . . . . . . . . . . . . . . . . . . . . . . . . . . . . . . . . . . . . . . . . . . . . . . . . . . . . . . . . . . . . . . . . . . . . . . . . . . . . . . . . . . . . . . . . . . . . . . . . . . . . . . . . . . . . . . . . . . . . . . . . . . . . . . . . . . . . . . . . . . . . . . . . . . . . . . . . . . . . . . . . . . . . . . . . . . . . . . . . . . . . . . . . . . . . . . . . . . . . . . . . . . . . . . . . . . . . . . . . . . . . . . . . . . . . . . . . . . . . . . . . . .
. . . . . . . . . . . . . . . . . . . . . . . . . . . . . . . . . . . . . . . . . . . . . . . . . . . . . . . . . . . . . . . . . . . . . . . . . . . . . . . . . . . . . . . . . . . . . . . . . . . . . . . . . . . . . . . . . . . . . . . . . . . . . . . . . . . . . . . . . . . . . . . . . . . . . . . . . . . . . . . . . . . . . . . . . . . . . . . . . . . . . . . . . . . . . . . . . . . . . . . . . . . . . . . . . . . . . . . . . . . . . . . . . . . . . . . . . . . . . . . . . . . . . . . . . . . . . . . . . . . . . . . . . . . . . . . . . . . . . . . .
. . . . . . . . . . . . . . . . . . . . . . . . . . . . . . . . . . . . . . . . . . . . . . . . . . . . . . . . . . . . . . . . . . . . . . . . . . . . . . . . . . . . . . . . . . . . . . . . . . . . . . . . . . . . . . . . . . . . . . . . . . . . . . . . . . . . . . . . . . . . . . . . . . . . . . . . . . . . . . . . . . . . . . . . . . . . . . . . . . . . . . . . . . . . . . . . . . . . . . . . . . . . . . . . . . . . . . . . . . . . . . . . . . . . . . . . . . . . . . . . . . . . . . . . . . . . . . . . . . . . . . . . . . . . . . . . . . . . . . . .
. . . . . . . . . . . . . . . . . . . . . . . . . . . . . . . . . . . . . . . . . . . . . . . . . . . . . . . . . . . . . . . . . . . . . . . . . . . . . . . . . . . . . . . . . . . . . . . . . . . . . . . . . . . . . . . . . . . . . . . . . . . . . . . . . . . . . . . . . . . . . . . . . . . . . . . . . . . . . . . . . . . . . . . . . . . . . . . . . . . . . . . . . . . . . . . . . . . . . . . . . . . . . . . . . . . . . . . . . . . . . . . . . . . . . . . . . . . . . . . . . . . . . . . . . . . . . . . . . . . . . . . . . . . . . . . . . . . . . . . .
. . . . . . . . . . . . . . . . . . . . . . . . . . . . . . . . . . . . . . . . . . . . . . . . . . . . . . . . . . . . . . . . . . . . . . . . . . . . . . . . . . . . . . . . . . . . . . . . . . . . . . . . . . . . . . . . . . . . . . . . . . . . . . . . . . . . . . . . . . . . . . . . . . . . . . . . . . . . . . . . . . . . . . . . . . . . . . . . . . . . . . . . . . . . . . . . . . . . . . . . . . . . . . . . . . . . . . . . . . . . . . . . . . . . . . . . . . . . . . . . . . . . . . . . . . . . . . . . . . . . . . . . . . . . . . . . . . . . . . . .
. . . . . . . . . . . . . . . . . . . . . . . . . . . . . . . . . . . . . . . . . . . . . . . . . . . . . . . . . . . . . . . . . . . . . . . . . . . . . . . . . . . . . . . . . . . . . . . . . . . . . . . . . . . . . . . . . . . . . . . . . . . . . . . . . . . . . . . . . . . . . . . . . . . . . . . . . . . . . . . . . . . . . . . . . . . . . . . . . . . . . . . . . . . . . . . . . . . . . . . . . . . . . . . . . . . . . . . . . . . . . . . . . . . . . . . . . . . . . . . . . . . . . . . . . . . . . . . . . . . . . . . . . . . . . . . . . . . . . . . .
. . . . . . . . . . . . . . . . . . . . . . . . . . . . . . . . . . . . . . . . . . . . . . . . . . . . . . . . . . . . . . . . . . . . . . . . . . . . . . . . . . . . . . . . . . . . . . . . . . . . . . . . . . . . . . . . . . . . . . . . . . . . . . . . . . . . . . . . . . . . . . . . . . . . . . . . . . . . . . . . . . . . . . . . . . . . . . . . . . . . . . . . . . . . . . . . . . . . . . . . . . . . . . . . . . . . . . . . . . . . . . . . . . . . . . . . . . . . . . . . . . . . . . . . . . . . . . . . . . . . . . . . . . . . . . . . . . . . . . . .
目次目次
第第1章章 はじめにはじめに
第第2章章 アーキテクチャーアーキテクチャー2.1. 集中ロギング2.2. 可用性監視
第第3章章 クライアント側のツールのインストールクライアント側のツールのインストール3.1. 集中ロギングのクライアントパラメーターの設定3.2. 可用性監視クライアントパラメーターの設定3.3. パフォーマンス監視クライアントパラメーターの設定3.4. COLLECTD プラグイン3.5. オーバークラウドノードへの運用ツールのインストール3.6. ロギングデータのフィルタリングおよび変換
第第4章章 サーバー側のコンポーネントのインストールサーバー側のコンポーネントのインストール
第第5章章 OPENSTACK PLATFORM の監視の監視
第第6章章 SENSU クライアントインストールの検証クライアントインストールの検証
第第7章章 ノードの状態の確認ノードの状態の確認
第第8章章 OPENSTACK サービスの状態の確認サービスの状態の確認
付録付録A COLLECTD プラグインおよびプラグインおよび PUPPET ベースの設定ベースの設定
3
447
111111
12131313
15
16
17
18
19
20
目次目次
1

Red Hat OpenStack Platform 13 監視ツール設定ガイド監視ツール設定ガイド
2

第1章 はじめに監視ツールは、オペレーターが OpenStack 環境を維持管理するのに役立つオプションのツールセットです。これらのツールは、以下の機能を果たします。
集中ロギング: OpenStack 環境の全コンポーネントからのログを 1 つの場所に収集することができます。すべてのノードとサービスにわたって問題を特定することができます。また、オプションで Red Hat にログデータをエクスポートして、問題を診断するサポートを受けることもできます。
可用性監視: OpenStack 環境内の全コンポーネントを監視して、いずれかのコンポーネントが現在停止中または機能していない状態かどうかを判断します。また、問題が特定された時にシステムが警告を送信するように設定することも可能です。
第第1章章 はじめにはじめに
3

第2章 アーキテクチャー監視ツールは、クライアントが Red Hat OpenStack Platform オーバークラウドノードにデプロイされる、クライアント/サーバーモデルを使用します。Fluentd サービスがクライアント側の集中ロギング(CL) を提供し、Sensu クライアントサービスがクライアント側の可用性監視 (AM) を提供します。
2.1. 集中ロギング
集中ロギングにより、OpenStack 環境全体にわたるログを一箇所で確認することができます。これらのログは、syslog や audit ログファイルなどのオペレーティングシステム、RabbitMQ や MariaDB などのインフラストラクチャーコンポーネント、Identity や Compute などの OpenStack サービスから収集されます。
集中ロギングのツールチェーンは、以下のような複数のコンポーネントで構成されます。
ログ収集エージェント (Fluentd)
ログリレー/トランスフォーマー (Fluentd)
データストア (Elasticsearch)
API/プレゼンテーション層 (Kibana)
注記注記
director は、集中ロギング向けのサーバー側のコンポーネントはデプロイしません。RedHat では、ログアグリゲーターとして実行するプラグインを使用する Elasticsearch データベース、Kibana、Fluentd などのサーバー側のコンポーネントはサポートしていません。
以下の図は、集中ロギングのコンポーネントとそれらの対話を示しています。
注記注記
青で示した項目は Red Hat のサポート対象コンポーネントです。
図図2.1 集中ロギングのハイレベルアーキテクチャー集中ロギングのハイレベルアーキテクチャー
Red Hat OpenStack Platform 13 監視ツール設定ガイド監視ツール設定ガイド
4

図図2.1 集中ロギングのハイレベルアーキテクチャー集中ロギングのハイレベルアーキテクチャー
図図2.2 Red Hat OpenStack Platform の単一ノードデプロイメントの単一ノードデプロイメント
第第2章章 アーキテクチャーアーキテクチャー
5

図図2.2 Red Hat OpenStack Platform の単一ノードデプロイメントの単一ノードデプロイメント
図図2.3 Red Hat OpenStack Platform のの HA デプロイメントデプロイメント
Red Hat OpenStack Platform 13 監視ツール設定ガイド監視ツール設定ガイド
6

図図2.3 Red Hat OpenStack Platform のの HA デプロイメントデプロイメント
2.2. 可用性監視
可用性監視により、OpenStack 環境全体にわたる全コンポーネントのハイレベルな機能性を一元的に監視することができます。
可用性監視のツールチェーンは、以下を含む複数のコンポーネントで構成されます。
監視エージェント (Sensu クライアント)
監視リレー/プロキシー (RabbitMQ)
監視コントローラー/サーバー (Sensu サーバー)
API/プレゼンテーション層 (Uchiwa)
注記注記
director はサーバー側の可用性監視のコンポーネントはデプロイしません。Red Hat では、Uchiwa、Sensu Server、Sensu API + RabbitMQ、監視ノードを実行する Redis インスタンスなどのサーバー側のコンポーネントはサポートしていません。
以下の図は、可用性監視のコンポーネントとそれらの対話を示しています。
注記注記
青で示した項目は Red Hat のサポート対象コンポーネントです。
第第2章章 アーキテクチャーアーキテクチャー
7

図図2.4 可用性監視のハイレベルアーキテクチャー可用性監視のハイレベルアーキテクチャー
図図2.5 Red Hat OpenStack Platform の単一ノードデプロイメントの単一ノードデプロイメント
Red Hat OpenStack Platform 13 監視ツール設定ガイド監視ツール設定ガイド
8

図図2.5 Red Hat OpenStack Platform の単一ノードデプロイメントの単一ノードデプロイメント
図図2.6 Red Hat OpenStack Platform のの HA デプロイメントデプロイメント
第第2章章 アーキテクチャーアーキテクチャー
9

図図2.6 Red Hat OpenStack Platform のの HA デプロイメントデプロイメント
Red Hat OpenStack Platform 13 監視ツール設定ガイド監視ツール設定ガイド
10

第3章 クライアント側のツールのインストールオーバークラウドをデプロイする前には、各クライアントに適用する構成の設定を決定する必要があります。director の Heat テンプレートコレクションからサンプルの環境ファイルをコピーし、ご使用の環境に応じてファイルを変更します。
3.1. 集中ロギングのクライアントパラメーターの設定
Fluentd の構成設定には、/usr/share/openstack-tripleo-heat-templates/environments/logging-environment.yaml をコピーし、ご使用の環境に応じてファイルを変更します。以下に例を示します。
簡易設定簡易設定
resource_registry: OS::TripleO::Services::Fluentd: ../docker/services/fluentd.yaml
parameter_defaults: LoggingServers: - host: log0.example.com port: 24224 - host: log1.example.com port: 24224
SSL の設定例の設定例
## (note the use of port 24284 for ssl connections)
resource_registry: OS::TripleO::Services::Fluentd: ../docker/services/fluentd.yaml
parameter_defaults: LoggingServers: - host: 192.0.2.11 port: 24284 LoggingUsesSSL: true LoggingSharedKey: secret LoggingSSLCertificate: | -----BEGIN CERTIFICATE----- ...certificate data here... -----END CERTIFICATE-----
LoggingServers: Fluentd ログメッセージの受信先のシステム
LoggingUsesSSL: ログメッセージの転送時にsecure_forward を使用するかどうかを決定する
LoggingSharedKey: secure_forward が使用する共有シークレット
LoggingSSLCertificate: PEM エンコードされた SSL CA 証明書の内容
3.2. 可用性監視クライアントパラメーターの設定
Sensu クライアントの構成設定には、/usr/share/openstack-tripleo-heat-templates/environments/monitoring-environment.yaml をコピーし、ご使用の環境に応じてファイルを変更します。以下に例を示します。
第第3章章 クライアント側のツールのインストールクライアント側のツールのインストール
11

resource_registry: OS::TripleO::Services::SensuClient: ../docker/services/sensu-client.yaml
parameter_defaults: MonitoringRabbitHost: 10.10.10.10 MonitoringRabbitPort: 5672 MonitoringRabbitUserName: sensu MonitoringRabbitPassword: sensu MonitoringRabbitUseSSL: true MonitoringRabbitVhost: "/sensu" SensuClientCustomConfig: api: warning: 10 critical: 20
MonitoringRabbit: 監視サーバーで実行する RabbitMQ インスタンスに Sensu クライアントサービスを接続します。
MonitoringRabbitUseSSL: RabbitMQ クライアント向けに SSL を有効化します。以下のパラメーターで秘密鍵または証明書チェーンが指定されていない場合には、SSL トランスポートを使用します。
MonitoringRabbitSSLPrivateKey: 秘密鍵ファイルへのパスを定義します。または、そのファイルのコンテンツを含めることができます。
MonitoringRabbitSSLCertChain: 使用するプライベート SSL 証明書チェーンを定義します。
SensuClientCustomConfig: Sensu クライアントの追加の設定を指定します。ユーザー名/パスワード、auth_url、テナント、リージョンを含む OpenStack の認証情報を定義します。
3.3. パフォーマンス監視クライアントパラメーターの設定
パフォーマンス監視は、定期的にシステム情報を収集し、データ収集エージェントを使用してさまざまな方法で値を保管し、監視するメカニズムを提供します。Red Hat は、collectd デーモンをコレクションエージェントとしてサポートします。このデーモンは、データを時系列データベースに保管します。Red Hat がサポートするデータベースの 1 つは Gnocchi と呼ばれます。この保管されたデータを使用して、システムの監視、パフォーマンスのボトルネックの特定、将来のシステム負荷の予測を行うことができます。
注記注記
Red Hat OpenStack Platform は、クライアント側でのみパフォーマンスの監視をサポートします。
collectd を設定するには、以下を実行します。
1. /usr/share/openstack-tripleo-heat-templates/environments/metrics/collectd-standalone.yaml ファイルをローカルディレクトリーにコピーします。ファイルを開き、以下のパラメーターを設定して、CollectdExtraPlugins 配下に必要なプラグインを一覧表示します。ExtraConfig セクションにパラメーターを指定することもできます。
parameter_defaults: CollectdExtraPlugins: - disk - df
Red Hat OpenStack Platform 13 監視ツール設定ガイド監視ツール設定ガイド
12
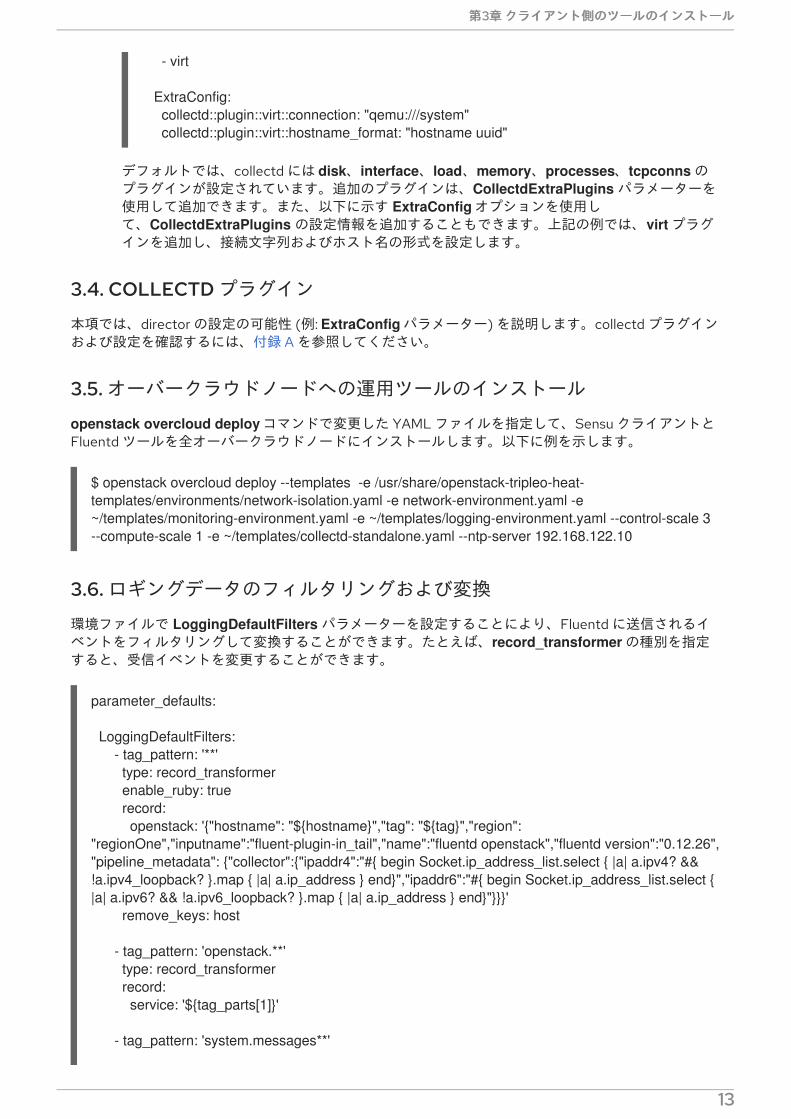
- virt
ExtraConfig: collectd::plugin::virt::connection: "qemu:///system" collectd::plugin::virt::hostname_format: "hostname uuid"
デフォルトでは、collectd には disk、interface、load、memory、processes、tcpconns のプラグインが設定されています。追加のプラグインは、CollectdExtraPlugins パラメーターを使用して追加できます。また、以下に示す ExtraConfig オプションを使用して、CollectdExtraPlugins の設定情報を追加することもできます。上記の例では、virt プラグインを追加し、接続文字列およびホスト名の形式を設定します。
3.4. COLLECTD プラグイン
本項では、director の設定の可能性 (例: ExtraConfig パラメーター) を説明します。collectd プラグインおよび設定を確認するには、付録 A を参照してください。
3.5. オーバークラウドノードへの運用ツールのインストール
openstack overcloud deploy コマンドで変更した YAML ファイルを指定して、Sensu クライアントとFluentd ツールを全オーバークラウドノードにインストールします。以下に例を示します。
$ openstack overcloud deploy --templates -e /usr/share/openstack-tripleo-heat-templates/environments/network-isolation.yaml -e network-environment.yaml -e ~/templates/monitoring-environment.yaml -e ~/templates/logging-environment.yaml --control-scale 3 --compute-scale 1 -e ~/templates/collectd-standalone.yaml --ntp-server 192.168.122.10
3.6. ロギングデータのフィルタリングおよび変換
環境ファイルで LoggingDefaultFilters パラメーターを設定することにより、Fluentd に送信されるイベントをフィルタリングして変換することができます。たとえば、record_transformer の種別を指定すると、受信イベントを変更することができます。
parameter_defaults:
LoggingDefaultFilters: - tag_pattern: '**' type: record_transformer enable_ruby: true record: openstack: '{"hostname": "${hostname}","tag": "${tag}","region": "regionOne","inputname":"fluent-plugin-in_tail","name":"fluentd openstack","fluentd version":"0.12.26", "pipeline_metadata": {"collector":{"ipaddr4":"#{ begin Socket.ip_address_list.select { |a| a.ipv4? && !a.ipv4_loopback? }.map { |a| a.ip_address } end}","ipaddr6":"#{ begin Socket.ip_address_list.select { |a| a.ipv6? && !a.ipv6_loopback? }.map { |a| a.ip_address } end}"}}}' remove_keys: host
- tag_pattern: 'openstack.**' type: record_transformer record: service: '${tag_parts[1]}'
- tag_pattern: 'system.messages**'
第第3章章 クライアント側のツールのインストールクライアント側のツールのインストール
13

type: record_transformer enable_ruby: true record: openstack: '{"info": "${record[''message'']}", "systemd":{"t":{"PID":"${record[''pid'']}"},"u":{"SYSLOG_IDENTIFIER":"${record[''ident'']}"}}}' remove_keys: 'ident,message,pid'
その結果、Kibana が受信するデータは、設定に応じて変換されます。
{ "_index": "logstash-2017.06.29", "_type": "fluentd", "_id": "AVz132QmRtyd8nnlv_11", "_score": null, "_source": { "pid": "22691", "priority": "INFO", "message": "cinder.api.openstack.wsgi [req-04bc2808-f86f-4443-86e6-bfc596969937 - - - - -] OPTIONS http://overcloud-controller-0.lab.local/", "openstack": { "hostname": "overcloud-controller-0", "tag": "openstack.cinder.api", "region": "regionOne", "inputname": "fluent-plugin-in_tail", "name": "fluentd openstack", "fluentd version": "0.12.26", "pipeline_metadata": { "collector": { "ipaddr4": "[\"192.168.24.14\", \"192.168.24.8\", \"10.0.0.4\", \"10.0.0.5\", \"172.16.2.8\", \"172.16.2.4\", \"172.16.2.14\", \"172.16.1.7\", \"172.16.1.9\", \"172.16.3.10\", \"172.16.3.11\", \"172.16.0.14\"]", "ipaddr6": "[\"fe80::293:33ff:fed8:2228%eth0\", \"fe80::293:33ff:fed8:2228%br-ex\", \"fe80::b86c:79ff:fe8f:9fb8%vlan10\", \"fe80::4c78:6fff:feff:14fc%vlan20\", \"fe80::9ced:dfff:fe8c:2d62%vlan30\", \"fe80::ecde:1bff:fe5d:e362%vlan40\", \"fe80::549c:51ff:feea:dfa8%vlan50\", \"fe80::e093:8fff:fef9:69b6%vxlan_sys_4789\"]" } } }, "service": "cinder", "@timestamp": "2017-06-29T21:59:38+00:00" }, "fields": { "@timestamp": [ 1498773578000 ] }, "sort": [ 1498773578000 ]}
Red Hat OpenStack Platform 13 監視ツール設定ガイド監視ツール設定ガイド
14

第4章 サーバー側のコンポーネントのインストール
注記注記
Red Hat では、サーバー側のコンポーネントおよびそれらのデプロイメントプロセスはサポートしていません。Red Hat は opstools-ansible をサポートしません。これはデモの目的で使用されます。
opstools-ansible Playbook を使用してサーバー側のコンポーネントを Red Hat Enterprise Linux 7 にインストールすることができます。これらのサーバー側のコンポーネントには、Red Hat がサポートするクライアント側のコンポーネントを補完する可用性監視や集中ロギングのサービスが含まれます。最も多く検証される opstools-ansible のシナリオは、サーバー側のコンポーネントを CentOS 7 にデプロイするシナリオです。詳しい手順については、https://github.com/centos-opstools/opstools-ansibleで README.rst を参照してください。
第第4章章 サーバー側のコンポーネントのインストールサーバー側のコンポーネントのインストール
15

第5章 OPENSTACK PLATFORM の監視Sensu のスタックインフラストラクチャーについては、https://docs.sensu.io/sensu-core/1.7/overview/architecture/ の Sensu のドキュメントを参照してください。
Red Hat は、osops-tools-monitoring-oschecks パッケージで、check スクリプトのセットを提供しています。check スクリプトの大半は、OpenStack コンポーネントへの API 接続のみをチェックします。ただし、特定のスクリプトは、OpenStack Compute (nova)、OpenStack Block Storage (cinder)、OpenStack Image (glance)、OpenStack Networking (neutron) を対象とする追加の OpenStack リソースのテストも実行します。たとえば、OpenStack Identity (keystone) API check は、keystone の実行時に以下の結果を返します。
OK: Got a token, Keystone API is working.
Red Hat OpenStack Platform 13 監視ツール設定ガイド監視ツール設定ガイド
16

第6章 SENSU クライアントインストールの検証1. 各オーバークラウドノードで sensu-client のステータスを確認します。
# docker ps | grep sensu-client
2. エラーログ (/var/log/containers/sensu/sensu-client.log) で問題があるかどうかを確認します。
3. 各オーバークラウドノードに、監視サーバーの IP アドレスを設定する /var/lib/config-data/puppet-generated/sensu/etc/sensu/conf.d/rabbitmq.json ファイルがあることを確認します。
第第6章章 SENSU クライアントインストールの検証クライアントインストールの検証
17

第7章 ノードの状態の確認Uchiwa ダッシュボードがデプロイされている場合には、そのダッシュボードを Sensu サーバーと共に使用して、ノードの状態を確認することができます。
1. Uchiwa ダッシュボードにログインして、Data Center タブをクリックし、データセンターが稼働中であることを確認します。
http://<SERVER_IP_ADDRESS>/uchiwa
2. 全オーバークラウドノードが Connected の状態であることを確認します。
3. オーバークラウドノードの 1 台を適時に再起動し、そのノードのステータスを Uchiwa ダッシュボードで確認します。再起動の完了後には、ノードが Sensu サーバーに正常に再接続されてcheck の実行を開始するかどうかを確認します。
Red Hat OpenStack Platform 13 監視ツール設定ガイド監視ツール設定ガイド
18

第8章 OPENSTACK サービスの状態の確認以下の例では、openstack-ceilometer-central サービスの監視をテストします。
1. openstack-ceilometer-central サービスが実行中であることを確認します。
docker ps -a | grep ceilometer
2. Uchiwa ダッシュボードに接続して、正常な ceilometer check があり、ceilometer JSON ファイルで定義されているとおりに実行されていることを確認します。
第第8章章 OPENSTACK サービスの状態の確認サービスの状態の確認
19

付録A COLLECTD プラグインおよび PUPPET ベースの設定本項は、collectd プラグインおよび設定の完全な一覧です。
collectd-aggregation: collectd::plugin::aggregation::aggregators collectd::plugin::aggregation::interval
collectd-battery: collectd::plugin::battery::values_percentage collectd::plugin::battery::report_degraded collectd::plugin::battery::query_state_fs collectd::plugin::battery::interval
collectd-cgroups: collectd::plugin::cgroups::ignore_selected collectd::plugin::cgroups::interval
collectd-conntrack: None
collectd-contextswitch: collectd::plugin::contextswitch::interval
collectd-cpu: collectd::plugin::cpu::reportbystate collectd::plugin::cpu::reportbycpu collectd::plugin::cpu::valuespercentage collectd::plugin::cpu::reportnumcpu collectd::plugin::cpu::reportgueststate collectd::plugin::cpu::subtractgueststate collectd::plugin::cpu::interval
collectd-cpufreq: None
collectd-csv: collectd::plugin::csv::datadir collectd::plugin::csv::storerates collectd::plugin::csv::interval
collectd-df: collectd::plugin::df::devices collectd::plugin::df::fstypes collectd::plugin::df::ignoreselected collectd::plugin::df::mountpoints collectd::plugin::df::reportbydevice collectd::plugin::df::reportinodes collectd::plugin::df::reportreserved collectd::plugin::df::valuesabsolute collectd::plugin::df::valuespercentage collectd::plugin::df::interval
collectd-entropy: collectd::plugin::entropy::interval
Red Hat OpenStack Platform 13 監視ツール設定ガイド監視ツール設定ガイド
20

collectd-ethstat: collectd::plugin::ethstat::interfaces collectd::plugin::ethstat::maps collectd::plugin::ethstat::mappedonly collectd::plugin::ethstat::interval
collectd-exec: collectd::plugin::exec::commands collectd::plugin::exec::commands_defaults collectd::plugin::exec::globals collectd::plugin::exec::interval
collectd-fhcount: collectd::plugin::fhcount::valuesabsolute collectd::plugin::fhcount::valuespercentage collectd::plugin::fhcount::interval
collectd-filecount: collectd::plugin::filecount::directories collectd::plugin::filecount::interval
collectd-fscache: None
collectd-hddtemp: collectd::plugin::hddtemp::host collectd::plugin::hddtemp::port collectd::plugin::hddtemp::interval
collectd-interface: collectd::plugin::interface::interfaces collectd::plugin::interface::ignoreselected collectd::plugin::interface::reportinactive collectd::plugin::interface::interval
collectd-ipc: None
collectd-irq: collectd::plugin::irq::irqs collectd::plugin::irq::ignoreselected collectd::plugin::irq::interval
collectd-load: collectd::plugin::load::report_relative collectd::plugin::load::interval
collectd-logfile: collectd::plugin::logfile::log_level collectd::plugin::logfile::log_file collectd::plugin::logfile::log_timestamp collectd::plugin::logfile::print_severity collectd::plugin::logfile::interval
collectd-memcached:
付録付録A COLLECTD プラグインおよびプラグインおよび PUPPET ベースの設定ベースの設定
21
collectd::plugin::memcached::instances collectd::plugin::memcached::interval
collectd-memory: collectd::plugin::memory::valuesabsolute collectd::plugin::memory::valuespercentage collectd::plugin::memory::interval
collectd-network: collectd::plugin::network::timetolive collectd::plugin::network::maxpacketsize collectd::plugin::network::forward collectd::plugin::network::reportstats collectd::plugin::network::listeners collectd::plugin::network::servers collectd::plugin::network::interval
collectd-nfs: collectd::plugin::nfs::interval
collectd-ntpd: collectd::plugin::ntpd::host collectd::plugin::ntpd::port collectd::plugin::ntpd::reverselookups collectd::plugin::ntpd::includeunitid collectd::plugin::ntpd::interval
collectd-numa: None
collectd-openvpn: collectd::plugin::openvpn::statusfile collectd::plugin::openvpn::improvednamingschema collectd::plugin::openvpn::collectcompression collectd::plugin::openvpn::collectindividualusers collectd::plugin::openvpn::collectusercount collectd::plugin::openvpn::interval
collectd-powerdns: collectd::plugin::powerdns::interval collectd::plugin::powerdns::servers collectd::plugin::powerdns::recursors collectd::plugin::powerdns::local_socket collectd::plugin::powerdns::interval
collectd-processes: collectd::plugin::processes::processes collectd::plugin::processes::process_matches collectd::plugin::processes::collect_context_switch collectd::plugin::processes::collect_file_descriptor collectd::plugin::processes::collect_memory_maps collectd::plugin::powerdns::interval
collectd-protocols: collectd::plugin::protocols::ignoreselected collectd::plugin::protocols::values
Red Hat OpenStack Platform 13 監視ツール設定ガイド監視ツール設定ガイド
22

collectd-statsd: collectd::plugin::statsd::host collectd::plugin::statsd::port collectd::plugin::statsd::deletecounters collectd::plugin::statsd::deletetimers collectd::plugin::statsd::deletegauges collectd::plugin::statsd::deletesets collectd::plugin::statsd::countersum collectd::plugin::statsd::timerpercentile collectd::plugin::statsd::timerlower collectd::plugin::statsd::timerupper collectd::plugin::statsd::timersum collectd::plugin::statsd::timercount collectd::plugin::statsd::interval
collectd-swap: collectd::plugin::swap::reportbydevice collectd::plugin::swap::reportbytes collectd::plugin::swap::valuesabsolute collectd::plugin::swap::valuespercentage collectd::plugin::swap::reportio collectd::plugin::swap::interval
collectd-syslog: collectd::plugin::syslog::log_level collectd::plugin::syslog::notify_level collectd::plugin::syslog::interval
collectd-table: collectd::plugin::table::tables collectd::plugin::table::interval
collectd-tail: collectd::plugin::tail::files collectd::plugin::tail::interval
collectd-tail_csv: collectd::plugin::tail_csv::metrics collectd::plugin::tail_csv::files
collectd-target_v5upgrade: None
collectd-tcpconns: collectd::plugin::tcpconns::localports collectd::plugin::tcpconns::remoteports collectd::plugin::tcpconns::listening collectd::plugin::tcpconns::allportssummary collectd::plugin::tcpconns::interval
collectd-thermal: collectd::plugin::thermal::devices collectd::plugin::thermal::ignoreselected collectd::plugin::thermal::interval
付録付録A COLLECTD プラグインおよびプラグインおよび PUPPET ベースの設定ベースの設定
23

collectd-threshold: collectd::plugin::threshold::types collectd::plugin::threshold::plugins collectd::plugin::threshold::hosts collectd::plugin::threshold::interval
collectd-uptime: collectd::plugin::uptime::interval
collectd-users: collectd::plugin::users::interval
collectd-uuid: collectd::plugin::uuid::uuid_file collectd::plugin::uuid::interval
collectd-vmem: collectd::plugin::vmem::verbose collectd::plugin::vmem::interval
collectd-write_graphite: collectd::plugin::write_graphite::carbons collectd::plugin::write_graphite::carbon_defaults collectd::plugin::write_graphite::globals
collectd-write_log: collectd::plugin::write_log::format
collectd-zfs_arc: None
collectd-apache: collectd::plugin::apache::instances (ex.: {'localhost' => {'url' => 'http://localhost/mod_status?auto'}}) collectd::plugin::apache::interval
collectd-bind: collectd::plugin::bind::url collectd::plugin::bind::memorystats collectd::plugin::bind::opcodes collectd::plugin::bind::parsetime collectd::plugin::bind::qtypes collectd::plugin::bind::resolverstats collectd::plugin::bind::serverstats collectd::plugin::bind::zonemaintstats collectd::plugin::bind::views collectd::plugin::bind::interval
collectd-ceph: collectd::plugin::ceph::daemons collectd::plugin::ceph::longrunavglatency collectd::plugin::ceph::convertspecialmetrictypes
collectd-curl: collectd::plugin::curl::pages collectd::plugin::curl::interval
Red Hat OpenStack Platform 13 監視ツール設定ガイド監視ツール設定ガイド
24
collectd-curl_json: collectd::plugin::curl_json::url collectd::plugin::curl_json::instance collectd::plugin::curl_json::keys collectd::plugin::curl_json::host collectd::plugin::curl_json::user collectd::plugin::curl_json::password collectd::plugin::curl_json::digest collectd::plugin::curl_json::verifypeer collectd::plugin::curl_json::verifyhost collectd::plugin::curl_json::cacert collectd::plugin::curl_json::header collectd::plugin::curl_json::post collectd::plugin::curl_json::timeout collectd::plugin::curl_json::interval
collectd-dbi: collectd::plugin::dbi::databases collectd::plugin::dbi::queries collectd::plugin::dbi::interval
collectd-disk: collectd::plugin::disk::disks collectd::plugin::disk::ignoreselected collectd::plugin::disk::udevnameattr collectd::plugin::disk::interval
collectd-dns: collectd::plugin::dns::ignoresource collectd::plugin::dns::interface collectd::plugin::dns::selectnumericquerytypes collectd::plugin::dns::interval
collectd-generic-jmx: collectd::plugin::genericjmx::jvmarg
collectd-ipmi: collectd::plugin::ipmi::ignore_selected collectd::plugin::ipmi::notify_sensor_add collectd::plugin::ipmi::notify_sensor_remove collectd::plugin::ipmi::notify_sensor_not_present collectd::plugin::ipmi::sensors collectd::plugin::ipmi::interval
collectd-mysql: collectd::plugin::mysql::interval
collectd-netlink: collectd::plugin::netlink::interfaces collectd::plugin::netlink::verboseinterfaces collectd::plugin::netlink::qdiscs collectd::plugin::netlink::classes collectd::plugin::netlink::filters collectd::plugin::netlink::ignoreselected collectd::plugin::netlink::interval
付録付録A COLLECTD プラグインおよびプラグインおよび PUPPET ベースの設定ベースの設定
25

collectd-openldap: collectd::plugin::openldap::instances collectd::plugin::openldap::interval
collectd-ping: collectd::plugin::ping::hosts collectd::plugin::ping::timeout collectd::plugin::ping::ttl collectd::plugin::ping::source_address collectd::plugin::ping::device collectd::plugin::ping::max_missed collectd::plugin::ping::size collectd::plugin::ping::interval
collectd-sensors: collectd::plugin::sensors::sensorconfigfile collectd::plugin::sensors::sensors collectd::plugin::sensors::ignoreselected collectd::plugin::sensors::interval
collectd-smart: collectd::plugin::smart::disks collectd::plugin::smart::ignoreselected collectd::plugin::smart::interval
collectd-snmp: collectd::plugin::snmp::data collectd::plugin::snmp::hosts collectd::plugin::snmp::interval
collectd-virt: collectd::plugin::virt::connection collectd::plugin::virt::refresh_interval collectd::plugin::virt::domain collectd::plugin::virt::block_device collectd::plugin::virt::interface_device collectd::plugin::virt::ignore_selected collectd::plugin::virt::hostname_format collectd::plugin::virt::interface_format collectd::plugin::virt::extra_stats collectd::plugin::virt::interval
collectd-write_http: collectd::plugin::write_http::nodes collectd::plugin::write_http::urls
collectd-write_kafka: collectd::plugin::write_kafka::kafka_host collectd::plugin::write_kafka::kafka_port collectd::plugin::write_kafka::kafka_hosts collectd::plugin::write_kafka::topics
collectd-write_prometheus: collectd::plugin::write_prometheus::port
collectd-ovs_events:
Red Hat OpenStack Platform 13 監視ツール設定ガイド監視ツール設定ガイド
26

collectd::plugin::ovs_events::address collectd::plugin::ovs_events::dispatch collectd::plugin::ovs_events::interfaces collectd::plugin::ovs_events::send_notification collectd::plugin::ovs_events::$port collectd::plugin::ovs_events::socket
collectd-ovs_stats: collectd::plugin::ovs_stats::address collectd::plugin::ovs_stats::bridges collectd::plugin::ovs_stats::port collectd::plugin::ovs_stats::socket
collectd-connectivity: collectd::plugin::connectivity::interfaces
collectd-procevent: collectd::plugin::procevent::process collectd::plugin::procevent::regex_process collectd::plugin::procevent::buffer_length
collectd-sysevent: collectd::plugin::sysevent::listen_host collectd::plugin::sysevent::listen_port collectd::plugin::sysevent::regex_filter collectd::plugin::sysevent::buffer_size collectd::plugin::sysevent::buffer_length
collectd-iptables: collectd::plugin::iptables::chains collectd::plugin::iptables::chains6 collectd::plugin::iptables::interval
collectd-hugepages: collectd::plugin::hugepages::report_per_node_hp collectd::plugin::hugepages::report_root_hp collectd::plugin::hugepages::values_pages collectd::plugin::hugepages::values_bytes collectd::plugin::hugepages::values_percentage collectd::plugin::hugepages::interval
collectd-turbostat: collectd::plugin::turbostat::core_c_states collectd::plugin::turbostat::package_c_states collectd::plugin::turbostat::system_management_interrupt collectd::plugin::turbostat::digital_temperature_sensor collectd::plugin::turbostat::tcc_activation_temp collectd::plugin::turbostat::running_average_power_limit collectd::plugin::turbostat::logical_core_names
付録付録A COLLECTD プラグインおよびプラグインおよび PUPPET ベースの設定ベースの設定
27