report to the sentencing reform oversight committee to the sentencing reform oversight committee . 2...
TRANSCRIPT
SOUTH CAROLINA DEPARTMENT OF PROBATION, PAROLE AND PARDON SERVICES
September 2014
Report to the Sentencing Reform Oversight Committee
2
Table of Contents
Major Accomplishments …….……………………………………………............... 3/4
Overview .…….………………………………………………………………............... 5
Funnel Graph …….…………………………………………………………………… 6
Cost Avoidance ……………………………………………………………………… 7
Cost of Supervision ………………………………………………………………… 8
Reinvestment Recommendation …….……………………………….................. 8-10
Section 18 - Driving Under Suspension ………………………………………….. 11
Section 38 - Drug Offenses ……………………………………………….………… 11
Section 40 - Conditional Discharge …………………………………………......... 12
Sections 45 & 52 - Administrative Monitoring ………………………….…......... 13
Sections 45 & 50 - Supervision Risk/Need Assessments ……………….......... 14
Sections 45 & 46 - Parole Risk/Need Assessments ………………….………… 15/16
Section 46 - Parole Board Member Training ………………………….…………. 17
Section 48 - Supervised Reentry …………………………………………….......... 17
Section 50 - Compliance Credits …………………………………………….......... 18
Section 53 - Administrative Sanctions ……………………………….….............. 19-21
Section 55 - Terminally Ill, Geriatric, Permanently Disabled ……….………….. 22
Appendix …………………………………………………………………….…………. 23-26
3
Major Accomplishments
Since the unanimous passage of the Omnibus Crime Reduction and Sentencing Reform Act (SRA) of
2010, South Carolina strives to become a leader in crime and justice policy reform as it pertains to
using data to drive decision-making in effort to hold offenders more accountable, enhance public safety
and implement fiscally-sound practices to control institutional corrections cost. This report highlights the
major accomplishments achieved by the South Carolina Department of Probation, Parole and Pardon
Services (SCDPPPS) in FY 2014 as a result of the implementation of key SRA programs and evidence-
based practices in a continuous effort to strengthen probation and parole:
Evidence-Based Practices: The Department continues to use a validated actuarial risk/needs
assessment tool as the foundation for supervision and resource allocation strategies.
Based on the assessments completed during FY 2014, the most commonly identified
criminogenic needs for offender case management are substance abuse, vocational/education
and criminal personality. (Sections 45 and 50 of this report detail the FY 2014 highlights for
supervision risk/needs assessment on page 16.)
Non-Residential Reentry Centers: The Department has increased reentry services through the
Columbia and Spartanburg Reentry Centers. The Reentry Centers are non-residential facilities that
offer skills-based learning opportunities, education and vocational training for higher-risk offenders.
In June 2014, the Columbia Reentry Center hosted its first job fair with representatives from
various companies willing to hire offenders. As a result of the job fair, there were over 690
participants representing active federal and state offenders and former offenders.
Developed partnerships with external stakeholders (e.g., South Carolina Department of
Corrections (SCDC), Department of Alcohol and Other Drugs, Mental Health, Vocational
Rehabilitation) in continuous effort to develop reentry plans and coordinate treatment services
upon release.
Implemented a pilot program in which one (1) Reentry Program Coordinator has been assigned
a caseload of 135 offenders with a projected release date within 90-days from seven (7) SCDC
institutions in effort to develop reentry planning prior to release.
Hiring Practices Task Force: In the interest of continuous quality assurance, the Department
continues to improve recruitment and hiring practices as recommended by the Hiring Practices Task
Force. In order for any law enforcement agency to be effective it must have the ability to attract and
retain quality people.
The Department established a recruiter position; this staff member is responsible for recruiting
qualified applicants and developing community partnerships in the recruitment process.
In August 2014, the Department coordinated its first employment fair for potential agent
candidates, which included representatives from a variety of Department divisions and criminal
justice professional organizations.
In July 2014, the Department streamlined its hiring process by implementing a centralized
interview protocol to ensure efficiency in filling probation and parole agent vacancies.
In FY 14, 118 FTEs were hired (89 agents/29 non-agents) and 63 FTE separations occurred (53
agents/10 non-agents).
4
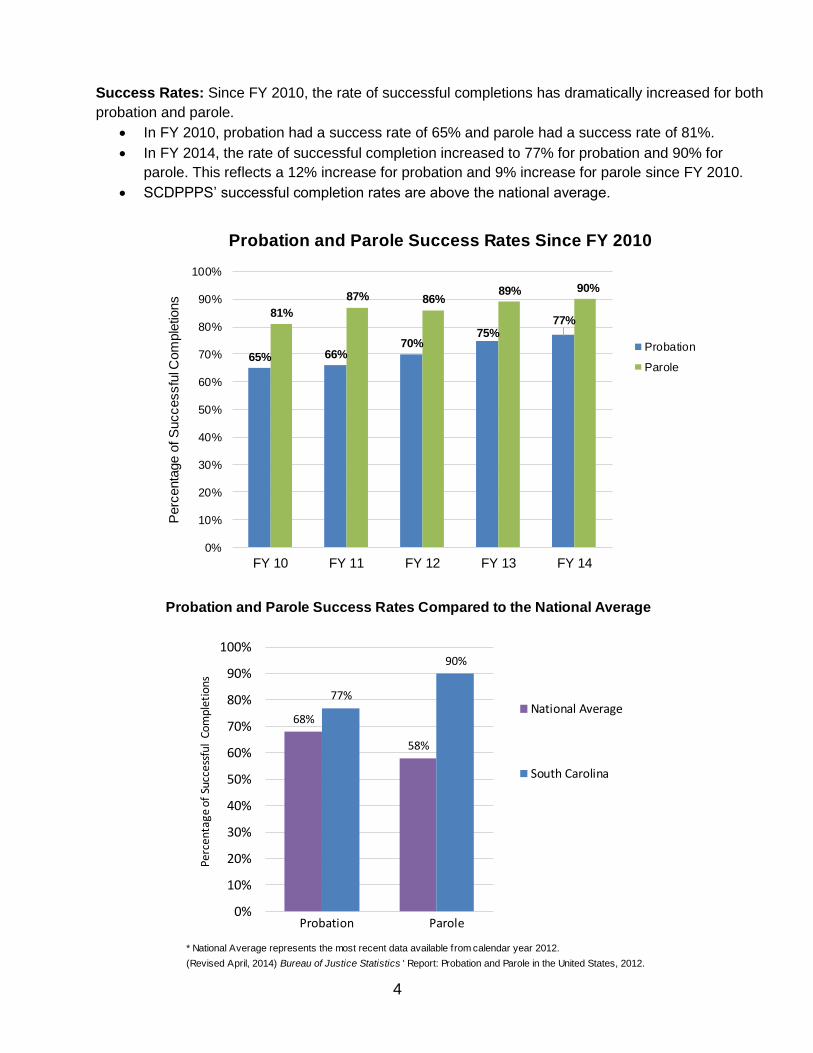
Success Rates: Since FY 2010, the rate of successful completions has dramatically increased for both
probation and parole.
In FY 2010, probation had a success rate of 65% and parole had a success rate of 81%.
In FY 2014, the rate of successful completion increased to 77% for probation and 90% for
parole. This reflects a 12% increase for probation and 9% increase for parole since FY 2010.
SCDPPPS’ successful completion rates are above the national average.
Probation and Parole Success Rates Since FY 2010
65% 66%70%
75%77%
81%
87% 86%89% 90%
0%
10%
20%
30%
40%
50%
60%
70%
80%
90%
100%
FY 10 FY 11 FY 12 FY 13 FY 14
Perc
enta
ge o
f S
uccessfu
l Com
ple
tions
Probation
Parole
Probation and Parole Success Rates Compared to the National Average
* National Average represents the most recent data available from calendar year 2012.
(Revised April, 2014) Bureau of Justice Statistics ' Report: Probation and Parole in the United States, 2012.
68%
58%
77%
90%
0%
10%
20%
30%
40%
50%
60%
70%
80%
90%
100%
Perc
enta
ge o
f Su
cces
sful
Com
plet
ions
Probation Parole
National Average
South Carolina
5
Overview
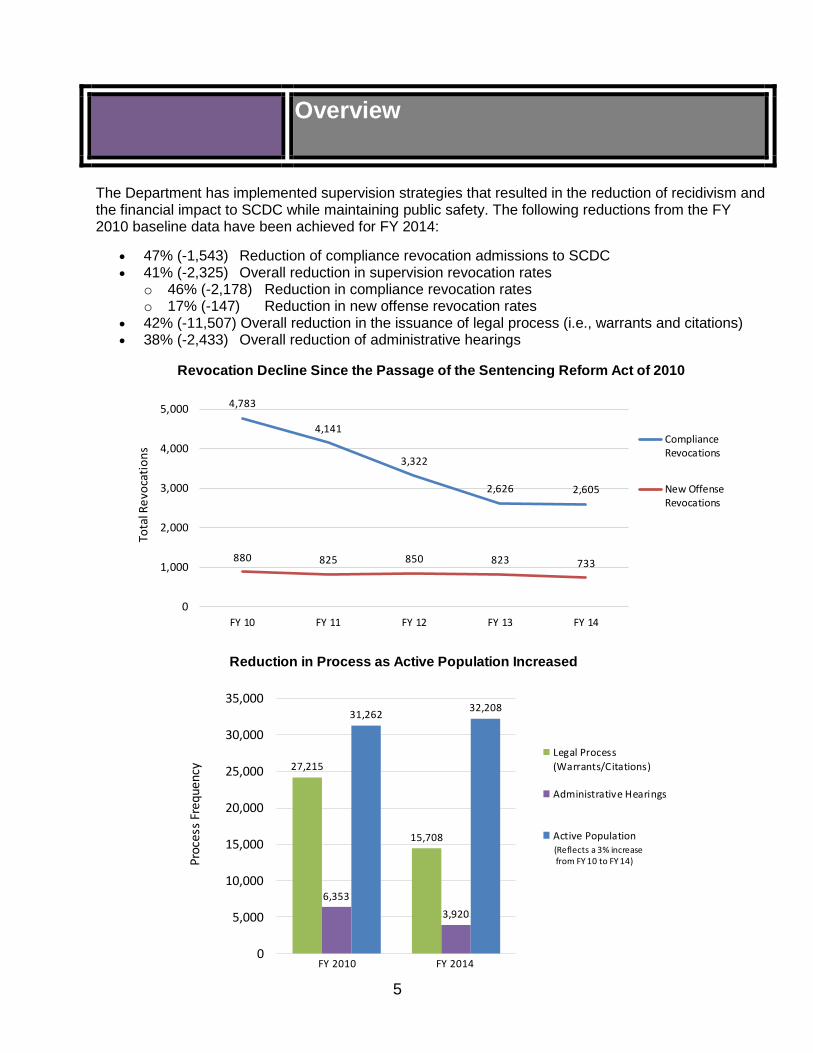
The Department has implemented supervision strategies that resulted in the reduction of recidivism and the financial impact to SCDC while maintaining public safety. The following reductions from the FY 2010 baseline data have been achieved for FY 2014:
47% (-1,543) Reduction of compliance revocation admissions to SCDC 41% (-2,325) Overall reduction in supervision revocation rates
o 46% (-2,178) Reduction in compliance revocation rates o 17% (-147) Reduction in new offense revocation rates
42% (-11,507) Overall reduction in the issuance of legal process (i.e., warrants and citations) 38% (-2,433) Overall reduction of administrative hearings
Revocation Decline Since the Passage of the Sentencing Reform Act of 2010
4,783
4,141
3,322
2,626 2,605
880 825 850 823 733
0
1,000
2,000
3,000
4,000
5,000
FY 10 FY 11 FY 12 FY 13 FY 14
Tota
l Re
voca
tio
ns
ComplianceRevocations
New OffenseRevocations
Reduction in Process as Active Population Increased
* National Average represents the most recent data available from calendar year 2012.
(Revised April, 2014) Bureau of Justice Statistics ' Report: Probation and Parole in the United States, 2012.
27,215
15,708
6,353
3,920
31,26232,208
0
5,000
10,000
15,000
20,000
25,000
30,000
35,000
Proc
ess
Freq
uenc
y
FY 2010 FY 2014
Legal Process
(Warrants/Citations)
Administrative Hearings
Active Population(Reflects a 3% increase from FY 10 to FY 14)
6
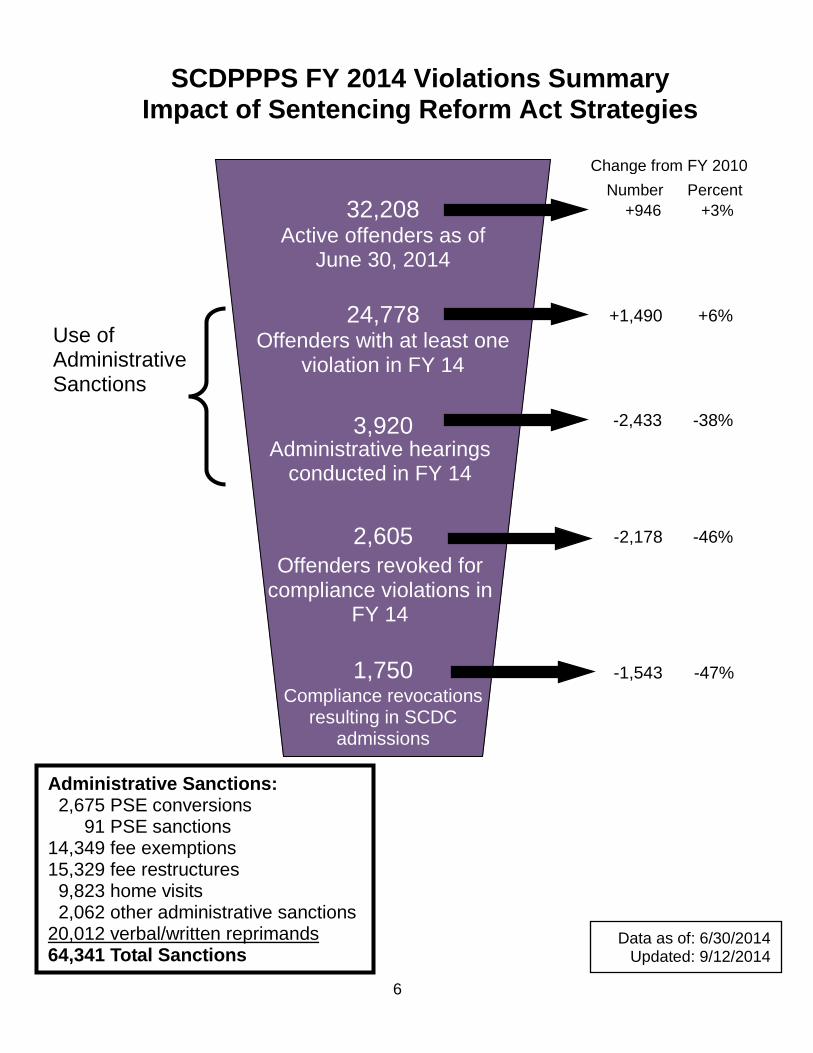
SCDPPPS FY 2014 Violations Summary Impact of Sentencing Reform Act Strategies
24,778 Offenders with at least one
violation in FY 14
32,208 Active offenders as of
June 30, 2014
Administrative hearings conducted in FY 14
3,920
Offenders revoked for compliance violations in
FY 14
2,605
Compliance revocations resulting in SCDC
admissions
1,750
Use of Administrative Sanctions
Change from FY 2010
Number Percent
Data as of: 6/30/2014 Updated: 9/12/2014
Administrative Sanctions:
2,675 PSE conversions
91 PSE sanctions
14,349 fee exemptions
15,329 fee restructures
9,823 home visits 2,062 other administrative sanctions
20,012 verbal/written reprimands
64,341 Total Sanctions
+946 +3%
+6% +1,490
-47% -1,543
-46% -2,178
-38% -2,433
7
Cost Avoidance
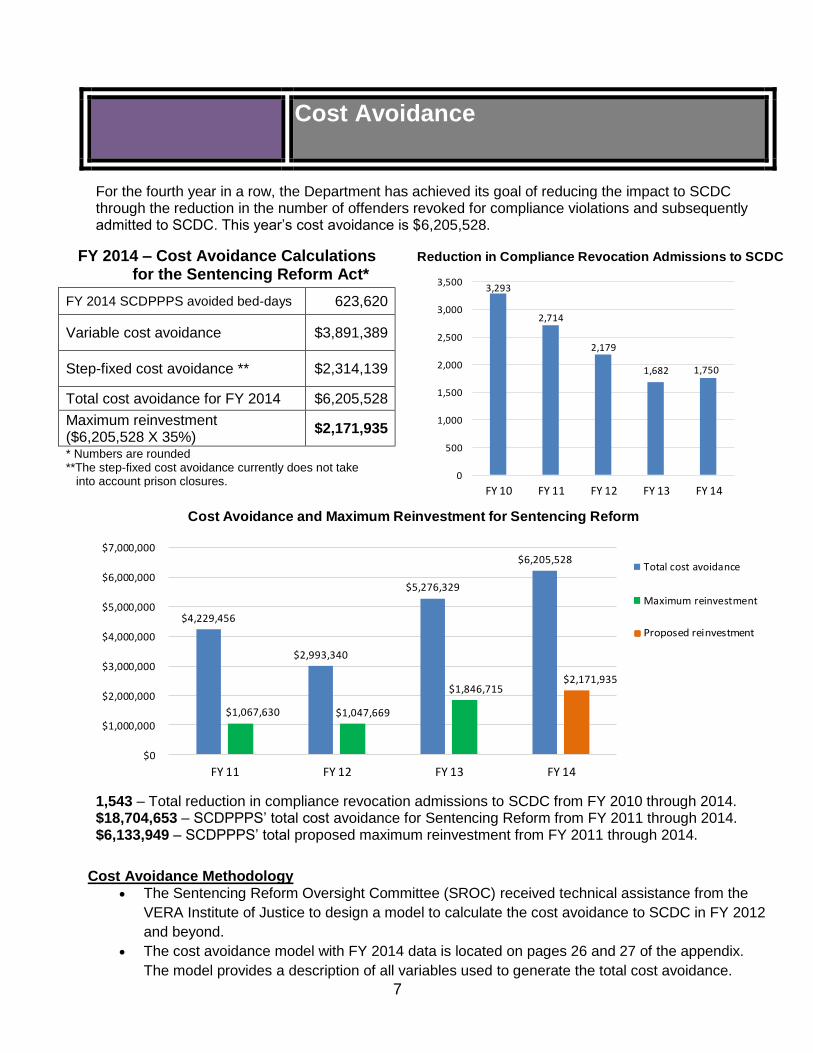
For the fourth year in a row, the Department has achieved its goal of reducing the impact to SCDC through the reduction in the number of offenders revoked for compliance violations and subsequently admitted to SCDC. This year’s cost avoidance is $6,205,528.
FY 2014 – Cost Avoidance Calculations for the Sentencing Reform Act*
FY 2014 SCDPPPS avoided bed-days 623,620
Variable cost avoidance $3,891,389
Step-fixed cost avoidance ** $2,314,139
Total cost avoidance for FY 2014 $6,205,528
Maximum reinvestment ($6,205,528 X 35%)
$2,171,935
* Numbers are rounded **The step-fixed cost avoidance currently does not take into account prison closures.
Cost Avoidance and Maximum Reinvestment for Sentencing Reform
$4,229,456
$2,993,340
$5,276,329
$6,205,528
$1,067,630 $1,047,669
$1,846,715 $2,171,935
$0
$1,000,000
$2,000,000
$3,000,000
$4,000,000
$5,000,000
$6,000,000
$7,000,000
FY 11 FY 12 FY 13 FY 14
Total cost avoidance
Maximum reinvestment
Proposed reinvestment
1,543 – Total reduction in compliance revocation admissions to SCDC from FY 2010 through 2014. $18,704,653 – SCDPPPS’ total cost avoidance for Sentencing Reform from FY 2011 through 2014. $6,133,949 – SCDPPPS’ total proposed maximum reinvestment from FY 2011 through 2014.
Cost Avoidance Methodology The Sentencing Reform Oversight Committee (SROC) received technical assistance from the
VERA Institute of Justice to design a model to calculate the cost avoidance to SCDC in FY 2012
and beyond.
The cost avoidance model with FY 2014 data is located on pages 26 and 27 of the appendix.
The model provides a description of all variables used to generate the total cost avoidance.
Reduction in Compliance Revocation Admissions to SCDC
3,293
2,714
2,179
1,682 1,750
0
500
1,000
1,500
2,000
2,500
3,000
3,500
FY 10 FY 11 FY 12 FY 13 FY 14
8
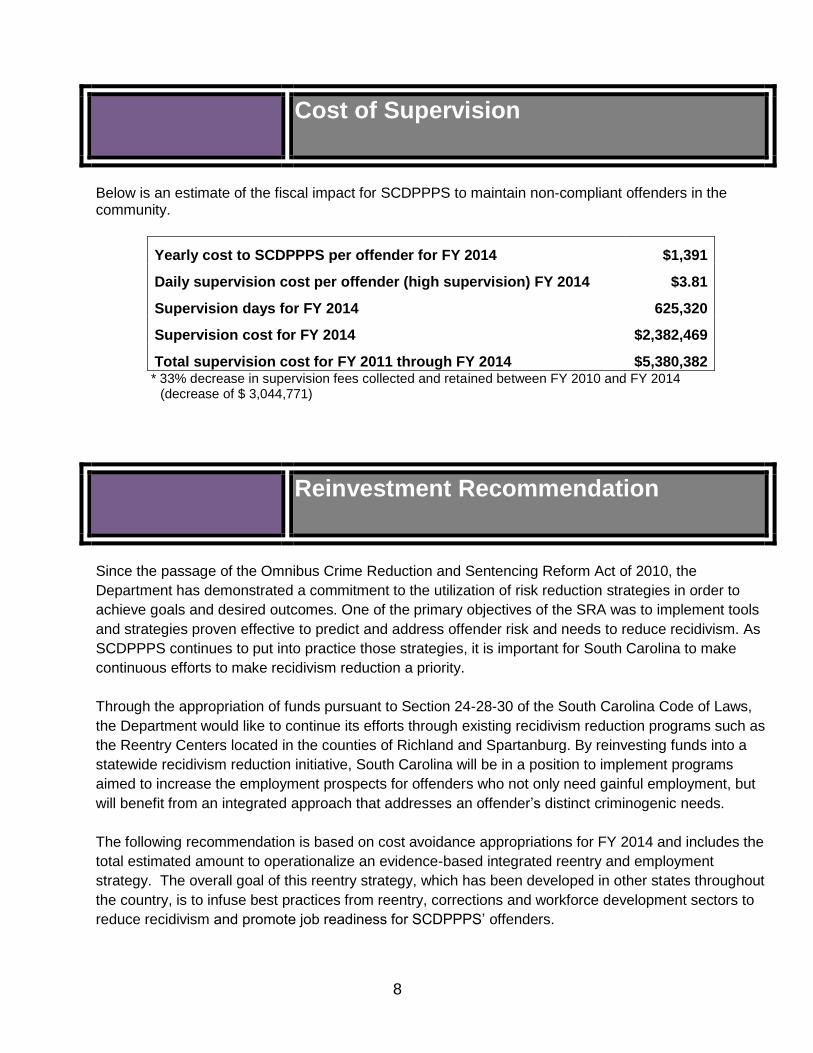
Cost of Supervision
Below is an estimate of the fiscal impact for SCDPPPS to maintain non-compliant offenders in the community.
Yearly cost to SCDPPPS per offender for FY 2014 $1,391
Daily supervision cost per offender (high supervision) FY 2014 $3.81
Supervision days for FY 2014 625,320
Supervision cost for FY 2014 $2,382,469
Total supervision cost for FY 2011 through FY 2014 $5,380,382 * 33% decrease in supervision fees collected and retained between FY 2010 and FY 2014
(decrease of $ 3,044,771)
Reinvestment Recommendation
Since the passage of the Omnibus Crime Reduction and Sentencing Reform Act of 2010, the
Department has demonstrated a commitment to the utilization of risk reduction strategies in order to
achieve goals and desired outcomes. One of the primary objectives of the SRA was to implement tools
and strategies proven effective to predict and address offender risk and needs to reduce recidivism. As
SCDPPPS continues to put into practice those strategies, it is important for South Carolina to make
continuous efforts to make recidivism reduction a priority.
Through the appropriation of funds pursuant to Section 24-28-30 of the South Carolina Code of Laws,
the Department would like to continue its efforts through existing recidivism reduction programs such as
the Reentry Centers located in the counties of Richland and Spartanburg. By reinvesting funds into a
statewide recidivism reduction initiative, South Carolina will be in a position to implement programs
aimed to increase the employment prospects for offenders who not only need gainful employment, but
will benefit from an integrated approach that addresses an offender’s distinct criminogenic needs.
The following recommendation is based on cost avoidance appropriations for FY 2014 and includes the
total estimated amount to operationalize an evidence-based integrated reentry and employment
strategy. The overall goal of this reentry strategy, which has been developed in other states throughout
the country, is to infuse best practices from reentry, corrections and workforce development sectors to
reduce recidivism and promote job readiness for SCDPPPS’ offenders.
9
Reinvestment in an Integrated Reentry and Employment Strategy
According to the Pew Center on the States (2012), over 90% of the individuals serving a period of
incarceration in local jails or prisons will return to the community. This proposal seeks to expand the
Department’s offender reentry efforts by strengthening the Reentry Centers in Columbia and
Spartanburg, as well as build the internal capacity to provide moderate- to high-risk offenders under
supervision with unlimited access to treatment at no additional financial burden to the offender or
family. The total estimated costs are reoccurring personnel expenses to expand the Department’s
existing reentry program.
For a number of years, the Department has developed and/or implemented programs to support a
community-based treatment model for offenders assessed at a moderate- to high-risk to reoffend. The
Department recognizes the challenges and barriers its offenders and agents experience while
attempting to gain access to the appropriate level of community-based treatment services throughout
the state. Using a systematic, client-centered rehabilitation program approach, reinvestment into the
existing Reentry Centers will position the Department to work effectively with community-based service
providers in a controlled environment adhering to the principles of evidence-based practices.
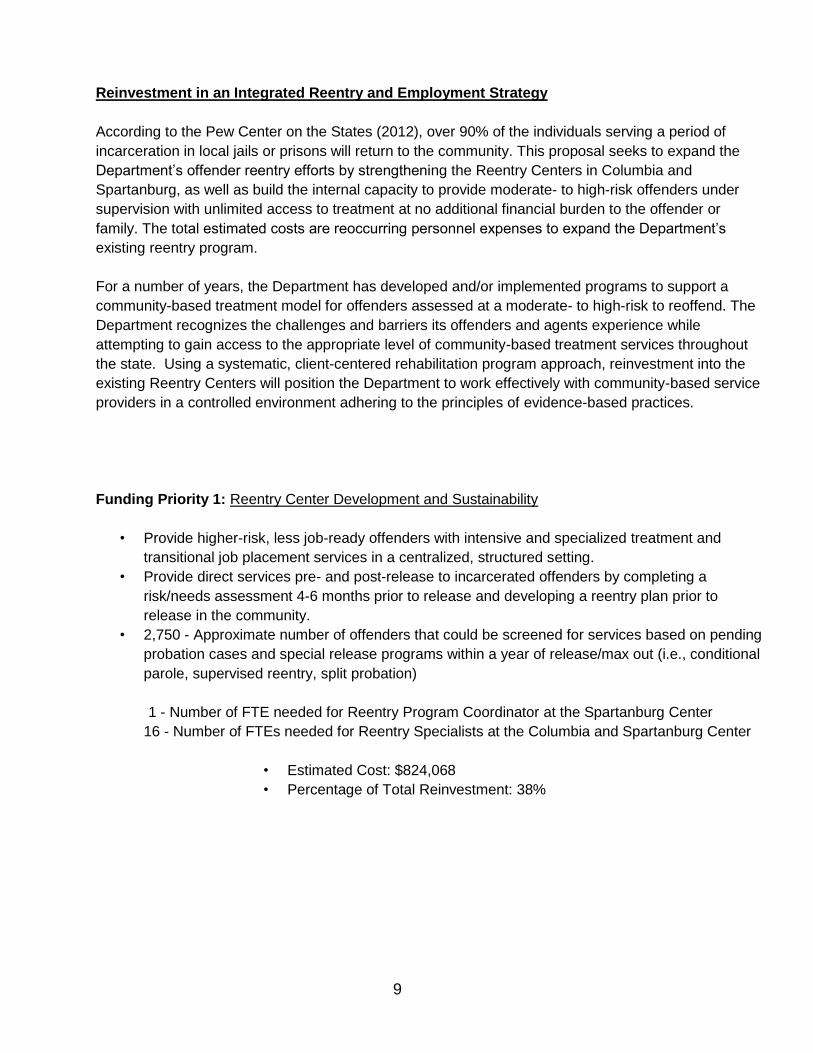
Funding Priority 1: Reentry Center Development and Sustainability
• Provide higher-risk, less job-ready offenders with intensive and specialized treatment and
transitional job placement services in a centralized, structured setting.
• Provide direct services pre- and post-release to incarcerated offenders by completing a
risk/needs assessment 4-6 months prior to release and developing a reentry plan prior to
release in the community.
• 2,750 - Approximate number of offenders that could be screened for services based on pending
probation cases and special release programs within a year of release/max out (i.e., conditional
parole, supervised reentry, split probation)
1 - Number of FTE needed for Reentry Program Coordinator at the Spartanburg Center
16 - Number of FTEs needed for Reentry Specialists at the Columbia and Spartanburg Center
• Estimated Cost: $824,068
• Percentage of Total Reinvestment: 38%
10
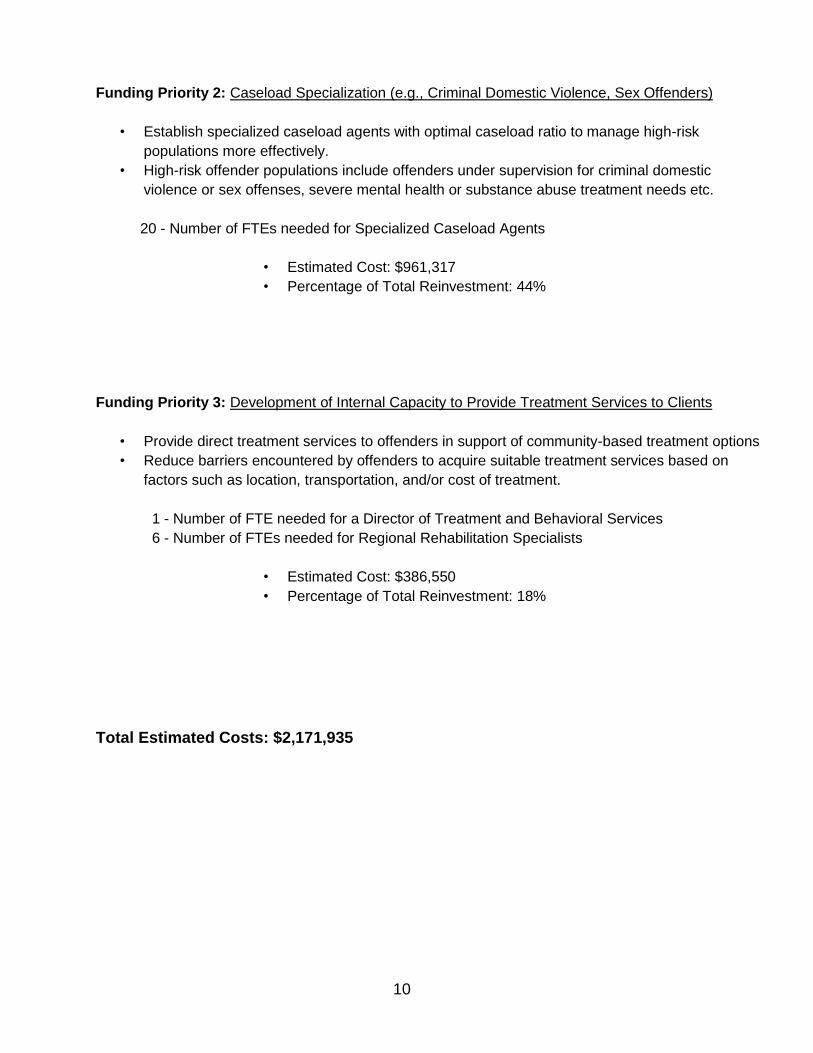
Funding Priority 2: Caseload Specialization (e.g., Criminal Domestic Violence, Sex Offenders)
• Establish specialized caseload agents with optimal caseload ratio to manage high-risk
populations more effectively.
• High-risk offender populations include offenders under supervision for criminal domestic
violence or sex offenses, severe mental health or substance abuse treatment needs etc.
20 - Number of FTEs needed for Specialized Caseload Agents
• Estimated Cost: $961,317
• Percentage of Total Reinvestment: 44%
Funding Priority 3: Development of Internal Capacity to Provide Treatment Services to Clients
• Provide direct treatment services to offenders in support of community-based treatment options
• Reduce barriers encountered by offenders to acquire suitable treatment services based on
factors such as location, transportation, and/or cost of treatment.
1 - Number of FTE needed for a Director of Treatment and Behavioral Services
6 - Number of FTEs needed for Regional Rehabilitation Specialists
• Estimated Cost: $386,550
• Percentage of Total Reinvestment: 18%
Total Estimated Costs: $2,171,935
11
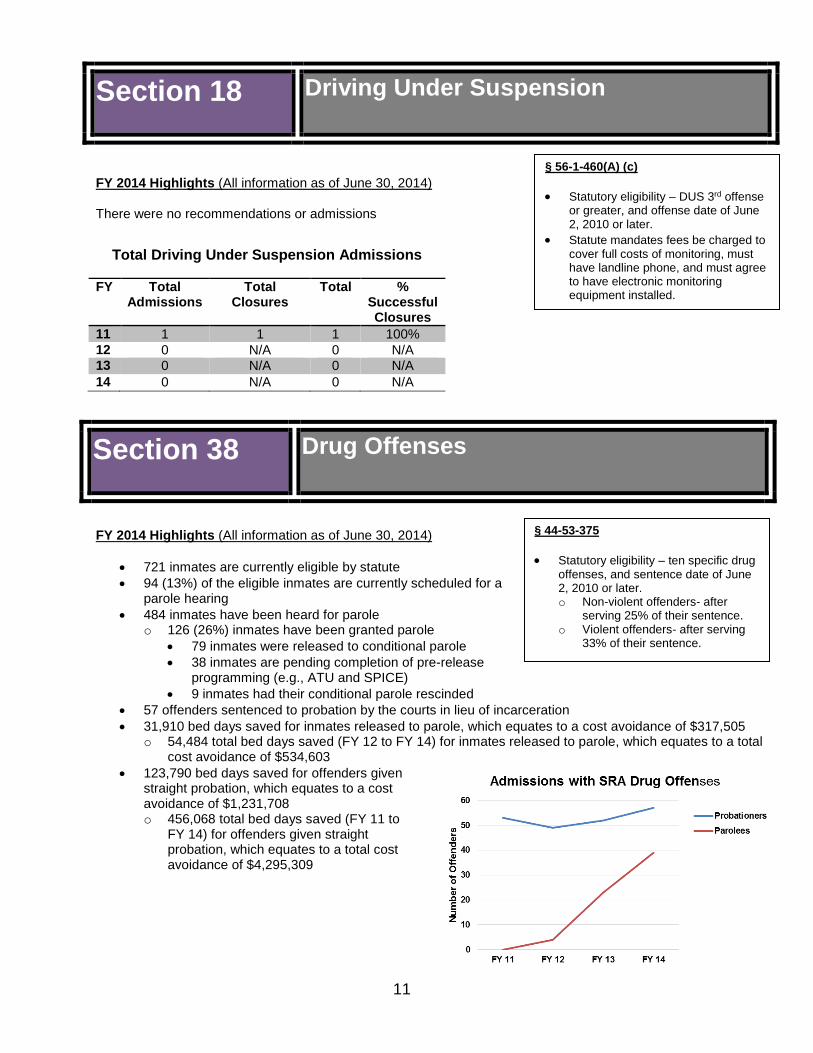
§ 44-53-375
Statutory eligibility – ten specific drug offenses, and sentence date of June 2, 2010 or later. o Non-violent offenders- after
serving 25% of their sentence. o Violent offenders- after serving
33% of their sentence.
§ 56-1-460(A) (c)
Statutory eligibility – DUS 3rd offense or greater, and offense date of June 2, 2010 or later.
Statute mandates fees be charged to cover full costs of monitoring, must have landline phone, and must agree to have electronic monitoring equipment installed.
FY 2014 Highlights (All information as of June 30, 2014)
There were no recommendations or admissions
Section 38 Drug Offenses
FY 2014 Highlights (All information as of June 30, 2014)
721 inmates are currently eligible by statute
94 (13%) of the eligible inmates are currently scheduled for a parole hearing
484 inmates have been heard for parole o 126 (26%) inmates have been granted parole
79 inmates were released to conditional parole
38 inmates are pending completion of pre-release programming (e.g., ATU and SPICE)
9 inmates had their conditional parole rescinded
57 offenders sentenced to probation by the courts in lieu of incarceration
31,910 bed days saved for inmates released to parole, which equates to a cost avoidance of $317,505 o 54,484 total bed days saved (FY 12 to FY 14) for inmates released to parole, which equates to a total
cost avoidance of $534,603
123,790 bed days saved for offenders given straight probation, which equates to a cost avoidance of $1,231,708 o 456,068 total bed days saved (FY 11 to
FY 14) for offenders given straight probation, which equates to a total cost avoidance of $4,295,309
Section 18 Driving Under Suspension
Total Driving Under Suspension Admissions
FY Total Admissions
Total Closures
Total % Successful Closures
11 1 1 1 100%
12 0 N/A 0 N/A 13 0 N/A 0 N/A
14 0 N/A 0 N/A
12
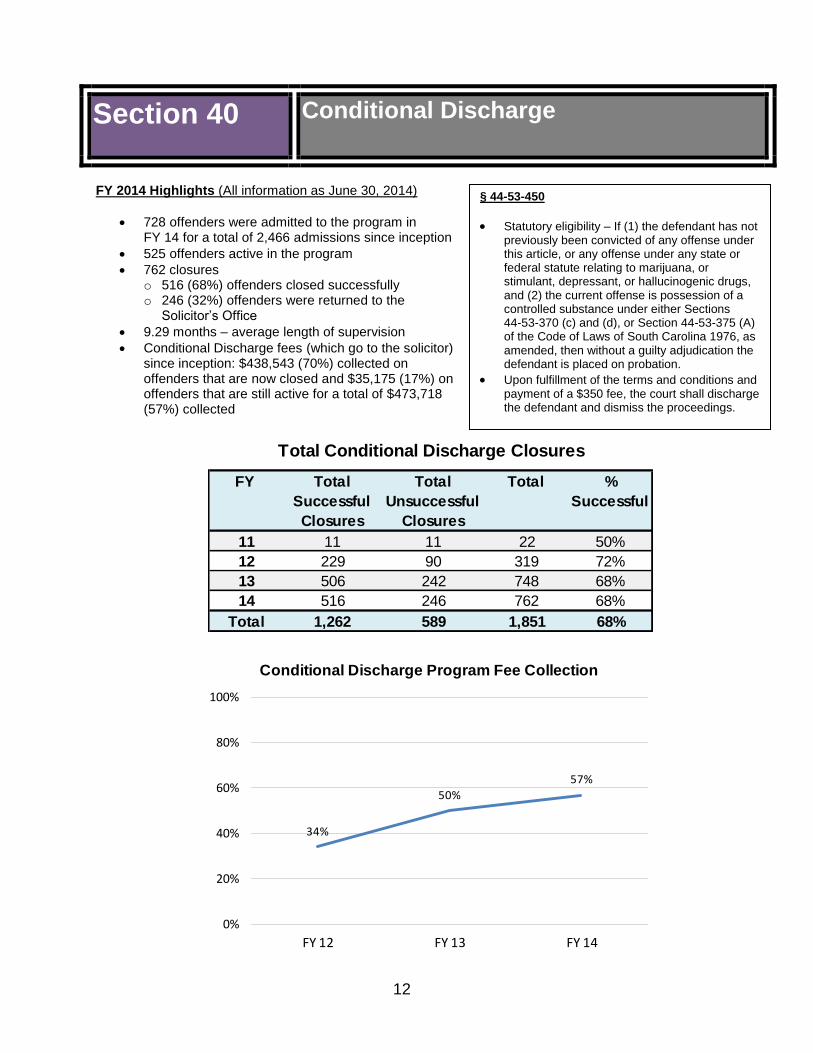
§ 44-53-450
Statutory eligibility – If (1) the defendant has not previously been convicted of any offense under this article, or any offense under any state or federal statute relating to marijuana, or stimulant, depressant, or hallucinogenic drugs, and (2) the current offense is possession of a controlled substance under either Sections 44-53-370 (c) and (d), or Section 44-53-375 (A) of the Code of Laws of South Carolina 1976, as amended, then without a guilty adjudication the defendant is placed on probation.
Upon fulfillment of the terms and conditions and payment of a $350 fee, the court shall discharge the defendant and dismiss the proceedings.
Section 40 Conditional Discharge
FY 2014 Highlights (All information as June 30, 2014)
728 offenders were admitted to the program in FY 14 for a total of 2,466 admissions since inception
525 offenders active in the program
762 closures o 516 (68%) offenders closed successfully o 246 (32%) offenders were returned to the
Solicitor’s Office
9.29 months – average length of supervision
Conditional Discharge fees (which go to the solicitor) since inception: $438,543 (70%) collected on offenders that are now closed and $35,175 (17%) on offenders that are still active for a total of $473,718 (57%) collected
11 11 11 22 50%
12 229 90 319 72%
13 506 242 748 68%
14 516 246 762 68%
Total 1,262 589 1,851 68%
Total
Unsuccessful
Closures
TotalTotal
Successful
Closures
%
Successful
FY
Total Conditional Discharge Closures
Conditional Discharge Program Fee Collection
34%
50%
57%
0%
20%
40%
60%
80%
100%
FY 12 FY 13 FY 14
13
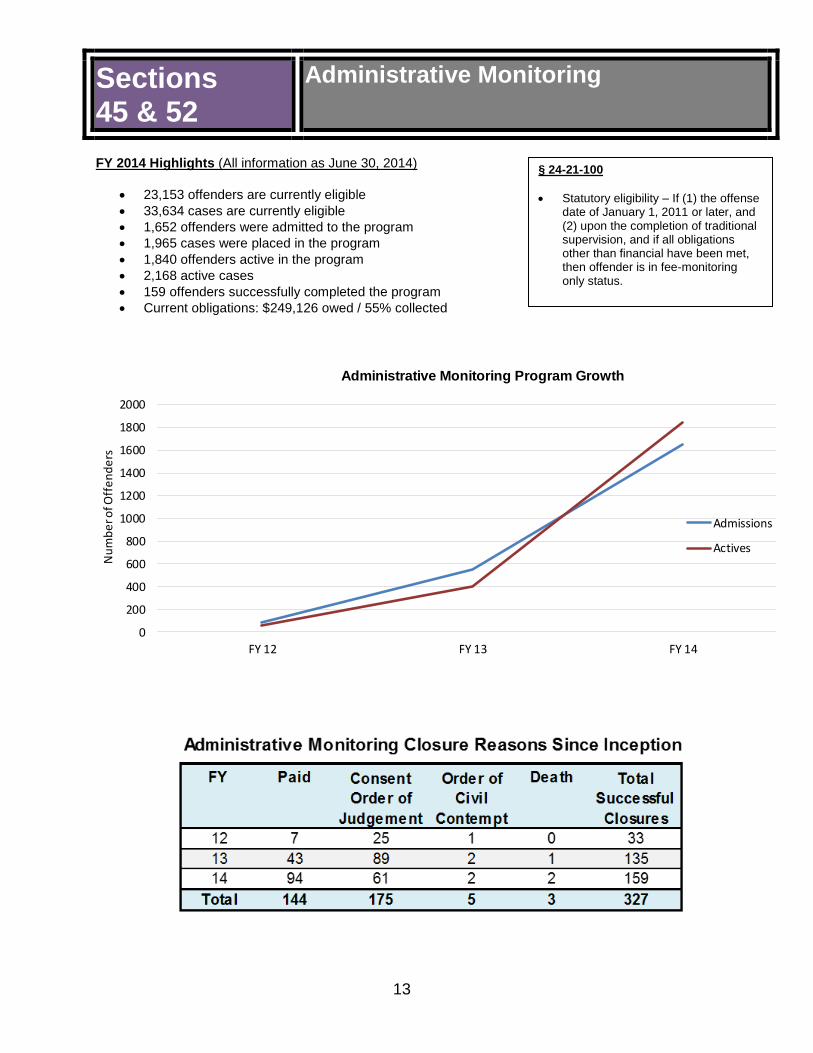
§ 24-21-100
Statutory eligibility – If (1) the offense date of January 1, 2011 or later, and (2) upon the completion of traditional supervision, and if all obligations other than financial have been met, then offender is in fee-monitoring only status.
FY 2014 Highlights (All information as June 30, 2014)
23,153 offenders are currently eligible
33,634 cases are currently eligible
1,652 offenders were admitted to the program
1,965 cases were placed in the program
1,840 offenders active in the program
2,168 active cases
159 offenders successfully completed the program
Current obligations: $249,126 owed / 55% collected
Administrative Monitoring Program Growth
0
200
400
600
800
1000
1200
1400
1600
1800
2000
FY 12 FY 13 FY 14
Nu
mb
er o
f Off
en
de
rs
Admissions
Actives
Sections 45 & 52
Administrative Monitoring
14
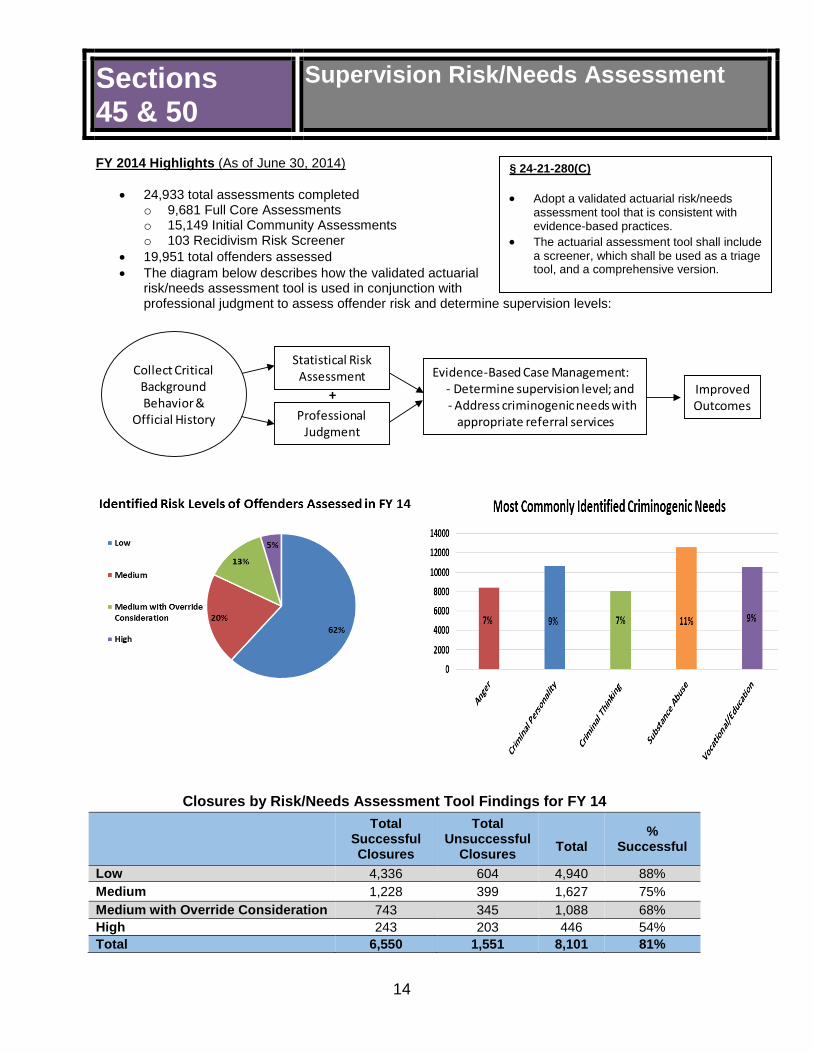
§ 24-21-280(C)
Adopt a validated actuarial risk/needs assessment tool that is consistent with evidence-based practices.
The actuarial assessment tool shall include a screener, which shall be used as a triage tool, and a comprehensive version.
FY 2014 Highlights (As of June 30, 2014)
24,933 total assessments completed o 9,681 Full Core Assessments o 15,149 Initial Community Assessments o 103 Recidivism Risk Screener
19,951 total offenders assessed
The diagram below describes how the validated actuarial risk/needs assessment tool is used in conjunction with professional judgment to assess offender risk and determine supervision levels:
Collect CriticalBackgroundBehavior &
Official History Professional Judgment
Statistical Risk Assessment
+
Evidence-Based Case Management:- Determine supervision level; and- Address criminogenic needs with
appropriate referral services
Improved Outcomes
Sections 45 & 50
Supervision Risk/Needs Assessment
Closures by Risk/Needs Assessment Tool Findings for FY 14
Total Successful Closures
Total Unsuccessful
Closures
Total
% Successful
Low 4,336 604 4,940 88%
Medium 1,228 399 1,627 75%
Medium with Override Consideration 743 345 1,088 68%
High 243 203 446 54%
Total 6,550 1,551 8,101 81%
15
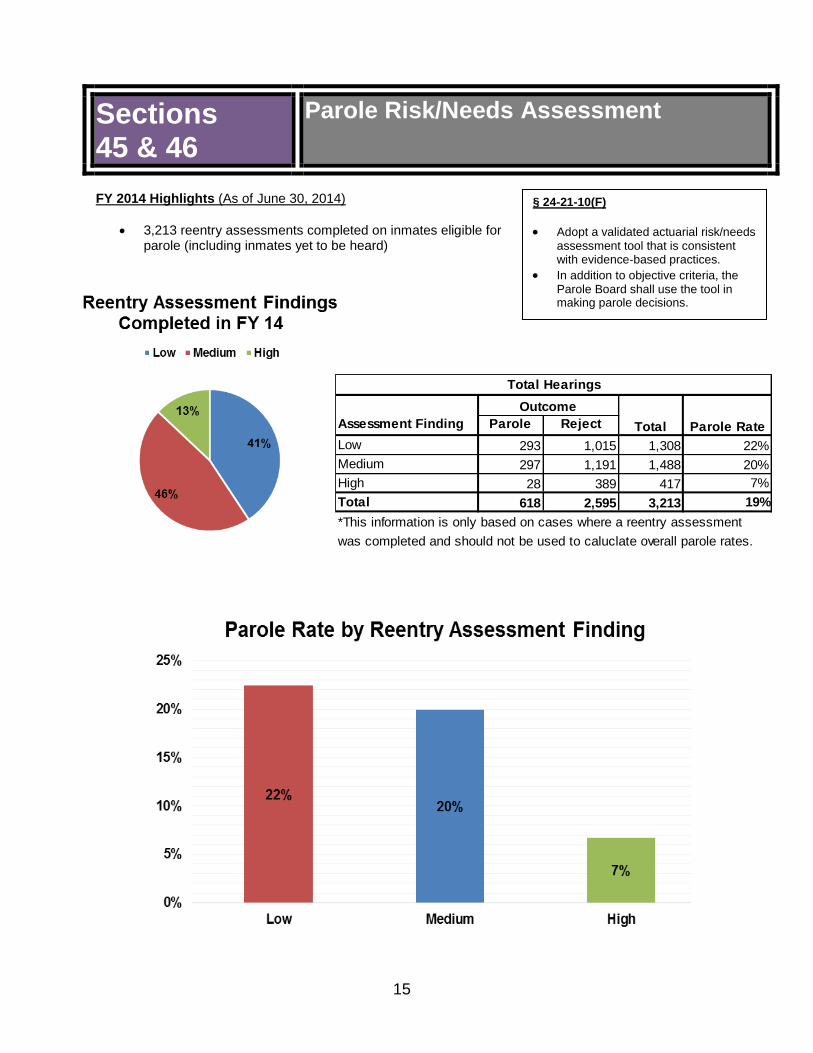
§ 24-21-10(F)
Adopt a validated actuarial risk/needs assessment tool that is consistent with evidence-based practices.
In addition to objective criteria, the Parole Board shall use the tool in making parole decisions.
Sections 45 & 46
Parole Risk/Needs Assessment
FY 2014 Highlights (As of June 30, 2014)
3,213 reentry assessments completed on inmates eligible for parole (including inmates yet to be heard)
Assessment Finding Parole Reject
Low 293 1,015 1,308 22%
Medium 297 1,191 1,488 20%
High 28 389 417 7%
Total 618 2,595 3,213 19%
*This information is only based on cases where a reentry assessment
was completed and should not be used to caluclate overall parole rates.
Outcome
Total Parole Rate
Total Hearings
16
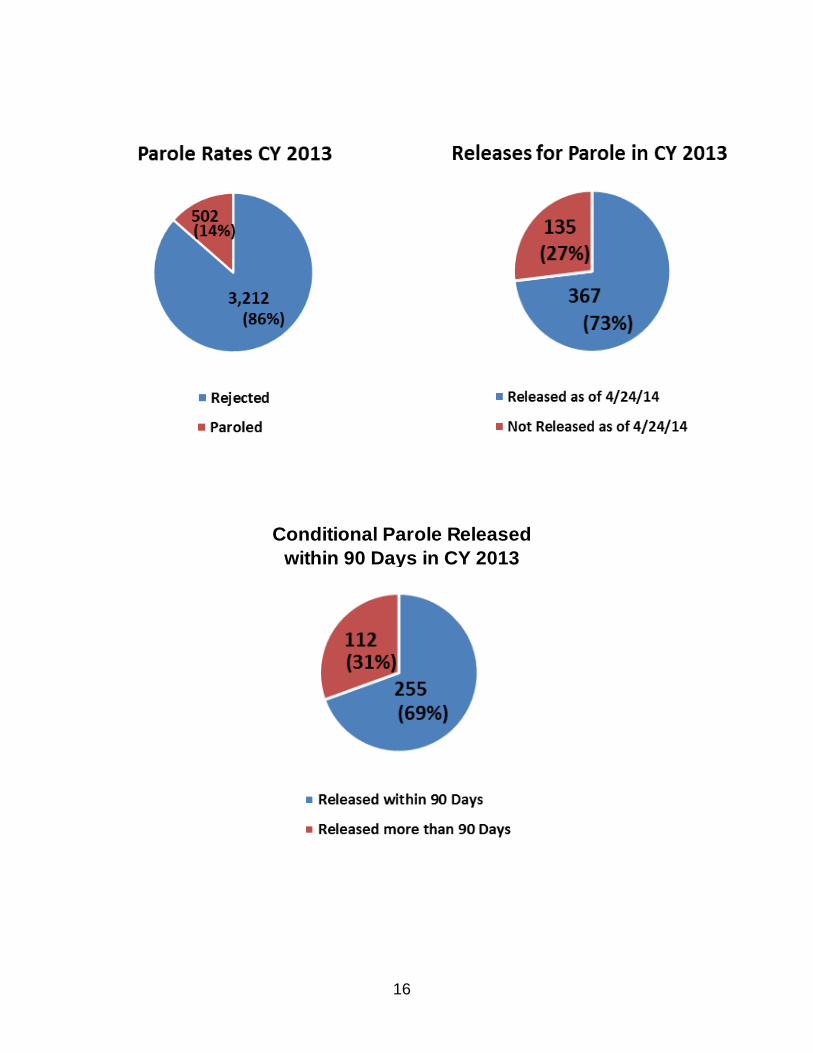
Conditional Parole Released
within 90 Days in CY 2013
17
§ 24-21-10
Requires new members of the Parole Board to complete a comprehensive training course developed by SCDPPPS using training components consistent with those offered by the National Institute of Corrections or the American Probation and Parole Association.
Requires each member of the Parole Board to compete eight hours of annual training.
§ 24-21-32
Statutory eligibility – offense date of January 1, 2011 or later, and a minimum of two years incarceration must be served (includes credit for time served).
Mandatory release if criteria are met.
FY 2014 Highlights (As of June 30, 2014)
In addition to the required annual eight (8) hours of training, all Parole Board members completed an additional six (6) hours of training
Two (2) Parole Board members completed the National Institute of Corrections’ Orientation for Parole Board Members program
Annual Training:
Pardon Process
General Overview of the Sentencing Reform Act
Parole Decision Making Process Matrix
COMPAS Review and Update
Self-Paced In Class Education Program (SPICE) and Parole Employment Program (PEP)
Domestic Violence and Abuse
Release Programs
Cognitive Behavior Therapy, SCDPPPS Community Aftercare and Addictions Treatment Unit at SCDC
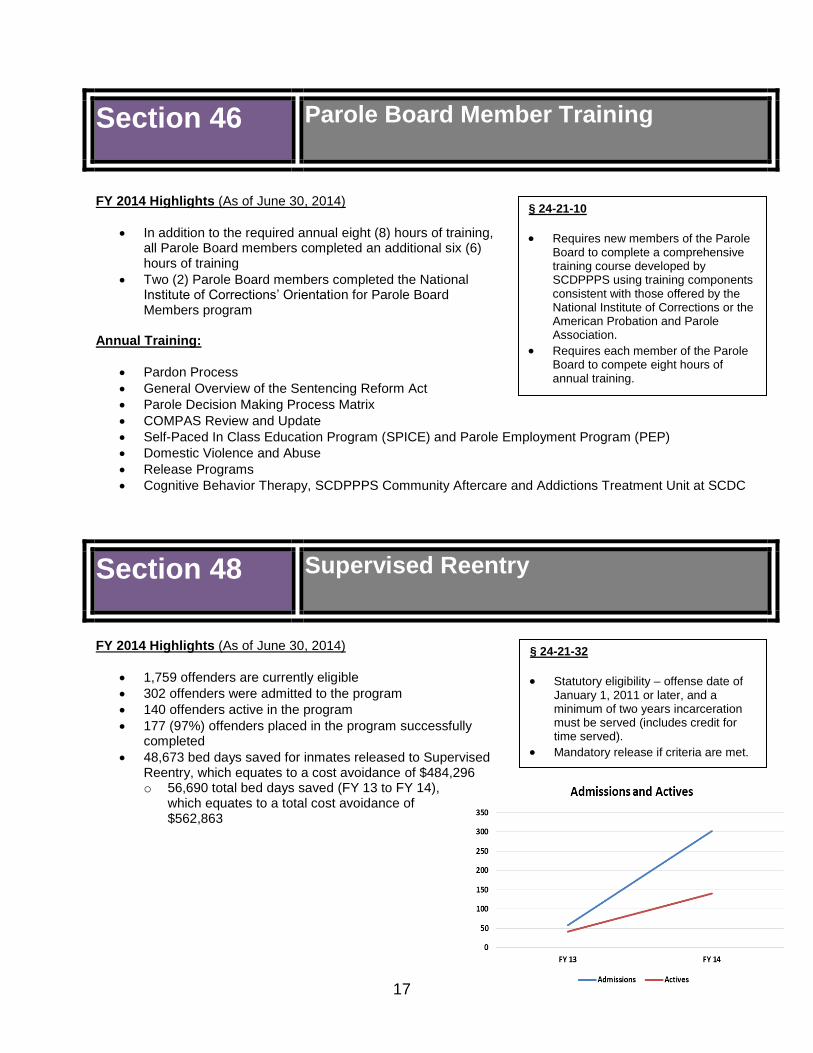
FY 2014 Highlights (As of June 30, 2014)
1,759 offenders are currently eligible
302 offenders were admitted to the program
140 offenders active in the program
177 (97%) offenders placed in the program successfully completed
48,673 bed days saved for inmates released to Supervised Reentry, which equates to a cost avoidance of $484,296 o 56,690 total bed days saved (FY 13 to FY 14),
which equates to a total cost avoidance of $562,863
Section 46 Parole Board Member Training
Section 48 Supervised Reentry
18
§ 24-21-280
Statutory eligibility – offense date of January 1, 2011 or later, and an aggregate of 366 days or more of supervision (with no break in supervision).
Department must identify, calculate and award compliance credits to eligible offenders.
Statute requires offenders to be current on all their financial obligations.
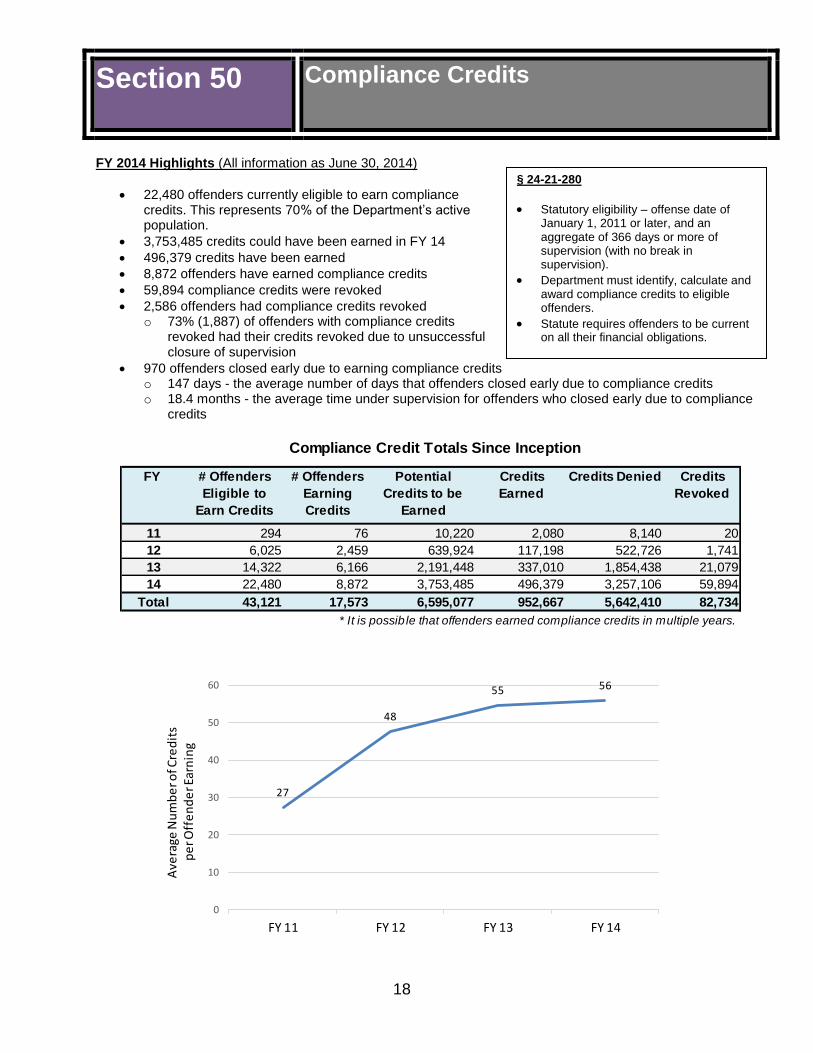
FY 2014 Highlights (All information as June 30, 2014)
22,480 offenders currently eligible to earn compliance credits. This represents 70% of the Department’s active population.
3,753,485 credits could have been earned in FY 14
496,379 credits have been earned
8,872 offenders have earned compliance credits
59,894 compliance credits were revoked
2,586 offenders had compliance credits revoked o 73% (1,887) of offenders with compliance credits
revoked had their credits revoked due to unsuccessful closure of supervision
970 offenders closed early due to earning compliance credits o 147 days - the average number of days that offenders closed early due to compliance credits o 18.4 months - the average time under supervision for offenders who closed early due to compliance
credits
FY
11 294 76 10,220 2,080 8,140 20
12 6,025 2,459 639,924 117,198 522,726 1,741
13 14,322 6,166 2,191,448 337,010 1,854,438 21,079
14 22,480 8,872 3,753,485 496,379 3,257,106 59,894
Total 43,121 17,573 6,595,077 952,667 5,642,410 82,734
Compliance Credit Totals Since Inception
* It is possib le that offenders earned compliance credits in multiple years.
# Offenders
Earning
Credits
Potential
Credits to be
Earned
# Offenders
Eligible to
Earn Credits
Credits Denied Credits
Revoked
Credits
Earned
27
48
55 56
0
10
20
30
40
50
60
FY 11 FY 12 FY 13 FY 14
Ave
rage
Nu
mb
er o
f Cre
dit
s p
er O
ffe
nd
er E
arn
ing
Section 50
Compliance Credits
19
§ 24-21-110
Department will identify, develop, and implement alternative sanctions to address compliance violations.
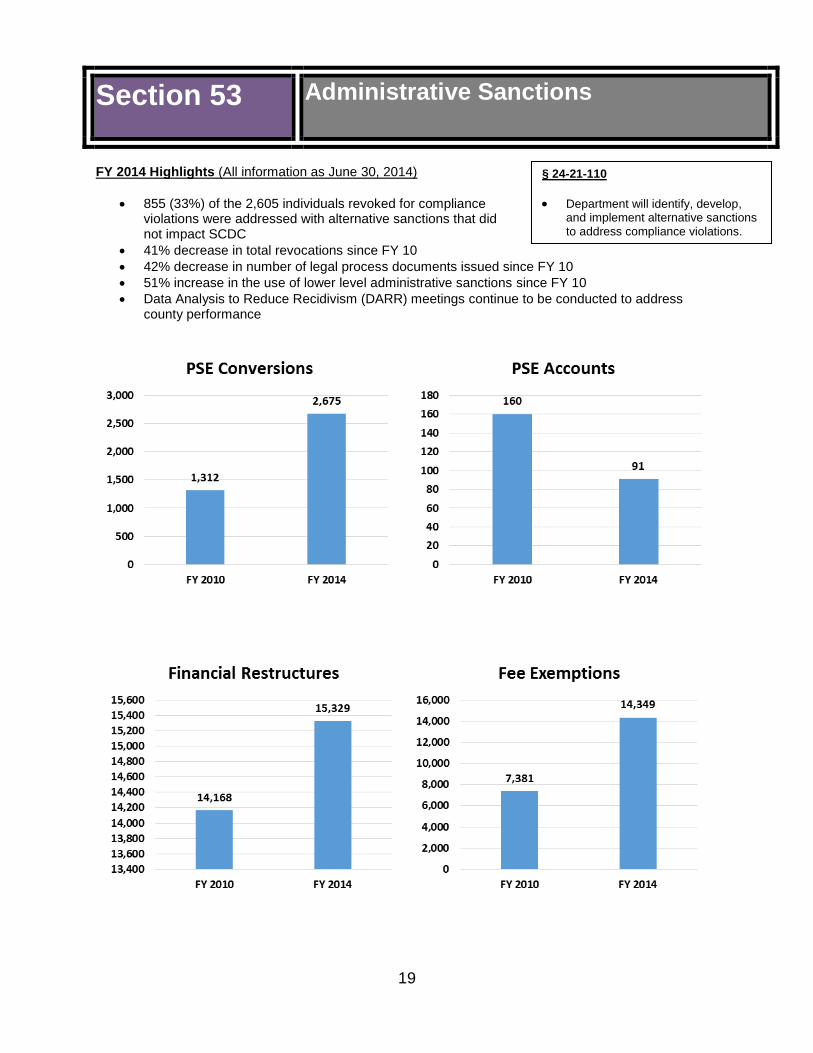
FY 2014 Highlights (All information as June 30, 2014)
855 (33%) of the 2,605 individuals revoked for compliance violations were addressed with alternative sanctions that did not impact SCDC
41% decrease in total revocations since FY 10
42% decrease in number of legal process documents issued since FY 10
51% increase in the use of lower level administrative sanctions since FY 10
Data Analysis to Reduce Recidivism (DARR) meetings continue to be conducted to address county performance
Section 53 Administrative Sanctions
20
* Home visits for standard offenders
after first 30 days of supervision
FY 2014
11,754
9,823
8,500
9,000
9,500
10,000
10,500
11,000
11,500
12,000
FY 2010 FY 2014
Home Visits *
5,367
20,012
0
5,000
10,000
15,000
20,000
25,000
FY 2010 FY 2014
Verbal/Written Reprimands
2,535
2,062
0
500
1,000
1,500
2,000
2,500
3,000
FY 2010 FY 2014
Other Admin Sanctions
Administrative Sanctions and Legal Process
FY 2010
FY 2014
Change FY 2014 to FY 2014
# %
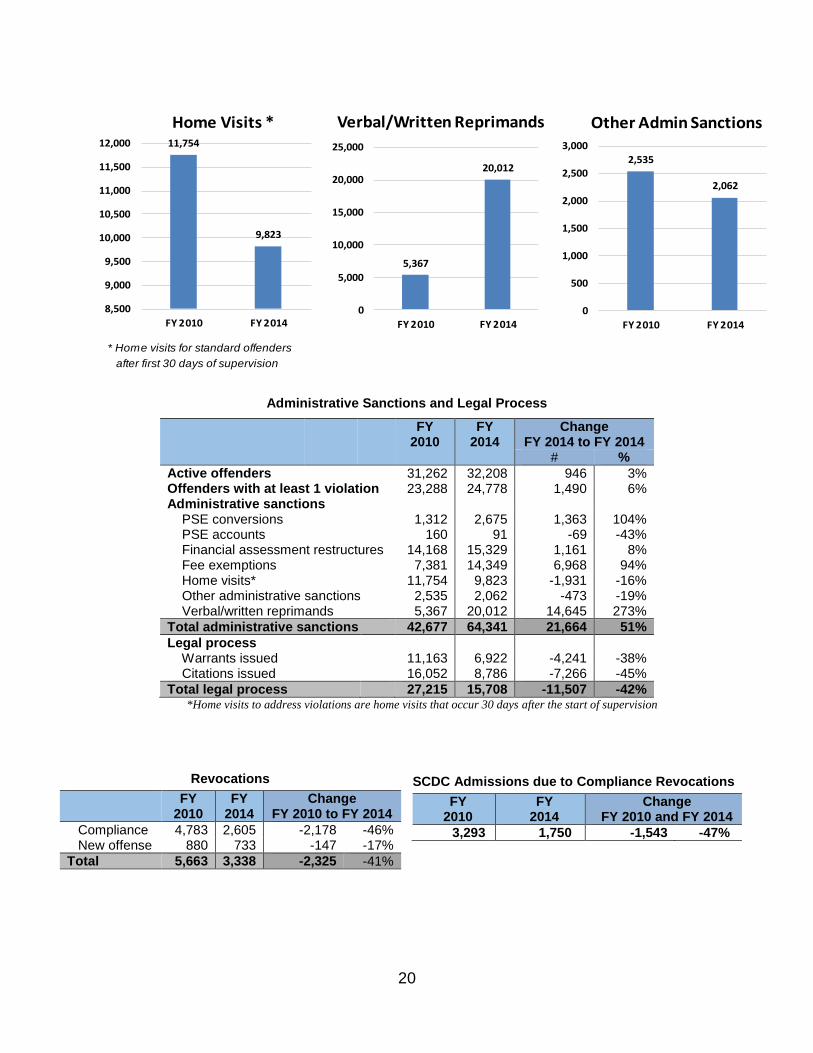
Active offenders 31,262 32,208 946 3% Offenders with at least 1 violation 23,288 24,778 1,490 6% Administrative sanctions PSE conversions 1,312 2,675 1,363 104% PSE accounts 160 91 -69 -43% Financial assessment restructures 14,168 15,329 1,161 8% Fee exemptions 7,381 14,349 6,968 94% Home visits* 11,754 9,823 -1,931 -16% Other administrative sanctions 2,535 2,062 -473 -19% Verbal/written reprimands 5,367 20,012 14,645 273%
Total administrative sanctions 42,677 64,341 21,664 51%
Legal process Warrants issued 11,163 6,922 -4,241 -38% Citations issued 16,052 8,786 -7,266 -45%
Total legal process 27,215 15,708 -11,507 -42% *Home visits to address violations are home visits that occur 30 days after the start of supervision
Revocations
FY 2010
FY 2014
Change FY 2010 to FY 2014
Compliance 4,783 2,605 -2,178 -46% New offense 880 733 -147 -17%
Total 5,663 3,338 -2,325 -41%
SCDC Admissions due to Compliance Revocations
FY 2010
FY 2014
Change FY 2010 and FY 2014
3,293 1,750 -1,543 -47%
21
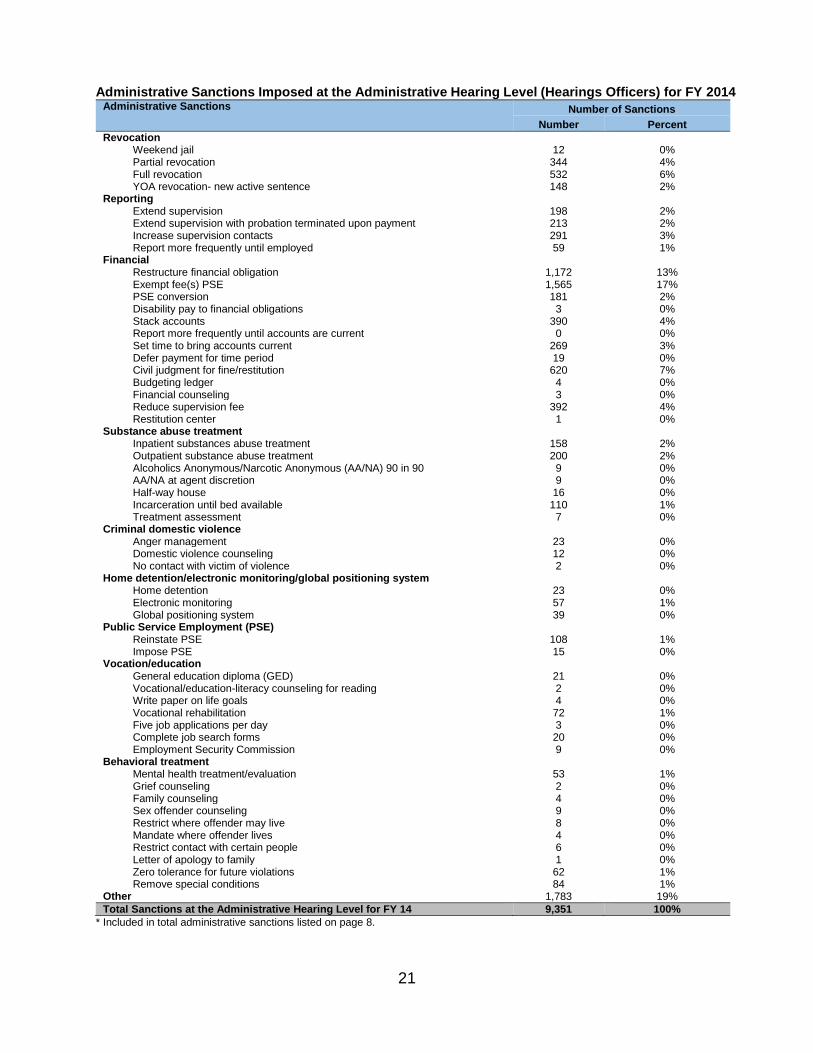
Administrative Sanctions Imposed at the Administrative Hearing Level (Hearings Officers) for FY 2014 Administrative Sanctions Number of Sanctions
Number Percent
Revocation Weekend jail 12 0% Partial revocation 344 4% Full revocation 532 6% YOA revocation- new active sentence 148 2% Reporting Extend supervision 198 2% Extend supervision with probation terminated upon payment 213 2% Increase supervision contacts 291 3% Report more frequently until employed 59 1% Financial Restructure financial obligation 1,172 13% Exempt fee(s) PSE 1,565 17% PSE conversion 181 2% Disability pay to financial obligations 3 0% Stack accounts 390 4% Report more frequently until accounts are current 0 0% Set time to bring accounts current 269 3% Defer payment for time period 19 0% Civil judgment for fine/restitution 620 7% Budgeting ledger 4 0% Financial counseling 3 0% Reduce supervision fee 392 4% Restitution center 1 0% Substance abuse treatment Inpatient substances abuse treatment 158 2% Outpatient substance abuse treatment 200 2% Alcoholics Anonymous/Narcotic Anonymous (AA/NA) 90 in 90 9 0% AA/NA at agent discretion 9 0% Half-way house 16 0% Incarceration until bed available 110 1% Treatment assessment 7 0% Criminal domestic violence Anger management 23 0% Domestic violence counseling 12 0% No contact with victim of violence 2 0% Home detention/electronic monitoring/global positioning system Home detention 23 0% Electronic monitoring 57 1% Global positioning system 39 0% Public Service Employment (PSE) Reinstate PSE 108 1% Impose PSE 15 0% Vocation/education General education diploma (GED) 21 0% Vocational/education-literacy counseling for reading 2 0% Write paper on life goals 4 0% Vocational rehabilitation 72 1% Five job applications per day 3 0% Complete job search forms 20 0% Employment Security Commission 9 0% Behavioral treatment Mental health treatment/evaluation 53 1% Grief counseling 2 0% Family counseling 4 0% Sex offender counseling 9 0% Restrict where offender may live 8 0% Mandate where offender lives 4 0% Restrict contact with certain people 6 0% Letter of apology to family 1 0% Zero tolerance for future violations 62 1% Remove special conditions 84 1% Other 1,783 19%
Total Sanctions at the Administrative Hearing Level for FY 14 9,351 100%
* Included in total administrative sanctions listed on page 8.
22
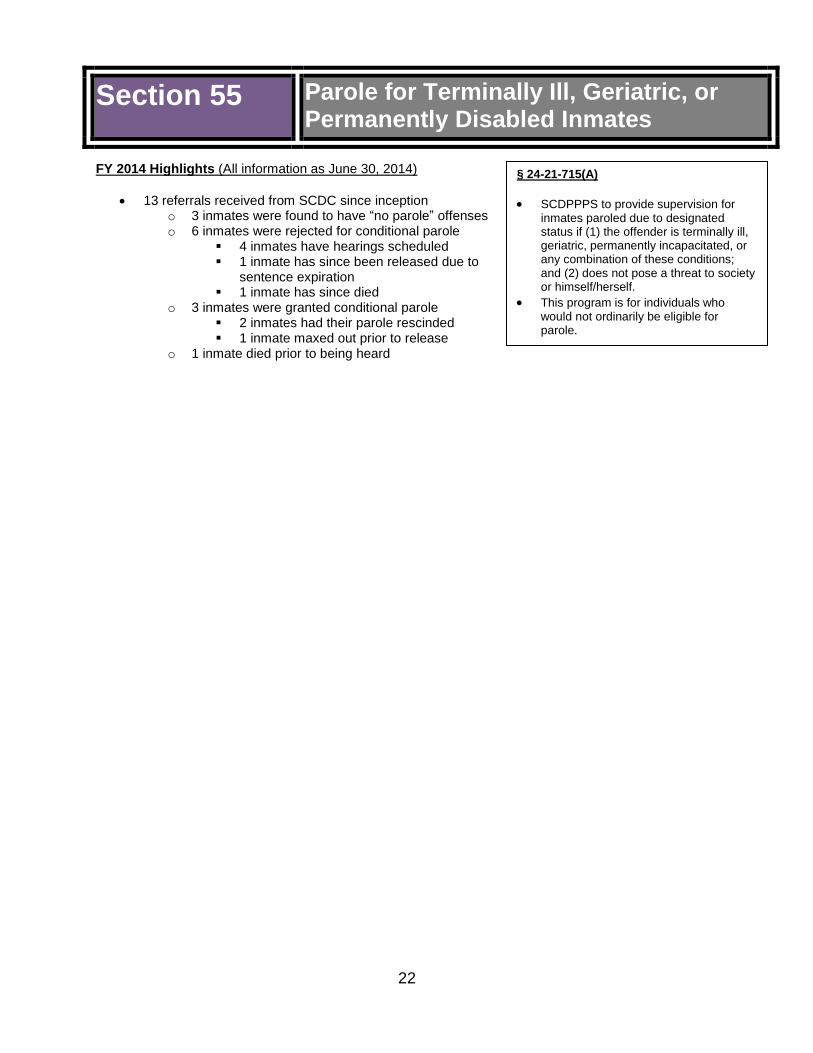
§ 24-21-715(A)
SCDPPPS to provide supervision for inmates paroled due to designated status if (1) the offender is terminally ill, geriatric, permanently incapacitated, or any combination of these conditions; and (2) does not pose a threat to society or himself/herself.
This program is for individuals who would not ordinarily be eligible for parole.
FY 2014 Highlights (All information as June 30, 2014)
13 referrals received from SCDC since inception o 3 inmates were found to have “no parole” offenses o 6 inmates were rejected for conditional parole
4 inmates have hearings scheduled 1 inmate has since been released due to
sentence expiration 1 inmate has since died
o 3 inmates were granted conditional parole 2 inmates had their parole rescinded 1 inmate maxed out prior to release
o 1 inmate died prior to being heard
Section 55 Parole for Terminally Ill, Geriatric, or Permanently Disabled Inmates
23
In the past year, SCDPPPS continued to demonstrate remarkable progress in the implementation of
evidence-influenced correctional practices to reduce offender recidivism. Much like other community
corrections agencies faced with the pressure to do more with less, the Department is committed to the
use of innovative, cost-effective strategies proven to reduce new crime and new victimization in South
Carolina. To achieve the all-encompassing goal of implementing evidence-based practices, recognized
as the nexus between creating safer communities and facilitating positive behavioral change,
community correctional agencies must build the capacity to handle shifts in business practices as well
as viable resources to support long-term success and sustainability.
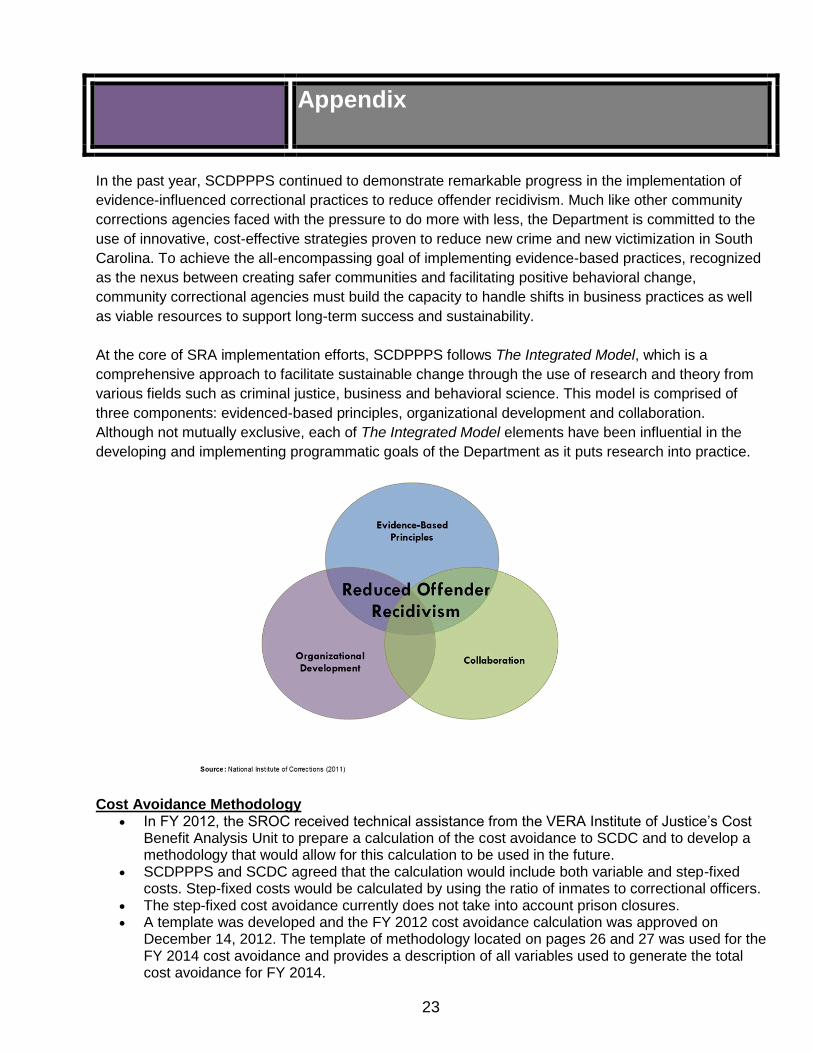
At the core of SRA implementation efforts, SCDPPPS follows The Integrated Model, which is a
comprehensive approach to facilitate sustainable change through the use of research and theory from
various fields such as criminal justice, business and behavioral science. This model is comprised of
three components: evidenced-based principles, organizational development and collaboration.
Although not mutually exclusive, each of The Integrated Model elements have been influential in the
developing and implementing programmatic goals of the Department as it puts research into practice.
Cost Avoidance Methodology
In FY 2012, the SROC received technical assistance from the VERA Institute of Justice’s Cost Benefit Analysis Unit to prepare a calculation of the cost avoidance to SCDC and to develop a methodology that would allow for this calculation to be used in the future.
SCDPPPS and SCDC agreed that the calculation would include both variable and step-fixed costs. Step-fixed costs would be calculated by using the ratio of inmates to correctional officers.
The step-fixed cost avoidance currently does not take into account prison closures. A template was developed and the FY 2012 cost avoidance calculation was approved on
December 14, 2012. The template of methodology located on pages 26 and 27 was used for the FY 2014 cost avoidance and provides a description of all variables used to generate the total cost avoidance for FY 2014.
Appendix
24
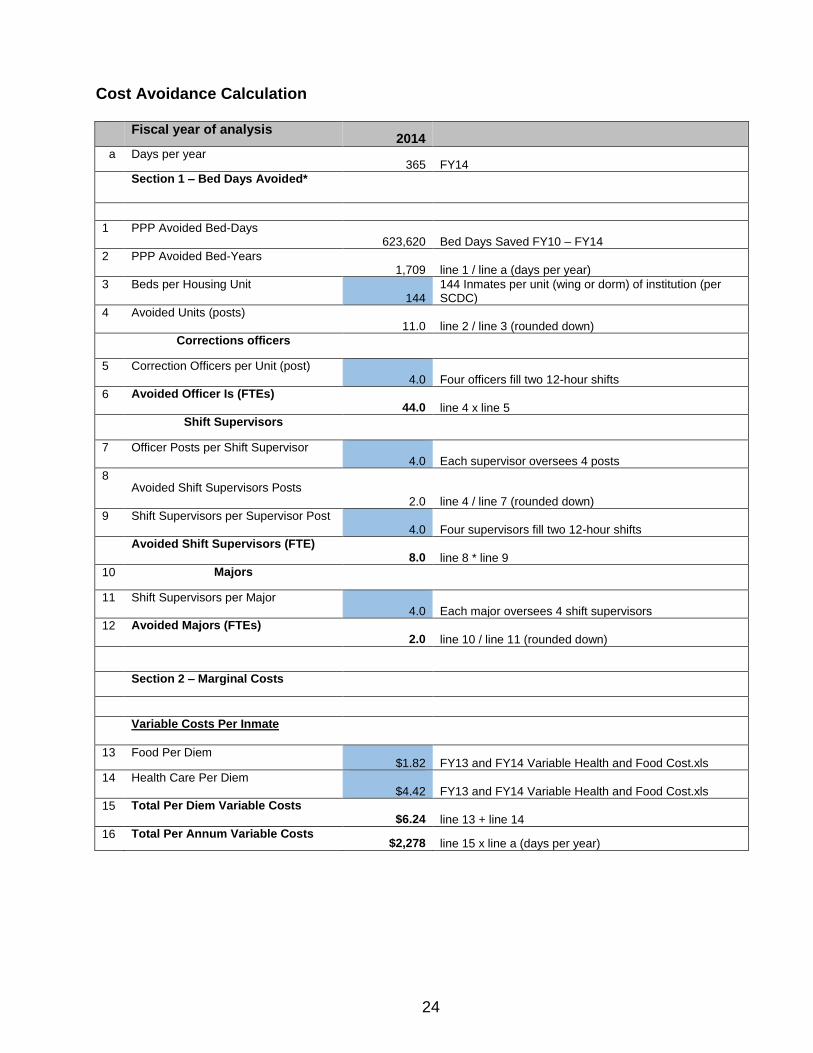
Cost Avoidance Calculation Fiscal year of analysis
2014 a Days per year
365 FY14
Section 1 – Bed Days Avoided*
1 PPP Avoided Bed-Days 623,620 Bed Days Saved FY10 – FY14
2 PPP Avoided Bed-Years 1,709 line 1 / line a (days per year)
3 Beds per Housing Unit 144
144 Inmates per unit (wing or dorm) of institution (per SCDC)
4 Avoided Units (posts) 11.0 line 2 / line 3 (rounded down)
Corrections officers
5 Correction Officers per Unit (post) 4.0 Four officers fill two 12-hour shifts
6 Avoided Officer Is (FTEs) 44.0 line 4 x line 5
Shift Supervisors
7 Officer Posts per Shift Supervisor 4.0 Each supervisor oversees 4 posts
8 Avoided Shift Supervisors Posts
2.0 line 4 / line 7 (rounded down)
9 Shift Supervisors per Supervisor Post 4.0 Four supervisors fill two 12-hour shifts
Avoided Shift Supervisors (FTE) 8.0 line 8 * line 9
10 Majors
11 Shift Supervisors per Major 4.0 Each major oversees 4 shift supervisors
12 Avoided Majors (FTEs) 2.0 line 10 / line 11 (rounded down)
Section 2 – Marginal Costs
Variable Costs Per Inmate
13 Food Per Diem $1.82 FY13 and FY14 Variable Health and Food Cost.xls
14 Health Care Per Diem $4.42 FY13 and FY14 Variable Health and Food Cost.xls
15 Total Per Diem Variable Costs $6.24 line 13 + line 14
16 Total Per Annum Variable Costs $2,278 line 15 x line a (days per year)
25
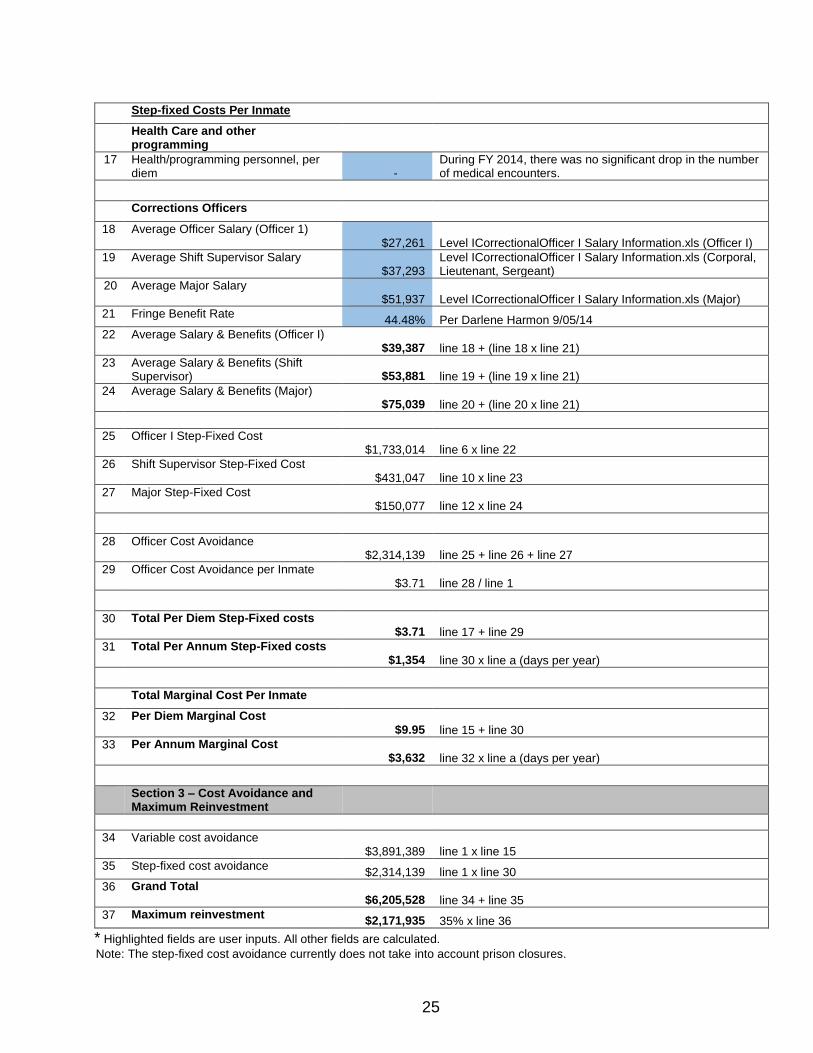
Step-fixed Costs Per Inmate
Health Care and other programming
17 Health/programming personnel, per diem -
During FY 2014, there was no significant drop in the number of medical encounters.
Corrections Officers
18 Average Officer Salary (Officer 1) $27,261 Level ICorrectionalOfficer I Salary Information.xls (Officer I)
19 Average Shift Supervisor Salary $37,293
Level ICorrectionalOfficer I Salary Information.xls (Corporal, Lieutenant, Sergeant)
20 Average Major Salary $51,937 Level ICorrectionalOfficer I Salary Information.xls (Major)
21 Fringe Benefit Rate 44.48% Per Darlene Harmon 9/05/14
22 Average Salary & Benefits (Officer I) $39,387 line 18 + (line 18 x line 21)
23 Average Salary & Benefits (Shift Supervisor)
$53,881 line 19 + (line 19 x line 21)
24 Average Salary & Benefits (Major) $75,039 line 20 + (line 20 x line 21)
25
Officer I Step-Fixed Cost $1,733,014 line 6 x line 22
26 Shift Supervisor Step-Fixed Cost $431,047 line 10 x line 23
27 Major Step-Fixed Cost $150,077 line 12 x line 24
28 Officer Cost Avoidance $2,314,139 line 25 + line 26 + line 27
29 Officer Cost Avoidance per Inmate $3.71 line 28 / line 1
30 Total Per Diem Step-Fixed costs $3.71 line 17 + line 29
31 Total Per Annum Step-Fixed costs $1,354 line 30 x line a (days per year)
Total Marginal Cost Per Inmate
32 Per Diem Marginal Cost $9.95 line 15 + line 30
33 Per Annum Marginal Cost $3,632 line 32 x line a (days per year)
Section 3 – Cost Avoidance and Maximum Reinvestment
34 Variable cost avoidance $3,891,389 line 1 x line 15
35 Step-fixed cost avoidance $2,314,139 line 1 x line 30
36 Grand Total $6,205,528 line 34 + line 35
37 Maximum reinvestment $2,171,935 35% x line 36
* Highlighted fields are user inputs. All other fields are calculated.
Note: The step-fixed cost avoidance currently does not take into account prison closures.
26
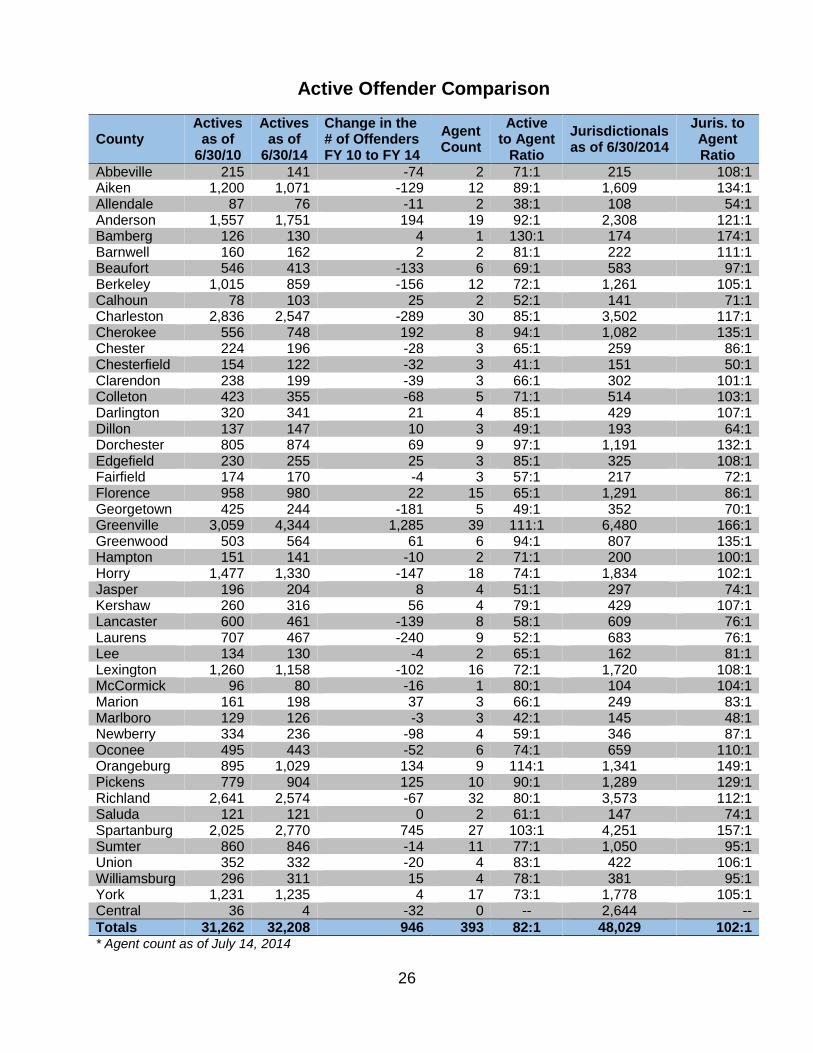
Active Offender Comparison
County Actives
as of 6/30/10
Actives as of
6/30/14
Change in the # of Offenders FY 10 to FY 14
Agent Count
Active to Agent
Ratio
Jurisdictionals as of 6/30/2014
Juris. to Agent Ratio
Abbeville 215 141 -74 2 71:1 215 108:1 Aiken 1,200 1,071 -129 12 89:1 1,609 134:1 Allendale 87 76 -11 2 38:1 108 54:1 Anderson 1,557 1,751 194 19 92:1 2,308 121:1 Bamberg 126 130 4 1 130:1 174 174:1 Barnwell 160 162 2 2 81:1 222 111:1 Beaufort 546 413 -133 6 69:1 583 97:1 Berkeley 1,015 859 -156 12 72:1 1,261 105:1 Calhoun 78 103 25 2 52:1 141 71:1 Charleston 2,836 2,547 -289 30 85:1 3,502 117:1 Cherokee 556 748 192 8 94:1 1,082 135:1 Chester 224 196 -28 3 65:1 259 86:1 Chesterfield 154 122 -32 3 41:1 151 50:1 Clarendon 238 199 -39 3 66:1 302 101:1 Colleton 423 355 -68 5 71:1 514 103:1 Darlington 320 341 21 4 85:1 429 107:1 Dillon 137 147 10 3 49:1 193 64:1 Dorchester 805 874 69 9 97:1 1,191 132:1 Edgefield 230 255 25 3 85:1 325 108:1 Fairfield 174 170 -4 3 57:1 217 72:1 Florence 958 980 22 15 65:1 1,291 86:1 Georgetown 425 244 -181 5 49:1 352 70:1 Greenville 3,059 4,344 1,285 39 111:1 6,480 166:1 Greenwood 503 564 61 6 94:1 807 135:1 Hampton 151 141 -10 2 71:1 200 100:1 Horry 1,477 1,330 -147 18 74:1 1,834 102:1 Jasper 196 204 8 4 51:1 297 74:1 Kershaw 260 316 56 4 79:1 429 107:1 Lancaster 600 461 -139 8 58:1 609 76:1 Laurens 707 467 -240 9 52:1 683 76:1 Lee 134 130 -4 2 65:1 162 81:1 Lexington 1,260 1,158 -102 16 72:1 1,720 108:1 McCormick 96 80 -16 1 80:1 104 104:1 Marion 161 198 37 3 66:1 249 83:1 Marlboro 129 126 -3 3 42:1 145 48:1 Newberry 334 236 -98 4 59:1 346 87:1 Oconee 495 443 -52 6 74:1 659 110:1 Orangeburg 895 1,029 134 9 114:1 1,341 149:1 Pickens 779 904 125 10 90:1 1,289 129:1 Richland 2,641 2,574 -67 32 80:1 3,573 112:1 Saluda 121 121 0 2 61:1 147 74:1 Spartanburg 2,025 2,770 745 27 103:1 4,251 157:1 Sumter 860 846 -14 11 77:1 1,050 95:1 Union 352 332 -20 4 83:1 422 106:1 Williamsburg 296 311 15 4 78:1 381 95:1 York 1,231 1,235 4 17 73:1 1,778 105:1 Central 36 4 -32 0 -- 2,644 --
Totals 31,262 32,208 946 393 82:1 48,029 102:1 * Agent count as of July 14, 2014

27