research international journal of production fabrication of a tft-lcd mainly consists of three...
TRANSCRIPT

This article was downloaded by: [National Chiao Tung University 國立交通大學]On: 24 April 2014, At: 18:45Publisher: Taylor & FrancisInforma Ltd Registered in England and Wales Registered Number: 1072954 Registeredoffice: Mortimer House, 37-41 Mortimer Street, London W1T 3JH, UK
International Journal of ProductionResearchPublication details, including instructions for authors andsubscription information:http://www.tandfonline.com/loi/tprs20
A GA-based method to reduce materialhandling: the case of TFT-LCD arrayFabs in TaiwanShian-Shyong Tseng a c , Fengming M. Chang b , Yian-Shu Chu a &Pi-Ju Chi aa Department of Computer Science , National Chiao TungUniversity , Hsinchu, Taiwanb Department of Information Management , National TaitungJunior College , Taitung, Taiwanc Department of Information Science and Applications , AsiaUniversity , Taichung, TaiwanPublished online: 09 Feb 2011.
To cite this article: Shian-Shyong Tseng , Fengming M. Chang , Yian-Shu Chu & Pi-Ju Chi (2011)A GA-based method to reduce material handling: the case of TFT-LCD array Fabs in Taiwan,International Journal of Production Research, 49:22, 6691-6711
To link to this article: http://dx.doi.org/10.1080/00207543.2010.495086
PLEASE SCROLL DOWN FOR ARTICLE
Taylor & Francis makes every effort to ensure the accuracy of all the information (the“Content”) contained in the publications on our platform. However, Taylor & Francis,our agents, and our licensors make no representations or warranties whatsoever as tothe accuracy, completeness, or suitability for any purpose of the Content. Any opinionsand views expressed in this publication are the opinions and views of the authors,and are not the views of or endorsed by Taylor & Francis. The accuracy of the Contentshould not be relied upon and should be independently verified with primary sourcesof information. Taylor and Francis shall not be liable for any losses, actions, claims,proceedings, demands, costs, expenses, damages, and other liabilities whatsoever orhowsoever caused arising directly or indirectly in connection with, in relation to or arisingout of the use of the Content.
This article may be used for research, teaching, and private study purposes. Anysubstantial or systematic reproduction, redistribution, reselling, loan, sub-licensing,systematic supply, or distribution in any form to anyone is expressly forbidden. Terms &

Conditions of access and use can be found at http://www.tandfonline.com/page/terms-and-conditions
Dow
nloa
ded
by [
Nat
iona
l Chi
ao T
ung
Uni
vers
ity ]
at 1
8:45
24
Apr
il 20
14

International Journal of Production ResearchVol. 49, No. 22, 15 November 2011, 6691–6711
A GA-based method to reduce material handling: the case of
TFT-LCD array Fabs in Taiwan
Shian-Shyong Tsengac*, Fengming M. Changb, Yian-Shu Chua and Pi-Ju Chia
aDepartment of Computer Science, National Chiao Tung University, Hsinchu, Taiwan;bDepartment of Information Management, National Taitung Junior College, Taitung, Taiwan;
cDepartment of Information Science and Applications, Asia University, Taichung, Taiwan
(Received 7 July 2009; final version received 23 April 2010)
This study proposes a genetic algorithm (GA)-based Material Handling StrategyFunction (MHSF) method to increase the productivity of a TFT-LCD arrayfabrication to improve the traditional FIFO method in TFT-LCD fabrication bythe reduction of the material handling for a Rail Guided Vehicle (RGV), becausecosts of material handling count up to about 50% of production costs. In thisarticle, the MHSF is provided to help material handling commands choice, wherea novel GA approach is used to adapt the weights of affecting factors in thefunction. Finally, to evaluate the performance of the proposed method,experiments using the data from a major TFT-LCD manufacturing plant inTaiwan have been carried out, and the results indicate that it can indeed reducefabrication time and increase productivity.
Keywords: Material Handling Strategy Function, TFT-LCD, RGV, materialhandling, array process, productivity
1. Introduction
The way to decrease activities of material handling, waiting time, and material storage, areimportant issues to increasing productivity. In manufacturing, the largest percent ofproduct cost is related to material handling (Yang et al. 2005). Material handling cannotadd product value but does waste costs. Reducing lead times and costs become importantfactors for material handling in a Flexible Manufacturing System (FMS) (Kulak 2005).Material handling accounts for 30–75% of the total manufacturing cost, but a good designof a material handling system can reduce a plant’s costs by 15–30% (Kulak 2005). Anautomatic guided vehicle (AGV), including the rail guided vehicle (RGV) discussed in thisstudy, is a way to reduce the cost of material handling. An AGV can be a buffer todecrease storage activities (Wu and Zhou 2007), and an efficient policy of AGV candecrease waiting time and material handling time. Hence, this study aimed to better thepolicy of RGV material handling by proposing a genetic algorithm-based MaterialHandling Strategy Function (MHSF) to decrease material handling time. Raw data froma major Thin Film Transistor Liquid Crystal Display (TFT-LCD) factory are offered asan example for MHSF.
TFT-LCD manufacturing is an important industry in Taiwan (Park et al. 2003, Hung2006, Pan et al. 2007). It has become an important technology because it is widely used in
*Corresponding author. Email: [email protected]
ISSN 0020–7543 print/ISSN 1366–588X online
� 2011 Taylor & Francis
http://dx.doi.org/10.1080/00207543.2010.495086
http://www.tandfonline.com
Dow
nloa
ded
by [
Nat
iona
l Chi
ao T
ung
Uni
vers
ity ]
at 1
8:45
24
Apr
il 20
14

electric devices, such as cell phones, PDAs, computers, and TVs (Lu and Tsai 2004, Tsaiand Hung 2005, Tsai et al. 2007, Huang et al. 2009). With a piece of glass substrate, TFTis a switch to control light and shade of each pixel on the LCD to reach color purposes.The fabrication of a TFT-LCD mainly consists of three processes: array, cell, and moduleprocesses (Lin et al. 2006). The array process, including the sub-processes of depot, photo,etch, and strip of glass substrates, creates TFT circuit. Several machines are put in an areafor the array process and each machine in the array process can perform only oneproduction operation. Each array process may need to perform the same operation morethan once as a normal FMS does. Therefore, a lot of material handling work occursamong these machines in the array fabrication. As for the cell process, it only putsmachines into a production line by combining colour filter and TFT panel, pouring liquidcrystal into the panel, and cutting the LCD panel into the final product size without usingany extra material handling facilities. The module process adds driver IC (integratedcircuit) into the LCD panel and prepares to ship the final products only. Because machinesfor the array process are costly, high productivity in the array process can reducefabrication cost, and a material handling strategy can influence the effectiveness ofproductivity. Therefore, how to design the array process is the key issue for all TFT-LCDmanufacturers.
2. Preliminaries
In this study, GA-based MHSF is applied in the material handling strategy to increase theTFT-LCD fabrication performance. In this section, related works about material handlingefficiencies, GA, and TFT-LCD fabrication performances are reviewed.
2.1 Material handling system
A material handling system which is used to transport parts, WIPs, and products withinmachines or storehouses plays an important role in a manufacturing system (Gabbert andBrown 1998, Dongmin et al. 2006). AGVs and RGVs which can load, unload, andtransport materials automatically are the most often used facilities for material handling tosave costs in a manufacturing system (Heragu 1997, Jawahar et al. 1998, Malmborg 2003,Berman et al. 2003, Wu and Zhou 2005). Gabbert and Brown (1998) pointed out thatmaterial handling and its relative overhead account for about 55% of product cost. Also,Asef-Vaziri et al. (2008) mentioned that 20–50% of the total production costs are formaterial handling. Therefore, it is very important to have an efficient method to reduce thecost of the material handling system. One previous research in 1994, by Lee et al. proposeda system modeled by Petri Nets to integrate AGV models for material handling andmodels for part processing into a single coherent model to reduce labor cost in a flexiblemanufacturing system (FMS) (Lee et al. 1994). In 2004, Wakabayashi et al. developeda high speed automated material handling system to shorten cycle time by one half or lesswith new concepts, hardware improvements, and new operation methods in a waferprocess for the 300-mm fab (Wakabayashi et al. 2004). Later, Wu et al. (2007) showed thata robot or an AGV can be both a material handling device and a buffer. In their study,a resource-oriented Petri Nets (ROPN) was modeled and a new policy was proposedby treating robots as both material handling devices and buffers. At the same time,Nazzal et al. (2007) proposed an analytical approach to assess the expected time of an
6692 S.-S. Tseng et al.
Dow
nloa
ded
by [
Nat
iona
l Chi
ao T
ung
Uni
vers
ity ]
at 1
8:45
24
Apr
il 20
14

automated material handling system for lots ready to move in a wafer fab, whileAsef-Vaziri et al. (2008) invented an optimal model for the integrated design of thematerial flow path and the location of the pickup and delivery stations to reduce thematerial handling cost. Recently, Ventura et al. (2009) provided a dynamic programmingalgorithm to locate the idle AGV position and find out the optimal dwell point to minimisethe maximum response time to improve the efficiency of an AGV system. In brief, AGVand RGV can decrease material handling cost, and a suitable strategy for AGV, and RGVcan improve productivity.
2.2 Genetic algorithms
GA which was proposed by Holland (1975) is based on the natural evolution concept.It has been successfully applied in many NP-hard problems in many different areas(Miller et al. 1993). In GA, a chromosome represents a possible solution. With geneticoperations, new generations are created. This process repeats again and again until thenew generation solution cannot improve results. The genetic operations include encoding,evaluation (fitness), crossover, and mutation. An encoding transforms problems intobinary digits to represent chromosomes in GA. The evaluation tests the fitness of thesolution. The crossover and mutation are used to create new generations that are differentfrom their parents (Miller et al. 1993). GA has often been used for FMS schedule ormaterial handling strategy generation (Jawahar et al. 1998). For example, Jawahar et al.proposed a genetic algorithm based method to generate dynamic schedules in FMS(Jawahar et al. 1998). In addition, Liu et al. (2007) presented a genetic approach to agarment handling system strategy in 2007. Our study also applies GA using decimalfraction encoding chromosomes to generate material handling strategies in a TFT-LCDfactory aimed at increasing fabrication productivity. In this study, due to seeking a groupof suitable weights which are between 0 and 1 for our MHSF solution, decimal fractionencoding chromosomes are proposed and applied.
2.3 TFT-LCD
Although the process of production operations for a work-in-process (WIP) is fixed, theWIP may be moved in and out of the same machine more than once. Mainly, the materialhandling device used in a TFT-LCD factory is an RGV. In order to maximise the benefitof material handling, WIPs are grouped by a unit of ‘‘lot’’ containing 20 glass substrates tobe fabricated and moved. Additionally, a factory may be divided into several workingareas according to the different features of machines as shown in Figure 1. For example,there are nine machines, a stocker, and a material handling device in a working area asillustrated in Figure 2, where four machines are with the same machine type Ma and threemachines are with the same machine type Mb.
For a given area, a lot may be moved in and out more than once, but each productionprocess is not necessarily the same. For example in the working areas given in Figure 1,a kind of LCD production is moved through Area A five times:
Start! S! Að1Þ ! Bð1Þ ! Cð1Þ ! Að2Þ ! Bð2Þ ! Eð1Þ ! Að3Þ
! Bð3Þ ! Cð2Þ ! � � � ! Að4Þ ! � � � ! Að5Þ ! � � � ! End
Where A(n) indicates the nth production process in Area A.
International Journal of Production Research 6693
Dow
nloa
ded
by [
Nat
iona
l Chi
ao T
ung
Uni
vers
ity ]
at 1
8:45
24
Apr
il 20
14

When a lot finishes a fabrication process in an area, it is moved to a stocker in the next
area by a RGV. There are two rules for this lot in the next area:
. If the target machine for the next operation is idle, then the lot must be sent to this
idle machine directly.. Otherwise, the lot must be sent to the stocker for waiting.
Within a process of a lot, when an operation in a machine is finished, the following
rules are applied:
. The lot should stay at the current machine and wait for the next machine available
after finishing an operation if no other lot is waiting for the current machine.. The lot should be sent directly to the next desired machine if the machine is idle.. For all lots waiting for a specific machine in the stocker, the lot will be chosen by
the longest waiting time first rule, when the machine is available.
Figure 1. Six working areas in a TFT-LCD array manufactory.
Figure 2. Nine machines, a stocker, and a RGV in a working area.
6694 S.-S. Tseng et al.
Dow
nloa
ded
by [
Nat
iona
l Chi
ao T
ung
Uni
vers
ity ]
at 1
8:45
24
Apr
il 20
14
It should be noted here that all the movements of the lots are made according to thematerial handling commands, where a material handling command consists of the currentposition of a lot and the machine where the lot will be sent to. A RGV performs a materialhandling command by moving to the position of the lot, taking the lot to the RGV,carrying the lot to object position, and taking the lot to the object machine. It may takeabout 20–40 s to perform a material handling command, depending on the distancebetween the positions of RGV and machine.
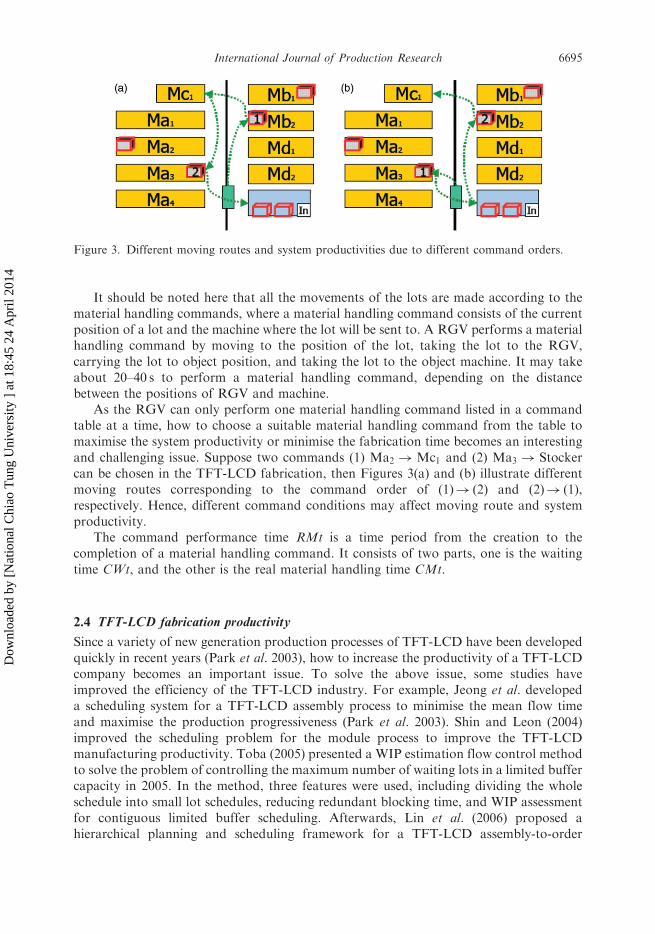
As the RGV can only perform one material handling command listed in a commandtable at a time, how to choose a suitable material handling command from the table tomaximise the system productivity or minimise the fabrication time becomes an interestingand challenging issue. Suppose two commands (1) Ma2 !Mc1 and (2) Ma3! Stockercan be chosen in the TFT-LCD fabrication, then Figures 3(a) and (b) illustrate differentmoving routes corresponding to the command order of (1)! (2) and (2)! (1),respectively. Hence, different command conditions may affect moving route and systemproductivity.
The command performance time RMt is a time period from the creation to thecompletion of a material handling command. It consists of two parts, one is the waitingtime CWt, and the other is the real material handling time CMt.
2.4 TFT-LCD fabrication productivity
Since a variety of new generation production processes of TFT-LCD have been developedquickly in recent years (Park et al. 2003), how to increase the productivity of a TFT-LCDcompany becomes an important issue. To solve the above issue, some studies haveimproved the efficiency of the TFT-LCD industry. For example, Jeong et al. developeda scheduling system for a TFT-LCD assembly process to minimise the mean flow timeand maximise the production progressiveness (Park et al. 2003). Shin and Leon (2004)improved the scheduling problem for the module process to improve the TFT-LCDmanufacturing productivity. Toba (2005) presented a WIP estimation flow control methodto solve the problem of controlling the maximum number of waiting lots in a limited buffercapacity in 2005. In the method, three features were used, including dividing the wholeschedule into small lot schedules, reducing redundant blocking time, and WIP assessmentfor contiguous limited buffer scheduling. Afterwards, Lin et al. (2006) proposed ahierarchical planning and scheduling framework for a TFT-LCD assembly-to-order
Figure 3. Different moving routes and system productivities due to different command orders.
International Journal of Production Research 6695
Dow
nloa
ded
by [
Nat
iona
l Chi
ao T
ung
Uni
vers
ity ]
at 1
8:45
24
Apr
il 20
14

production chain, which mainly concentrates on the scheduling for the array, cell, andmodule processes in the TFT-LCD production. In addition, Huang pointed out thefollowing four factors which influence Taiwan’s TFT-LCD industry strategy in thecompetitive environment (Lin et al. 2006): government policy, human resources, capitalinvestment, and bridging institution. Also Shin and Kang (2010) proposed a rework-baseddispatching algorithm to improve the productivity for module process in TFT-LCDmanufacture. Also, Chen et al. (2008) proffered a statistical process control (SPC) methodto evaluate the LCD industry performance, while Hsieh (2008) proposed a methodincorporating fuzzy adaptive resonance theory and a stepwise regression approach for theclustering analysis on the abnormal position defect status in TFT-LCD process to increasethe production performance. Recently, Wang et al. (2008) analysed the RFID enabledsupply chain in the TFT-LCD industry to decrease inventory cost. Their study indeedlowers the production cost from the view point of inventory.
3. Proposed method
In this section, the proposed GA-based MHSF method with an explanation for the realarray fabrication processes in the factory is described. It consists of two novel approaches,one is the MHSF, and the other is an adapted GA method to find the optimal set of valuesof MHSF for material handling commands.
3.1 Simulator
As the manufacturing environment is very complex in the TFT-LCD array fabrication,many unexpected conditions may affect the system, and some experiment results cannot begained easily. In order to evaluate the proposed method well, we use a simulator tosimulate the fabrication process. In our simulation model, a lot is generated first, goesto area S for an initialisation process, and then goes into area A for fabrication. Afterfinishing its fabrication process in area A, the lot goes to another area for the next process.After a period of time, this lot is coming back to area A again. All the conditions are givenfor the simulator, including the number of lots for fabrication every day, the number ofproduction machines, time to operate a lot by each machine, the TFT-LCD fabricationprocess, and time intervals between two subsequent arrival times of a lot back and forth toarea A which are gained from the real company records. Some other attributes are alsogiven, such as the types of machines, distances between each machine, RGV speed, timefor bringing a lot in to a RGV or out from a RGV, and time for the internal materialhandling within a stocker. Figure 4 represents the fabrication process from the viewpointof area A.
Stay in area Sfor s mins.
for example,s=20
Fabricationprocess in area
non-A for (10+15)mins=25 mins
Generate n lotsevery day
Simulate thefabrication
process in areaA
Simulate thefabrication
process in areaA
Fabricationprocess in
area non-A for20 mins
Generation S A(1) C (1) B(1) A(2) D(1) ......
Figure 4. The fabrication process from the viewpoint of area A.
6696 S.-S. Tseng et al.
Dow
nloa
ded
by [
Nat
iona
l Chi
ao T
ung
Uni
vers
ity ]
at 1
8:45
24
Apr
il 20
14

For example, assume there are a total of two machines in area S and there are six lotsto be processed by them. It takes 10min to process two new lots in the generation process;20min are needed for every two lots in the initialisation process in area S as shown inFigure 4. Based upon the FIFO rule, these six lots begin their fabrication process in area Aand their leaving time is shown in Table 1, where each lot is sent to area A twice. Sinceeach lot takes at least 20min the first time and at least 10min the second time in area A,the real process time for each lot in area A is greater than or equal to above 20 or 10minafter adding the waiting time. Table 2 records the lots to be processed in area A duringevery 10min, where LiðAðj ÞÞ means the jth time of lot i in area A. Figure 5 illustrates thetime series by a Gantt chart.
Figure 5. The Gantt chart for six lots fabrication.
Table 1. The leaving time of six lots in area A.
Lot GenerationArea non� A(20min in S)
Leaving timeof Að1Þ
Area non� A(10min in Cð1Þ,15min in Bð1Þ)
Leaving timeof Að2Þ
L1 00:10 00:30 00:50 01:15 01:27L2 00:10 00:30 00:52 01:17 01:29L3 00:20 00:40 01:01 01:26 01:43L4 00:20 00:40 01:06 01:31 01:46L5 00:30 00:50 01:17 01:42 02:02L6 00:30 00:50 01:20 01:45 02:10
Table 2. The lots to be processed in area A during each time period.
Time period Processes in area A
01:00–01:10 L3ðAð1ÞÞ, L4ðAð1ÞÞ, L5ðAð1ÞÞ, L6ðAð1ÞÞ01:10–01:20 L1ðAð2ÞÞ, L2ðAð2ÞÞ, L5ðAð1ÞÞ, L6ðAð1ÞÞ01:20–01:30 L1ðAð2ÞÞ, L2ðAð2ÞÞ, L3ðAð2ÞÞ, L4ðAð2ÞÞ, L6ðAð1ÞÞ01:30–01:40 L3ðAð2ÞÞ, L4ðAð2ÞÞ, L5ðAð2ÞÞ01:40–01:50 L4ðAð2ÞÞ, L5ðAð2ÞÞ, L6ðAð2ÞÞ01:50–02:00 L5ðAð2ÞÞ, L6ðAð2ÞÞ
International Journal of Production Research 6697
Dow
nloa
ded
by [
Nat
iona
l Chi
ao T
ung
Uni
vers
ity ]
at 1
8:45
24
Apr
il 20
14

For a single lot i, let the jth process time in area A be Rtij, where i is the lot number.Hence the total fabrication time in area A for lot i shall be Rti ¼ Rti1 þ Rti2 þ � � �.As illustrated in Figure 6, the amount of blue areas is the total fabrication time for lot 1in area A.
In addition, fabrication time for a lot in area A each time Rtij includes machineoperation time RPtj, waiting time RWtij, and material handling time RMtij. Therefore,
Rtij ¼ RPtj þ RWtij þ RMtij
For every lot, the machine operation time RPtj are the same. The waiting time RWtijcan be divided into waiting for material handling time RWmht
ij and waiting for machine
time RWmatij. Therefore, the variable fabrication time for a lot in area A each time R0tij is
defined as:
R0tij ¼ RWmhtij þ RWmat
ij þ RMtij:
3.2 Material handling strategy function f (MHSF)
As we have known, factors to affect productivity include the utility rates of machines,RGV, and stocker. A high utility rate of machines can reach high productivity. Low utilityrates of either RGV or stocker can also have a high productivity. Therefore, high machineutility rate, low RGV and low stocker utility rates are our three material handlingstrategies. We use the following attributes in the proposed method:
LS Number of lots waiting for source machine which a WIP is movedfrom.
MS Number of machines whose type is the same as the source machine.TS Operation time of a source machine.LO Number of lots waiting for object machine which a WIP is moved to.MO Number of machines whose type is the same as the object machine.TO Operation time of an object machine.
DRS Distance between a RGV and a source machine.TI Time interval from the creation of the command.Tw Time waiting for a stocker to be free.
Table 3 is an example of a command table with three commands. For each command,a material handling strategy function f is proposed to calculate its priority of executionin this study. The command with a higher f value has the higher priority will be chosen toperform first. This material handling strategy function is defined as:
fw1,w2,w3,w4,w5¼ w1AttFrom � w2AttTo � w3AttRGV þ w4AttLOT � w5AttSTK,
where
AttFrom Status of source machine from which a WIP is moved.
Figure 6. The fabrication time of lot 1 in area A.
6698 S.-S. Tseng et al.
Dow
nloa
ded
by [
Nat
iona
l Chi
ao T
ung
Uni
vers
ity ]
at 1
8:45
24
Apr
il 20
14

AttTo Status of object machine to which a WIP is moved.AttRGV Distance between a RGV and a source machine.AttLOT Time interval from which a command is generated.AttSTK Time waiting for a stocker to be free.
0 � w1,w2,w3,w4,w5 � 1, w1 þ w2 þ w3 þ w4 þ w5 ¼ 1
AttFrom is the status of the source machine which a WIP is moved from. If a sourcemachine is busier, more WIP should be removed from it as soon as possible and w1 ishigher. On the contrary, AttTo is the status of the object machine to which a WIP is movedto and therefore, if an object machine is busy, it should not allow more WIP to be movedin, and w2 has a negative impact to f. AttRGV is the distance between a RGV and a sourcemachine. When the distance is shorter, the efficiency is better. Hence w3 has a negativesign. AttLOT represents the waiting time of a command to be executed once it is generated.To reduce the waiting time, a command with a longer AttLOT is given a higher priority.The last factor AttSTK is time waiting for a stocker to be free. Because only one stocker isprovided for a WIP, the weight w5 has a negative sign.
To balance the influence power of the above affecting factors, these affecting factorsare normalised to be between 0 and 1 as the following:
AttFrom ¼ NormaliseFromLS � TS
MS
� �, 0 � AttFrom � 1
AttTo ¼ NormaliseToLO � TO
MO
� �, 0 � AttTo � 1
AttRGV ¼ NormaliseRGVðDRSÞ, 0 � AttRGV � 1
AttLOT ¼ NormaliseLOTðTIÞ, 0 � AttLOT � 1
AttSTK ¼ NormaliseSTKðTWÞ, 0 � AttSTK � 1
Since the variable fabrication time for a lot in area A consisting of waiting for materialhandling time RWmht
ij, waiting for machine time RWmat
ij, and material handling
time RMtij, our goal is to minimise the total timePn
i¼1
Pvj¼1 ðR
0tijÞ ¼Pni¼1
Pvj¼1 ðRWmht
ij þ RWmat
ij þ RMtijÞ, where n is the total number of lots sent to the
fabrication system, and v is the number of a lot moved into area A. Therefore, the purposeof this study is to find out a material handling strategy fw1,w2,w3,w4,w5
with a set of weightðw1,w2,w3,w4,w5Þ to minimise
Pni¼1
Pvj¼1 ðR
0tijÞ and get the best productivity forfabrication process R in area A.
3.3 Methodology
Assume n lots are sent to a factory, and a material handling strategy fw1,w2,w3,w4,w5can be
formulated as a linear combination of AttFrom,AttTo,AttRGV,AttLOT,AttSTK. GA is applied
Table 3. Example of a command table.
Lot From To LS MS TS LO MO TO DRS TI Tw
1 L1 Ma1 STK 5 4 1800 0 0 0 9 80 02 L2 STK Ma2 0 1 0 5 4 1800 0 70 403 L3 Mb1 STK 4 2 300 0 1 0 12 65 0
International Journal of Production Research 6699
Dow
nloa
ded
by [
Nat
iona
l Chi
ao T
ung
Uni
vers
ity ]
at 1
8:45
24
Apr
il 20
14

for seeking the suitable weights ðw1,w2,w3,w4,w5Þ to have the largest productivity. Each
time, the command that has the largest value of fw1,w2,w3,w4,w5is chosen to be performed.
(1) EncodingWhen a research problem is going to be solved by GA, encoding is the first step.
Among a variety of encoding methods, the selection of encoding depends on the problem
style. The most common method is binary encoding, which gives every chromosomeBoolean values of 0 and 1. Permutation, direct value, and tree encoding are also successful
in some cases. However, this study proposed a new kind of decimal fractions encoding,where the vector of weights (w1,w2,w3,w4,w5) are treated as chromosomes, for0 � w1,w2,w3,w4,w5 � 1 and w1 þ w2 þ w3 þ w4 þ w5 ¼ 1 as illustrated in Figure 7.
(2) FitnessEach chromosome has an associated objective function called the fitness. A good
chromosome is the one that has low fabrication timePn
i¼1
Pvj¼1 R
0tij. The strength of achromosome is represented by its fitness value. Fitness values indicate which chromosomes
are to be carried to the next generation. A set of chromosomes and associated fitnessvalues are called the population. This population at a given stage of GA is referred to as
a generation. As for different material handling strategies which are performed in thesimulator of this study, the fitness function in the simulator can be used to findthe minimum fabrication time
Pni¼1
Pvj¼1 R
0tij and the highest productivity. Since the
chromosome with a larger fitness value should have a higher possibility to the nextgeneration in GA, we use inverse function 1Pn
i¼1
Pv
j¼1R0tij
to seek max�
1Pn
i¼1
Pv
j¼1R0tij
�for the
chromosomes. When a chromosome is specified, e.g. w1, i ¼ 1, 2, . . . , 5, are known, thesimulator will be run to simulate TFT-LCD array factory and obtain the fabrication timePn
i¼1
Pvj¼1 R
0tij, and then calculate the fitness value of this chromosome.
(3) CrossoverIn a genetic algorithm, crossover combines two parent chromosomes to produce a new
offspring chromosome. If the new chromosome takes the best characteristics from each of
the parents, it may be better than both of the parents. Some crossover types, include one-point, two-point, uniform, arithmetic, and heuristic.
Since this study proposed a new kind of decimal fractions encoding, the crossovermethod should be modified. We use arithmetic (convex) crossover as an example. For two
parent material handling strategies, a float value between 0 and 1 is generated randomly,where the new ith weights wi is the convex combination of the ith weights wi in two parent
strategies (chromosomes). Figure 8 explains the arithmetic (convex) crossover process inour GA.
(4) MutationMutation operator alters one or more values in a chromosome from its original values.
Mutation is an important part of the genetic search to help get better results. There
are several types of mutation, including flip bit, boundary, non-uniform, uniform, andGaussian. Different from the traditional GA mutation method of using 0 and 1 to control
Figure 7. An example of a chromosome of GA in this study.
6700 S.-S. Tseng et al.
Dow
nloa
ded
by [
Nat
iona
l Chi
ao T
ung
Uni
vers
ity ]
at 1
8:45
24
Apr
il 20
14

mutation, this study generates a new value between 0 and 1 for a randomly chosen weight.To assure w1 þ w2 þ w3 þ w4 þ w5 ¼ 1, all five weights in the strategy have to be nor-malised by wi,normalized ¼ wi=ðw1 þ w2 þ w3 þ w4 þ w5Þ as illustrated in Figure 9.
Our GA proceeds as follows:
Genetic Algorithm()
Begin Initialise population;while (not terminal condition) doBegin
choose parents from population; /* Selection */construct and normalise off_spring by combining parents;/* Crossover */mutate and normalise off_spring; /* Mutation */if suited (off_spring) then replace worst (population) with better off_spring;End;
End.
4. Computational results
To evaluate the performance of our methods, we have carried out experiments using thehistorical data of Chunghwa Picture Tubes Company, including the fabrication process,object working area features, other working areas features, machine operation time, andthe way to send lots for fabrication. As mentioned above, this TFT-LCD factory is dividedinto six areas: S, A, B, C, D, and E. To simplify our discussion, only area A is used as anexample for the proposed method. The interval between two subsequent entries of area Ais defined according to the average time from the historical records. All fabricationprocesses through different areas are shown in Figure 10.
Where S is a process to initiate a new lot and the related information of area A is listedin Table 4.
4.1 Methodology
As mentioned before, it takes 20min (1200 s) to initiate a lot for each machine in S area.In a real factory, the number of lots to be processed varies for each hour, each day,
0.1 0.5 0.2 0.1 0.1
0.2 0.3 0.05 0.05 0.4
0.12 0.46 0.17 0.09 0.16
X
X
+
0.8
1-0.8
Figure 8. An example of arithmetic (convex) crossover process in our GA.
Figure 9. An example of the process of mutation in our GA.
International Journal of Production Research 6701
Dow
nloa
ded
by [
Nat
iona
l Chi
ao T
ung
Uni
vers
ity ]
at 1
8:45
24
Apr
il 20
14

each week, and each month. Hence, we use the current FIFO material handling command
choosing strategy for our simulator to seek the relation between number of lots generated
and productivity. At the beginning, there is no lot in the system and the utility ratio is low.
To avoid the bias of the data, we calculate the productivity from the second day. For the
given different number of lots, the FIFO strategy using w1 ¼ 0, w2 ¼ 0, w3 ¼ 0, w4 ¼ 1,
and w5 ¼ 0 can be described as:
fw1,w2,w3,w4,w5¼ 0� AttFrom � 0� AttTo � 0� AttRGV þ 1� AttLOT � 0� AttSTK
Figure 11 shows time for material handling, time for waiting for material handling,
time for waiting for machines, and variable fabrication time. As you can see both time
waiting for material handling and waiting for machines increases when the number of lots
increases. However, there is only a little increase in time waiting for material handling.
Hence, time waiting for machines significantly influences the variable fabrication time. The
variable fabrication time rises sharply at the number of lots approaches 62, 69, and 74.
Before the previously mentioned numbers, the variable fabrication time stays almost the
same. Hence, such certain numbers are sought because they have the largest number of lots
in the same level of variable fabrication time.Figure 12 plots the utility rate of four kinds of machines, RGV, and the stocker, where
Ma and Mb have higher utility rates which can not be increased even if the number of lots
is greater than 69. As mentioned above, 62, 69, and 74 are the suitable lot numbers for
generation, because generating 69 lots has a higher machine utility rate and a lower RGV
utility rate than generating 74 lots. Therefore, we generated 69 lots for further experiments
in the system.
Table 4. The related information of area A.
Item Content
Type of machine Ma, Mb, Mc, MdNumber of each type of machine Ma: 4 (Ma01, Ma02, Ma03, Ma04)
Mb: 3 (Mb01, Mb02, Mb03)Mc: 1 (Mc01)Md: 1 (Md01)
Operation time for machines Ma: 540 sMb: 400 sMc: 300 sMd: 80 s
Distance between two adjoined machines 3mRGV speed 1m/sTime for a RGV takes a lot 8 sMaterial handling time within a stocker 40 s
→ (11200 sec in C(2), B(5)) → A(5)
→ (10400 sec in D(1), B(3)) → A(3) → (13800 sec in E(1), B(4)) → A(4)
Generation → S → (8200 sec in B(1)) → A(1) → (13500 sec in C(1), B (2)) → A(2)
Figure 10. The processes of a TFT-LCD array fabrication.
6702 S.-S. Tseng et al.
Dow
nloa
ded
by [
Nat
iona
l Chi
ao T
ung
Uni
vers
ity ]
at 1
8:45
24
Apr
il 20
14

4.2 Finding the weights of MHSF
In our experiment, 69 lots are generated in the manufacturing system, and the proposedmethod based on GA is applied to seek the best set of weights for the material handlingstrategy function. Population size is set as 100. The first population is generated randomly,crossover rate is 0.9, and mutation rate is 0.05. Many kinds of crossover methods areproposed, such as one-point, two-point, uniform, and arithmetic (convex) methods.The Arithmetic crossover method was used in this study. When the productivity stayed the
0
1000000
2000000
3000000
4000000
5000000
6000000
7000000
8000000
50 51 52 53 54 55 56 57 58 59 60 61 62 63 64 65 66 67 68 69 70 71 72 73 74 75 76 77 78 79 80
Tim
e (s
eco
nd
)
Lots
Time for waiting for material handling Time for waiting for machine
Time for material handling Variable fabrication time
Figure 11. The fabrication time for different number of lots.
The analysis of utility rate
MaMb
Mc
Md
RGV
Stocker
0
20
40
60
80
100
120
40 42 44 46 48 50 52 54 56 58 60 62 64 66 68 70 72 74 76 78 80
Lots
Util
ity r
ate
(%) Ma
MbMcMdRGVStocker
Figure 12. The analysis of utility rate.
International Journal of Production Research 6703
Dow
nloa
ded
by [
Nat
iona
l Chi
ao T
ung
Uni
vers
ity ]
at 1
8:45
24
Apr
il 20
14

same after 50 generations, GA is converged and reduces the fabrication time. In Figure 13,
the average fabrication time decreases very quickly and reaches around 500,000 s after the
fifth generation in GA. In Figure 14, the lowest fabrication time value is gained after the
15th generation. Therefore, the proposed method can find the best solution quickly by the
following best MHSF:
fw1,w2,w3,w4,w5¼ 0:064456AttFrom � 0:415093AttTo � 0:185991AttRGV
þ 0:039848AttLOT � 0:294612AttSTK
The lowest fabrication time for each generation
200000
220000
240000
260000
280000
300000
320000
0 3 6 9 12 15 18 21 24 27 30 33 36 39 42 45 48 51 54 57 60 63Generation
Low
er fa
bric
atio
n tim
e (s
econ
d)
Figure 14. The lowest fabrication time for each generation.
Average fabrication time
0
200000
400000
600000
800000
1000000
1200000
1400000
1600000
1800000
Generation
Ave
rage
fabr
icat
ion
time
(sec
ond)
0 3 6 9 12 15 18 21 24 27 30 33 36 39 42 45 48 51 54 57 60 63
Figure 13. Average fabrication time for each generation.
6704 S.-S. Tseng et al.
Dow
nloa
ded
by [
Nat
iona
l Chi
ao T
ung
Uni
vers
ity ]
at 1
8:45
24
Apr
il 20
14

It can be easily seen that w2 has the largest absolute value, or the most important itemis AttTo. It means that when the next machine is busy, a material handling command hasa low possibility of being chosen, and the lot has to wait in the current machine. The lotalso has a greater opportunity to be sent directly to the next machine in order to reduce thenumber of material handling commands required. In our experiment, there were 86.7% ofcommands directly sent for this set of weights in the system.
A comparison of the productivity of several methods using status data in Table 4,including HSMFS, LOMFS, FEEFS, FIFO, LTWSFS, and the proposed methods, isillustrated in Figure 15. The results indicate that the proposed method reached the bestsolution comparing with other methods.
4.3 Comparison with different number of lots generated
To seek the optimal weight set, the proposed method with 20 generations has been appliedto different numbers of lots. In Figure 16, it is clear that when the number of lots increases,the total fabrication time increases. When the lot number is greater than 74, fabricationtime and time difference increase greatly, where time difference is the distance between thelargest and the smallest fabrication times. It indicates that the lot numbers from 71 to 74have better results.
4.4 Further comparison in dynamic status
In some fabrication processes such as, wafer fabrication, the production process andmachine operation status may affect the productivity. In order to evaluate theperformance of the proposed method, two experiments have been done under differentdynamic status. In the first experiment, four different processes were used to test the
Figure 15. The comparison of the lowest time for product of several methods.
International Journal of Production Research 6705
Dow
nloa
ded
by [
Nat
iona
l Chi
ao T
ung
Uni
vers
ity ]
at 1
8:45
24
Apr
il 20
14

proposed method, and a machine break-down record of a real company was used in theother experiment.
(1) Using four different process statusesTable 5 shows the statuses of four different processes of the TFT-LCD to check the
proposed method, where Process 1 is the original process and Processes 2 to 4 are newprocesses. In the three new processes, machine operation time, stocker size, and time fora lot in a non-A area is reset. Productivities in different processes by HSMFS, LOMFS,FEEFS, FIFO, LTWSFS, and proposed methods are compared in Table 6. Still, theproposed GA method has the best productivity.
(2) Machines break-down dataIn this subsection, a manufacturing data with machine break-down record is used to
test the dynamic status for the proposed method. Using process 1, everything ran well onthe first day. The status on the first day was recorded as status 1. On the second day,
Figure 16. The minimal fabrication time for different lot numbers.
Table 5. The statuses of four processes.
Process 1 Process 2 Process 3 Process 4
Non-A(1) 8200 12,500 10,000 13,500Non-A(2) 13,500 14,200 12,500 14,000Non-A(3) 10,400 10,400 12,000 10,000Non-A(4) 13,800 14,200 15,000 13,500Non-A(5) 11,200 10,400 11,200 13,000Ma 540 560 520 580Mb 400 380 400 350Mc 300 250 320 280Md 80 60 80 100Stocker 40 80 80 50Optimal lot number by FIFO 69 70 67 75
6706 S.-S. Tseng et al.
Dow
nloa
ded
by [
Nat
iona
l Chi
ao T
ung
Uni
vers
ity ]
at 1
8:45
24
Apr
il 20
14

Table
6.Thecomparisonoffourprocesses.
HSMFS
LOMFS
FEFS
FIF
OLTWSFS
(HeavySource
MachineFirst
Service)
(LightObject
MachineFirst
Service)
(First
Encounter
First
Service)
(First
InFirst
Out)
(LessTim
eWaitingfor
Stocker
First
Service
Thebest
strategy
found
byGA
Process
1Tim
eforwaitingformaterialhandling(R
Wmhti j)
389,979
187,644
226,088
145,870
237,747
569,82
Tim
eforwaitingformachine(R
Wmati j)
3,646,081
179,3020
1,631,759
709,639
166,3928
809,93
Tim
eformaterialhandling(R
Mti j)
137,700
116,720
116,346
100,069
118,897
72,437
Variable
fabricationtime(R0 ti j)
4,173,760
2,097,384
1,974,193
955,578
2,020,572
210,412
Process
2Tim
eforwaitingformaterialhandling(R
Wmhti j)
534,917
138,188
249,719
192,123
144,914
42,692
Tim
eforwaitingformachine(R
Wmati j)
7,657,363
496,348
1,533,672
506,433
344,900
13,649
Tim
eformaterialhandling(R
Mti j)
152,106
99,498
120,537
105,879
102,818
78,998
Variable
fabricationtime(R0 ti j)
8,344,386
734,034
1,903,928
804,435
592,632
135,339
Process
3Tim
eforwaitingformaterialhandling(R
Wmhti j)
346,467
169,747
180,093
156,749
106,768
63,070
Tim
eforwaitingformachine(R
Wmati j)
2,678,492
512,485
1,510,071
589,455
1,040,596
154,753
Tim
eformaterialhandling(R
Mti j)
128,834
104,947
109,519
105,147
93,279
82,413
Variable
fabricationtime(R0 ti j)
3,153,793
787,179
1,799,683
851,351
1,240,643
300,236
Process
4Tim
eforwaitingformaterialhandling(R
Wmhti j)
542,804
218,793
295,349
156,729
147,501
73,895
Tim
eforwaitingformachine(R
Wmati j)
11,488,346
2,591,821
4,636,849
907,298
1,268,945
263,086
Tim
eformaterialhandling(R
Mti j)
161,870
126,307
135,335
109,054
111,471
92,764
Variable
fabricationtime(R0 ti j)
12,193,020
2,936,921
5,067,533
1,173,081
1,527,917
429,745
International Journal of Production Research 6707
Dow
nloa
ded
by [
Nat
iona
l Chi
ao T
ung
Uni
vers
ity ]
at 1
8:45
24
Apr
il 20
14

machine Ma030 broke down at 09:38:52 in the morning. The manufacturing status wasrecorded as status 2 in Table 7. At 14:03:24 pm, machine Ma030 was repaired and themanufacturing system was restored to status 1. Unfortunately, at 21:46:37, machineMb010 broke down and the status became status 3 until 23:32:46.
With the three different statuses described above, five weight values were calculated bythe proposed GA based MHSF method as listed in Table 7. According to the comparisonof the productivities in different statuses shown in Table 8, the result of the proposedmethod is the best among the others.
4.5 Comparison of crossover method
Many kinds of crossover methods are proposed. Many factors including differentcrossover methods, problems, and encoding should affect the performance of GA. In thissubsection, the performances of four crossover methods, including one-point, two-point,uniform, and arithmetic (convex) are compared for our proposed method. Each methodruns 10 times and the learning time is recorded. The population size is 100, and crossoverrate is 0.9. The results are shown in Table 9 and it indicates that the arithmetic (convex)
Table 8. The comparison of different material handling methods for the dynamic status.
HSMFS LOMFS FEFS FIFO LTWSFS(HeavySourceMachineFirst
Service)
(LightObjectMachineFirst
Service)
(FirstEncounter
FirstService)
(First InFirst Out)
(Less TimeWaiting forStockerFirstService
The beststrategyfoundby GA
Time for waitingfor materialhandling
445,573 122,517 225,697 159,919 280,995 105,328
Time for waitingfor machine
4,401,321 500,722 1,695,013 758,641 2,448,219 441,542
Time for materialhandling
147,432 100,571 119,854 103,372 125,047 95,566
Variable fabrica-tion time
4,994,326 723,810 2,040,564 1,021,932 2,854,261 642,436
Table 7. The weights calculated by the proposed method in different statuses.
Status 1 Status 2 Status 3
w1 0.06445612 0.33125799 0.16933685w2 0.41509296 0.22320731 0.31999321w3 0.18599089 0.16698497 0.20771212w4 0.03984787 0.27662127 0.30160091w5 0.29461216 0.00192846 0.00135691
6708 S.-S. Tseng et al.
Dow
nloa
ded
by [
Nat
iona
l Chi
ao T
ung
Uni
vers
ity ]
at 1
8:45
24
Apr
il 20
14

crossover method has the lowest running time and the best performance in all 10 of theexperiments. Therefore, all our experiments for the proposed method apply the arithmeticcrossover method.
5. Conclusions
The competition in TFT-LCD industry is extremely intense. To increase fabricationproductivity, this study proposes a MHSF which is based on GA to find out the beststrategy for reducing material handling and waiting time in the array process of a TFT-LCD factory. A MHSF consists of five affecting factors in the fabrication. In the GAbased method, the encoding, crossover and mutation operations have been designedspecifically for the five affecting factors. After the optimal set of weights are found, thecorresponding optimal strategy can be used to calculate the function value for eachmaterial handling command and the command which has the highest value will beperformed first. From the results, it is clear that the busy status of the object machine inthe fabrication process has a high degree of influence on productivity. A better materialhandling strategy function reduces the utility of the RGA and the stocker. Comparing tothe FIFO strategy, the proposed method can save 86% of material handling and lotwaiting time. For the case in the experiments, lot numbers 71 to 74 are sought to reachhigher productivity. In brief, the proposed material handling strategy function indeedraises the TFT-LCD fabrication productivity.
References
Asef-Vaziri, A., Hall, N.G., and George, R., 2008. The significance of deterministic empty vehicle
trips in the design of a unidirectional loop flow path. Computers and Operations Research,
35 (5), 1546–1561.Berman, S., Edan, Y., and Jamshidi, M., 2003. Navigation of decentralized autonomous automatic
guided vehicles in material handling. IEEE Transactions on Robotics and Automation, 19 (4),743–749.
Chen, S.H., et al., 2008. Performance evaluation for introducing statistical process control to theliquid crystal display industry. International Journal of Production Economics, 111 (1), 80–92.
Table 9. The comparison of four crossover methods (s).
One-point Two-point UniformArithmetic(Convex)
1 0.170 0.186 0.190 0.1562 0.170 0.190 0.186 0.1233 0.173 0.186 0.190 0.1534 0.173 0.170 0.173 0.1565 0.170 0.190 0.186 0.1406 0.156 0.203 0.170 0.1407 0.170 0.190 0.170 0.1268 0.173 0.186 0.186 0.1409 0.170 0.186 0.190 0.12310 0.170 0.190 0.186 0.140
International Journal of Production Research 6709
Dow
nloa
ded
by [
Nat
iona
l Chi
ao T
ung
Uni
vers
ity ]
at 1
8:45
24
Apr
il 20
14

Dongmin, S., Wysk, R.A., and Rothrock, L., 2006. An investigation of a human material handler
on part flow in automated manufacturing systems. IEEE Transactions on Systems, Man and
Cybernetics, Part A, 36 (1), 123–135.Gabbert, P. and Brown, D.E., 1998. Knowledge-based computer-aided design of materials handling
systems. IEEE Transactions on Systems, Man and Cybernetics, 19 (2), 188–196.Heragu, S., 1997. Facility design. Boston, MA: PWS Publishing, 1997.
Holland, J.H., 1975. Adaptation in natural and artificial systems. Ann Arbor, MI: MIT Press.Hsieh, K.L., 2008. The application of clustering analysis for the critical areas on TFT–LCD panel.
Expert Systems With Applications, 34 (2), 952–957.Huang, C.-T., et al., 2009. A fuzzy AHP-based performance evaluation model for implementing
SPC in the Taiwanese LCD industry. International Journal of Production Research, 47 (18),
5163–5183.
Hung, S.W., 2006. Competitive strategies for Taiwan’s thin film transistor-liquid crystal display
(TFT-LCD) industry. Technology in Society, 28 (3), 349–361.
Jawahar, N., et al., 1998. A genetic algorithm-based scheduler for setup-constrained FMC.
Computers in Industry, 35 (3), 291–310.
Jeong, B., Kim, S.W., and Lee, Y.J., 2001. An assembly scheduler for TFT LCD manufacturing.
Computers and Industrial Engineering, 41 (1), 37–58.
Kulak, O., 2005. A decision support system for fuzzy multi-attribute selection of material handling
equipments. Expert Systems With Applications, 29 (2), 310–319.
Lee, D.Y. and DiCesare, F., 1994. Integrated scheduling of flexible manufacturing systems
employing automated guided vehicles. IEEE Transactions on Industrial Electronics, 41 (6),
602–610.Lin, J.T., Chen, T.L., and Lin, Y.T., 2006. A hierarchical planning and scheduling framework for
TFT-LCD production chain. Service Operations and Logistics, and Informatics, IEEE
International Conference 2006. SOLI ’06, 711–716.Liu, H. and Lin, H., 2008. Sequence trajectory generation for garment handling systems. Applied
Mathematical Modelling, 32 (6), 1017–1026.Lu, C.-J. and Tsai, D.-M., 2004. Defect inspection of patterned thin film transistor-liquid crystal
display panels using a fast sub-image-based singular value decomposition. International
Journal of Production Research, 42 (20), 4331–4351.
Malmborg, C.J., 2003. Design optimization models for storage and retrieval systems using rail
guided vehicles. Applied Mathematical Modelling, 27 (12), 929–941.
Miller, J.A., et al., 1993. An evaluation of local improvement operators for genetic algorithms.
IEEE Transactions on Systems, Man and Cybernetics, 23 (5), 1340–1351.
Nazzal, D. and McGinnis, L.F., 2007. Expected response times for closed-loop multivehicle AMHS.
IEEE Transactions on Automation Science and Engineering, 4 (4), 533–542.
Pan, L.Y., et al., 2007. The future development of global LCD TV Industry. PICMET 2007
Proceedings, 1818–1821.
Park, S.B., Lee, J.D., and Kim, T.Y., 2003. Learning by doing and spillovers: an empirical study on
the TFT-LCD industry. Engineering Management Conference, 2003. IEMC ‘03. Managing
technologically driven organizations: the human side of innovation and change, 363–367.Shin, H.J. and Kang, Y.H., 2010. A rework-based dispatching algorithm for module process in
TFT-LCD manufacture. International Journal of Production Research, 48 (3), 915–931.Shin, H.J. and Leon, V.J., 2004. Scheduling with product family set-up times: an application in TFT
LCD manufacturing. International Journal of Production Research, 42 (20), 4235–4248.Toba, H., 2005. A tight flow control for job-shop fabrication lines with finite buffers.
IEEE Transactions on Automation Science and Engineering, 2 (1), 78–83.Tsai, D.-M., Chuang, S.-T., and Tseng, Y.-H., 2007. One-dimensional-based automatic defect
inspection of multiple patterned TFT-LCD panels using Fourier image reconstruction.
International Journal of Production Research, 45 (6), 1297–1321.
6710 S.-S. Tseng et al.
Dow
nloa
ded
by [
Nat
iona
l Chi
ao T
ung
Uni
vers
ity ]
at 1
8:45
24
Apr
il 20
14
Tsai, D.-M. and Hung, C.-Y., 2005. Automatic defect inspection of patterned thin film transistor-liquid crystal display (TFT-LCD) panels using one-dimensional Fourier reconstruction andwavelet decomposition. International Journal of Production Research, 43 (21), 4589–4607.
Ventura, J.A. and Rieksts, B.Q., 2009. Optimal location of dwell points in a single loop AGV system
with time restrictions on vehicle availability. European Journal of Operational Research,192 (1), 93–104.
Wakabayashi, T., et al., 2004. High-speed AMHS and its operation method for 300-mm QTAT fab.
IEEE Transactions on Semiconductor Manufacturing, 17 (3), 317–323.Wang, S.J., Liu, S.F., and Wang, W.L., 2008. The simulated impact of RFID-enabled supply chain
on pull-based inventory replenishment in TFT-LCD industry. International Journal of
Production Economics, 12 (2), 570–586.Wu, N. and Zhou, M.C., 2005. Modeling and deadlock avoidance of automated manufacturing
systems with multiple automated guided vehicles. IEEE Transactions on Systems, Man, and
Cybernetics, Part B, 35 (6), 1193–1202.Wu, N. and Zhou, M.C., 2007. Deadlock resolution in automated manufacturing systems with
robots. IEEE Transactions on Automation Science and Engineering, 4 (3), 474–480.Yang, T., Peters, B.A., and Tu, M., 2005. Layout design for flexible manufacturing systems
considering single-loop directional flow patterns. European Journal of Operational Research,164 (2), 440–455.
International Journal of Production Research 6711
Dow
nloa
ded
by [
Nat
iona
l Chi
ao T
ung
Uni
vers
ity ]
at 1
8:45
24
Apr
il 20
14