retirement advantage progam
DESCRIPTION
Empirical’s approach to retirement planning is designed to find answers to the key questions we all must have in order to retire with confidence. These questions include: •Have you optimized your social security benefits and considered restricted applications or file and suspend strategies? •How should you elect to take your company pension? •How do you plan on minimizing taxes in retirement? •How have you accounted for the effects of inflation on your retirement? •Do you know how much investment risk are you taking now? •Do you know how much investment risk you need to take in order to have the retirement you want? •Do you know what rate of return you need in order to retire the way you want?TRANSCRIPT

Your Retirement Advantage
five secrets of a
successful retirement

2 | P a g e "Providing you with the most effective, unbiased investment and financial planning advice available."
Table of Contents
Overview ……………………………………………………………………………………………………………………………………………….…………………….. 3
Secret #1 – Social Security Optimization ...…………………………………………………………………………………………………………….……… 4
Secret #2 – Roth Conversions ………………………………………………………………………………………………………………………………………. 7
Secret #3 – Asset Location ……………………………………………………………………………………………………………………………………………. 8
Secret #4 – Targeted Premium Portfolios .……………………………………………………………………………………………………………………. 10
Secret #5 – Coordination of Strategies …..……………………………………………………………………………………………………………..…….. 13
Available Portfolio Options Descriptions .…………………………………………………………………………………………………………………….. 14
Disclosure ……………………………………………………………………………………………………………………………………………………………………. 15

3 | P a g e "Providing you with the most effective, unbiased investment and financial planning advice available."
Retirement Advantage Overview
For most of us, retirement success means achieving some version of living comfortably, while being as worry-free as possible during our retirement years. However, reaching this goal is often easier said than done. Even though we work hard, act responsibly, plan, and save, we may still come up short of reaching our goals. Sometimes this shortfall may not be due to the choices that were made prior to retirement, but rather the choices that were made after retirement.
Prior to retirement, investors tend to focus mostly on the investment component of their financial plan. With our investment information just a click away, we can easily check on them any time of day. Hours a week can be spent sifting through the latest mutual fund or stock reports, newsletters, or watching the investment news channel. For some, investing has become a form of entertainment; grabbing our attention, holding on to it, and distracting us from other important issues. However, we believe that investments are just the tip of the iceberg when it comes to creating a successful retirement plan.
Planning is often the part that lies beneath the surface and yet will have a large impact on our future success. As we only have one chance to get retirement right, proper planning is important and necessary. Coming up short of our goals is never a pleasant experience; especially, when it comes to our finances. If a shortfall occurs prior to retirement, it may mean working longer, saving more, or spending less in the future. None of these options are painless, yet we must recognize that at least there is a choice. If a shortfall happens after retirement, the only remaining option is also the most painful: spend less.
The purpose of this workbook is to demonstrate the value of planning. Retirement planning, as we define it, means effectively integrating investments, tax, social security, and cash flow planning. Then fine tuning each of these mutually dependant variables to work to your greatest advantage. We believe this framework will help you make better choices about your retirement plan and, in turn, will help you gain more control over your financial future.
Respectfully yours,
Ethan Broga CFP®, MS Principal Empirical Wealth Management

4 | P a g e "Providing you with the most effective, unbiased investment and financial planning advice available."
Secret #1: Social Security Optimization
How do you know when you should start drawing social security? How can you be sure that the time you elect to start will mean the most benefit to you and your family? Let’s find out.
How much you receive from Social Security is driven by three primary factors:
1) Your earnings record 2) When you elect to receive your benefits 3) How long you expect to live
In theory, if you elect to receive benefits early, you will receive a smaller benefit for a longer period of time. If you elect to receive benefits later, you will get a larger benefit for a shorter period of time. For single individuals, a simple break-even analysis, including an estimate of your life expectancy, is all that is needed to determine whether to take Social Security early or to wait.
For married couples, however, a simple break-even analysis will usually give the wrong answer. The reason is twofold. First, the likelihood of either spouse reaching an older age is greater than each spouse individually. Second, married couples have more than one choice when it comes to receiving benefits.
Social Security Choices for Married Couples:
1) Retired Worker Benefit – Provides a benefit based on your own earnings record 2) Spousal Benefit – Provides your spouse with a benefit once you claim your own benefit 3) Survivor Benefit – Provides your spouse with a benefit after your death
If you file prior to full retirement age, you are deemed to have filed for all benefits for which you are eligible. At full retirement age and beyond, you have several options to elect a limited benefit for a period of time, and then convert to a larger benefit at some point in the future.
Optimizing Social Security for couples requires the application of two basic techniques: The “restricted application” and the “file and suspend”.
Restricted Application
Once you reach full retirement age, you have the option to restrict your application to exclude certain benefits. If a benefit is excluded, it will continue to build delayed retirement credits.
File and Suspend
A higher-earning spouse can file for benefits, then immediately suspend the benefit, and continue to earn delayed credits. In the process, he will have made his spouse eligible for spousal benefits under his earnings record.
These choices can create hundreds of different possible combinations, including 81 possible age combinations across nine possible election strategies, making it difficult to find the one option that offers the highest expected lifetime benefit without the rights tools.
Let Empirical find the best combination for your family.
(To see an illustration of life expectancy and an example of these ideas, continue to the next page.)
5 | P a g e "Providing you with the most effective, unbiased investment and financial planning advice available."
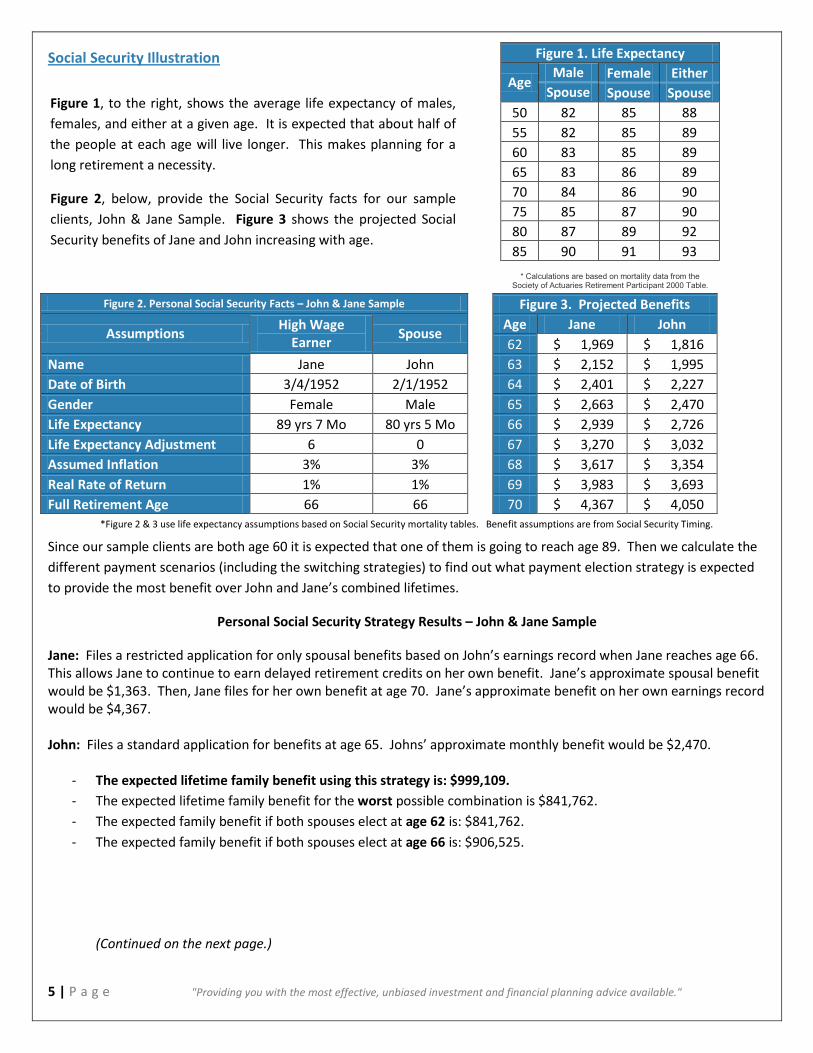
Social Security Illustration
Since our sample clients are both age 60 it is expected that one of them is going to reach age 89. Then we calculate the different payment scenarios (including the switching strategies) to find out what payment election strategy is expected to provide the most benefit over John and Jane’s combined lifetimes.
Personal Social Security Strategy Results – John & Jane Sample
Jane: Files a restricted application for only spousal benefits based on John’s earnings record when Jane reaches age 66. This allows Jane to continue to earn delayed retirement credits on her own benefit. Jane’s approximate spousal benefit would be $1,363. Then, Jane files for her own benefit at age 70. Jane’s approximate benefit on her own earnings record would be $4,367. John: Files a standard application for benefits at age 65. Johns’ approximate monthly benefit would be $2,470.
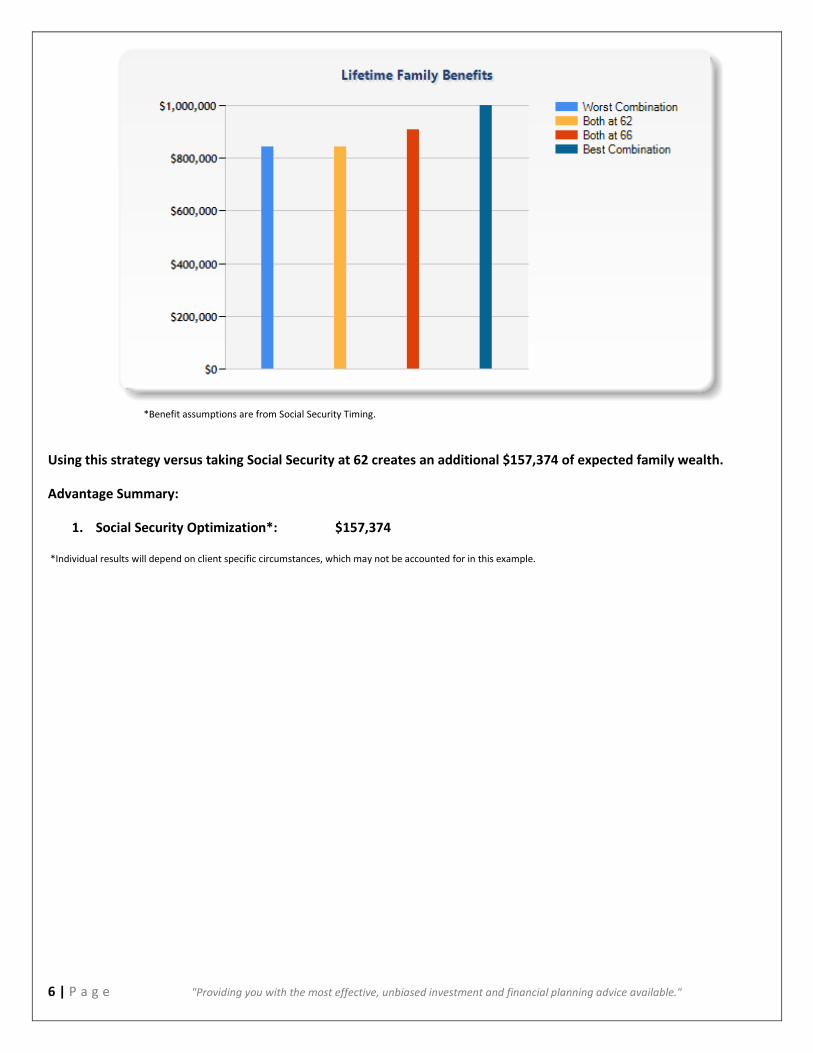
- The expected lifetime family benefit using this strategy is: $999,109. - The expected lifetime family benefit for the worst possible combination is $841,762. - The expected family benefit if both spouses elect at age 62 is: $841,762. - The expected family benefit if both spouses elect at age 66 is: $906,525.
(Continued on the next page.)
Figure 1. Life Expectancy
Age Male Female Either
Spouse Spouse Spouse 50 82 85 88 55 82 85 89 60 83 85 89 65 83 86 89 70 84 86 90 75 85 87 90 80 87 89 92 85 90 91 93
* Calculations are based on mortality data from the Society of Actuaries Retirement Participant 2000 Table.
Figure 2. Personal Social Security Facts – John & Jane Sample
Figure 3. Projected Benefits
Assumptions High Wage Earner Spouse
Age Jane John
62 $ 1,969 $ 1,816
Name Jane John
63 $ 2,152 $ 1,995 Date of Birth 3/4/1952 2/1/1952
64 $ 2,401 $ 2,227
Gender Female Male
65 $ 2,663 $ 2,470 Life Expectancy 89 yrs 7 Mo 80 yrs 5 Mo
66 $ 2,939 $ 2,726
Life Expectancy Adjustment 6 0
67 $ 3,270 $ 3,032 Assumed Inflation 3% 3%
68 $ 3,617 $ 3,354
Real Rate of Return 1% 1%
69 $ 3,983 $ 3,693 Full Retirement Age 66 66
70 $ 4,367 $ 4,050
Figure 1, to the right, shows the average life expectancy of males, females, and either at a given age. It is expected that about half of the people at each age will live longer. This makes planning for a long retirement a necessity.
Figure 2, below, provide the Social Security facts for our sample clients, John & Jane Sample. Figure 3 shows the projected Social Security benefits of Jane and John increasing with age.
*Figure 2 & 3 use life expectancy assumptions based on Social Security mortality tables. Benefit assumptions are from Social Security Timing.
6 | P a g e "Providing you with the most effective, unbiased investment and financial planning advice available."
Using this strategy versus taking Social Security at 62 creates an additional $157,374 of expected family wealth.
Advantage Summary:
1. Social Security Optimization*: $157,374
*Individual results will depend on client specific circumstances, which may not be accounted for in this example.
*Benefit assumptions are from Social Security Timing.

7 | P a g e "Providing you with the most effective, unbiased investment and financial planning advice available."
Secret #2 Roth Conversions
Q: How can your investments be structured to ensure more of your future portfolio gains are tax-free?
A: By using a Roth IRA.
Particularly for those entering retirement, Roth Conversions are one of the best, yet underutilized long-term tax saving strategies available. To understand why, let’s examine the nature of each type of investment account.
After-Tax Accounts (Individual, Joint, Family Trust): Capital gains, dividends/interest, and qualified dividends are taxed in the year in which they occur. Short-term gains, dividends and interest are taxed as ordinary income, while long- term gains and qualified dividends are taxed at long-term capital gains rates.
Tax-Deferred Accounts (IRA, 401k, 403b): Money going into these accounts is usually tax-deferred and normally is taxed as ordinary income when the money is withdrawn. Exception applies for dollars in which no deduction was taken after being contributed. You must also be over 59 ½ to avoid a 10% penalty
Tax-Free Accounts (Roth IRA, Roth 401k): Money going into these accounts is after-tax and therefore is not taxed when the money is withdrawn (subject to the five year rule). You must also be over 59 ½ to avoid a 10% penalty.
During our working years, fully funding our tax-deferred investment accounts is a very sensible tax reduction strategy. However, upon entering retirement, the tax picture changes. Many new retirees find themselves in a much lower tax bracket then they were just prior to retirement, which creates a great opportunity to shift assets from a tax-deferred account to a tax-free Roth account. However, this should be done before their income bracket rises due to social security and Required Minimum Distributions (RMDs) start at age 70 ½.
The core idea is to convert assets while in a lower tax bracket and avoid paying taxes at a higher tax rate later (after Social Security and RMDs start). This will have the effect of lowering your overall tax during your lifetime.
There are several rules that apply to Roth conversions that make them an extremely flexible tax planning tool, for example:
1) Roth conversions can be “un-done” through what is called a recharacterization, which essentially moves the converted assets back into the IRA the assets came from, thus avoiding taxation. This is helpful if the assets converted to the Roth IRA drop in value, since income tax will be due on the value of the amount at the time of conversion.
2) A recharacterization must be done within the same tax year as the conversion to avoid filing an amended return. 3) The latest date to do a recharacterization is the extended tax filing deadline of the year after the initial
conversion (typically October 15). 4) You can also “recharacterize and switch” if your spouse also has tax-deferred assets. In this scenario, if there is a
market decline, one spouse’s conversion is recharacterized and then a conversion is done with the other spouses IRA (who did not previously convert in the current year). This turns a drop in value to your advantage by converting more shares while the market is lower.
Understanding these rules is very important because the ideal window of opportunity to execute your Roth conversion strategy is between retirement and age 70.
(To see a Roth conversion illustration, continue to the next page.)
8 | P a g e "Providing you with the most effective, unbiased investment and financial planning advice available."
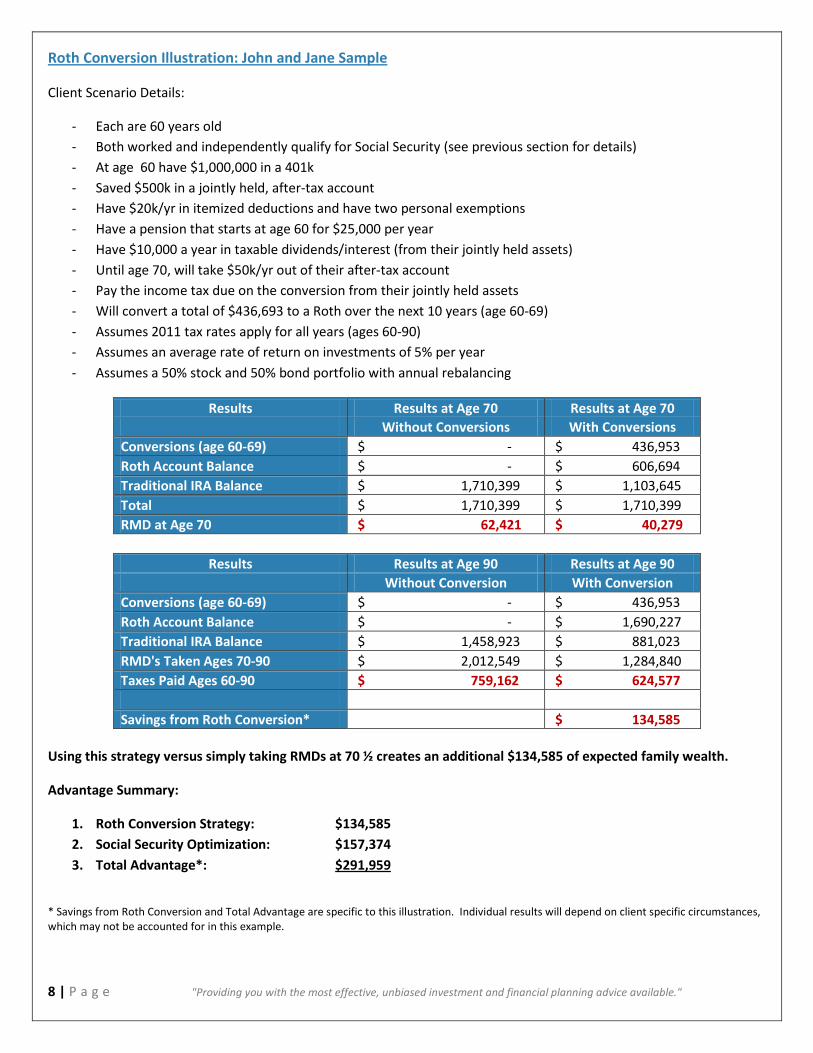
Roth Conversion Illustration: John and Jane Sample
Client Scenario Details:
- Each are 60 years old - Both worked and independently qualify for Social Security (see previous section for details) - At age 60 have $1,000,000 in a 401k - Saved $500k in a jointly held, after-tax account - Have $20k/yr in itemized deductions and have two personal exemptions - Have a pension that starts at age 60 for $25,000 per year - Have $10,000 a year in taxable dividends/interest (from their jointly held assets) - Until age 70, will take $50k/yr out of their after-tax account - Pay the income tax due on the conversion from their jointly held assets - Will convert a total of $436,693 to a Roth over the next 10 years (age 60-69) - Assumes 2011 tax rates apply for all years (ages 60-90) - Assumes an average rate of return on investments of 5% per year - Assumes a 50% stock and 50% bond portfolio with annual rebalancing
Results Results at Age 70 Results at Age 70 Without Conversions With Conversions Conversions (age 60-69) $ - $ 436,953 Roth Account Balance $ - $ 606,694 Traditional IRA Balance $ 1,710,399 $ 1,103,645 Total $ 1,710,399 $ 1,710,399 RMD at Age 70 $ 62,421 $ 40,279
Results Results at Age 90 Results at Age 90 Without Conversion With Conversion
Conversions (age 60-69) $ - $ 436,953 Roth Account Balance $ - $ 1,690,227 Traditional IRA Balance $ 1,458,923 $ 881,023 RMD's Taken Ages 70-90 $ 2,012,549 $ 1,284,840 Taxes Paid Ages 60-90 $ 759,162 $ 624,577 Savings from Roth Conversion* $ 134,585
Using this strategy versus simply taking RMDs at 70 ½ creates an additional $134,585 of expected family wealth.
Advantage Summary:
1. Roth Conversion Strategy: $134,585 2. Social Security Optimization: $157,374 3. Total Advantage*: $291,959
* Savings from Roth Conversion and Total Advantage are specific to this illustration. Individual results will depend on client specific circumstances, which may not be accounted for in this example.

9 | P a g e "Providing you with the most effective, unbiased investment and financial planning advice available."
Secret #3: Asset Placement
Wouldn’t it be nice if there was a way to ensure that more of your high expected growth investments could be sheltered from future taxation? Of course it would, and it is called the Roth IRA.
Each year, as assets are converted to your Roth IRA, you can choose which investments will be placed in the Roth IRA and which are used in the Traditional IRA. This means, while keeping your overall stock to bond allocation consistent, you can hold more aggressive investments (like stocks) in your Roth IRA and hold more conservative investments (like bonds) in your Traditional IRA.
The advantage is that gains in the Roth IRA are tax-free, while gains in the traditional IRA will be taxed as ordinary income. As you enter retirement, it may also be preferable to hold high growth assets (like stocks) in your after-tax account instead of your Traditional IRA’s. The reason for this is threefold:
1. This will help reduce future Required Minimum Distributions beginning at age 70 ½. 2. Realized capital losses on assets held in after-tax account can be used to offset realized capital gains. 3. Tax on appreciated securities held longer than 12 months in after-tax accounts are eligible for favorable long-
term capital gains tax treatment (all investment gains, regardless of hold time, is taxed as ordinary income when taken out of a tax-deferred account).
Of course, there are many other considerations when it comes to implementing this strategy, which is why working with an advisor, who understands the intricacies of your comprehensive wealth plan, is so important. There are also a few rules that we believe should never be broken, even in the pursuit of higher after tax returns:
1. NEVER sacrifice diversification 2. NEVER sacrifice your asset allocation among stocks, bonds, and cash 3. ALWAYS use a balanced allocation in the account you’re using for withdrawal needs
We strongly believe that following these three key rules of investing is critical to your investment success. While it may seem simple, it is not easy. Particularly if you do not have the time, interest, knowledge, or resources to implement them.
(To see an asset placement illustration, continue to the next page.)
This is an example of a traditional $1 mm 50% stock and 50% bond portfolio.
This is an example of a $1 mm 50% stock and 50% bond portfolio using asset placement.
Roth IRA Traditional IRA Roth IRA Traditional IRA
10 | P a g e "Providing you with the most effective, unbiased investment and financial planning advice available."
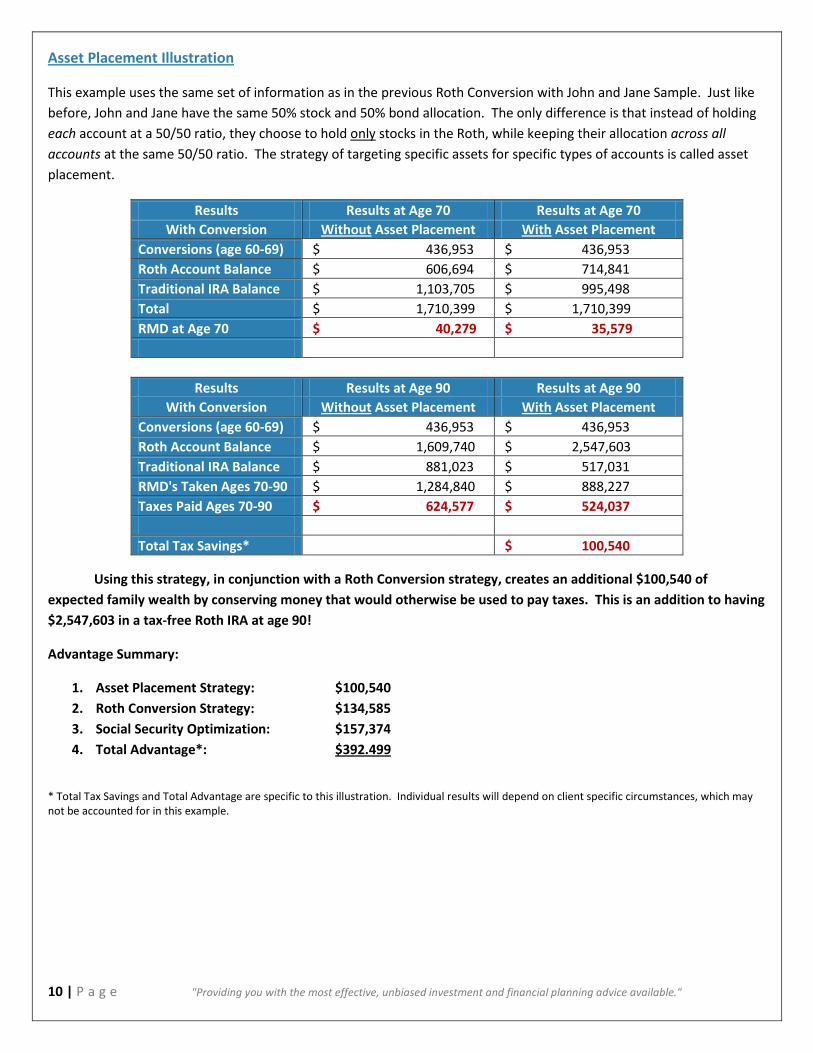
Asset Placement Illustration
This example uses the same set of information as in the previous Roth Conversion with John and Jane Sample. Just like before, John and Jane have the same 50% stock and 50% bond allocation. The only difference is that instead of holding each account at a 50/50 ratio, they choose to hold only stocks in the Roth, while keeping their allocation across all accounts at the same 50/50 ratio. The strategy of targeting specific assets for specific types of accounts is called asset placement.
Results Results at Age 70 Results at Age 70 With Conversion Without Asset Placement With Asset Placement
Conversions (age 60-69) $ 436,953 $ 436,953 Roth Account Balance $ 606,694 $ 714,841 Traditional IRA Balance $ 1,103,705 $ 995,498 Total $ 1,710,399 $ 1,710,399 RMD at Age 70 $ 40,279 $ 35,579
Results Results at Age 90 Results at Age 90 With Conversion Without Asset Placement With Asset Placement
Conversions (age 60-69) $ 436,953 $ 436,953 Roth Account Balance $ 1,609,740 $ 2,547,603 Traditional IRA Balance $ 881,023 $ 517,031 RMD's Taken Ages 70-90 $ 1,284,840 $ 888,227 Taxes Paid Ages 70-90 $ 624,577 $ 524,037 Total Tax Savings* $ 100,540
Using this strategy, in conjunction with a Roth Conversion strategy, creates an additional $100,540 of expected family wealth by conserving money that would otherwise be used to pay taxes. This is an addition to having $2,547,603 in a tax-free Roth IRA at age 90!
Advantage Summary:
1. Asset Placement Strategy: $100,540 2. Roth Conversion Strategy: $134,585 3. Social Security Optimization: $157,374 4. Total Advantage*: $392.499
* Total Tax Savings and Total Advantage are specific to this illustration. Individual results will depend on client specific circumstances, which may not be accounted for in this example.
11 | P a g e "Providing you with the most effective, unbiased investment and financial planning advice available."
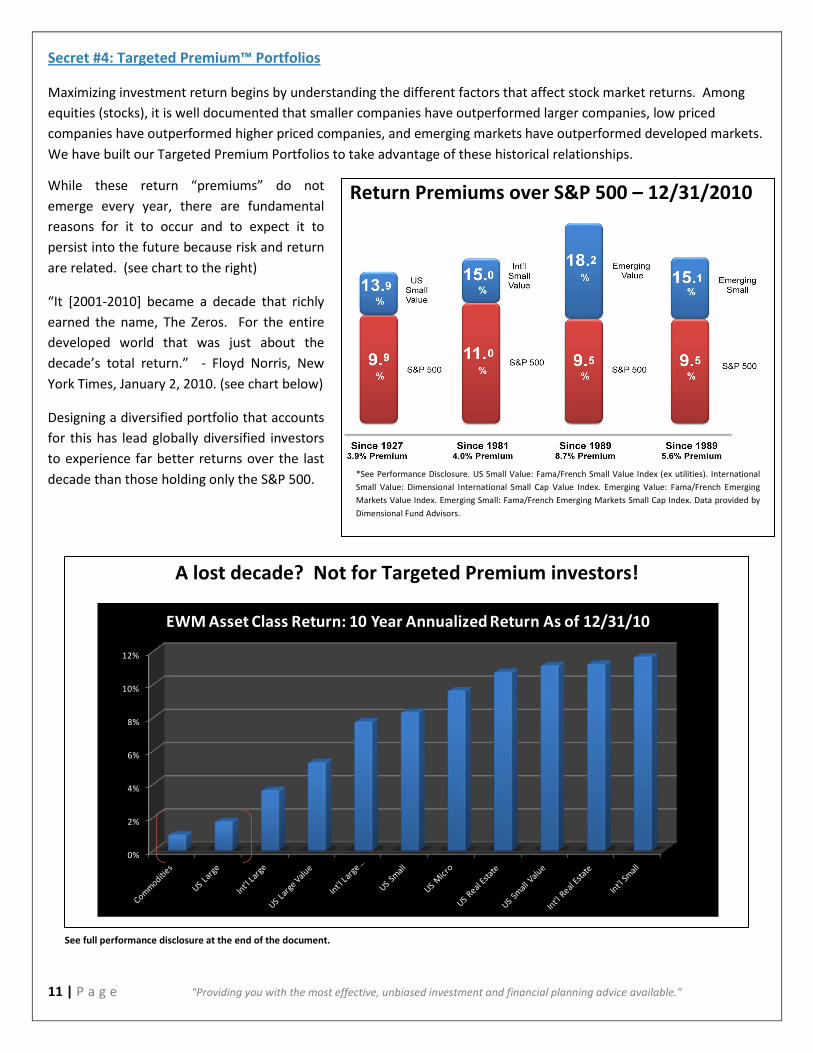
Secret #4: Targeted Premium™ Portfolios
Maximizing investment return begins by understanding the different factors that affect stock market returns. Among equities (stocks), it is well documented that smaller companies have outperformed larger companies, low priced companies have outperformed higher priced companies, and emerging markets have outperformed developed markets. We have built our Targeted Premium Portfolios to take advantage of these historical relationships.
Return Premiums over S&P 500 – 12/31/2010
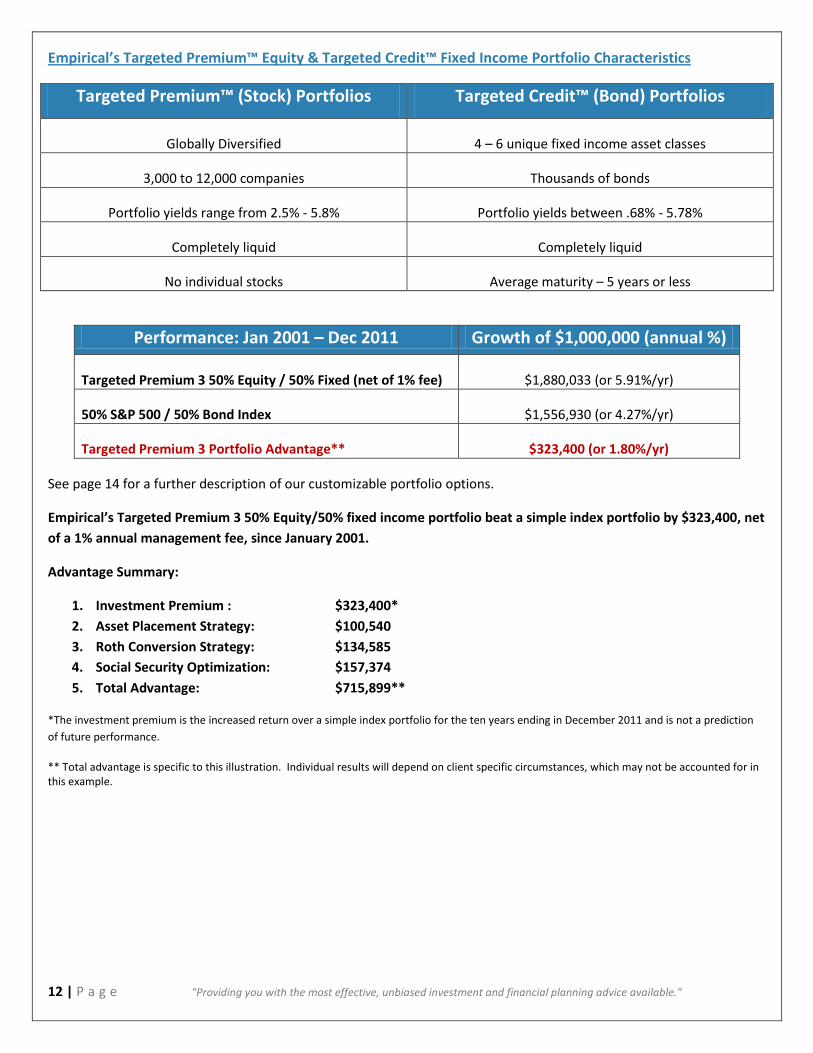
A lost decade? Not for Targeted Premium investors!
See full performance disclosure at the end of the document.
0%
2%
4%
6%
8%
10%
12%
EWM Asset Class Return: 10 Year Annualized Return As of 12/31/10
While these return “premiums” do not emerge every year, there are fundamental reasons for it to occur and to expect it to persist into the future because risk and return are related. (see chart to the right)
“It [2001-2010] became a decade that richly earned the name, The Zeros. For the entire developed world that was just about the decade’s total return.” - Floyd Norris, New York Times, January 2, 2010. (see chart below)
Designing a diversified portfolio that accounts for this has lead globally diversified investors to experience far better returns over the last decade than those holding only the S&P 500.
*See Performance Disclosure. US Small Value: Fama/French Small Value Index (ex utilities). International Small Value: Dimensional International Small Cap Value Index. Emerging Value: Fama/French Emerging Markets Value Index. Emerging Small: Fama/French Emerging Markets Small Cap Index. Data provided by Dimensional Fund Advisors.
12 | P a g e "Providing you with the most effective, unbiased investment and financial planning advice available."
Empirical’s Targeted Premium™ Equity & Targeted Credit™ Fixed Income Portfolio Characteristics
Targeted Premium™ (Stock) Portfolios Targeted Credit™ (Bond) Portfolios
Globally Diversified 4 – 6 unique fixed income asset classes
3,000 to 12,000 companies Thousands of bonds
Portfolio yields range from 2.5% - 5.8% Portfolio yields between .68% - 5.78%
Completely liquid Completely liquid
No individual stocks Average maturity – 5 years or less
Performance: Jan 2001 – Dec 2011 Growth of $1,000,000 (annual %)
Targeted Premium 3 50% Equity / 50% Fixed (net of 1% fee) $1,880,033 (or 5.91%/yr)
50% S&P 500 / 50% Bond Index $1,556,930 (or 4.27%/yr)
Targeted Premium 3 Portfolio Advantage** $323,400 (or 1.80%/yr)
See page 14 for a further description of our customizable portfolio options.
Empirical’s Targeted Premium 3 50% Equity/50% fixed income portfolio beat a simple index portfolio by $323,400, net of a 1% annual management fee, since January 2001.
Advantage Summary:
1. Investment Premium : $323,400* 2. Asset Placement Strategy: $100,540 3. Roth Conversion Strategy: $134,585 4. Social Security Optimization: $157,374 5. Total Advantage: $715,899**
*The investment premium is the increased return over a simple index portfolio for the ten years ending in December 2011 and is not a prediction of future performance.
** Total advantage is specific to this illustration. Individual results will depend on client specific circumstances, which may not be accounted for in this example.

13 | P a g e "Providing you with the most effective, unbiased investment and financial planning advice available."
Secret #5: Coordination of Strategies - Your Retirement Advantage!
With most things in life, we get better with experience. Unfortunately with retirement we only get one chance. That is why it is important to make the most of your retirement by exploring every possible advantage. The best part is that once you understand where superior investment returns come from, maximize Social Security, and minimize taxes, (through strategic Roth conversions and asset placement) getting what you need from your investment portfolio becomes far easier. This in turn gives you the luxury of being able to take less risk with your investments and consequently helps to provide more certainty about your future.
Our advisors education, experience, and credentials allow Empirical to bring an unusually high level of expertise and coordination to your financial life. We have helped hundreds of people retire more securely than they thought possible. If you don’t have the time, interest, and resources to effectively coordinate your ideal retirement plan, you owe it to yourself to see how Empirical can help enable you avoid unneeded risks, pay less in taxes, and have a more enjoyable retirement.
If you are interested in seeing how Empirical would apply the techniques described in this material to your retirement, give us a call to schedule your appointment. Just for meeting with us, you will receive a complimentary, no obligation customized Social Security analysis.
14 | P a g e "Providing you with the most effective, unbiased investment and financial planning advice available."
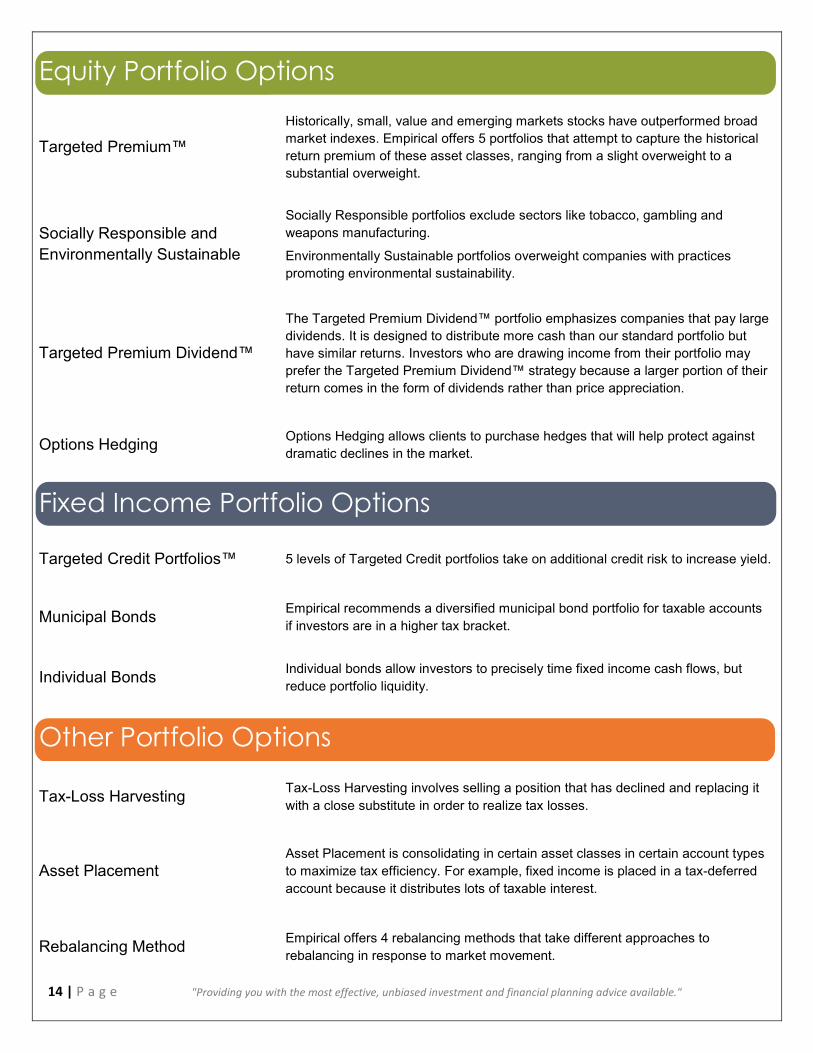
Equity Portfolio Options
Targeted Premium™
Historically, small, value and emerging markets stocks have outperformed broad market indexes. Empirical offers 5 portfolios that attempt to capture the historical return premium of these asset classes, ranging from a slight overweight to a substantial overweight.
Socially Responsible and Environmentally Sustainable
Socially Responsible portfolios exclude sectors like tobacco, gambling and weapons manufacturing.
Environmentally Sustainable portfolios overweight companies with practices promoting environmental sustainability.
Targeted Premium Dividend™
The Targeted Premium Dividend™ portfolio emphasizes companies that pay large dividends. It is designed to distribute more cash than our standard portfolio but have similar returns. Investors who are drawing income from their portfolio may prefer the Targeted Premium Dividend™ strategy because a larger portion of their return comes in the form of dividends rather than price appreciation.
Options Hedging Options Hedging allows clients to purchase hedges that will help protect against dramatic declines in the market.
Fixed Income Portfolio Options
Targeted Credit Portfolios™ 5 levels of Targeted Credit portfolios take on additional credit risk to increase yield.
Municipal Bonds Empirical recommends a diversified municipal bond portfolio for taxable accounts if investors are in a higher tax bracket.
Individual Bonds Individual bonds allow investors to precisely time fixed income cash flows, but reduce portfolio liquidity.
Other Portfolio Options
Tax-Loss Harvesting Tax-Loss Harvesting involves selling a position that has declined and replacing it with a close substitute in order to realize tax losses.
Asset Placement Asset Placement is consolidating in certain asset classes in certain account types to maximize tax efficiency. For example, fixed income is placed in a tax-deferred account because it distributes lots of taxable interest.
Rebalancing Method Empirical offers 4 rebalancing methods that take different approaches to rebalancing in response to market movement.
15 | P a g e "Providing you with the most effective, unbiased investment and financial planning advice available."
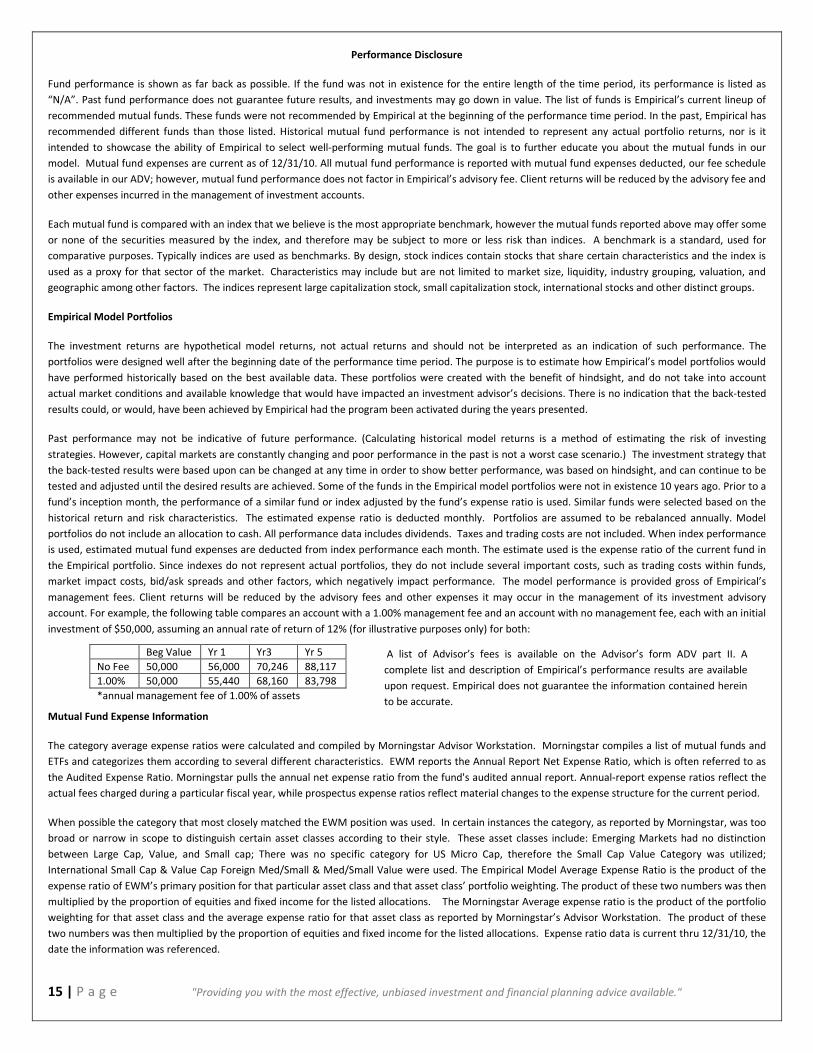
Performance Disclosure
Fund performance is shown as far back as possible. If the fund was not in existence for the entire length of the time period, its performance is listed as “N/A”. Past fund performance does not guarantee future results, and investments may go down in value. The list of funds is Empirical’s current lineup of recommended mutual funds. These funds were not recommended by Empirical at the beginning of the performance time period. In the past, Empirical has recommended different funds than those listed. Historical mutual fund performance is not intended to represent any actual portfolio returns, nor is it intended to showcase the ability of Empirical to select well-performing mutual funds. The goal is to further educate you about the mutual funds in our model. Mutual fund expenses are current as of 12/31/10. All mutual fund performance is reported with mutual fund expenses deducted, our fee schedule is available in our ADV; however, mutual fund performance does not factor in Empirical’s advisory fee. Client returns will be reduced by the advisory fee and other expenses incurred in the management of investment accounts.
Each mutual fund is compared with an index that we believe is the most appropriate benchmark, however the mutual funds reported above may offer some or none of the securities measured by the index, and therefore may be subject to more or less risk than indices. A benchmark is a standard, used for comparative purposes. Typically indices are used as benchmarks. By design, stock indices contain stocks that share certain characteristics and the index is used as a proxy for that sector of the market. Characteristics may include but are not limited to market size, liquidity, industry grouping, valuation, and geographic among other factors. The indices represent large capitalization stock, small capitalization stock, international stocks and other distinct groups.
Empirical Model Portfolios
The investment returns are hypothetical model returns, not actual returns and should not be interpreted as an indication of such performance. The portfolios were designed well after the beginning date of the performance time period. The purpose is to estimate how Empirical’s model portfolios would have performed historically based on the best available data. These portfolios were created with the benefit of hindsight, and do not take into account actual market conditions and available knowledge that would have impacted an investment advisor’s decisions. There is no indication that the back-tested results could, or would, have been achieved by Empirical had the program been activated during the years presented.
Past performance may not be indicative of future performance. (Calculating historical model returns is a method of estimating the risk of investing strategies. However, capital markets are constantly changing and poor performance in the past is not a worst case scenario.) The investment strategy that the back-tested results were based upon can be changed at any time in order to show better performance, was based on hindsight, and can continue to be tested and adjusted until the desired results are achieved. Some of the funds in the Empirical model portfolios were not in existence 10 years ago. Prior to a fund’s inception month, the performance of a similar fund or index adjusted by the fund’s expense ratio is used. Similar funds were selected based on the historical return and risk characteristics. The estimated expense ratio is deducted monthly. Portfolios are assumed to be rebalanced annually. Model portfolios do not include an allocation to cash. All performance data includes dividends. Taxes and trading costs are not included. When index performance is used, estimated mutual fund expenses are deducted from index performance each month. The estimate used is the expense ratio of the current fund in the Empirical portfolio. Since indexes do not represent actual portfolios, they do not include several important costs, such as trading costs within funds, market impact costs, bid/ask spreads and other factors, which negatively impact performance. The model performance is provided gross of Empirical’s management fees. Client returns will be reduced by the advisory fees and other expenses it may occur in the management of its investment advisory account. For example, the following table compares an account with a 1.00% management fee and an account with no management fee, each with an initial investment of $50,000, assuming an annual rate of return of 12% (for illustrative purposes only) for both:
Mutual Fund Expense Information
The category average expense ratios were calculated and compiled by Morningstar Advisor Workstation. Morningstar compiles a list of mutual funds and ETFs and categorizes them according to several different characteristics. EWM reports the Annual Report Net Expense Ratio, which is often referred to as the Audited Expense Ratio. Morningstar pulls the annual net expense ratio from the fund's audited annual report. Annual-report expense ratios reflect the actual fees charged during a particular fiscal year, while prospectus expense ratios reflect material changes to the expense structure for the current period.
When possible the category that most closely matched the EWM position was used. In certain instances the category, as reported by Morningstar, was too broad or narrow in scope to distinguish certain asset classes according to their style. These asset classes include: Emerging Markets had no distinction between Large Cap, Value, and Small cap; There was no specific category for US Micro Cap, therefore the Small Cap Value Category was utilized; International Small Cap & Value Cap Foreign Med/Small & Med/Small Value were used. The Empirical Model Average Expense Ratio is the product of the expense ratio of EWM’s primary position for that particular asset class and that asset class’ portfolio weighting. The product of these two numbers was then multiplied by the proportion of equities and fixed income for the listed allocations. The Morningstar Average expense ratio is the product of the portfolio weighting for that asset class and the average expense ratio for that asset class as reported by Morningstar’s Advisor Workstation. The product of these two numbers was then multiplied by the proportion of equities and fixed income for the listed allocations. Expense ratio data is current thru 12/31/10, the date the information was referenced.
Beg Value Yr 1 Yr3 Yr 5 No Fee 50,000 56,000 70,246 88,117 1.00% 50,000 55,440 68,160 83,798 *annual management fee of 1.00% of assets
A list of Advisor’s fees is available on the Advisor’s form ADV part II. A complete list and description of Empirical’s performance results are available upon request. Empirical does not guarantee the information contained herein to be accurate.

1420 Fifth Ave, Suite 3150Seattle, Washington 98101
1135 Broadway Plaza, Suite 101Tacoma, Washington 98402
www.empiricalfs.comPhone: 206.923.3474Toll Free: 800.923.4307Toll Free: 800.923.4307Fax: 206.923.3484