re:trace applied reverse engineering on os x - … · dtrace background what is dtrace™? *dtrace...
TRANSCRIPT
RE:Trace – Applied Reverse Engineering on OS X
Tiller BeauchampSAIC
David WestonMicrosoft

DTRACE BACKGROUNDWhat Is DTrace™?
*Dtrace was created by Sun Microsystems, Inc. and released under the Common Development and Distribution License (CDDL), a free software license based on the Mozilla Public License (MPL).
DTrace Background
• Kernel-based dynamic tracing framework• Created by Sun Microsystems• First released with Solaris™ 10 operating System• Now included with Apple OS X Leopard, QNX• June 10th, 2008, committed to CURRENT branch
of FreeBSD 7, Will be in 8 STABLE (John Birrell)• OpenBSD, NetBSD, Linux?
*Solaris™ is a trademark of Sun Microsystems, Inc. in the United States and/or other countries.

DTrace Overview
• DTrace is a framework for performance observability and debugging in real time
• Tracing is made possible by thousands of “probes” placed “on the fly” throughout the system
• Probes are points of instrumentation in the kernel• When a program execution passes one of these
points, the probe that enabled it is said to have fired
• DTrace can bind a set of actions to each probe
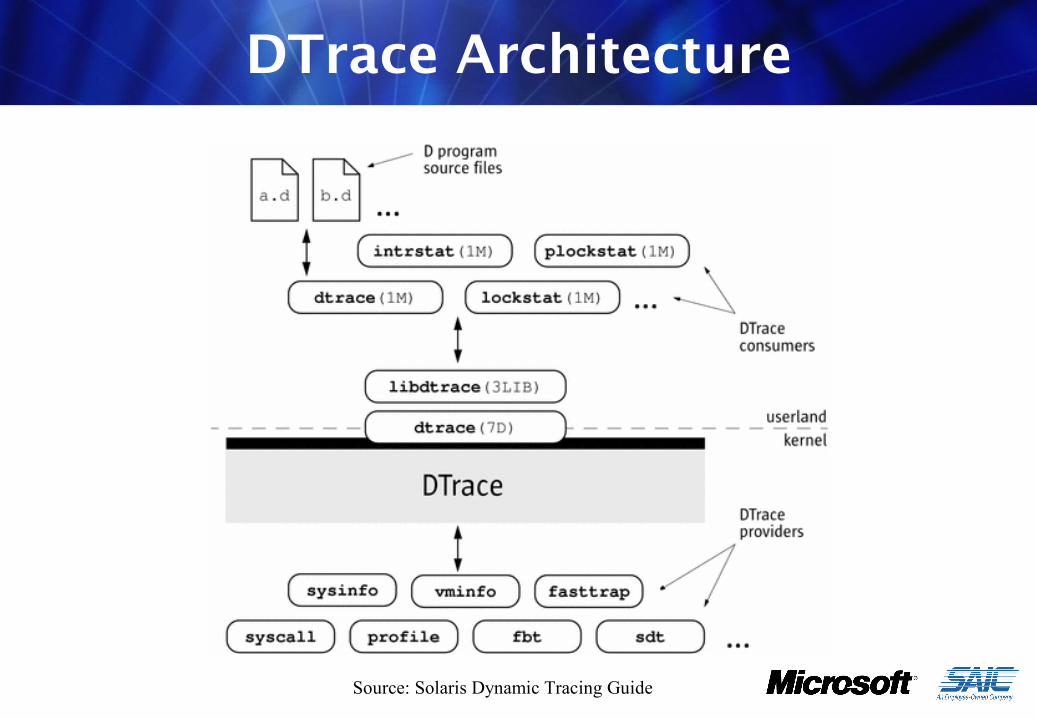
DTrace Architecture
Source: Solaris Dynamic Tracing Guide
The D Language
• D is an interpreted, block-structured language• D syntax is a subset of C• D programs are compiled into intermediate form• Intermediate form is validated for safety when
your program is first examined by the DTrace kernel software
• The DTrace execution environment handles any runtime errors
The D Language
• D does not use control-flow constructs such as if statements and loops
• D program clauses are written as single, straight-line statement lists that trace an optional, fixed amount of data
• D can conditionally trace data and modify control flow using logical expressions called predicates
• A predicate is tested at probe firing before executing any statements
DTrace Performance
• DTrace is dynamic: probes are enabled only when you need them
• No code is present for inactive probes• There is no performance degradation when you
are not using DTrace• When the dtrace command exits, all probes are
disabled and instrumentation removed • The system is returned to its original state
DTrace Uses
• DTrace takes the power of multiple tools and unifies them with one programmatically accessible interface
• DTrace has features similar to the following:– truss: tracing system calls, user functions– ptrace: tracing library calls – prex/tnf*: tracing kernel functions – lockstat: profiling the kernel – gdb: access to kernel/user memory
DTrace Uses
• DTrace combines system performance statistics, debugging information, and execution analysis into one tight package
• A real “Swiss army knife” for reverse engineers• DTrace probes can monitor every part of the
system, giving “the big picture” or zooming in for a closer look
• Can debug “transient” processes that other debuggers cannot
Creating DTrace Scripts
• Dozens of ready-to-use scripts are included with Sun’s DTraceToolkit; they can be used as templates
• These scripts provide functions such as syscalls by process, reads and writes by process, file access, stack size, CPU time, memory r/w and statistics
• Complex problems can often be diagnosed by a single “one-liner” DTrace script
Example: Syscall Count
12334
43096899
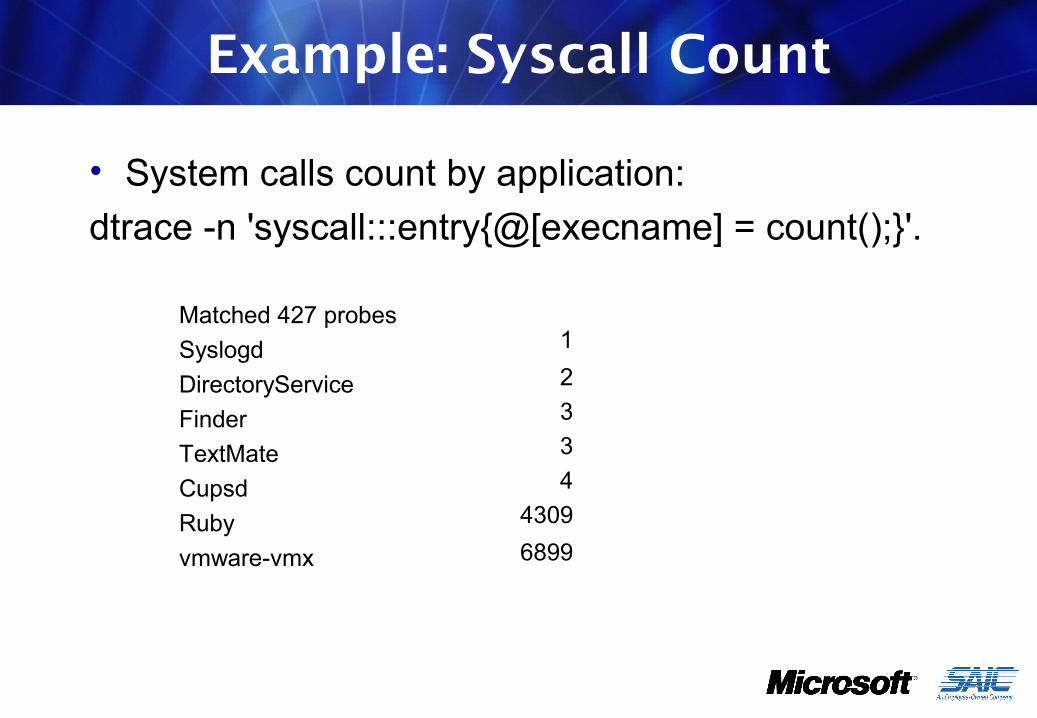
• System calls count by application:dtrace -n 'syscall:::entry{@[execname] = count();}'.
Matched 427 probesSyslogdDirectoryServiceFinderTextMateCupsdRubyvmware-vmx
Example: File Open Snoop
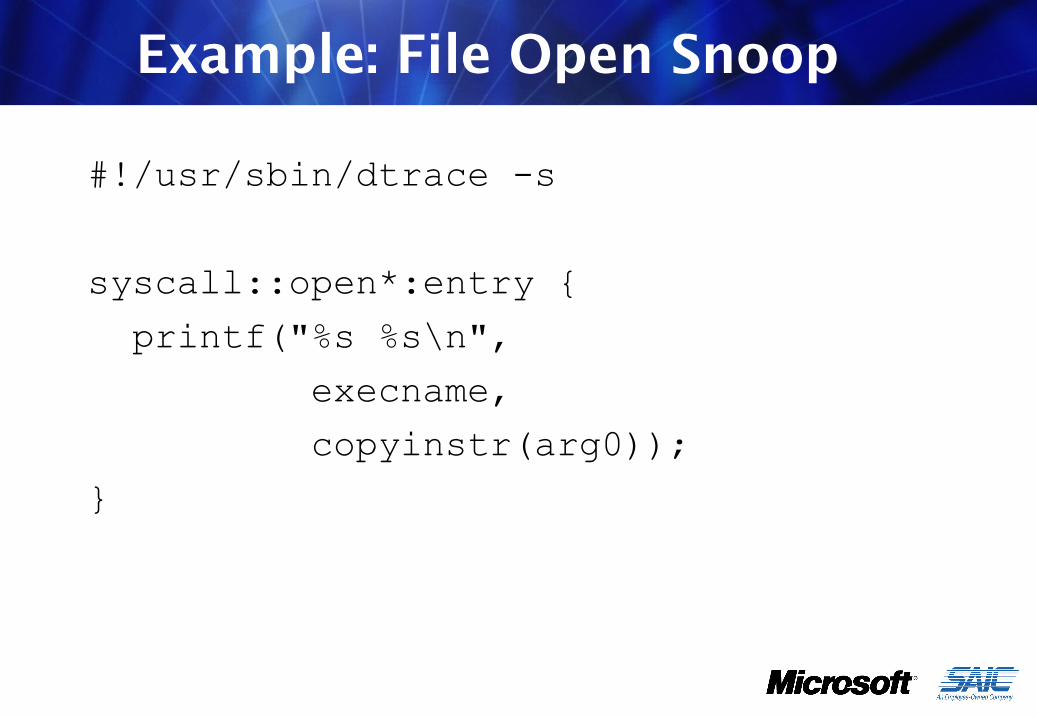
#!/usr/sbin/dtrace -s
syscall::open*:entry { printf("%s %s\n", execname, copyinstr(arg0));}
Example: File Snoop Output
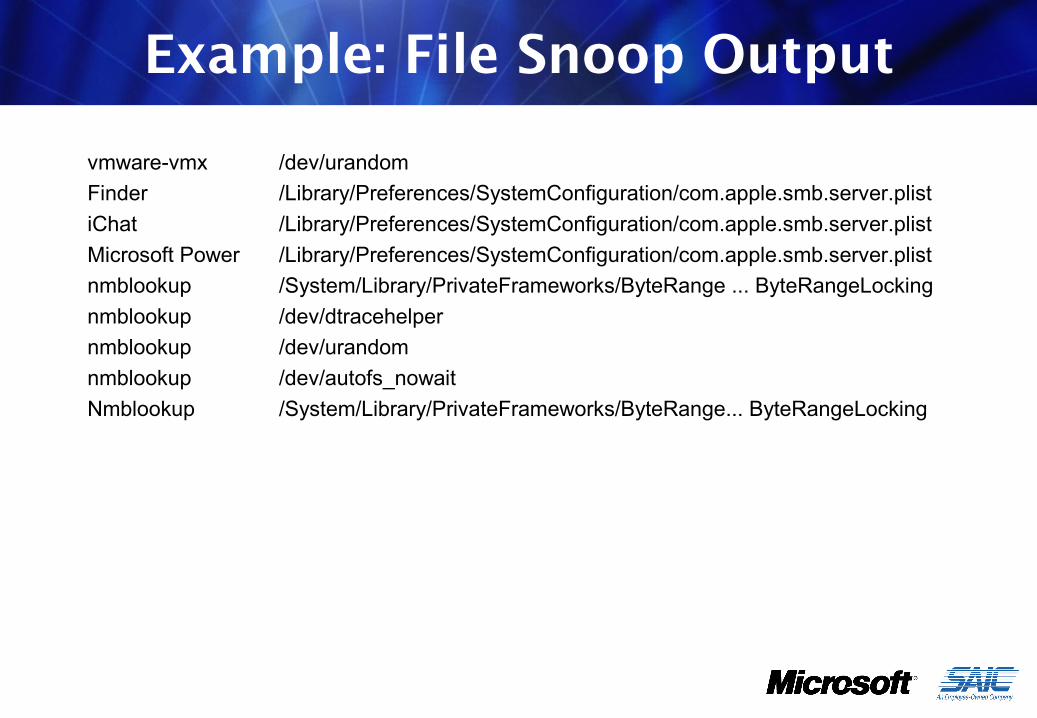
vmware-vmx /dev/urandomFinder /Library/Preferences/SystemConfiguration/com.apple.smb.server.plistiChat /Library/Preferences/SystemConfiguration/com.apple.smb.server.plistMicrosoft Power /Library/Preferences/SystemConfiguration/com.apple.smb.server.plistnmblookup /System/Library/PrivateFrameworks/ByteRange ... ByteRangeLockingnmblookup /dev/dtracehelpernmblookup /dev/urandomnmblookup /dev/autofs_nowaitNmblookup /System/Library/PrivateFrameworks/ByteRange... ByteRangeLocking
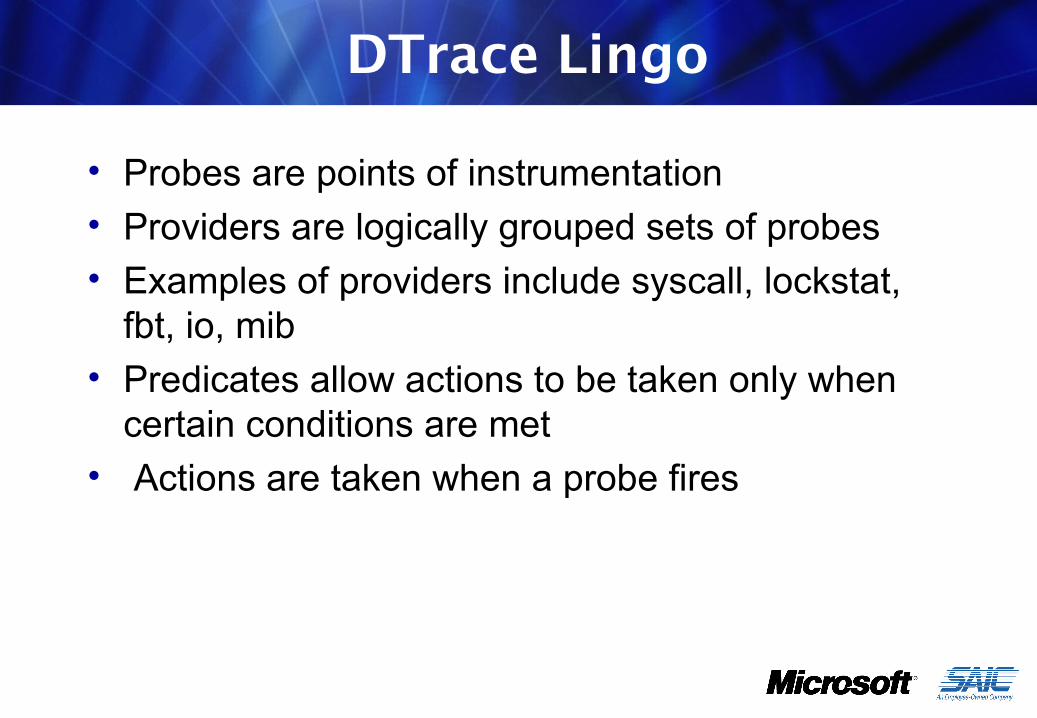
DTrace Lingo
• Probes are points of instrumentation• Providers are logically grouped sets of probes• Examples of providers include syscall, lockstat,
fbt, io, mib• Predicates allow actions to be taken only when
certain conditions are met• Actions are taken when a probe fires
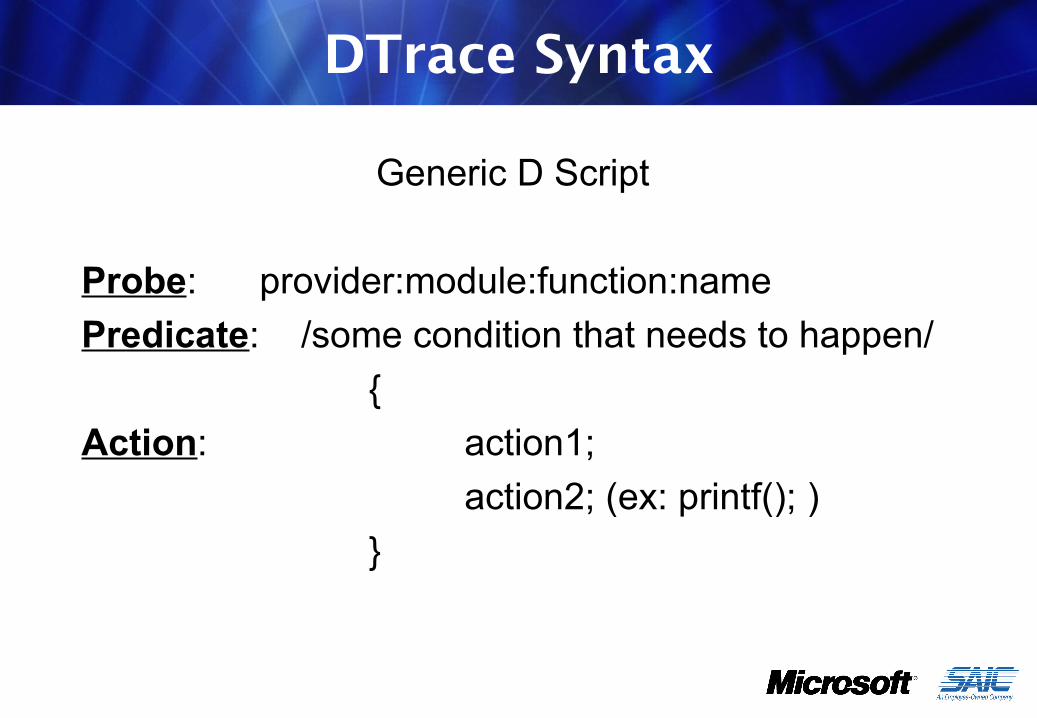
DTrace Syntax
Generic D Script
Probe: provider:module:function:namePredicate: /some condition that needs to happen/
{Action: action1; action2; (ex: printf(); )
}
DTRACE AND REVERSE ENGINEERING (RE)
How Can We Use DTrace?
DTrace for RE
• DTrace is extremely versatile and has many applications for RE
• It is very useful for understanding the way a process works and interacts with the rest of the system
• DTrace probes work in a manner very similar to debugger “hooks”
• DTrace probes are useful because they can be described generically and focused later
DTrace for RE
• Think of DTrace as a rapid development framework for RE tasks and tools
• One of DTrace’s greatest assets is speed• DTrace can instrument any process on the
system without starting or stopping it• Complex operations can be understood with a
succinct one-line script• You can refine your script as the process
continues to run
Helpful Features
DTrace gives us some valuable features for free:• Control flow indicators• Symbol resolution• Call stack trace• Function parameter values• CPU register values• Both in kernel space and user space!

Control Flow
1 -> -[AIContentController finishSendContentObject:] 1 -> -[AIAdium notificationCenter] 1 <- -[AIAdium notificationCenter] 1 -> -[AIContentController processAndSendContentObject:] 1 -> -[AIContentController handleFileSendsForContentMessage:] 1 <- -[AIContentController handleFileSendsForContentMessage:] 1 -> -[AdiumOTREncryption willSendContentMessage:] 1 -> policy_cb 1 -> contactFromInfo 1 -> -[AIAdium contactController] 1 <- -[AIAdium contactController] 1 -> accountFromAccountID
Symbol and Stack Trace
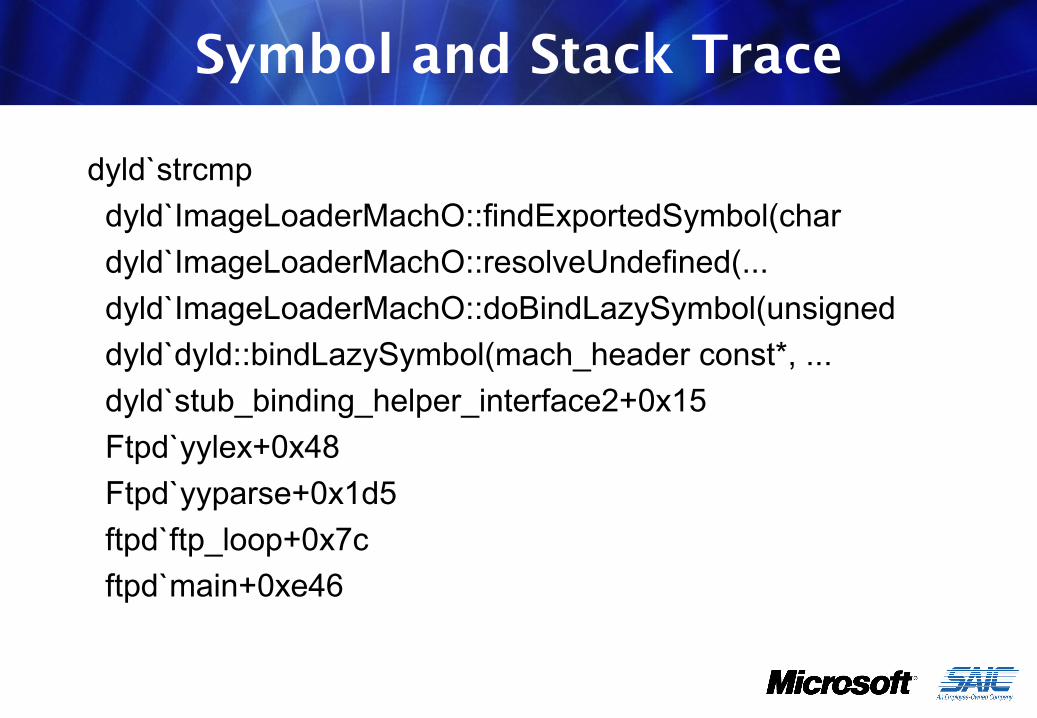
dyld`strcmp dyld`ImageLoaderMachO::findExportedSymbol(char dyld`ImageLoaderMachO::resolveUndefined(... dyld`ImageLoaderMachO::doBindLazySymbol(unsigned dyld`dyld::bindLazySymbol(mach_header const*, ... dyld`stub_binding_helper_interface2+0x15 Ftpd`yylex+0x48 Ftpd`yyparse+0x1d5 ftpd`ftp_loop+0x7c ftpd`main+0xe46
Function Parameters
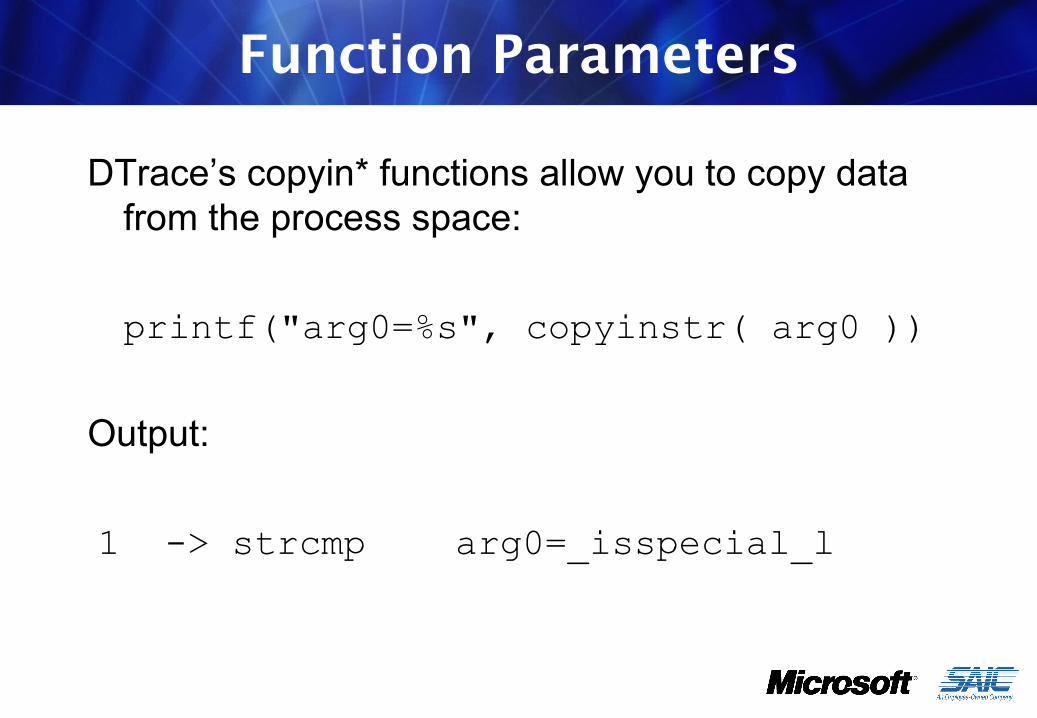
DTrace’s copyin* functions allow you to copy data from the process space:
printf("arg0=%s", copyinstr( arg0 ))
Output:
1 -> strcmp arg0=_isspecial_l
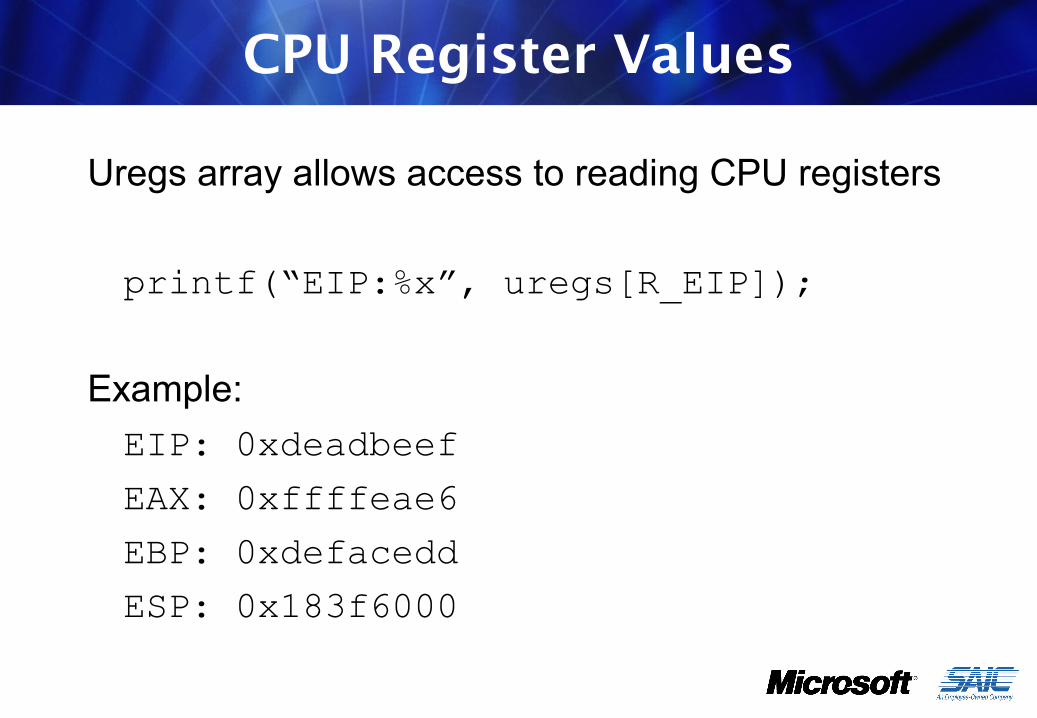
CPU Register Values
Uregs array allows access to reading CPU registers
printf(“EIP:%x”, uregs[R_EIP]);
Example:EIP: 0xdeadbeefEAX: 0xffffeae6EBP: 0xdefaceddESP: 0x183f6000
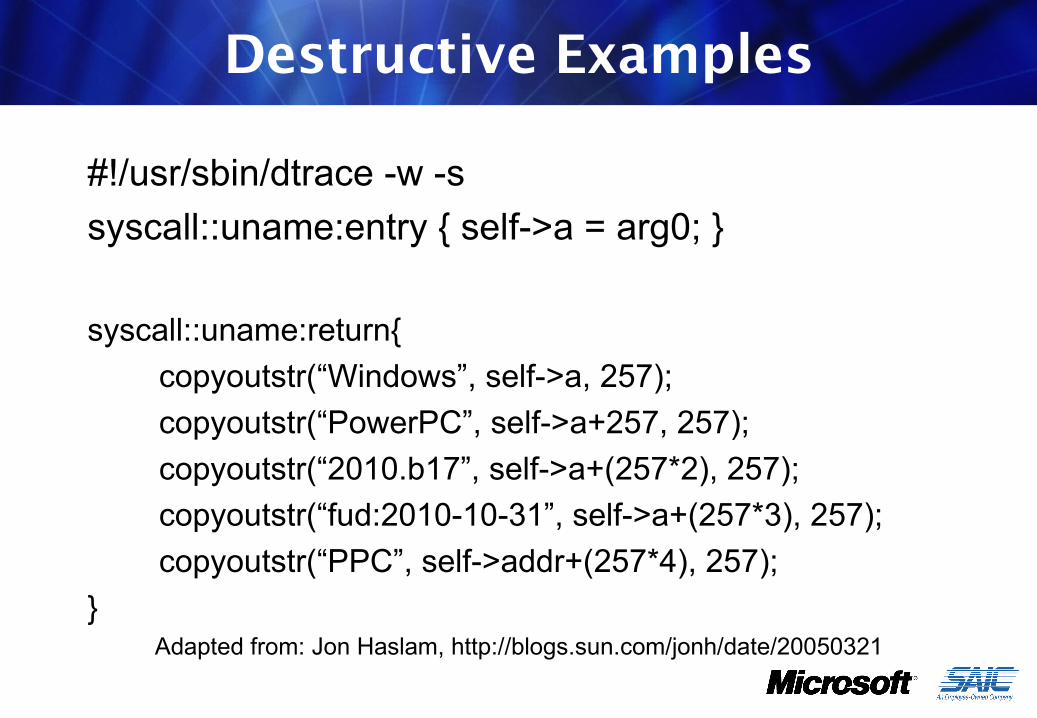
Destructive Examples
#!/usr/sbin/dtrace -w -ssyscall::uname:entry { self->a = arg0; }
syscall::uname:return{ copyoutstr(“Windows”, self->a, 257); copyoutstr(“PowerPC”, self->a+257, 257); copyoutstr(“2010.b17”, self->a+(257*2), 257); copyoutstr(“fud:2010-10-31”, self->a+(257*3), 257); copyoutstr(“PPC”, self->addr+(257*4), 257);}
Adapted from: Jon Haslam, http://blogs.sun.com/jonh/date/20050321
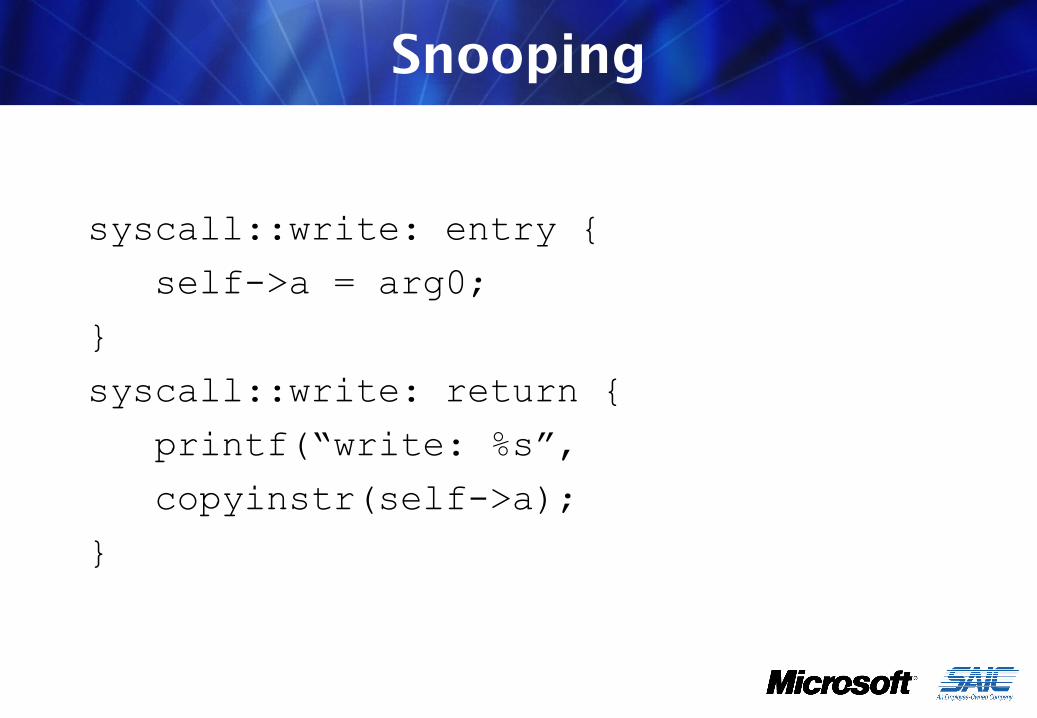
Snooping
syscall::write: entry { self->a = arg0; }syscall::write: return { printf(“write: %s”, copyinstr(self->a); }
Got Ideas?
Using DTrace:• Monitor stack overflows• Code coverage• Fuzzer feedback• Monitor heap overflows
DTrace vs. Debuggers
• Don’t think of DTrace as a debugger• User mode and kernel mode debuggers allow you
to control execution and inspect process information
• DTrace can instrument both the kernel and user land applications at the same time
• To trace execution, debuggers use instructions to pause and resume execution
• DTrace carries out parallel actions in the kernel when a probe is hit
DTrace vs. Debuggers
• Traditional debuggers also affect the target process’s memory layout. DTrace doesn’t
• DTrace does not directly perform exception handling
• DTrace can halt process and transfer control to external debugger
• Currently DTrace is not susceptible to traditional anti-debugging techniques (isdebuggerpresent())
• However, Apple has implemented probe blocking with use of the PT_ATTACH_DENY
DTrace vs. Tracers
• Truss, ltrace, and strace operate one process at a time, with no system-wide capability
• Truss reduces application performance• Truss stops threads through procfs, records the
arguments for the system call, and then restarts the thread
• Valgrind™ is limited to a single process and only runs on Linux
• Ptrace is much more efficient at instruction level tracing but it is crippled on OS X
*Valgrind is Open Source/Free Software and is freely available under the GNU General Public License.
DTrace Limitations
• The D language does not have conditionals or loops
• The output of many functions is to stdout (i.e., stack(), unstack())
• Lack of loops and use of stdout means DTrace is not ideal for processing data
• We can fix this• Cannot modify registers :’( epic sad time

DTrace Cautionaries
A few issues to be aware of:• DTrace drops probes by design• Tune options, narrow trace scope to improve
performance• Some libraries and functions behave badly• overflows can cause violations before function
return

RE with Ruby, DTrace and the Mach API
RE:Trace & RE:dbg
RE:Trace
• RE:Trace combines Ruby with DTrace• Ruby gives us the power of OOP, text processing,
iteration• RE:Trace utilizes Ruby libdtrace bindings, written
by Chris Andrews• Can be the glue which combines the power of
several existing Ruby RE frameworks (idarub, librub, metasm, MSF3)
• RE:Trace is similar to programmatic frameworks (pyDBG, noxDBG, immDBG)
• Includes script to dump and search memory
IdaRub
• Wraps IDA interface• Ruby code is the client• Server is IDA plugin• Ruby glues it all together• IdaRub was released by Spoonm at REcon 2006
ida.set_item_color(eip, 3000)
More info: http://www.metasploit.com/users/spoonm/idarub/
RE:Trace and Exploit Dev
• Vulnerability analysis times can be dramatically reduced with RE:Trace
• DTrace probes allow you to track data input flow throughout a process to understand where and why memory corruption took place
• Methods that cause stack and heap corruption can be pinpointed using IDARub to integrate IDA’s static analysis features
RE:Trace and Code Coverage
• DTrace can “hook” every function in a process• This makes it perfect for implementing a “code
coverage aware” fuzzer• Code coverage is useful for understanding what
areas are being fuzzed• Current RE code coverage monitors are mostly
block based (PaiMei)• We can use IDA to obtain block information or
check code coverage at the function or instruction level
RE:dbg
• RE:dbg picks up where RE:Trace left off• Programmatic debugger for mach debug API• Partially exists on OS X in Python (see vtrace and
Charlie Miller’s pydbg port)
Integrated Ruby based RE Toolset:• Tracing : RE:Trace• Disassembly: IDArub• Debugger reDBG
RE:dbg
• C code around Mach debugging API with Ruby bindings
• Higher level Ruby class to make everything easy• Symbol resolution• Read and write memory• Walk memory segments• Modify memory permissions• Set breakpoints• Exception handling• Interface with IDA ( ... metasm?)
iPhoto Format String Exploit
• iPhoto format string vuln is a good test for automation
• URL handler bug: iphoto://%dd%n• What we want to do is trace with RE:Trace until
we hit printf with arg1=%25 (URL encoded %n)• Use idarub to get disassembly info from IDA• Set a break on RET of the function with reDBG • When breakpoint is hit, print out stack return
address (or whatever you overwrote) to make sure the overflow was correct
RE:Trace/reDBG/IDArub
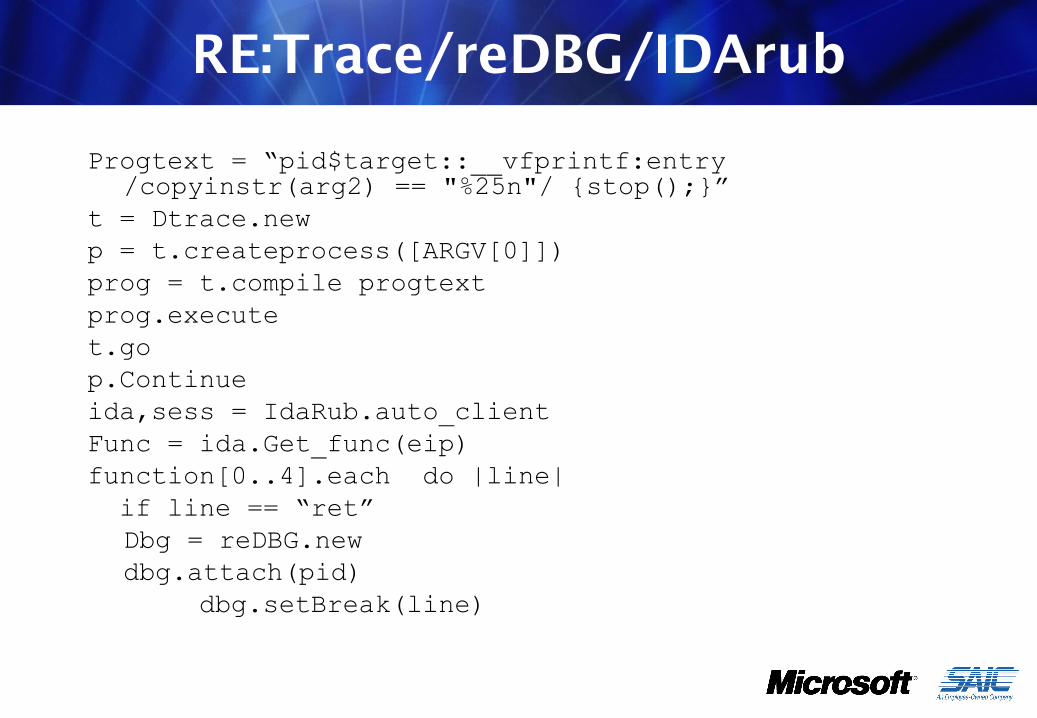
Progtext = “pid$target::__vfprintf:entry /copyinstr(arg2) == "%25n"/ {stop();}”
t = Dtrace.newp = t.createprocess([ARGV[0]])prog = t.compile progtextprog.executet.gop.Continueida,sess = IdaRub.auto_clientFunc = ida.Get_func(eip)function[0..4].each do |line| if line == “ret”
Dbg = reDBG.newdbg.attach(pid)
dbg.setBreak(line)
RE:dbg ASLR
• ASLR analysis• Start the application, lookup addresses for
application and library symbols• Search through all memory for references to
those addresses• Rinse and repeat
Can you find an address that is always relative to an address of a useful function?
RE:dbg Soon!
If it’s not up in a week, bug us
MONITORING THE STACKWriting a Stack Overflow Monitor with RE:Trace
Stack Overflow Monitoring
Programmatic control at EIP overflow time allows you to:
• Pinpoint the vulnerable function• Reconstruct the function call trace• Halt the process before damage occurs (HIDS)• Dump and search process memory• Send feedback to fuzzer• Attach debugger
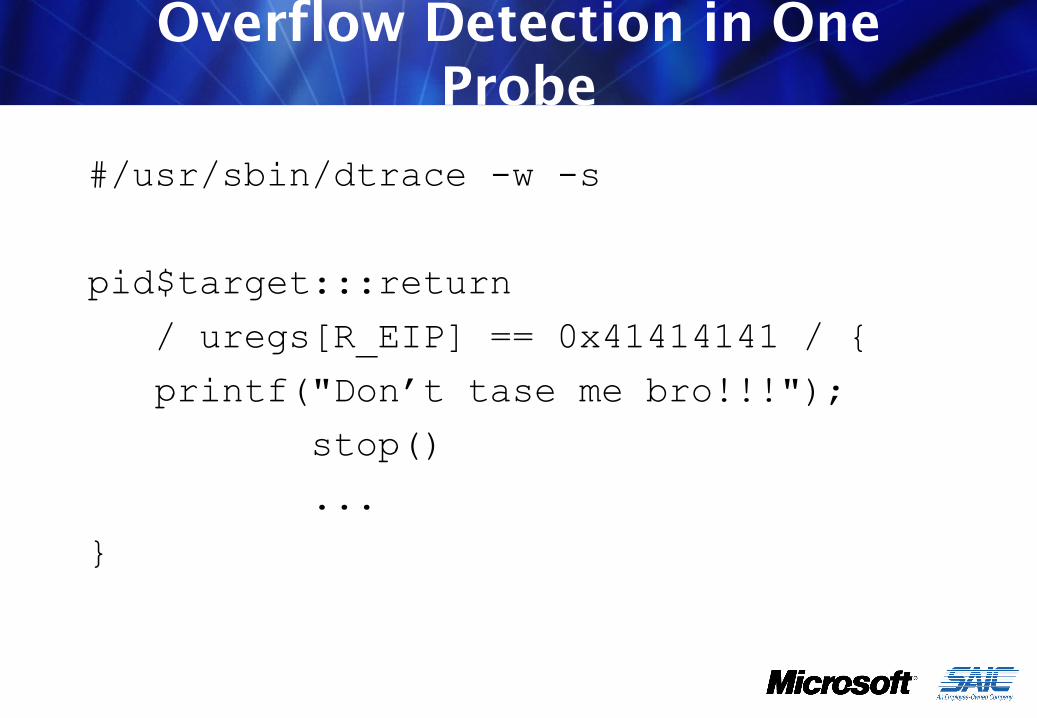
Overflow Detection in One Probe
#/usr/sbin/dtrace -w -s
pid$target:::return / uregs[R_EIP] == 0x41414141 / { printf("Don’t tase me bro!!!"); stop() ...}
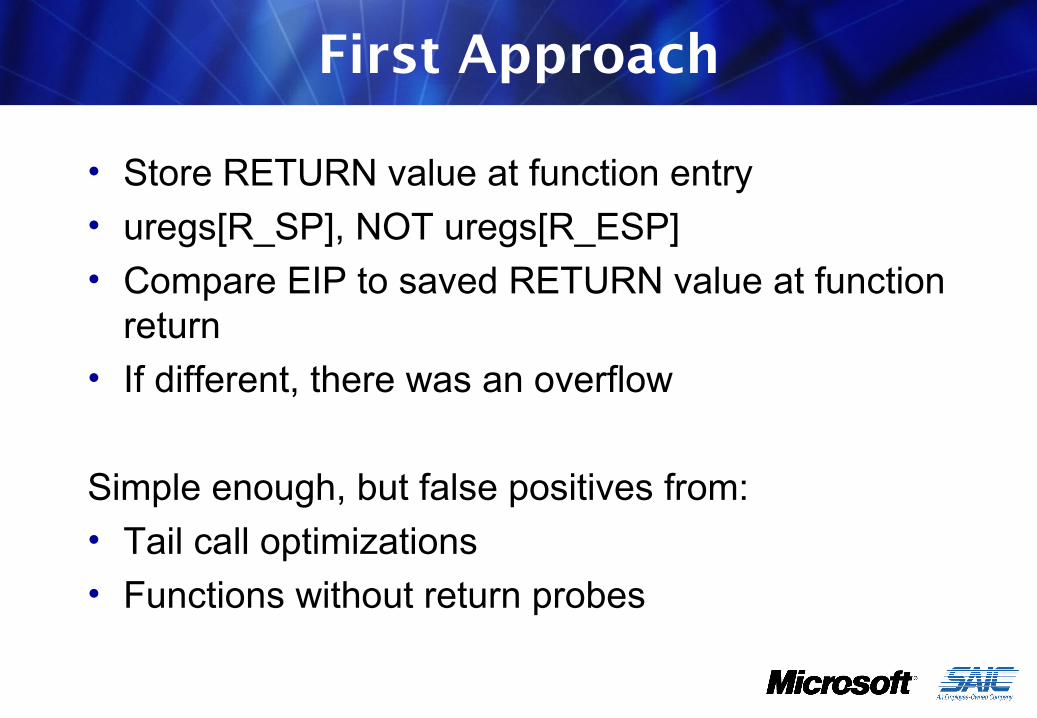
First Approach
• Store RETURN value at function entry• uregs[R_SP], NOT uregs[R_ESP]• Compare EIP to saved RETURN value at function
return• If different, there was an overflow
Simple enough, but false positives from:• Tail call optimizations• Functions without return probes
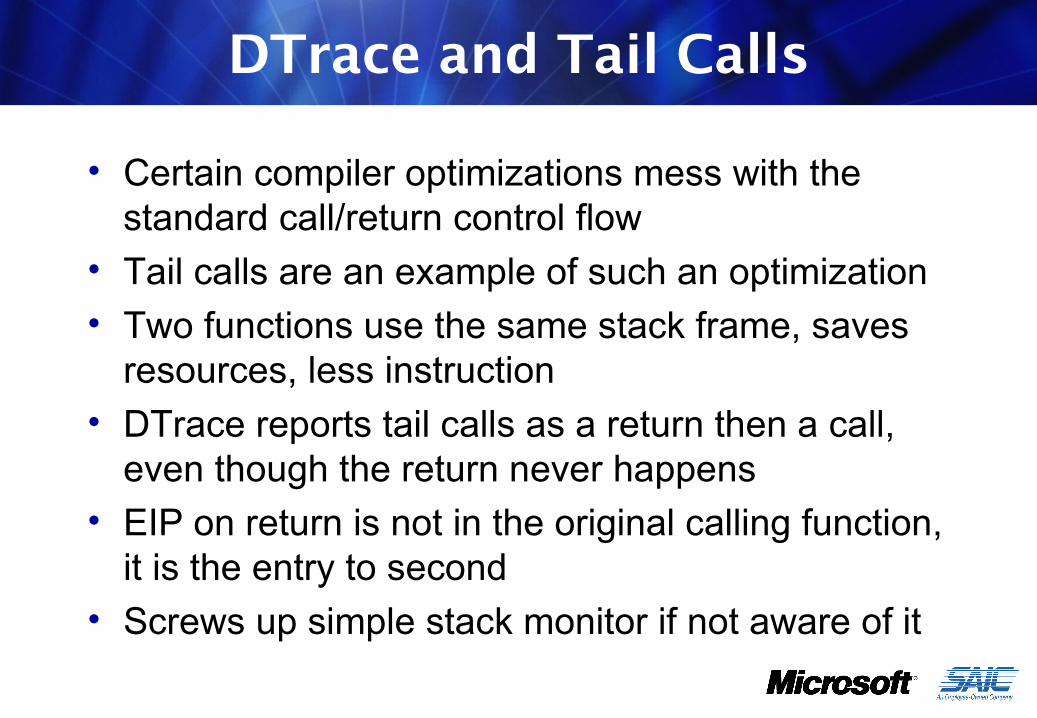
DTrace and Tail Calls
• Certain compiler optimizations mess with the standard call/return control flow
• Tail calls are an example of such an optimization• Two functions use the same stack frame, saves
resources, less instruction• DTrace reports tail calls as a return then a call,
even though the return never happens• EIP on return is not in the original calling function,
it is the entry to second• Screws up simple stack monitor if not aware of it
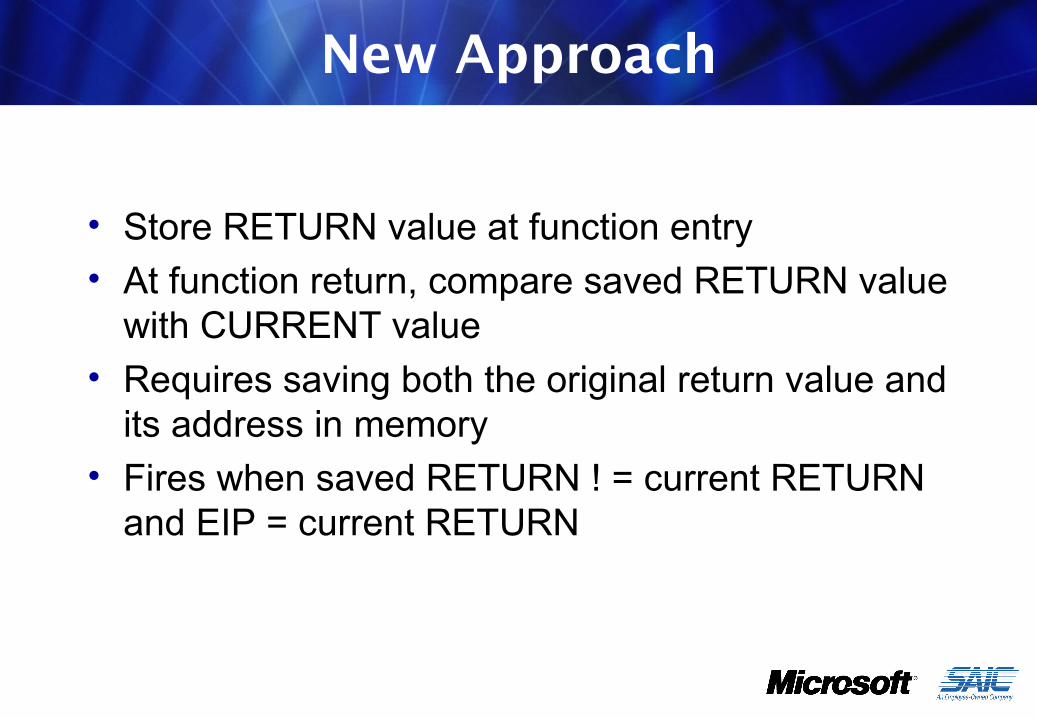
New Approach
• Store RETURN value at function entry• At function return, compare saved RETURN value
with CURRENT value• Requires saving both the original return value and
its address in memory• Fires when saved RETURN ! = current RETURN
and EIP = current RETURN
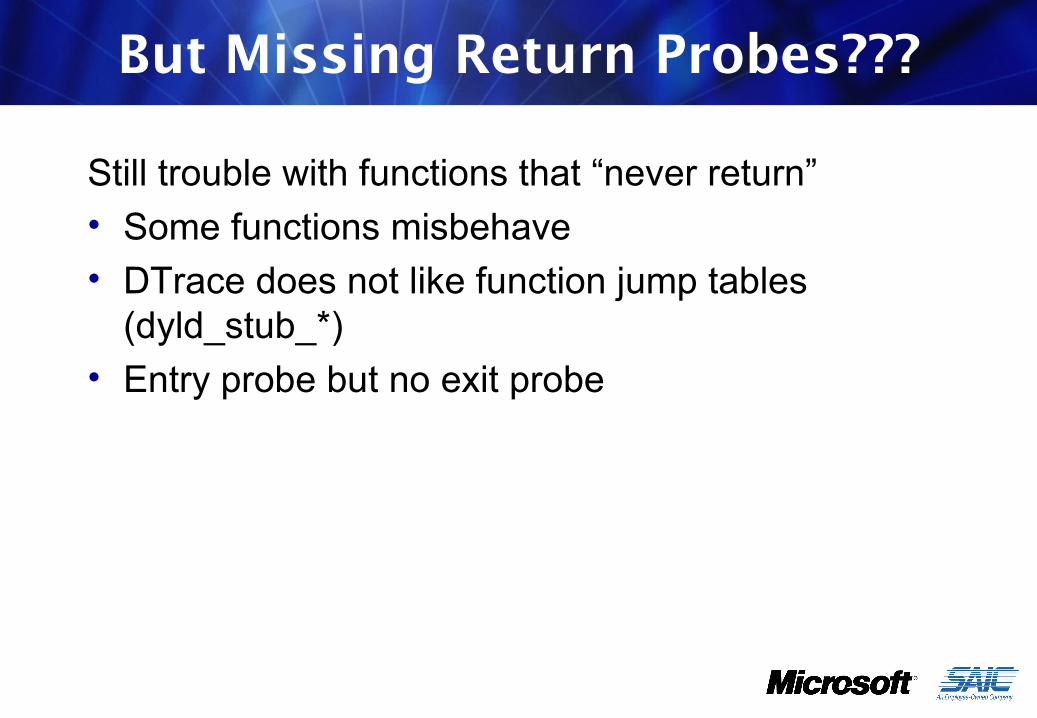
But Missing Return Probes???
Still trouble with functions that “never return”• Some functions misbehave• DTrace does not like function jump tables
(dyld_stub_*)• Entry probe but no exit probe
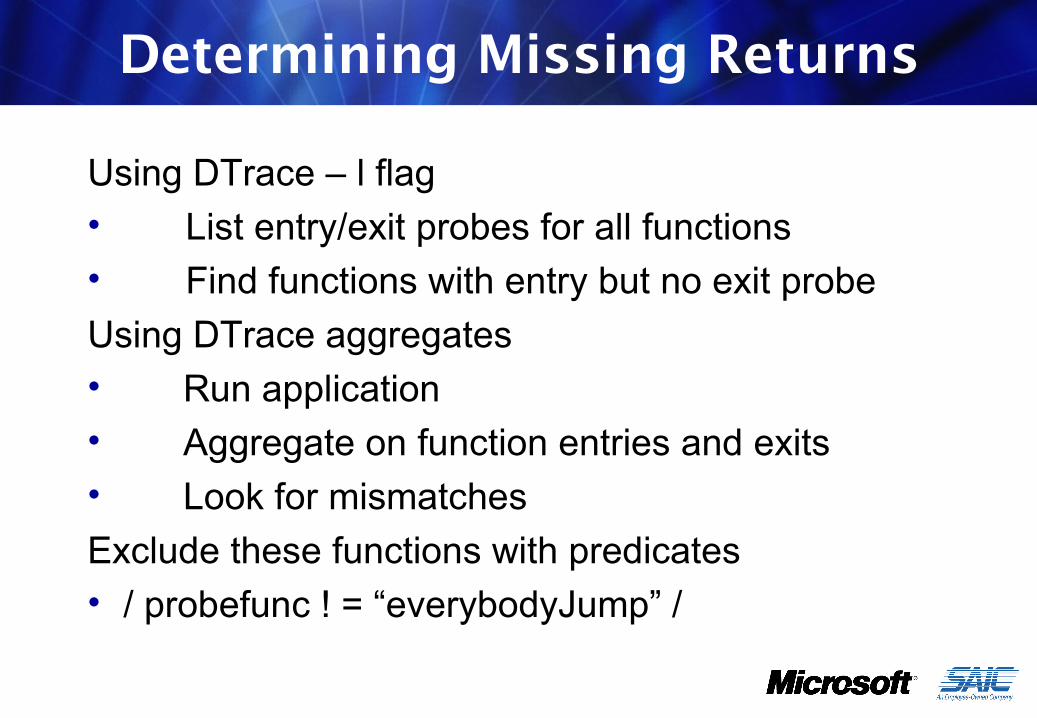
Determining Missing Returns
Using DTrace – l flag• List entry/exit probes for all functions• Find functions with entry but no exit probeUsing DTrace aggregates• Run application• Aggregate on function entries and exits• Look for mismatchesExclude these functions with predicates• / probefunc ! = “everybodyJump” /
Stack Overflow Video
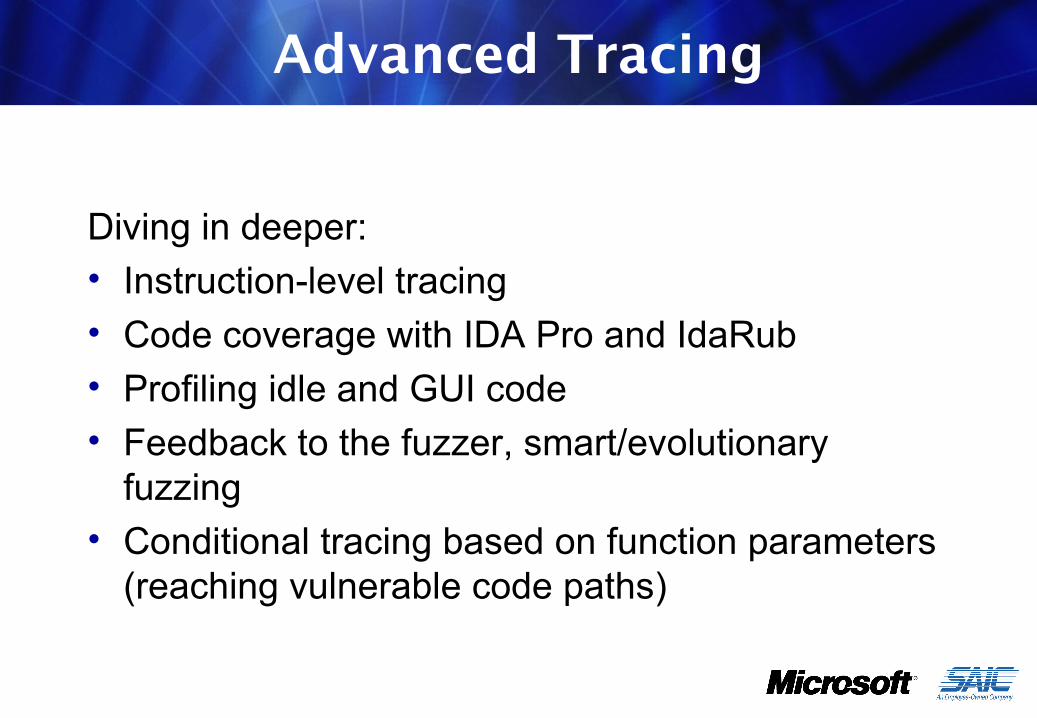
Advanced Tracing
Diving in deeper:• Instruction-level tracing• Code coverage with IDA Pro and IdaRub• Profiling idle and GUI code• Feedback to the fuzzer, smart/evolutionary
fuzzing• Conditional tracing based on function parameters
(reaching vulnerable code paths)
CODE COVERAGEInstruction Tracing
Code Coverage Approach
Approach• Instruction-level tracing using DTrace• Must properly scope tracing• Use IdaRub to send commands to IDA• IDA colors instructions and code blocks• Can be done in real time, if you can keep up
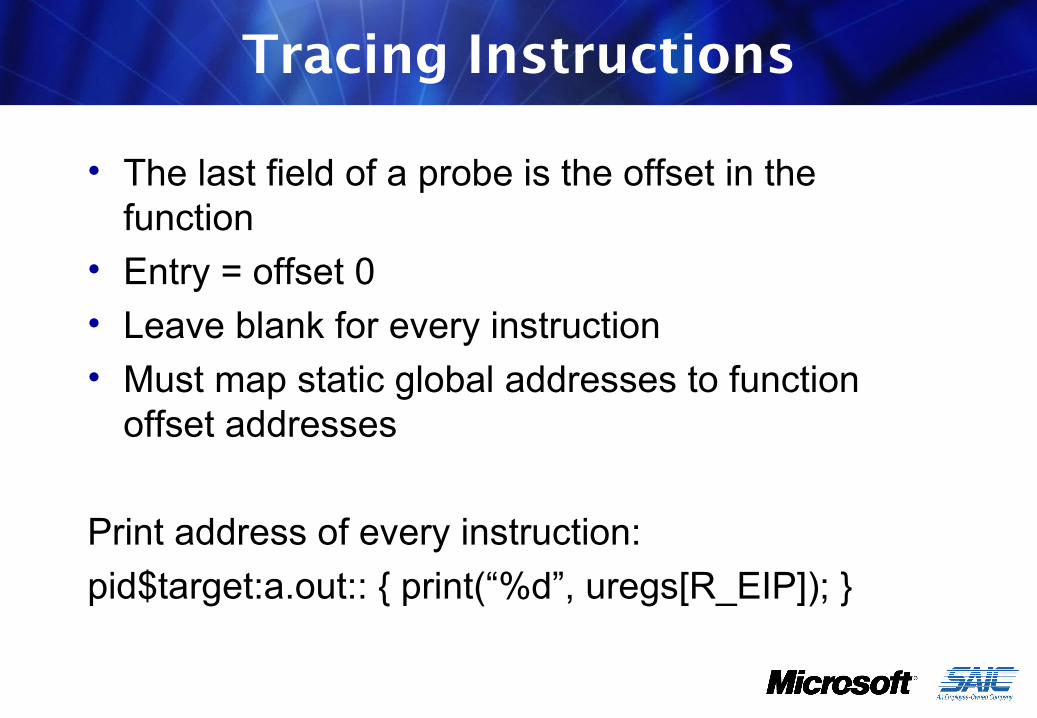
Tracing Instructions
• The last field of a probe is the offset in the function
• Entry = offset 0• Leave blank for every instruction• Must map static global addresses to function
offset addresses
Print address of every instruction:pid$target:a.out:: { print(“%d”, uregs[R_EIP]); }

Tracing Instructions (cont.)
• DTrace to print instructions• Ruby-Dtrace to combined DTrace with Ruby• Idarub and rublib to combined Ruby with IDA
Tracing libraries• When tracing libraries, must know memory layout
of program• vmmap on OS X will tell you• Use offset to map runtime library EIPs to
decompiled libraries

Code Coverage with DTrace
Capabilities:• Associate fuzz runs with code hit• Visualize code paths• Record number of times blocks were hit• Compare idle traces to other traces
Limitations:• Instruction tracing can be slow for some
applications• Again, tuning and limiting scope
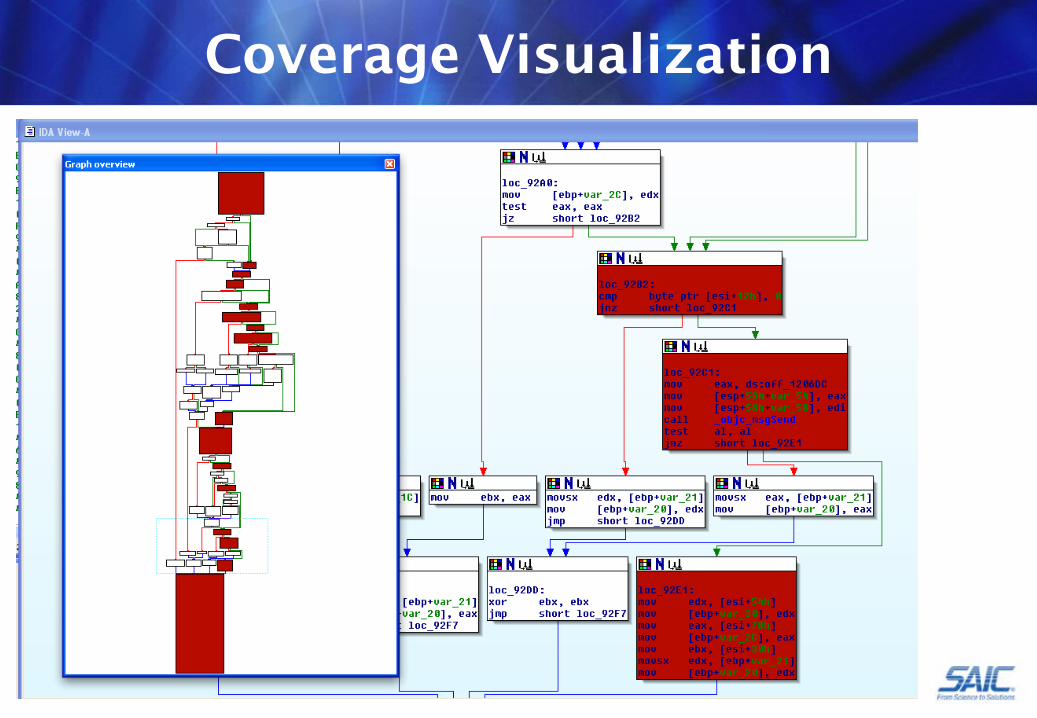
Coverage Visualization

Runtime Call Graphs
MONITORING THE HEAPWriting a Heap Overflow Monitor
Hackin’ the Heap with RE:Trace
• The heap has become “the” major attack vector replacing stack-based buffer overflows
• Relatively common unlink() write4 primitives are no longer as “easy” to exploit on many platforms
• See Aitel and Waisman’s excellent “Debugging with ID” presentation for more details
• As they point out, the key to the “new breed” of heap exploit is understanding the heap layout and allocation patterns
• ImmDBG can help you with this on Win32, and Gerrado Richarte’s heap tracer can help you with visualization and double free() on Solaris and Linux
Hackin’ the Heap with RE:Trace
• Many Different ways to use DTrace for heap exploits
• Standard double free(), double malloc(), Leak Detection
• Heap Visualization (Directed Graphs/OpenGL/Instruments)
• Pesky off by one errors• Spot app specific function pointers to overwrite• Find heap overflows/corruptions that might not be
immediately dereference
OS X Heap Exploits
• Ltrace = Bonds on the Pirates, DTrace = Bonds on the Giants
• Like Most BSD’s OS X does not store metadata “in-band”
• Older techniques such as overwriting initial_malloc_zones function pointers are dead
• You now have to overwrite app specific data• DTrace already hooks functions to understand
heap layout and allocation patterns• A slew of Heap Tools for OS X (vmmap,
MallocScribble, MallocCheckHeap, leaks)
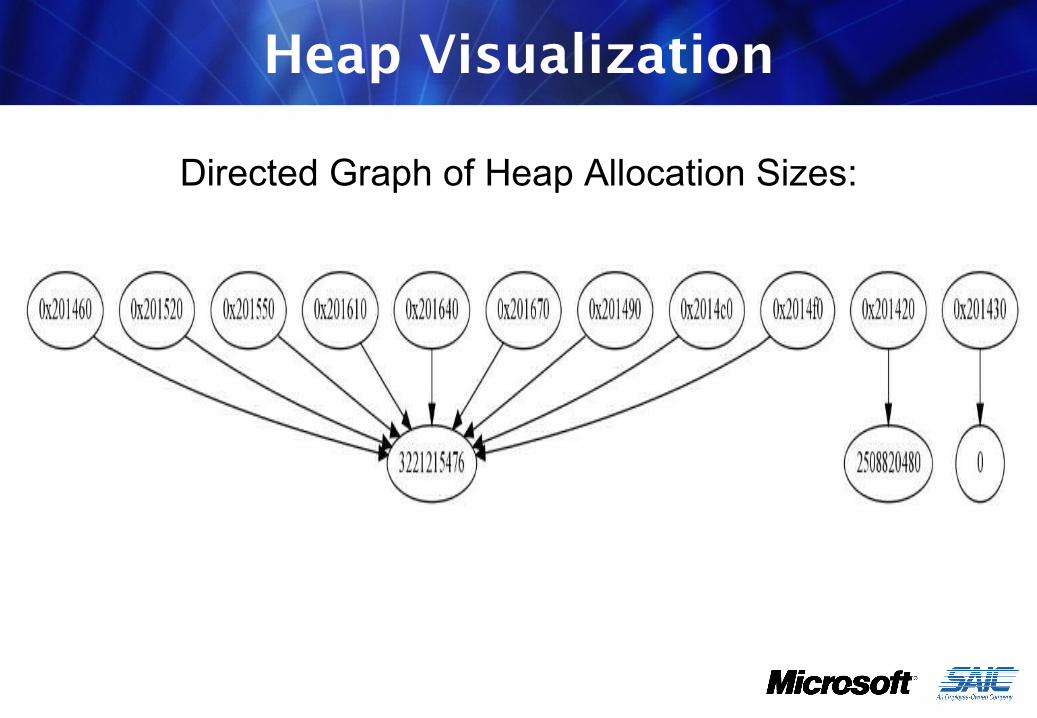
Heap Visualization
Directed Graph of Heap Allocation Sizes:
RE:Trace Heap Smasher()
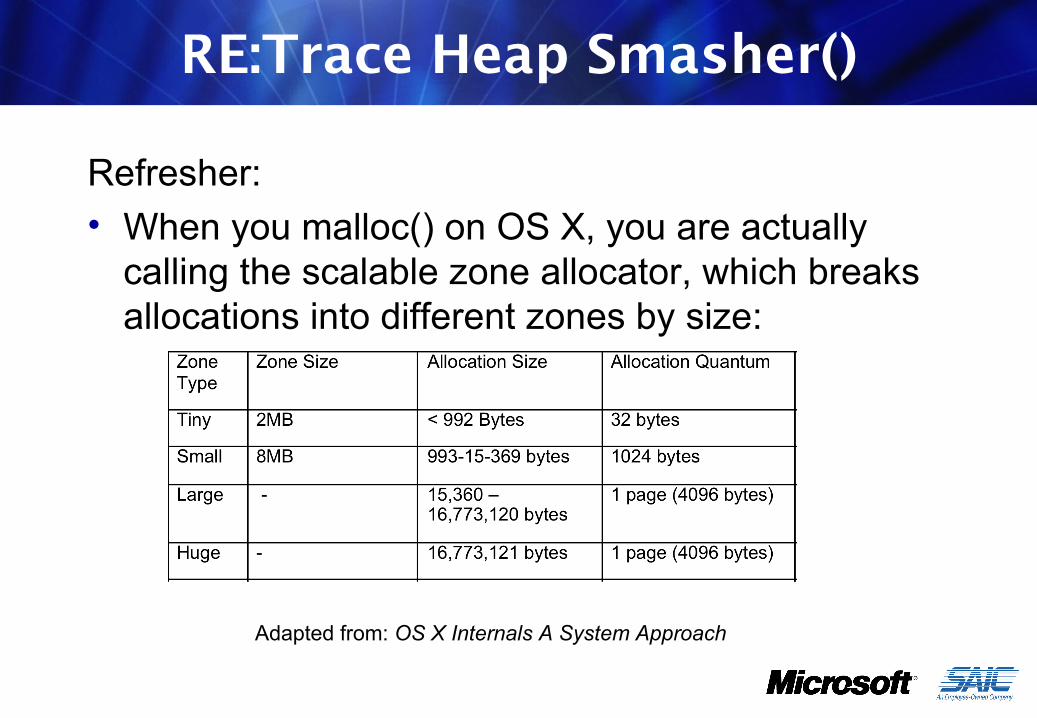
Refresher:• When you malloc() on OS X, you are actually
calling the scalable zone allocator, which breaks allocations into different zones by size:
Adapted from: OS X Internals A System Approach
RE:Trace Heap Smasher()
• In our heap smash detector, we must keep track of four different “heaps”
• We do this by hooking malloc() calls and storing them to ruby hashes with the pointer as the key and the size allocated as the value
• We break the hashes into tiny, small, large, and huge by allocation size
• We then hook all allocations and determine if the pointer falls in the range of the previous allocations. We can adjust the heap as memory is free()’d or realloc’d()
RE:Trace Heap Smasher()
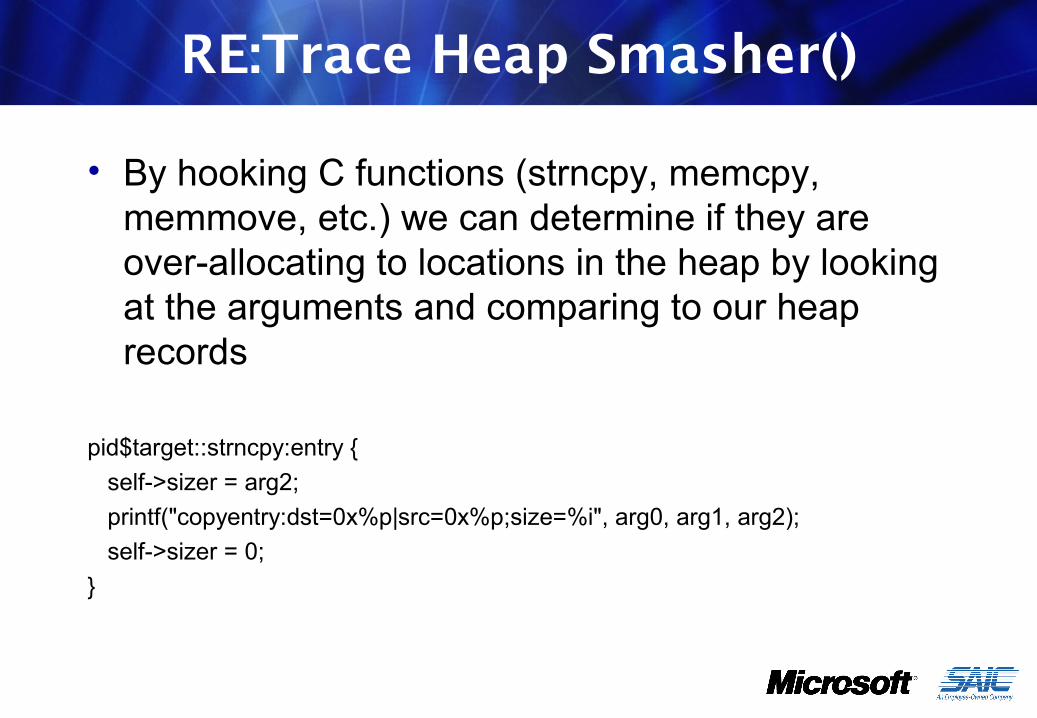
• By hooking C functions (strncpy, memcpy, memmove, etc.) we can determine if they are over-allocating to locations in the heap by looking at the arguments and comparing to our heap records
pid$target::strncpy:entry { self->sizer = arg2; printf("copyentry:dst=0x%p|src=0x%p;size=%i", arg0, arg1, arg2); self->sizer = 0;}
RE:Trace Heap Smasher()
• We can check to see if the allocation happens in a range we know about
• If it does, we know the size allocation, and we can tell if a smash will occur
• Compared to our stack smash detector, we need very few probes. A few dozen probes will hook all the functions we need
• We can attach to a live process on and off without disturbing it
RE:Trace Heap Smasher()
• We also keep a hash with the stack frame, which called the original malloc()
• When an overflow is detected, we know:
– Who allocated it (stack frame)– Who used it (function hook)– Where the overflowed memory is– How large the overflow was– We can find out if its ever free()’d
RE:Trace Heap Smasher() Video
RE:Trace Heap Smasher()
Future additions:• Graphviz/OpenGL Graphs• There is a new version of Firefox which has probes in the
JavaScript library• This would give us functionality to help create tools similar
to Alexander Sotirov’s HeapLib (Heap Fung Shui) for heap manipulation generically
• Can trigger on high level object creation or action, then trace for mallocs
• You tell me?

DTRACE DEFENSEUsing DTrace Defensively
Basic HIDS with DTrace
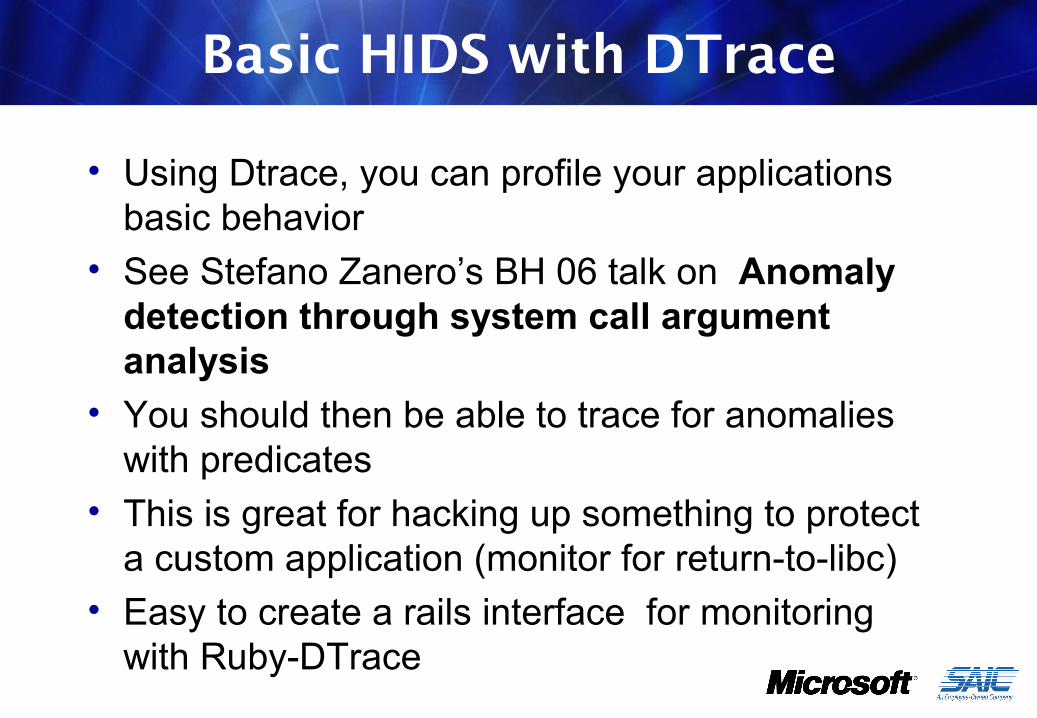
• Using Dtrace, you can profile your applications basic behavior
• See Stefano Zanero’s BH 06 talk on Anomaly detection through system call argument analysis
• You should then be able to trace for anomalies with predicates
• This is great for hacking up something to protect a custom application (monitor for return-to-libc)
• Easy to create a rails interface for monitoring with Ruby-DTrace
Basic HIDS with DTrace
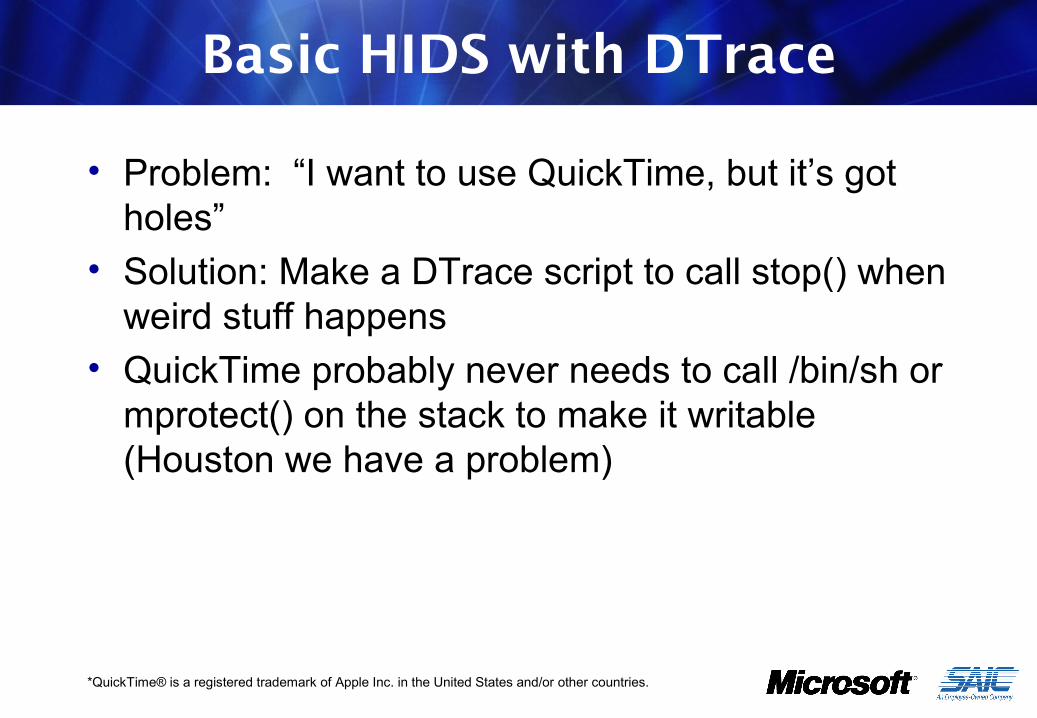
• Problem: “I want to use QuickTime, but it’s got holes”
• Solution: Make a DTrace script to call stop() when weird stuff happens
• QuickTime probably never needs to call /bin/sh or mprotect() on the stack to make it writable (Houston we have a problem)
*QuickTime® is a registered trademark of Apple Inc. in the United States and/or other countries.
Basic HIDS with DTrace
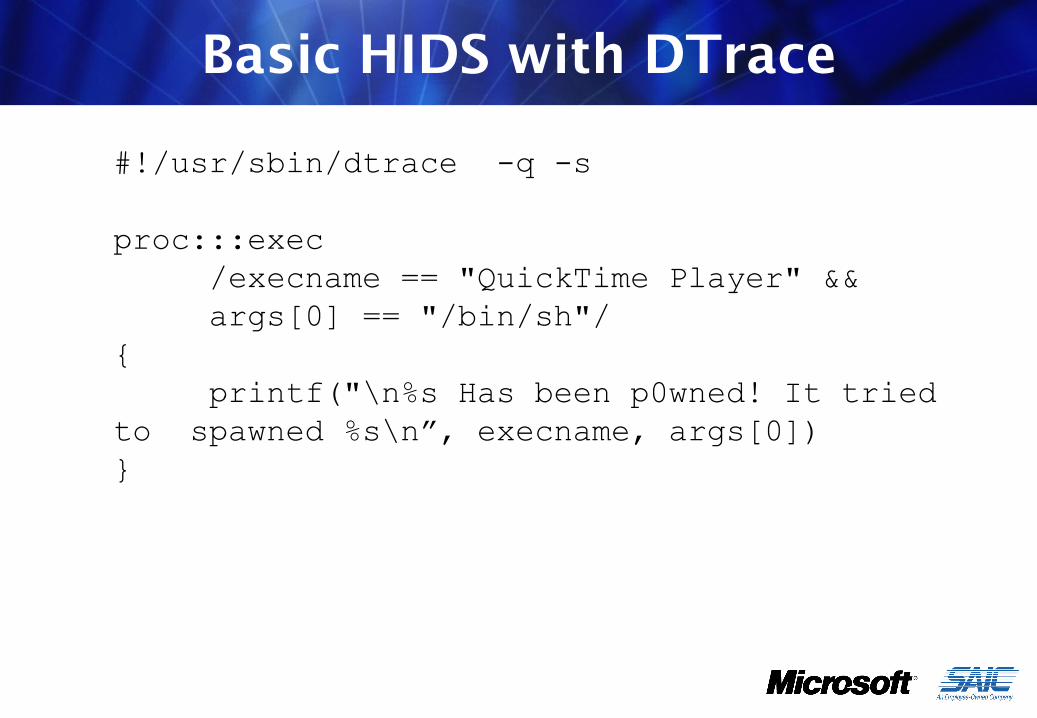
#!/usr/sbin/dtrace -q -s
proc:::exec /execname == "QuickTime Player" && args[0] == "/bin/sh"/ {
printf("\n%s Has been p0wned! It tried to spawned %s\n”, execname, args[0])}
HIDS Video
DTrace and Rootkits
• Check out Archim’s paper “B.D.S.M the Solaris 10 Way,” from the CCC Conference
• He created the SInAr rootkit for Solaris 10• Describes a method for hiding a rootkit from
DTrace• DTrace FBT (kernel) provider can spy on all
active kernel modules• Should have the ability to detect rootkits, which
don’t explicitly hide from DTrace (SInAr is the only one I could find)
• Expect more on this in the future

DTrace for Malware Analysis
• Very easy to hack up a script to analyze MalWare• Example: Leopard DNS Changer (OSX.RSPlug.A )• Why the heck is my video codec calling…
/usr/sbin/scutiladd ServerAddresses * $s1 $s2set State:/Network/Service/$PSID/DNS
• You can monitor file I/O and syscalls with just two lines• Scripts to do this now included with OS X by default• Malware not hiding from DTrace yet• BUT Apple made that a feature (yayyy!)
Hiding from DTrace
• In Jan. Core DTrace developer Adam Leventhal discovered that Apple crippled DTrace for Leopard
• On OS X Your application can set the “PT_ATTACH_DENY” flag to hide from DTrace just like you can for GDB
• Leventhal used timing analysis to figure out they are hiding iTunes™ from DTrace
• Very easy to patch in memory or with kext• Landon Fuller released a kext to do this
http://landonf.bikemonkey.org/code/macosx/Leopard_PT_DENY_ATTACH.20080122.html
KERNEL DEBUGGINGOS X Kernel / Driver
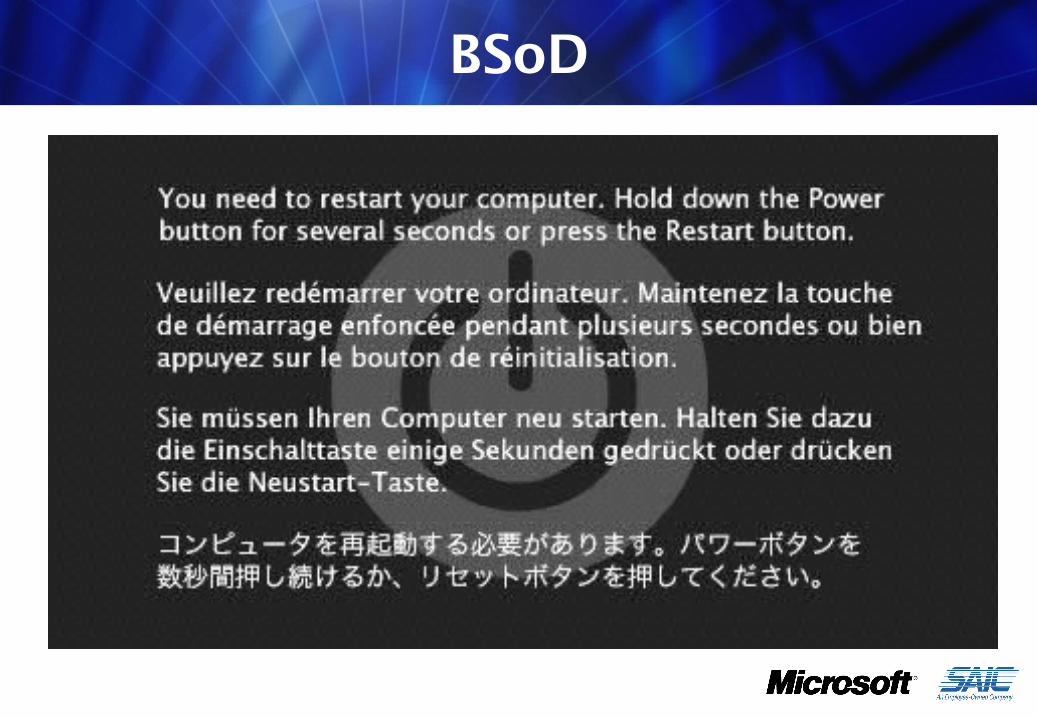
BSoD
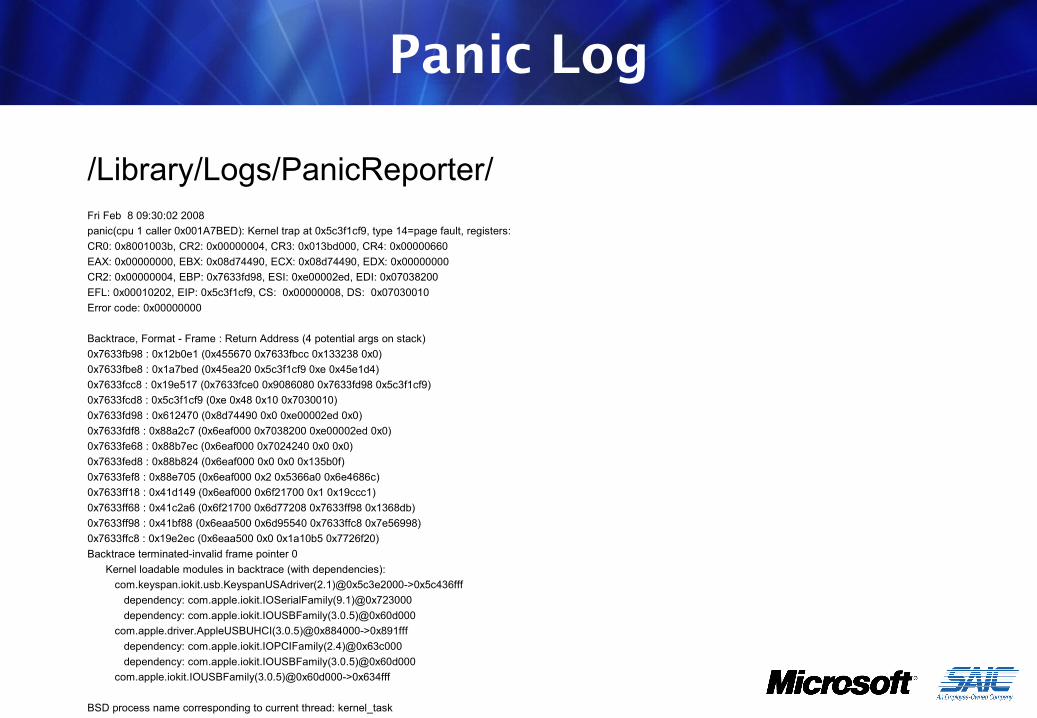
Panic Log
/Library/Logs/PanicReporter/Fri Feb 8 09:30:02 2008panic(cpu 1 caller 0x001A7BED): Kernel trap at 0x5c3f1cf9, type 14=page fault, registers:CR0: 0x8001003b, CR2: 0x00000004, CR3: 0x013bd000, CR4: 0x00000660EAX: 0x00000000, EBX: 0x08d74490, ECX: 0x08d74490, EDX: 0x00000000CR2: 0x00000004, EBP: 0x7633fd98, ESI: 0xe00002ed, EDI: 0x07038200EFL: 0x00010202, EIP: 0x5c3f1cf9, CS: 0x00000008, DS: 0x07030010Error code: 0x00000000
Backtrace, Format - Frame : Return Address (4 potential args on stack) 0x7633fb98 : 0x12b0e1 (0x455670 0x7633fbcc 0x133238 0x0) 0x7633fbe8 : 0x1a7bed (0x45ea20 0x5c3f1cf9 0xe 0x45e1d4) 0x7633fcc8 : 0x19e517 (0x7633fce0 0x9086080 0x7633fd98 0x5c3f1cf9) 0x7633fcd8 : 0x5c3f1cf9 (0xe 0x48 0x10 0x7030010) 0x7633fd98 : 0x612470 (0x8d74490 0x0 0xe00002ed 0x0) 0x7633fdf8 : 0x88a2c7 (0x6eaf000 0x7038200 0xe00002ed 0x0) 0x7633fe68 : 0x88b7ec (0x6eaf000 0x7024240 0x0 0x0) 0x7633fed8 : 0x88b824 (0x6eaf000 0x0 0x0 0x135b0f) 0x7633fef8 : 0x88e705 (0x6eaf000 0x2 0x5366a0 0x6e4686c) 0x7633ff18 : 0x41d149 (0x6eaf000 0x6f21700 0x1 0x19ccc1) 0x7633ff68 : 0x41c2a6 (0x6f21700 0x6d77208 0x7633ff98 0x1368db) 0x7633ff98 : 0x41bf88 (0x6eaa500 0x6d95540 0x7633ffc8 0x7e56998) 0x7633ffc8 : 0x19e2ec (0x6eaa500 0x0 0x1a10b5 0x7726f20) Backtrace terminated-invalid frame pointer 0 Kernel loadable modules in backtrace (with dependencies): com.keyspan.iokit.usb.KeyspanUSAdriver(2.1)@0x5c3e2000->0x5c436fff dependency: com.apple.iokit.IOSerialFamily(9.1)@0x723000 dependency: com.apple.iokit.IOUSBFamily(3.0.5)@0x60d000 com.apple.driver.AppleUSBUHCI(3.0.5)@0x884000->0x891fff dependency: com.apple.iokit.IOPCIFamily(2.4)@0x63c000 dependency: com.apple.iokit.IOUSBFamily(3.0.5)@0x60d000 com.apple.iokit.IOUSBFamily(3.0.5)@0x60d000->0x634fff
BSD process name corresponding to current thread: kernel_task
Mac OS version:9B18
Kernel version:Darwin Kernel Version 9.1.0: Wed Oct 31 17:46:22 PDT 2007; root:xnu-1228.0.2~1/RELEASE_I386System model name: MacBookPro3,1 (Mac-F42388C8)
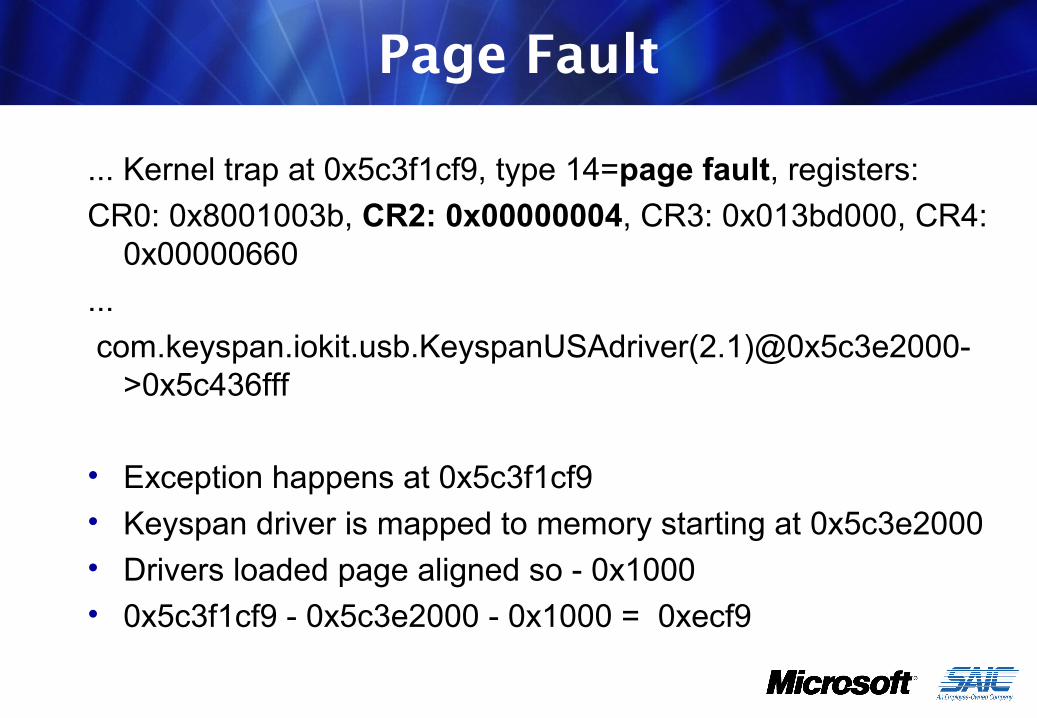
Page Fault
... Kernel trap at 0x5c3f1cf9, type 14=page fault, registers:CR0: 0x8001003b, CR2: 0x00000004, CR3: 0x013bd000, CR4:
0x00000660... com.keyspan.iokit.usb.KeyspanUSAdriver(2.1)@0x5c3e2000-
>0x5c436fff
• Exception happens at 0x5c3f1cf9• Keyspan driver is mapped to memory starting at 0x5c3e2000• Drivers loaded page aligned so - 0x1000• 0x5c3f1cf9 - 0x5c3e2000 - 0x1000 = 0xecf9

0xECF9
Registers from panic log:...CR0: 0x8001003b, CR2: 0x00000004, CR3: 0x013bd000, CR4: 0x00000660EAX: 0x00000000, EBX: 0x08d74490, ECX: 0x08d74490, EDX: 0x00000000...
Kernel Debugging
• All that was done without debugging• What if we want to inspect memory?• What if we get different errors and we aren’t sure why?• Further debugging will be necessary
Kernel Debugging is a pain• Require remote setup• Need two hosts• Export and import symbols• Can DTrace help?
Kernel References
Apple Technical Note TN2063: Understanding and Debugging Kernel Panics
Apple Technical Note TN2118: Kernel Core Dumps
Hello Debugger: Debugging a Device Driver With GDB
http://developer.apple.com/documentation/Darwin/Conceptual/KEXTConcept/KEXTConceptDebugger/hello_debugger.html
Uninformed volume 8 article 4 by David Maynorhttp://www.uninformed.org/?v=8&a=4

HIGHER LEVEL TRACINGLeveraging Custom Application Probes
Application Probes
• Represent a more abstract action• Browser example: Page Load, build DOM, DNS
request• Helps for gathering performance metrics• Also tracing VM languages like Java, Python, Ruby• Largely still in the works
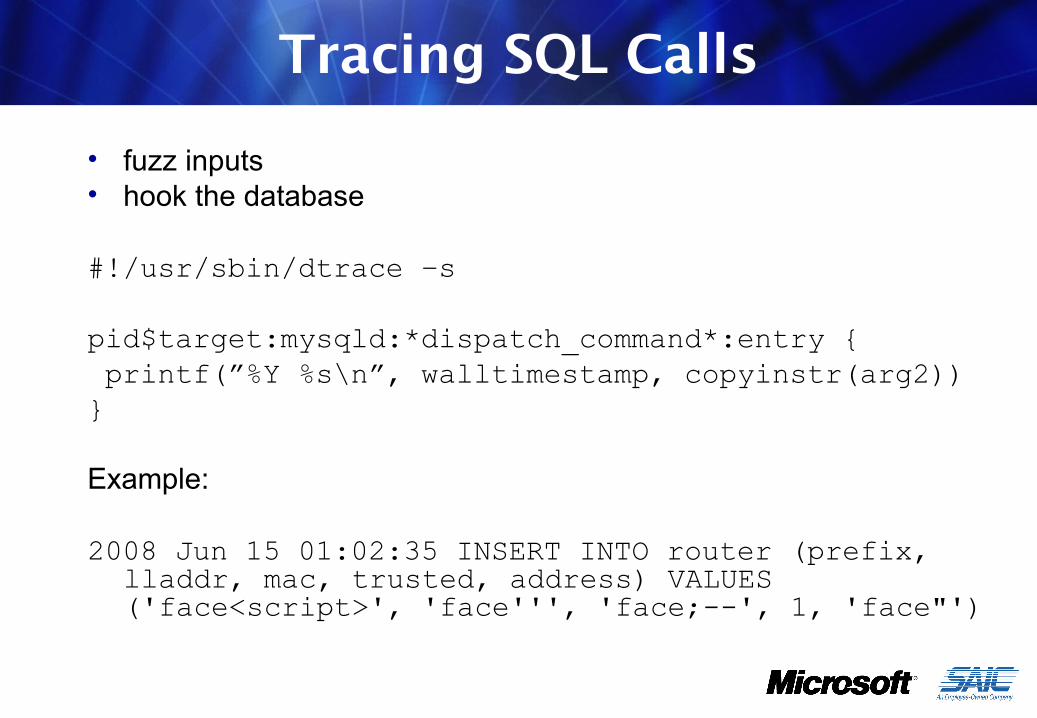
Tracing SQL Calls
• fuzz inputs• hook the database
#!/usr/sbin/dtrace –s
pid$target:mysqld:*dispatch_command*:entry { printf(”%Y %s\n”, walltimestamp, copyinstr(arg2)) }
Example:
2008 Jun 15 01:02:35 INSERT INTO router (prefix, lladdr, mac, trusted, address) VALUES ('face<script>', 'face''', 'face;--', 1, 'face"')
Future Work
• Automated feedback and integration with fuzzers• More experimenting with Kernel tracing• Improved overflow monitoring• Memory allocation analysis libraries (will help port
Sotirov’s HeapLib to ActiveX, DHTML version or other browsers/OSes)
• Garbage collection behavior analysis• More on utilizing application-specific probes
(probes for JS in browsers, MySQL probes, ...)• New Probes: Network providers, IP send & recv
Your own ideas!
Conclusion
DTrace can:• Collect an unprecedented range of data• Collect very specific measurements• Scope can be very broad or very precise
Applied to Reverse Engineering:• Allows researchers to pinpoint specific situation (overflows) • Or to understand general behavior (heap growth)
RETRACE + REDBG + IDA!
Thank You!
Tiller [email protected]
David [email protected]
See the RE:Trace framework for implementation:
( redbg coming soon! )
http://www.poppopret.org/
Questions?