re:trace – applied reverse engineering on os x
TRANSCRIPT

RE:Trace – Applied Reverse Engineering on OS X
Tiller Beauchamp David Weston
SAIC

DTRACE BACKGROUND What Is DTrace™?
*Dtrace was created by Sun Microsystems, Inc. and released under the Common Development and Distribution License (CDDL), a free software license based on the Mozilla Public License (MPL).

DTrace Background
• Kernel-based dynamic tracing framework • Created by Sun Microsystems • First released with Solaris™ 10 operating System • Now included with Apple OS X Leopard, QNX • June 10th, 2008, committed to CURRENT branch
of FreeBSD 7, Will be in 8 STABLE (John Birrell) • OpenBSD, NetBSD, Linux?
*Solaris™ is a trademark of Sun Microsystems, Inc. in the United States and/or other countries.

DTrace Overview
• DTrace is a framework for performance observability and debugging in real time
• Tracing is made possible by thousands of “probes” placed “on the fly” throughout the system
• Probes are points of instrumentation in the kernel • When a program execution passes one of these
points, the probe that enabled it is said to have fired
• DTrace can bind a set of actions to each probe

DTrace Architecture
Source: Solaris Dynamic Tracing Guide

The D Language
• D is an interpreted, block-structured language • D syntax is a subset of C • D programs are compiled into intermediate form • Intermediate form is validated for safety when
your program is first examined by the DTrace kernel software
• The DTrace execution environment handles any runtime errors

The D Language
• D does not use control-flow constructs such as if statements and loops
• D program clauses are written as single, straight-line statement lists that trace an optional, fixed amount of data
• D can conditionally trace data and modify control flow using logical expressions called predicates
• A predicate is tested at probe firing before executing any statements

DTrace Performance
• DTrace is dynamic: probes are enabled only when you need them
• No code is present for inactive probes • There is no performance degradation when you
are not using DTrace • When the dtrace command exits, all probes are
disabled and instrumentation removed • The system is returned to its original state

DTrace Uses
• DTrace takes the power of multiple tools and unifies them with one programmatically accessible interface
• DTrace has features similar to the following: – truss: tracing system calls, user functions – ptrace: tracing library calls – prex/tnf*: tracing kernel functions – lockstat: profiling the kernel – gdb: access to kernel/user memory

DTrace Uses
• DTrace combines system performance statistics, debugging information, and execution analysis into one tight package
• A real “Swiss army knife” for reverse engineers • DTrace probes can monitor every part of the
system, giving “the big picture” or zooming in for a closer look
• Can debug “transient” processes that other debuggers cannot

Creating DTrace Scripts
• Dozens of ready-to-use scripts are included with Sun’s DTraceToolkit; they can be used as templates
• These scripts provide functions such as syscalls by process, reads and writes by process, file access, stack size, CPU time, memory r/w and statistics
• Complex problems can often be diagnosed by a single “one-liner” DTrace script

Example: Syscall Count
1 2 3 3 4
4309 6899
• System calls count by application: dtrace -n 'syscall:::entry{@[execname] = count();}'.
Matched 427 probes Syslogd DirectoryService Finder TextMate Cupsd Ruby vmware-vmx

Example: File Open Snoop
#!/usr/sbin/dtrace -s
syscall::open*:entry {
printf("%s %s\n",
execname,
copyinstr(arg0));
}

Example: File Snoop Output
vmware-vmx /dev/urandom Finder /Library/Preferences/SystemConfiguration/com.apple.smb.server.plist iChat /Library/Preferences/SystemConfiguration/com.apple.smb.server.plist Microsoft Power /Library/Preferences/SystemConfiguration/com.apple.smb.server.plist nmblookup /System/Library/PrivateFrameworks/ByteRange ... ByteRangeLocking nmblookup /dev/dtracehelper nmblookup /dev/urandom nmblookup /dev/autofs_nowait Nmblookup /System/Library/PrivateFrameworks/ByteRange... ByteRangeLocking

DTrace Lingo
• Probes are points of instrumentation • Providers are logically grouped sets of probes • Examples of providers include syscall, lockstat,
fbt, io, mib • Predicates allow actions to be taken only when
certain conditions are met • Actions are taken when a probe fires

DTrace Syntax
Generic D Script
Probe: provider:module:function:name Predicate: /some condition that needs to happen/
{ Action: action1; action2; (ex: printf(); )
}

DTRACE AND REVERSE ENGINEERING (RE)
How Can We Use DTrace?
DTrace for RE
• DTrace is extremely versatile and has many applications for RE
• It is very useful for understanding the way a process works and interacts with the rest of the system
• DTrace probes work in a manner very similar to debugger “hooks”
• DTrace probes are useful because they can be described generically and focused later

DTrace for RE
• Think of DTrace as a rapid development framework for RE tasks and tools
• One of DTrace’s greatest assets is speed • DTrace can instrument any process on the
system without starting or stopping it • Complex operations can be understood with a
succinct one-line script • You can refine your script as the process
continues to run

Helpful Features
DTrace gives us some valuable features for free: • Control flow indicators • Symbol resolution • Call stack trace • Function parameter values • CPU register values • Both in kernel space and user space!

Control Flow
1 -> -[AIContentController finishSendContentObject:] 1 -> -[AIAdium notificationCenter] 1 <- -[AIAdium notificationCenter] 1 -> -[AIContentController processAndSendContentObject:] 1 -> -[AIContentController handleFileSendsForContentMessage:] 1 <- -[AIContentController handleFileSendsForContentMessage:] 1 -> -[AdiumOTREncryption willSendContentMessage:] 1 -> policy_cb 1 -> contactFromInfo 1 -> -[AIAdium contactController] 1 <- -[AIAdium contactController] 1 -> accountFromAccountID

Symbol and Stack Trace
dyld`strcmp dyld`ImageLoaderMachO::findExportedSymbol(char dyld`ImageLoaderMachO::resolveUndefined(... dyld`ImageLoaderMachO::doBindLazySymbol(unsigned dyld`dyld::bindLazySymbol(mach_header const*, ... dyld`stub_binding_helper_interface2+0x15 Ftpd`yylex+0x48 Ftpd`yyparse+0x1d5 ftpd`ftp_loop+0x7c ftpd`main+0xe46

Function Parameters
DTrace’s copyin* functions allow you to copy data from the process space:
printf("arg0=%s", copyinstr( arg0 ))
Output:
1 -> strcmp arg0=_isspecial_l
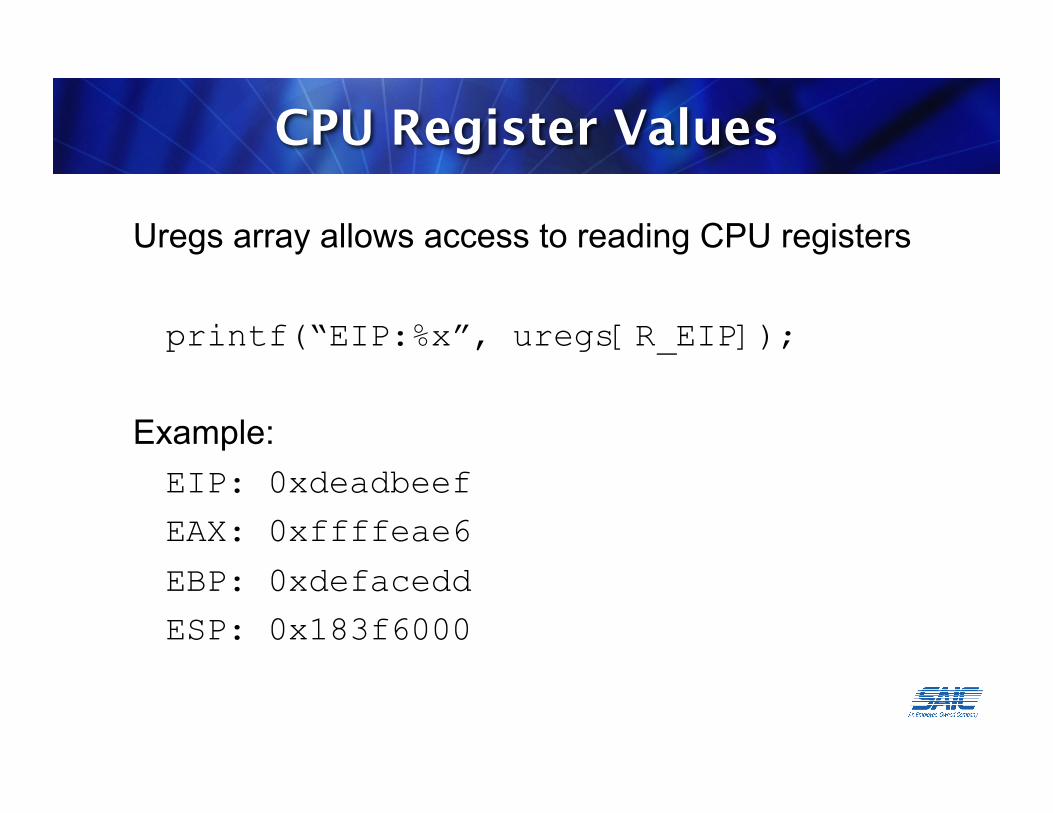
CPU Register Values
Uregs array allows access to reading CPU registers
printf(“EIP:%x”, uregs[R_EIP]);
Example: EIP: 0xdeadbeef
EAX: 0xffffeae6
EBP: 0xdefacedd
ESP: 0x183f6000

Destructive Examples
#!/usr/sbin/dtrace -w -s syscall::uname:entry { self->a = arg0; }
syscall::uname:return{ copyoutstr(“Windows”, self->a, 257); copyoutstr(“PowerPC”, self->a+257, 257); copyoutstr(“2010.b17”, self->a+(257*2), 257); copyoutstr(“fud:2010-10-31”, self->a+(257*3), 257); copyoutstr(“PPC”, self->addr+(257*4), 257); }
Adapted from: Jon Haslam, http://blogs.sun.com/jonh/date/20050321

Snooping
syscall::write: entry {
self->a = arg0;
}
syscall::write: return {
printf(“write: %s”,
copyinstr(self->a);
}
Got Ideas?
Using DTrace: • Monitor stack overflows • Code coverage • Fuzzer feedback • Monitor heap overflows

DTrace vs. Debuggers
• Don’t think of DTrace as a debugger • User mode and kernel mode debuggers allow you
to control execution and inspect process information
• DTrace can instrument both the kernel and user land applications at the same time
• To trace execution, debuggers use instructions to pause and resume execution
• DTrace carries out parallel actions in the kernel when a probe is hit

DTrace vs. Debuggers
• Traditional debuggers also affect the target process’s memory layout. DTrace doesn’t
• DTrace does not directly perform exception handling
• DTrace can halt process and transfer control to external debugger
• Currently DTrace is not susceptible to traditional anti-debugging techniques (isdebuggerpresent())
• However, Apple has implemented probe blocking with use of the PT_ATTACH_DENY

DTrace vs. Tracers
• Truss, ltrace, and strace operate one process at a time, with no system-wide capability
• Truss reduces application performance • Truss stops threads through procfs, records the
arguments for the system call, and then restarts the thread
• Valgrind™ is limited to a single process and only runs on Linux
• Ptrace is much more efficient at instruction level tracing but it is crippled on OS X
*Valgrind is Open Source/Free Software and is freely available under the GNU General Public License.

DTrace Limitations
• The D language does not have conditionals or loops
• The output of many functions is to stdout (i.e., stack(), unstack())
• Lack of loops and use of stdout means DTrace is not ideal for processing data
• We can fix this • Cannot modify registers :’( epic sad time

DTrace Cautionaries
A few issues to be aware of: • DTrace drops probes by design • Tune options, narrow trace scope to improve
performance • Some libraries and functions behave badly • overflows can cause violations before function
return
RE with Ruby, DTrace and the Mach API
RE:Trace & RE:dbg

RE:Trace
• RE:Trace combines Ruby with DTrace • Ruby gives us the power of OOP, text processing,
iteration • RE:Trace utilizes Ruby libdtrace bindings, written
by Chris Andrews • Can be the glue which combines the power of
several existing Ruby RE frameworks (idarub, librub, metasm, MSF3)
• RE:Trace is similar to programmatic frameworks (pyDBG, noxDBG, immDBG)
• Includes script to dump and search memory

IdaRub
• Wraps IDA interface • Ruby code is the client • Server is IDA plugin • Ruby glues it all together • IdaRub was released by Spoonm at REcon 2006
ida.set_item_color(eip, 3000)
More info: http://www.metasploit.com/users/spoonm/idarub/

RE:Trace and Exploit Dev
• Vulnerability analysis times can be dramatically reduced with RE:Trace
• DTrace probes allow you to track data input flow throughout a process to understand where and why memory corruption took place
• Methods that cause stack and heap corruption can be pinpointed using IDARub to integrate IDA’s static analysis features

RE:Trace and Code Coverage
• DTrace can “hook” every function in a process • This makes it perfect for implementing a “code
coverage aware” fuzzer • Code coverage is useful for understanding what
areas are being fuzzed • Current RE code coverage monitors are mostly
block based (PaiMei) • We can use IDA to obtain block information or
check code coverage at the function or instruction level

RE:dbg
• RE:dbg picks up where RE:Trace left off • Programmatic debugger for mach debug API • Partially exists on OS X in Python (see vtrace and
Charlie Miller’s pydbg port)
Integrated Ruby based RE Toolset: • Tracing : RE:Trace • Disassembly: IDArub • Debugger reDBG

RE:dbg
• C code around Mach debugging API with Ruby bindings
• Higher level Ruby class to make everything easy • Symbol resolution • Read and write memory • Walk memory segments • Modify memory permissions • Set breakpoints • Exception handling • Interface with IDA ( ... metasm?)

iPhoto Format String Exploit
• iPhoto format string vuln is a good test for automation
• URL handler bug: iphoto://%dd%n • What we want to do is trace with RE:Trace until
we hit printf with arg1=%25 (URL encoded %n) • Use idarub to get disassembly info from IDA • Set a break on RET of the function with reDBG • When breakpoint is hit, print out stack return
address (or whatever you overwrote) to make sure the overflow was correct

RE:Trace/reDBG/IDArub
Progtext = “pid$target::__vfprintf:entry /copyinstr(arg2) == "%25n"/ {stop();}”
t = Dtrace.new p = t.createprocess([ARGV[0]]) prog = t.compile progtext prog.execute t.go p.Continue ida,sess = IdaRub.auto_client Func = ida.Get_func(eip) function[0..4].each do |line| if line == “ret” Dbg = reDBG.new dbg.attach(pid)
dbg.setBreak(line)

RE:dbg ASLR
• ASLR analysis • Start the application, lookup addresses for
application and library symbols • Search through all memory for references to
those addresses • Rinse and repeat
Can you find an address that is always relative to an address of a useful function?

RE:dbg Soon!
If it’s not up in a week, bug us

MONITORING THE STACK Writing a Stack Overflow Monitor with RE:Trace

Stack Overflow Monitoring
Programmatic control at EIP overflow time allows you to:
• Pinpoint the vulnerable function • Reconstruct the function call trace • Halt the process before damage occurs (HIDS) • Dump and search process memory • Send feedback to fuzzer • Attach debugger

Overflow Detection in One Probe
#/usr/sbin/dtrace -w -s
pid$target:::return
/ uregs[R_EIP] == 0x41414141 / {
printf("Don’t tase me bro!!!");
stop()
...
}
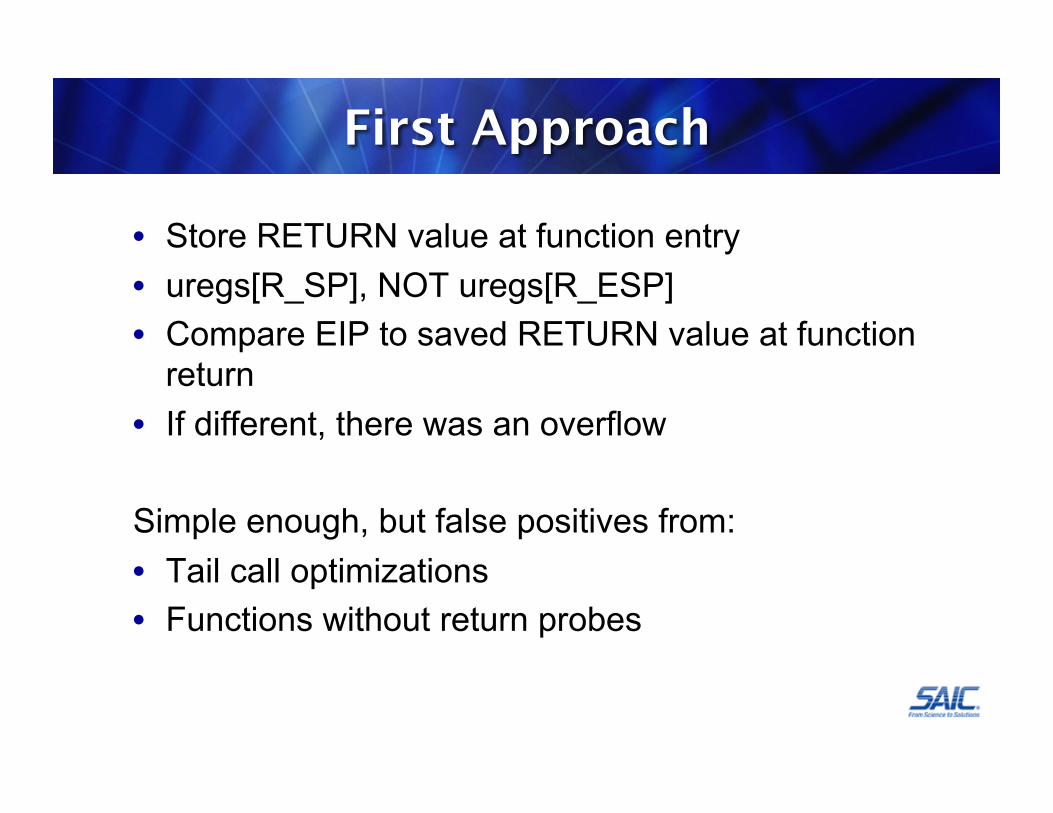
First Approach
• Store RETURN value at function entry • uregs[R_SP], NOT uregs[R_ESP] • Compare EIP to saved RETURN value at function
return • If different, there was an overflow
Simple enough, but false positives from: • Tail call optimizations • Functions without return probes

DTrace and Tail Calls
• Certain compiler optimizations mess with the standard call/return control flow
• Tail calls are an example of such an optimization • Two functions use the same stack frame, saves
resources, less instruction • DTrace reports tail calls as a return then a call,
even though the return never happens • EIP on return is not in the original calling function,
it is the entry to second • Screws up simple stack monitor if not aware of it

New Approach
• Store RETURN value at function entry • At function return, compare saved RETURN value
with CURRENT value • Requires saving both the original return value and
its address in memory • Fires when saved RETURN ! = current RETURN
and EIP = current RETURN

But Missing Return Probes???
Still trouble with functions that “never return” • Some functions misbehave • DTrace does not like function jump tables
(dyld_stub_*) • Entry probe but no exit probe

Determining Missing Returns
Using DTrace – l flag • List entry/exit probes for all functions • Find functions with entry but no exit probe Using DTrace aggregates • Run application • Aggregate on function entries and exits • Look for mismatches Exclude these functions with predicates • / probefunc ! = “everybodyJump” /
Stack Overflow Video

Advanced Tracing
Diving in deeper: • Instruction-level tracing • Code coverage with IDA Pro and IdaRub • Profiling idle and GUI code • Feedback to the fuzzer, smart/evolutionary
fuzzing • Conditional tracing based on function parameters
(reaching vulnerable code paths)

CODE COVERAGE Instruction Tracing

Code Coverage Approach
Approach • Instruction-level tracing using DTrace • Must properly scope tracing • Use IdaRub to send commands to IDA • IDA colors instructions and code blocks • Can be done in real time, if you can keep up

Tracing Instructions
• The last field of a probe is the offset in the function
• Entry = offset 0 • Leave blank for every instruction • Must map static global addresses to function
offset addresses
Print address of every instruction: pid$target:a.out:: { print(“%d”, uregs[R_EIP]); }

Tracing Instructions (cont.)
• DTrace to print instructions • Ruby-Dtrace to combined DTrace with Ruby • Idarub and rublib to combined Ruby with IDA
Tracing libraries • When tracing libraries, must know memory layout
of program • vmmap on OS X will tell you • Use offset to map runtime library EIPs to
decompiled libraries

Code Coverage with DTrace
Capabilities: • Associate fuzz runs with code hit • Visualize code paths • Record number of times blocks were hit • Compare idle traces to other traces
Limitations: • Instruction tracing can be slow for some
applications • Again, tuning and limiting scope

Coverage Visualization

Runtime Call Graphs

MONITORING THE HEAP Writing a Heap Overflow Monitor

Hackin’ the Heap with RE:Trace
• The heap has become “the” major attack vector replacing stack-based buffer overflows
• Relatively common unlink() write4 primitives are no longer as “easy” to exploit on many platforms
• See Aitel and Waisman’s excellent “Debugging with ID” presentation for more details
• As they point out, the key to the “new breed” of heap exploit is understanding the heap layout and allocation patterns
• ImmDBG can help you with this on Win32, and Gerrado Richarte’s heap tracer can help you with visualization and double free() on Solaris and Linux

Hackin’ the Heap with RE:Trace
• Many Different ways to use DTrace for heap exploits
• Standard double free(), double malloc(), Leak Detection
• Heap Visualization (Directed Graphs/OpenGL/Instruments)
• Pesky off by one errors • Spot app specific function pointers to overwrite • Find heap overflows/corruptions that might not be
immediately dereference

OS X Heap Exploits
• Ltrace = Bonds on the Pirates, DTrace = Bonds on the Giants
• Like Most BSD’s OS X does not store metadata “in-band”
• Older techniques such as overwriting initial_malloc_zones function pointers are dead
• You now have to overwrite app specific data • DTrace already hooks functions to understand
heap layout and allocation patterns • A slew of Heap Tools for OS X (vmmap,
MallocScribble, MallocCheckHeap, leaks)

Heap Visualization
Directed Graph of Heap Allocation Sizes:

RE:Trace Heap Smasher()
Refresher: • When you malloc() on OS X, you are actually
calling the scalable zone allocator, which breaks allocations into different zones by size:
Adapted from: OS X Internals A System Approach

RE:Trace Heap Smasher()
• In our heap smash detector, we must keep track of four different “heaps”
• We do this by hooking malloc() calls and storing them to ruby hashes with the pointer as the key and the size allocated as the value
• We break the hashes into tiny, small, large, and huge by allocation size
• We then hook all allocations and determine if the pointer falls in the range of the previous allocations. We can adjust the heap as memory is free()’d or realloc’d()

RE:Trace Heap Smasher()
• By hooking C functions (strncpy, memcpy, memmove, etc.) we can determine if they are over-allocating to locations in the heap by looking at the arguments and comparing to our heap records
pid$target::strncpy:entry { self->sizer = arg2; printf("copyentry:dst=0x%p|src=0x%p;size=%i", arg0, arg1, arg2); self->sizer = 0; }

RE:Trace Heap Smasher()
• We can check to see if the allocation happens in a range we know about
• If it does, we know the size allocation, and we can tell if a smash will occur
• Compared to our stack smash detector, we need very few probes. A few dozen probes will hook all the functions we need
• We can attach to a live process on and off without disturbing it

RE:Trace Heap Smasher()
• We also keep a hash with the stack frame, which called the original malloc()
• When an overflow is detected, we know:
– Who allocated it (stack frame) – Who used it (function hook) – Where the overflowed memory is – How large the overflow was – We can find out if its ever free()’d

RE:Trace Heap Smasher() Video

RE:Trace Heap Smasher()
Future additions: • Graphviz/OpenGL Graphs • There is a new version of Firefox which has probes in the
JavaScript library • This would give us functionality to help create tools similar
to Alexander Sotirov’s HeapLib (Heap Fung Shui) for heap manipulation generically
• Can trigger on high level object creation or action, then trace for mallocs
• You tell me?

DTRACE DEFENSE Using DTrace Defensively

Basic HIDS with DTrace
• Using Dtrace, you can profile your applications basic behavior
• See Stefano Zanero’s BH 06 talk on Anomaly detection through system call argument analysis
• You should then be able to trace for anomalies with predicates
• This is great for hacking up something to protect a custom application (monitor for return-to-libc)
• Easy to create a rails interface for monitoring with Ruby-DTrace

Basic HIDS with DTrace
• Problem: “I want to use QuickTime, but it’s got a #@#$@# of holes”
• Solution: Make a DTrace script to call stop() when weird stuff happens
• QuickTime probably never needs to call /bin/sh or mprotect() on the stack to make it writable (Houston we have a problem)
*QuickTime® is a registered trademark of Apple Inc. in the United States and/or other countries.

Basic HIDS with DTrace
#!/usr/sbin/dtrace -q -s
proc:::exec /execname == "QuickTime Player" && args[0] == "/bin/sh"/ {
printf("\n%s Has been p0wned! It tried to spawned %s\n”, execname, args[0]) }

HIDS Video

DTrace and Rootkits
• Check out Archim’s paper “B.D.S.M the Solaris 10 Way,” from the CCC Conference
• He created the SInAr rootkit for Solaris 10 • Describes a method for hiding a rootkit from
DTrace • DTrace FBT (kernel) provider can spy on all
active kernel modules • Should have the ability to detect rootkits, which
don’t explicitly hide from DTrace (SInAr is the only one I could find)
• Expect more on this in the future

DTrace for Malware Analysis
• Very easy to hack up a script to analyze MalWare • Example: Leopard DNS Changer (OSX.RSPlug.A ) • Why the heck is my video codec calling…
/usr/sbin/scutil add ServerAddresses * $s1 $s2 set State:/Network/Service/$PSID/DNS
• You can monitor file I/O and syscalls with just two lines • Scripts to do this now included with OS X by default • Malware not hiding from DTrace yet • BUT Apple made that a feature (yayyy!)

Hiding from DTrace
• In Jan. Core DTrace developer Adam Leventhal discovered that Apple crippled DTrace for Leopard
• On OS X Your application can set the “PT_ATTACH_DENY” flag to hide from DTrace just like you can for GDB
• Leventhal used timing analysis to figure out they are hiding iTunes™ from DTrace
• Very easy to patch in memory or with kext • Landon Fuller released a kext to do this
http://landonf.bikemonkey.org/code/macosx/Leopard_PT_DENY_ATTACH.20080122.html

KERNEL DEBUGGING OS X Kernel / Driver
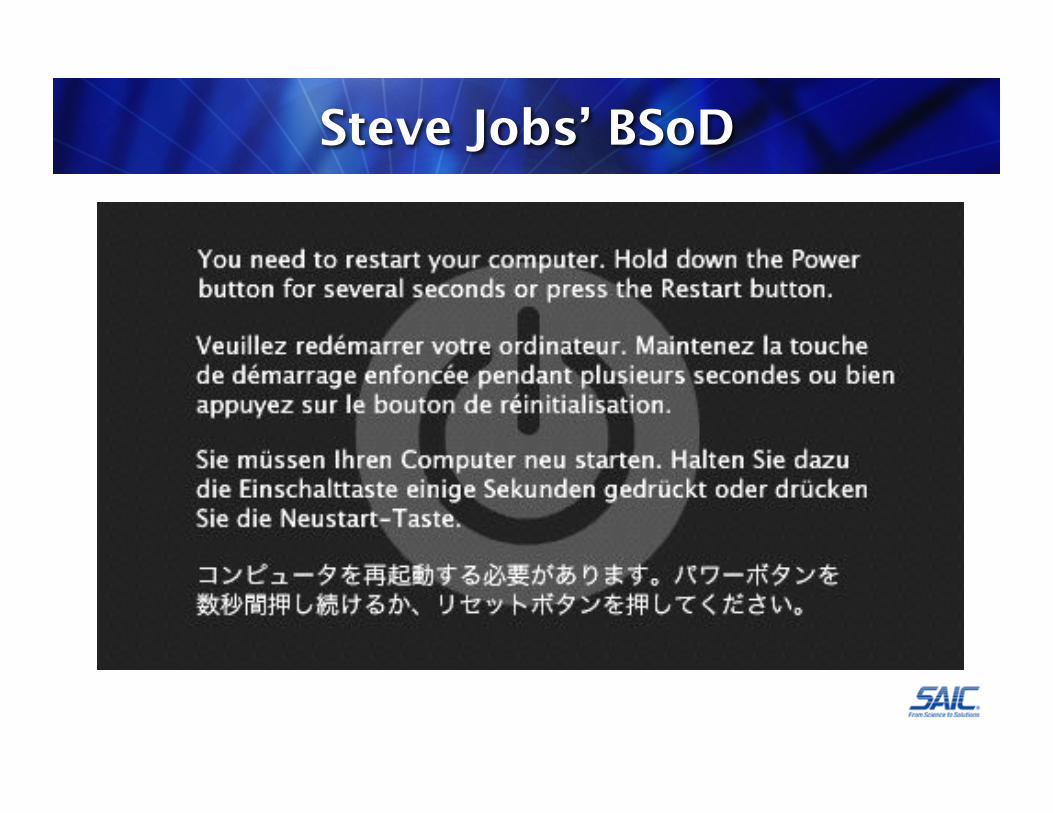
Steve Jobs’ BSoD

Panic Log
/Library/Logs/PanicReporter/ Fri Feb 8 09:30:02 2008 panic(cpu 1 caller 0x001A7BED): Kernel trap at 0x5c3f1cf9, type 14=page fault, registers: CR0: 0x8001003b, CR2: 0x00000004, CR3: 0x013bd000, CR4: 0x00000660 EAX: 0x00000000, EBX: 0x08d74490, ECX: 0x08d74490, EDX: 0x00000000 CR2: 0x00000004, EBP: 0x7633fd98, ESI: 0xe00002ed, EDI: 0x07038200 EFL: 0x00010202, EIP: 0x5c3f1cf9, CS: 0x00000008, DS: 0x07030010 Error code: 0x00000000
Backtrace, Format - Frame : Return Address (4 potential args on stack) 0x7633fb98 : 0x12b0e1 (0x455670 0x7633fbcc 0x133238 0x0) 0x7633fbe8 : 0x1a7bed (0x45ea20 0x5c3f1cf9 0xe 0x45e1d4) 0x7633fcc8 : 0x19e517 (0x7633fce0 0x9086080 0x7633fd98 0x5c3f1cf9) 0x7633fcd8 : 0x5c3f1cf9 (0xe 0x48 0x10 0x7030010) 0x7633fd98 : 0x612470 (0x8d74490 0x0 0xe00002ed 0x0) 0x7633fdf8 : 0x88a2c7 (0x6eaf000 0x7038200 0xe00002ed 0x0) 0x7633fe68 : 0x88b7ec (0x6eaf000 0x7024240 0x0 0x0) 0x7633fed8 : 0x88b824 (0x6eaf000 0x0 0x0 0x135b0f) 0x7633fef8 : 0x88e705 (0x6eaf000 0x2 0x5366a0 0x6e4686c) 0x7633ff18 : 0x41d149 (0x6eaf000 0x6f21700 0x1 0x19ccc1) 0x7633ff68 : 0x41c2a6 (0x6f21700 0x6d77208 0x7633ff98 0x1368db) 0x7633ff98 : 0x41bf88 (0x6eaa500 0x6d95540 0x7633ffc8 0x7e56998) 0x7633ffc8 : 0x19e2ec (0x6eaa500 0x0 0x1a10b5 0x7726f20) Backtrace terminated-invalid frame pointer 0 Kernel loadable modules in backtrace (with dependencies): com.keyspan.iokit.usb.KeyspanUSAdriver(2.1)@0x5c3e2000->0x5c436fff dependency: com.apple.iokit.IOSerialFamily(9.1)@0x723000 dependency: com.apple.iokit.IOUSBFamily(3.0.5)@0x60d000 com.apple.driver.AppleUSBUHCI(3.0.5)@0x884000->0x891fff dependency: com.apple.iokit.IOPCIFamily(2.4)@0x63c000 dependency: com.apple.iokit.IOUSBFamily(3.0.5)@0x60d000 com.apple.iokit.IOUSBFamily(3.0.5)@0x60d000->0x634fff
BSD process name corresponding to current thread: kernel_task
Mac OS version: 9B18
Kernel version: Darwin Kernel Version 9.1.0: Wed Oct 31 17:46:22 PDT 2007; root:xnu-1228.0.2~1/RELEASE_I386 System model name: MacBookPro3,1 (Mac-F42388C8)

Page Fault
... Kernel trap at 0x5c3f1cf9, type 14=page fault, registers: CR0: 0x8001003b, CR2: 0x00000004, CR3: 0x013bd000, CR4:
0x00000660 ... com.keyspan.iokit.usb.KeyspanUSAdriver(2.1)@0x5c3e2000
->0x5c436fff
• Exception happens at 0x5c3f1cf9 • Keyspan driver is mapped to memory starting at 0x5c3e2000 • Drivers loaded page aligned so - 0x1000 • 0x5c3f1cf9 - 0x5c3e2000 - 0x1000 = 0xecf9
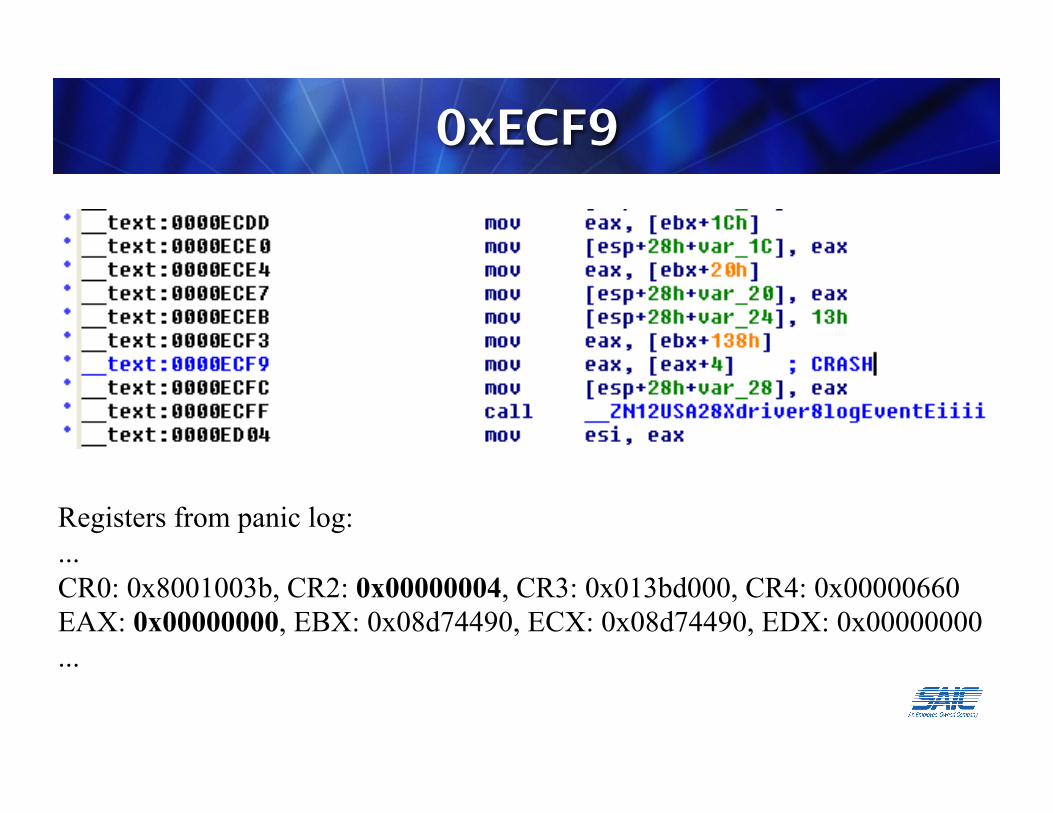
0xECF9
Registers from panic log: ... CR0: 0x8001003b, CR2: 0x00000004, CR3: 0x013bd000, CR4: 0x00000660 EAX: 0x00000000, EBX: 0x08d74490, ECX: 0x08d74490, EDX: 0x00000000 ...
Kernel Debugging
• All that was done without debugging • What if we want to inspect memory? • What if we get different errors and we aren’t sure why? • Further debugging will be necessary
Kernel Debugging is a pain • Require remote setup • Need two hosts • Export and import symbols • Can DTrace help?

Kernel References
Apple Technical Note TN2063: Understanding and Debugging Kernel Panics
Apple Technical Note TN2118: Kernel Core Dumps
Hello Debugger: Debugging a Device Driver With GDB http://developer.apple.com/documentation/Darwin/Conceptual/KEXTConcept/KEXTConceptDebugger/hello_debugger.html
Uninformed volume 8 article 4 by David Maynor http://www.uninformed.org/?v=8&a=4
HIGHER LEVEL TRACING Leveraging Custom Application Probes

Application Probes
• Represent a more abstract action • Browser example: Page Load, build DOM, DNS
request • Helps for gathering performance metrics • Also tracing VM languages like Java, Python, Ruby • Largely still in the works

Tracing SQL Calls
• fuzz inputs • hook the database
#!/usr/sbin/dtrace –s
pid$target:mysqld:*dispatch_command*:entry { printf(”%Y %s\n”, walltimestamp, copyinstr(arg2)) }
Example:
2008 Jun 15 01:02:35 INSERT INTO router (prefix, lladdr, mac, trusted, address) VALUES ('face<script>', 'face''', 'face;--', 1, 'face"')

Future Work
• Automated feedback and integration with fuzzers • More experimenting with Kernel tracing • Improved overflow monitoring • Memory allocation analysis libraries (will help port
Sotirov’s HeapLib to ActiveX, DHTML version or other browsers/OSes)
• Garbage collection behavior analysis • More on utilizing application-specific probes
(probes for JS in browsers, MySQL probes, ...) • New Probes: Network providers, IP send & recv
Your own ideas!

Conclusion
DTrace can: • Collect an unprecedented range of data • Collect very specific measurements • Scope can be very broad or very precise
Applied to Reverse Engineering: • Allows researchers to pinpoint specific situation (overflows) • Or to understand general behavior (heap growth)
RETRACE + REDBG + IDA!

Thank You!
Tiller Beauchamp SAIC [email protected]
David Weston SAIC [email protected]
See the RE:Trace framework for implementation:
( redbg coming soon! )
http://www.poppopret.org/
Questions?