rion antirion ammouche
TRANSCRIPT

1
Overview of a two decades durability follow-up for two major bridges: Vasco
de Gama (Portugal) and Rion-Antirion (Greece)
Dr. Abdelkrim Ammouche / Dr Christophe
Carde / Dr Nouredine Rafaï
LERM - 23, rue de la Madeleine
13631 Arles cedex – FRANCE
E-mail:
Lionel Linger / François Cussigh
VINCI Construction - 5, cours Ferdinand
de Lesseps - 92851 Rueil-Malmaison cedex
- FRANCE
E-mail:
ABSTRACT
In Rion-Antirion Bridge and Vasco de Gama projects, a service lifetime of 120 years is required.
To achieve this goal, Vinci and Lerm have carried out an extensive research and test program
for relevant durability properties of the various types of concrete. For both cases, the strategy
adopted is the corrosion control of embedded steel by reducing the rate of chloride penetration
which is the main issue for the durability of concrete structures in marine environment. This
objective was based on the proper definition of exposure zones, the definition of the adequate
concrete covers and a proper characterization and evaluation of concrete at trial mixes stage and
during execution. In accordance with the Inspection and Maintenance Manuals, several detailed
inspections, in-situ and laboratory testing (mapping of concrete cover, concrete properties,…)
and recalibration of input data used for chloride penetration model have been performed
according to a specific time schedule. This article summarizes the main outcomes of the
durability follow-up corresponding to a period of about 15 years for Vasco de Gama and 10
years for Rion-Antirion. These in-field follow-up data-bases are key parameters for developing a
practical methodology for concrete structures service lifetime control.
Key words: Durability, marine environment, high performance concrete, QA/QC program,
service fife assessment.
1. INTRODUCTION
1.1 Vasco de Gama Project
The Bridge over the Tage in Lisbon, has been built between 1995 and 1998 in the estuary of the
river, and is then located in a maritime area [3]. With a total length of 18 500 meters, including
the interchanges, and with a width of 30 meters, the crossing is composed by five main
structures: North Viaduct, Expo Viaduct, Main Bridge, Central Viaduct and South Viaduct.
Fig. 1 - Vasco de Gama Project (VdG) overview
2
1.2 Rion-Antirion Project
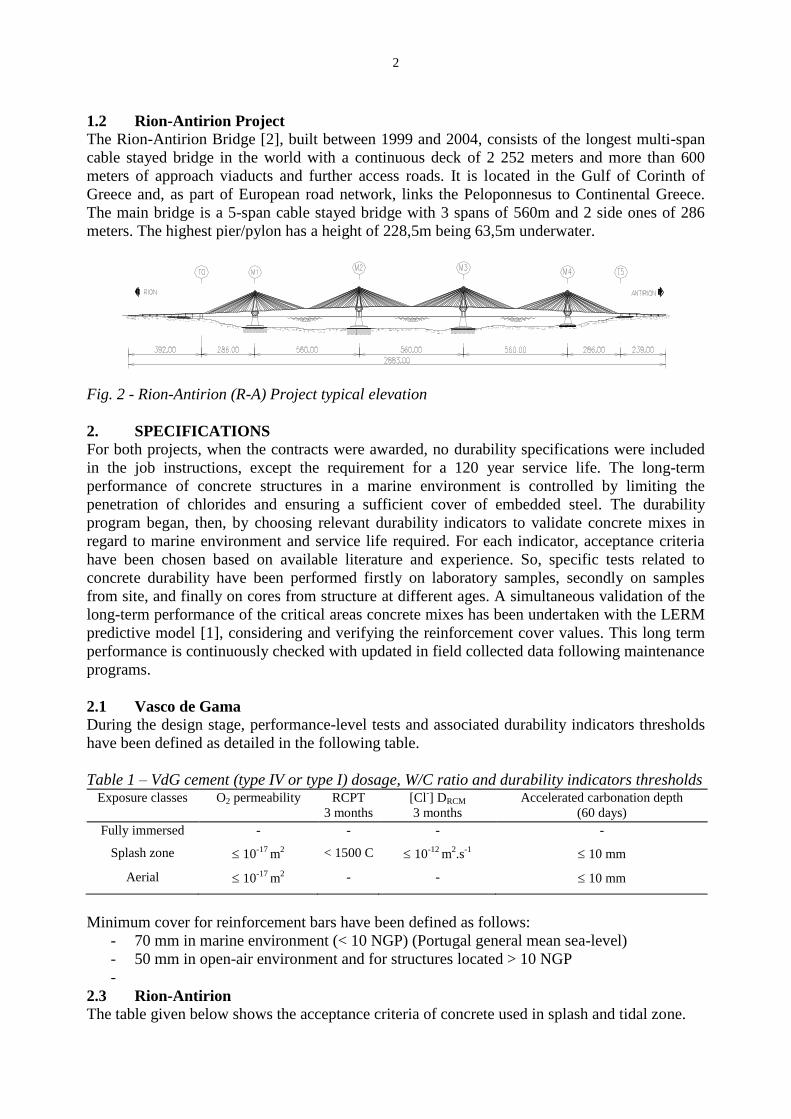
The Rion-Antirion Bridge [2], built between 1999 and 2004, consists of the longest multi-span
cable stayed bridge in the world with a continuous deck of 2 252 meters and more than 600
meters of approach viaducts and further access roads. It is located in the Gulf of Corinth of
Greece and, as part of European road network, links the Peloponnesus to Continental Greece.
The main bridge is a 5-span cable stayed bridge with 3 spans of 560m and 2 side ones of 286
meters. The highest pier/pylon has a height of 228,5m being 63,5m underwater.
Fig. 2 - Rion-Antirion (R-A) Project typical elevation
2. SPECIFICATIONS
For both projects, when the contracts were awarded, no durability specifications were included
in the job instructions, except the requirement for a 120 year service life. The long-term
performance of concrete structures in a marine environment is controlled by limiting the
penetration of chlorides and ensuring a sufficient cover of embedded steel. The durability
program began, then, by choosing relevant durability indicators to validate concrete mixes in
regard to marine environment and service life required. For each indicator, acceptance criteria
have been chosen based on available literature and experience. So, specific tests related to
concrete durability have been performed firstly on laboratory samples, secondly on samples
from site, and finally on cores from structure at different ages. A simultaneous validation of the
long-term performance of the critical areas concrete mixes has been undertaken with the LERM
predictive model [1], considering and verifying the reinforcement cover values. This long term
performance is continuously checked with updated in field collected data following maintenance
programs.
2.1 Vasco de Gama
During the design stage, performance-level tests and associated durability indicators thresholds
have been defined as detailed in the following table.
Table 1 – VdG cement (type IV or type I) dosage, W/C ratio and durability indicators thresholds Exposure classes O2 permeability RCPT
3 months
[Cl-] DRCM
3 months
Accelerated carbonation depth
(60 days)
Fully immersed - - - -
Splash zone 10-17
m2 < 1500 C 10
-12 m
2.s
-1 10 mm
Aerial 10-17
m2 - - 10 mm
Minimum cover for reinforcement bars have been defined as follows:
- 70 mm in marine environment (< 10 NGP) (Portugal general mean sea-level)
- 50 mm in open-air environment and for structures located > 10 NGP
-
2.3 Rion-Antirion
The table given below shows the acceptance criteria of concrete used in splash and tidal zone.

3
Table 2 - acceptance criteria of concrete mixes used in splash and tidal zones
Exposure Cement content Weffective/C ratio Water depth
penetration RCPT at 90 days
Splash and tidal zone > 400 kg/m3 ≤ 0.4 ≤ 20 mm < 1000 C
The different covers of the structure have been defined in accordance to the durability criteria
selected. The table 3 summarizes the covers selected for the Rion-Antirion Bridge and applied
throughout construction for the different exposure zones.
Table 3 – R-A covers in relation to exposure zone (values are in mm)
Exposure Situation Nominal Cover
Immersed zone (below MSL –5) 60 mm
Tidal & Splash (MSL –5 to MSL +10m) 85 mm
Substructure externally exposed above MSL +10 50 mm
3. CONCRETE MIXES
For Vasco de Gama, concrete mixes have been designed using CEM I 42.5 seawater resistant
Portland cement for aerial structures (> 10 NGP) with or without fly-ash and CEM IV 32.5 (22
% fly-ash content) for marine structures (< 10 NGP). For Rion-Antirion, most of concrete mixes
have used cement type CEM III 42.5 PM ES with 60% to 64% of slag. For some applications in
aerial zones, a mix of CEM III 42.5 and CEM I 52.5 has also been used. Typical concrete mixes
used for both projects are given in the following table 4.
Table 4 – VdG & R-A typical concrete mixes Exposure classes Strength class Cement type Cement min. content Weff/C ratio
VdG Fully immersed C35/45 CEM IV 430 0,35
Splash zone C40/50 CEM IV 430 0,33
Aerial C45/55 CEM I 400 0,42
R-A Immersed zone and Splash zone C45/55 CEM III 420 0,39
Aerial C60/75 CEM I 450 0.33
4. DURABILITY INDICATORS VALUES
Measurements made on typical concrete mixes during construction on samples cored on site are
synthesized in the following tables. These tests also showed that concrete characteristics were
improved with time linked to the slow hydration of cements containing either fly ashes or slag.
Table 5 – VdG durability indicators representative routine control values Exposure class Age O2 Permeability Porosity RCPT [Cl
-] DRCM
Splash zone 28 d
90 d
0,5 10-17
m2
-
11-13 %
-
2800 C
900 C
1,3 10-12
m2/s
0,8 10-12
m2/s
Aerial zone 28 d 0,9 10-17
m2 12,5 % 6400 C 3,2 10
-12 m
2/s
Table 6 – R-A durability indicators representative routine control values Exposure Class RCPT at 90d DRCM at 28d DRCM at 120 d O2 Permeability
Splash zone [220-600] C 1.10-12
m2/s 0.5.10
-12 m
2/s < 1.10
-17 m
2
Aerial zone [1300-2100] C / / /
5. SERVICE LIFETIME ASSESSMENT
Service lifetime assessment for both projects is done through LERM model [1] allowing
chlorides penetration prediction with time. The main specificities of this model are: 1/

4
consideration of interactions between chlorides and cement paste, 2/ variation of chlorides
diffusion coefficient and physic-chemical properties with space and time, and 3/ evolution of
boundary conditions toward time. The main input data of model used are:
- Initial diffusion coefficient (DRCM) measured at short term (28/90 days).
- Evolution law of chlorides diffusion coefficient with time. The law (t-
or e-t
forms),
which is experimentally calibrated, reflects decrease of chlorides diffusion coefficient
with time linked to hydration of cement paste.
- Initial chlorides content in the concrete.
- Chlorides binding capacity.
- Free chlorides content at the surface of concrete (limit condition).
- Time and depth.
These input data are continuously cross-checked and if necessary re-calibrated in the course of
measurements carried out according to the structures maintenance follow-up programs.
Experience gathered on Vasco de Gama and Rion-Antirion has allowed improving accuracy of
input data and therefore servicing lifetime assessment.
For Vasco de Gama project, a long term follow-up extensive (more than 70 zones) durability
program started after project completion on several parts of bridge in splash/tidal zones and
aerial zones to collect concrete in-field data (concrete cover mapping, corrosion monitoring
(potential and speed), total and free chlorides concentration profiles, carbonation depth,
chlorides diffusion coefficient). Chloride in-field profiles have been compared to predicted
figures given by numerical simulations. The choice of follow-up zones has been made including
parameters as position regarding sea level, exposure to predominant winds, and occurrence of
identified local defaults (reduced concrete cover, cracks). The corresponding results led to
decide, when necessary, to undertake locally some preventive additional protections to achieve
service life required.
For Rion-Antirion project, during initial concrete qualification stage, durability tests have been
performed on samples and cores coming from concrete mock-up elements. In order to verify the
relevancy of these initial results and to validate the consistency of the in-situ concrete in the
different structural elements, additional laboratory tests have also been performed on cores
extracted from several parts of the structure, selected and identified using non-destructive testing
of exposed concrete surfaces (sclerometry and ultrasonic methods). Achieved results were
consistent with input data collected during qualification stage. Finally, for the maintenance
program concrete durability follow up, one sacrificial reinforced concrete wall was cast on P2
pile cap during construction period and under the same circumstances (concrete mix design,
manpower, placing and curing conditions). This mock-up full-scale wall allowed measuring
chloride diffusion coefficient and in-field chlorides concentration profile at different ages to
check predicted figures provided by numerical simulations. Some additional cores also have
been extracted in concrete cover of structural elements located in the splash zone (M2 & M3
pylons) to compare chlorides ingress in concretes from mock-up wall and real structure.
5.1 Chloride surface concentration evolution toward time
Due to the wet/drying cycles linked to tides, chlorides content at the surface of concrete
increases with time until a maximum value which has to be considered for long term numerical
simulations as boundary condition. Results of durability program performed on both bridges
show that free chloride concentrations at the surface of in situ concrete (limit condition used in
model) increase during few years and stabilize after. Furthermore, significant variations are
observed at different location in splash and tidal zones. For Vasco de Gama (more than 10 years
exposure) and Rion-Antirion bridges (about 5 years exposure), in splash and tidal zones, the free
chloride contents at the surface of in situ concrete ranges respectively from 3.0 to 6.0 % and 3.5
to 5.5 % of cement mass. For a given project, these variations are certainly due to local concrete

5
characteristic differences, effects of predominant winds, sample location (height compared mean
sea level), and sampling procedure.
5.2 Chloride binding capacity
The knowledge of bound chlorides is a major issue to have a relevant prediction of free
chlorides content with time, which acts in steel depassivation process potentially leading to
corrosion. Chloride binding capacity mainly depends on cement type and chlorides
concentration in concrete pore solution. It can be initially estimated in laboratory by determining
interaction isotherms on concrete crushed samples. The chloride binding capacity measured by
LERM for Rion-Antirion project is given in the following figure.
Fig. 3 - Interaction isotherms of chloride (bound chlorides versus total chlorides)
In a second stage, it can be checked by direct measurement on in field concrete exposed to
chloride during few years. For highest total chloride surface concentration measured in field (7-
8 %), results show that bound chloride at the surface of exposed concrete is around 25 % of total
chloride content for Vasco de Gama bridge after more than 10 years, and is around 20 % of total
chloride content for Rion-Antirion bridge after about 5 years.
5.2 Chloride diffusion coefficient evolution toward time
Chloride diffusion coefficient is one of the most important parameter for numerical simulations:
and the knowledge of its evolution with time is, then, essential. Evolution laws of chloride
diffusion coefficient with time have been defined for both projects. For Vasco de Gama,
chloride diffusion coefficient evolution with time is better described by an exponential law (e-t
)
during the first 5 years after casting. After 5 years and up to 13 years, in field measurements
show that the DRCM value is stabilized. For Rion-Antirion, chloride diffusion coefficient
evolution with time is better described by an exponent law (t-) and seems to stabilize between 5
to 10 years after casting. Main difference between the both laws (figure 4) is the kinetic of
decrease, which is mainly linked to the cement type used for each concrete. For Vasco de Gama
bridge concrete is designed using fly ashes whereas ground granulated blast furnace slag is
incorporated in concrete mix design used in Rion-Antirion. It’s highlighted that, for both cases,
chloride diffusion coefficients have not to be considered as continuously decreasing with time.
A final constant value need, then, to be included in the numerical model.

6
0,00E+00
1,00E-12
2,00E-12
3,00E-12
0 20 40 60 80 100 120 140 160 180 200
Ch
lori
de
dif
fus
ion
co
eff
icie
nt
(m2/s
)
Time (month)
D = 2.10-12.e-0.0527t
(0 to 60 months)
D = 1.10-13 (> 60 months)
D = 1.10-12.t-0.215
(0 to 120 months)
D = 3.5 10-13
(> 120 months)
Results from Vasco de GamaResults from Rion Antirion
Fig. 4 - evolution of chloride diffusion coefficient of concretes from both bridges
5.4 Numerical simulations results
Based on results obtained during durability program performed on both bridges, the main input
data used for numerical simulations in splash and tidal zones have been defined as summarized
in the following table.
Table 7: input data used in model for splash and tidal zones Bridge Corrosion risk Free [Cl
-] at the concrete
surface (weight % of cement)
DRCM evolution law with time
Vasco de
Gama
Low
Critical
3.0
6.0
DRCM=2.10-12
e-0.0527t
, and
DRCM=0.1 10-12
m2/s for t > 60 months
Rion-Antirion Low
Critical
3.5
5.5
DRCM=1.10-12
t-0.215
, and
DRCM=0.35 10-12
m2/s for t > 120 months
Figure 5 below illustrates the last numerical simulations made on concrete elements
corresponding to splash and tidal zones for both bridges, compared to real chloride in field
profiles.
Vasco de Gama

7
Rion-Antirion
Fig. 5 - examples of numerical simulations made on concrete from VdG and R-A (splash zone)
based on results obtained during durability program
Up to date numerical simulations based on justified and calibrated input data show that service
life required is complied with for both bridges. Furthermore, no re-calibration of model has been
necessary for both projects thanks to the satisfactory correlation between in-field and predicted
chloride profiles.
By using other input parameters, theoretically determined but non-justified by field
experimental data, predictions would have been significantly different. This is illustrated in the
following table as far as chloride diffusion coefficient would have been considered constant or
continuously decreasing toward time and with lower or higher chloride critical contents.
Table 8 – cover values for a 120 year design life depending on predictive model input
parameters Threshold
free Cl (%)
Vasco de Gama Rion-Antirion
DRCM (m²/s)
2.10-12
2.10-12
e-0.0527t
, and
0.1 10-12
m2/s for t
> 60 months
2.10-12
e-0.0527t
1.10-12
1.10-12
t-0.215
, and
0.35 10-12
m2/s
for t > 120
months
1.10-12
t-0.215
0.2 219 mm 68 mm 56 mm 146 mm 88 mm 78 mm
0.4 179 mm 54 mm 44 mm 119 mm 72 mm 63 mm
0.6 157 mm 47 mm 38 mm 104 mm 63 mm 55 mm
6. CONCLUSION
The durability studies carried out for these two major projects have allowed gathering numerous
results regarding concrete behavior in marine environment. These databases have been used to
improve chloride profiles prediction for long term service life assessment and identify key input
data. Many parameters (materials quality consistency, concrete production, placing,
reinforcements cover control, curing) are involved in concrete overall durability and it is then
compulsory to keep under control during project construction these parameters through a
relevant QA/QC system. The proposed approach, initiated 15 years ago, is based on a physical
model and updates only deal with limited major input data without adjusting additional
empirical parameters for better fitting. It is not relying on a full probabilistic approach finalized
during the design stages of these two projects. However, even with the fruitful feed-back
mentioned above, it appears that the definition of predictive model’s input parameters and their
8
associated variability, which have been justified as relevant for a dedicated project, remains an
issue, and that a better understanding of the influence of key input parameters are still missing
prior to use a full-probabilistic approach for design life assessment. In particular, two major
influencing parameters, which cannot be easily determined during project’s design stage, are the
chloride diffusion evolution law and the critical chloride threshold value corresponding to steel
depassivation potentially allowing corrosion process. Further research is still needed for a better
justification of these parameters.
REFERENCES
[1] O. Houdusse, H. Hornain, G. Martinet, 2000,
“Prediction of Long-term durability of Vasco Da Gama bridge in Lisbon”, 5th
CANMET/ACI International Conference on Durability of Concrete, Barcelona.
[2] F. Cussigh, C. Carde, P. Papanikolas, A. Stathopoulos-Vlamis, 2010,
“Rion-Antirion bridge project – concrete durability towards corrosion risk”, 3rd fib
International Congress, Washington.
[3] G. Martinet, L. Linger, 2005,
“Pont Vasco de Gama à Lisbonne- Bilan de 10 ans de démarche durabilité”, GC’2005,
Paris