rules of origin (roo) are essential part of trade ... - core of a grant from the world trade...
TRANSCRIPT
econstor www.econstor.eu
Der Open-Access-Publikationsserver der ZBW – Leibniz-Informationszentrum WirtschaftThe Open Access Publication Server of the ZBW – Leibniz Information Centre for Economics
Standard-Nutzungsbedingungen:
Die Dokumente auf EconStor dürfen zu eigenen wissenschaftlichenZwecken und zum Privatgebrauch gespeichert und kopiert werden.
Sie dürfen die Dokumente nicht für öffentliche oder kommerzielleZwecke vervielfältigen, öffentlich ausstellen, öffentlich zugänglichmachen, vertreiben oder anderweitig nutzen.
Sofern die Verfasser die Dokumente unter Open-Content-Lizenzen(insbesondere CC-Lizenzen) zur Verfügung gestellt haben sollten,gelten abweichend von diesen Nutzungsbedingungen die in der dortgenannten Lizenz gewährten Nutzungsrechte.
Terms of use:
Documents in EconStor may be saved and copied for yourpersonal and scholarly purposes.
You are not to copy documents for public or commercialpurposes, to exhibit the documents publicly, to make thempublicly available on the internet, or to distribute or otherwiseuse the documents in public.
If the documents have been made available under an OpenContent Licence (especially Creative Commons Licences), youmay exercise further usage rights as specified in the indicatedlicence.
zbw Leibniz-Informationszentrum WirtschaftLeibniz Information Centre for Economics
Nag, Biswajit; De, Debdeep
Working Paper
Rules of origin and development of regionalproduction network in Asia: Case studies of selectedindustries
Asia-Pacific Research and Training Network on Trade Working Paper Series, No. 101
Provided in Cooperation with:Asia-Pacific Research and Training Network on Trade (ARTNeT),Bangkok
Suggested Citation: Nag, Biswajit; De, Debdeep (2011) : Rules of origin and development ofregional production network in Asia: Case studies of selected industries, Asia-Pacific Researchand Training Network on Trade Working Paper Series, No. 101
This Version is available at:http://hdl.handle.net/10419/64256
Asia-Pacific Research and Training Network on Trade Working Paper Series, No. 101, May 2011
RRuulleess ooff oorriiggiinn aanndd ddeevveellooppmmeenntt ooff rreeggiioonnaall pprroodduuccttiioonn nneettwwoorrkk iinn AAssiiaa:: ccaassee ssttuuddiieess ooff sseelleecctteedd
iinndduussttrriieess
by
Biswajit Nag* Debdeep De**
* Biswajit Nag is Associate Professor at Indian Institute of Foreign Trade, New Delhi, India. ** Debdeep De is Lecturer at Jaypee Business School, Jaypee Institute of Information Technology, Noida, India. This paper was prepared as part of the ARTNeT initiative and was carried out with the aid of a grant from the World Trade Organization. The technical support of the United Nations Economic and Social Commission for Asia and the Pacific is gratefully acknowledged. The opinion figures and estimates are the responsibility of the author and should not be considered as reflecting the views or carrying the approval of the United Nations, ARTNeT, or Institute for Policy Research and Development. The authors are thankful for the valuable input and comments provided by Jeremy Tyler Harris, Trade Policy Consultant, Inter-American Development Bank and Mia Mikic, Economic Affairs Officer, Trade Policy Section, Trade and Investment Division, ESCAP. Any remaining errors are the responsibility of the authors, who can be contacted at [email protected] and [email protected]
The Asia‐Pacific Research and Training Network on Trade (ARTNeT) is aimed at building regional trade policy and facilitation research capacity in developing countries. The ARTNeT Working Paper Series disseminates the findings of work in progress to encourage the exchange of ideas about trade issues. An objective of the series is to get the findings out quickly, even if the presentations are less than fully polished. ARTNeT working papers are available online at www.artnetontrade.org. All material in the working papers may be freely quoted or reprinted, but acknowledgment is requested, together with a copy of the publication containing the quotation or reprint. The use of the working papers for any commercial purpose, including resale, is prohibited.
Executive Summary
Rules of Origin (RoO) are essential part of trade rules that become very important in the context of increasing globalisation of production process. Most industrial goods today incorporate inputs from a wide variety of countries (e.g. automobiles, electronic goods etc) and when traded it becomes important to determine their country of origin as tariffs depend on country of origin. International production networks (IPN) promote this new pattern of trade, such that goods travel across several locations before reaching final consumers. Consequently, trade in such products can grow without a commensurate increase in their final consumption as production networks are extended across space. Thus in short, RoO define nationality of traded products. Recognising the importance of the IPN, Asia is emerging as a global hub with rising regional trading agreements acting as facilitators in the process. Rules of origin in trade agreements (Free Trade Agreements or Preferential Trade Agreements) acts as a crucial factor in the case of fragmented trade compared with trading in conventional final products. Since value added at each stage of production is normally relatively little, this kind of trade presumably is more sensitive to trade costs and delays arising from rules of origin compliance. In such arrangements RoO try to ensure that tariff preferences are enjoyed only by member country imports and not outside imports.
The current study performs a critical investigation of RoO in selected regional trade agreements (RTAs) in the Asia Pacific region, and has made attempts to study linkages with intra-regional trade in some sectors such as textiles, electronics in the form of integrated circuits, and automobile components. The study addresses the provisions of RoO for select trading agreements, compares their restrictiveness and product specific features (if any) and makes attempts to connect them with changes in intra-industry trade indexes.
The main hypothesis of the study is that an RTA/FTA with relatively simpler RoO promotes intra-industry trade and thereby helps IPN to grow. As mentioned earlier, components are in general low value products and thus the reduction of barriers should increase trade in components, which accounts for a significant portion of total intra Asian trade. The study has been done mainly through secondary data analysis. RoO provisions of important regional agreements (such as AFTA, SAARC, Japan-Singapore, India-Thailand, ASEAN-China, etc) have been studied in details with respect to some thrust industries which includes automobiles, electronics, integrated circuits, etc.
The study reflects that simpler RoO with product specific rules can act as a catalyst in trade even if tariff rates are not so low. The analysis guides us to assess sector specific restrictiveness across the agreements for possible growth of IPN. It has also been noted through the regression analysis that a higher RoO restrictiveness index inhibits the positive growth of intra-industry trade. Policy makers will get an empirical evidence of developmental impact of these RoO through their potentiality in expanding IPN.
Contents
Executive Summary
1. Introduction...............................................................................................................1
Methodology and Data.............................................................................................. 2
2. The Relevance of RoO to Regional Development....................................................3
3. Empirical Assessment of RoOs ................................................................................6
4. RoO Provisions in Selected FTAs and BTAs:..........................................................8
5. Intra-Industry Trade Index and Results ..................................................................12
6. Import Growth and Tariff Reduction in the selected Sectors .................................15
7. Rules of origin, Trade Growth and the Potential for Regional Production Networks .................................................................................................................16
8. Conclusion ..............................................................................................................19
References....................................................................................................................27
List of Tables
Table 1: Restriction categories for preferential RoO………………………………….8
Table 2: RoO in Major Asia-Pacific BTAs and RTAs………………………………..9
Table 3: IIT for Select FTAs: Sector-wise Comparative Results……………………13
Table 4: Correlation between the Change in IIT index & RoO Restrictiveness Index………………………………………………………………..………14
Table 5: Regression Results………………………………………………………….14
Table 6: Growth Rates for Imports of Select Trade Blocs across Sectors…………...15
List of Figure
Figure 1: Restrictiveness in RoO…………………………………………………….12
Appendices
Appendix 1: Restrictiveness Index Calculation for RoOs in Select FTAs & BTAs………………………………………………………………...20
Appendix 2: Rationale for RoO Restrictiveness Index………………………………21
Appendix 3: Export Growth, IIT values, Change in the IIT values, RoO Index for select economies…………………………………………………...26
1. Introduction In any trade agreement, Rules of Origin (RoO) is indispensable as they define the conditions that a product must satisfy to be deemed as originating from the country seeking preferential access. The objective is to prevent trade deflection, whereby products from non-participating countries destined for the partner country’s market are redirected through free trade partners of the partner country to avoid payment of the partner country’s customs duties. However, there are several intricacies in RoO which restrict the flow of goods in the region and introduce new uncertainties in trade. The complexities surrounding rules of origin may be traced from two sources. One is the difficulty of ascertaining origin in a regime of increasingly fragmented production processes. Whenever there are multi stage production process involved, RoO is used to define the methods for ascertaining whether a product has undergone sufficient working or processing in the free trade partner to qualify for preferential access. The other reason behind the complex design of many RoO is the convenience in which these rules may be used to both accommodate and conceal protectionist intentions. By attaching multiple criteria for the satisfaction of origin, RoO may be another avenue to effectively exclude product groups from a country’s liberalization commitments.
The economic impact of preferential RoOs can be gauged in terms of the incentives they provide for producers to substitute higher-cost inputs from member economies for cheaper or better quality imported inputs from non-members in order to qualify for concessional entry. These costs can outweigh gains associated with more liberal trade relations between members of a preferential trade agreement (PTA). RoO can also adversely influence investment decisions and give rise to significant compliance and administrative costs for businesses and governments, respectively. The impact of RoO depends on a range of global and national factors. If economic costs are likely to rise, RoO may encourage trade diversion away from least-cost sources. This result depends on factors such as:
the margin between preferential tariff rates and Most-favour Nation (MFN) rates;
the overall stringency of the criteria for conferring origin; and the extent to which prescriptive RoO are used merely to limit the effects of
preferential tariffs to members of an agreement or to achieve industry policy objectives.
A nation’s trade policies depend on the country of origin determination for exported and imported goods. Determining the country of origin of traded products is thus an important issue. The Kyoto Convention (1973) prescribed three rules for determining origin: a specified percentage of value to be added locally in the exporting country; change in tariff classification of the final product from its imported intermediate inputs; and specific technical requirements. Countries use these rules in varying combinations and there is no universal set. The lack of harmonization of rules of origin is primarily due to the fact that the effects of a given rule will vary depending on the relative comparative advantages of the signatory countries in the production of relevant inputs. Imposing harmonized preferential RoO would only make sense if all countries had identical endowments. In reality this is not possible. RoO are applied to both preferential (used in preferential trading arrangements) and non-preferential trade (MFN trade).
1

In 2009, different regional co-operations like APEC, recognized Rules of Origin is a priority area promoting more business-friendliness1. Recent studies have revealed that costs associated with administering rules of origin comprise around 6 percent of the value of goods traded within NAFTA2, and as much as 25 percent of the value of goods traded within ASEAN3. These numbers suggest that preferential margins must at least be equivalent to the costs to positively influence trade flows. For example, in the APEC region, documents and procedures administering preferential rules of origin are as complex as the rules themselves as they are usually the outcome of a negotiated process. Studies have found out that trade in parts and components occupy a significant portion of the intra-regional trade in Asia. Most of the Asian countries are engaged through some kind of regional trade arrangement with each other which is governed by different types of RoO. The complex RoO is expected to harm the natural growth of trade in components. As components are mainly of low value-added products, a small decrease in tariff rates, relaxation of non-tariffs and other barriers including RoO will give a major boost to SMEs in the region.4
Against this backdrop, the current study performs a critical investigation of RoO in selected regional trade agreements (RTAs) in the Asia Pacific region, and has made attempts to study linkages with intra-regional trade in some sectors such as textiles, electronics in the form of integrated circuits, and automobile components. The study addresses the provisions of RoO for select trading agreements, compares their restrictiveness and product specific features (if any) and makes attempts to connect them with changes in intra-industry trade indexes.
Methodology and Data
Under the Kyoto Convention there are typically three tests which can be carried out to assess the rules of origin for a specific trading agreement, any one of these tests be required:
Change in tariff classification (CTC) test — a good is transformed if there is a change in tariff classification using the HS code;
Specified process test — a good is transformed if it has undergone specified manufacturing or processing operations which confer, or do not confer, origin of the country in which they were carried out.
Regional value content (RVC) test — a good is transformed if a threshold percentage value of locally or regionally produced inputs is reached in the exporting country.
1 Page 3 of 2009 APEC Secretariat Report on APEC Developments released in 22nd Marine Resource Conservation Working Group Meeting, Vancouver, Canada1-3 June 2009 2 Carrière, C. and J. de Melo, 2004. “Are Different Rules of Origin Equally Costly? Estimates from NAFTA”, CEPR Discussion Paper No. 4437. 3 Manchin, M. and A. O. Pelkmans-Balaoing, 2007. “Rules of Origin and the Web of East Asian Free Trade Agreements”. World Bank Policy Research Working Paper 4273 (July). 4 Nag Biswajit & Debdeep De, 2008, ‘Integration of small and medium-sized Enterprises in International Production Networks: The automotive industry in Asia’, published in Macao Regional Knowledge Hub, Working Papers, No. 12, December 2008 .
2
Following this, an index methodology has been adopted (as discussed in Section 3) specific to the trading agreements investigated in the study. The overall index score for a particular set of RoO reflects the number of restrictions that are applied and the relative importance of those restrictions. The higher the overall index, the more restrictive is the trading regime for the members of that trade agreement. Within each restriction category, a score is assigned to the particular category of origin determination. The score ranges from 0 (least restrictive) to 1 (most restrictive). Each category also receives a weighting that indicates the relative restrictiveness of that category on the aggregate merchandise trade and firms’ economic efficiency. Categories are differentiated with respect to primary, secondary and other criteria which include sector specific rules. For a particular RoO regime, the index value reflects the number of restrictions applied, the relative importance of each of those restrictions (the weight) and the restrictiveness of each variant (the score).
The main hypothesis of the study is that an RTA/FTA with relatively simpler RoO promotes intra-industry trade and thereby help international production network (IPN) to grow. As mentioned earlier, components are in general low value products and thus the reduction of barriers should increase trade in components, which accounts for a significant portion of total intra Asian trade.
The study was primarily carried out via secondary data analysis. RoO provisions from important regional agreements such as AFTA, SAFTA, Singapore-Japan, India-Thailand, China-ASEAN FTA were studied in detail. These agreements were chosen as they are the most active one in South and South East Asia. Some sectors such as electronics/integrated circuits, textiles, and auto components have been chosen to understand how intra-industry trade has changed over the time and what the corresponding dynamics of tariff reduction are in those sectors. An attempt has been made to link the restrictiveness of RoO with trade growth of these sectors. All agreements incorporate a ‘cumulative’ rule to accommodate the regional value addition in the production process though there is a variation in the additional capacity to cumulate diagonally or fully. The study has also looked into this aspect. These sectors are identified as they consist of a large share of the intra-industry trade in the region.
2. The Relevance of RoO to Regional Development The literature on RoO cites a few negative economic effects of RoO especially in the context of preferential trading arrangement (like FTAs). Firstly, they give incentives to producers to purchase intermediate goods from domestic sources, even if they are costlier than imported inputs, so that their final export product meets RoO requirements (of high local value contents) and thereby qualifies for preferential treatment under the FTA. Thus trade is diverted from low-cost non-member countries (countries not party to the FTA) to high-cost member countries (Krueger 1993). From an analytical point of view, the basic effect of the RoO is to raise the production costs of the product in order to meet the binding RoO (Krishna and Krueger 1995). To meet RoO requirements, producers of export products might have to change their production decisions regarding where to purchase inputs, locate production, market their products, etc. Consequently, the RoO affect producers’ cost structures, productivity and competitiveness. Restrictive preferential RoO may lead to investment diversion in the long run (Krishna 2005). They may motivate firms to
3

locate plants that produce intermediate goods within the territory of certain member countries to satisfy these rules despite the fact that those territories may not be the best locations from an economic point of view. Under some circumstances, they may serve as significant trade barriers. Even for relatively simple products like food products, substantial transformation requirements in RoO (and restrictions on ownership of capital equipment, such as vessels in the case of fisheries) could prove to be effective mechanisms that prevent the actual utilization of trade preferences and lead to the erosion of benefits. This is because compliance with such rules affects decisions of firms with respect to sourcing and production. For this reason, RoO tend to increase the cost of production, such that when preferences are utilized, they are used to sell goods that cost more than they would were the rules not in place. Simple and flexible RoO help business and industries achieve economies of scale. Ideally, this should be beneficial to both multinationals and small and medium enterprises. International production networks promote new patterns of trade, such that goods travel across several locations before reaching final consumers, and the total value of trade recorded in such products exceeds their value added by a considerable margin. Consequently, trade in such products can grow without a commensurate increase in their final consumption as production networks are extended across space. The increased import content of exports has highlighted the importance of the rules applied to determine the origin of traded goods. Recognizing the importance of international production networks, some of the trading agreements encourage and promote their development. Asia is emerging as a global hub with rising trade in electronic goods like integrated circuits, textiles and automobiles and components. Rules of origin in trade agreements act as a crucial factor in the case of fragmented trade compared with trading in conventional final products. Since relatively little value is added at each stage of production, this kind of trade is presumably more sensitive to trade costs and delays arising from rules of origin compliance. Last is cumulation of origin, which implies that inputs from preferential trading partners can be used in the production of a final good without undermining the origin of the product.
The Kyoto Convention recognizes two basic criteria for determining origin: wholly obtained or produced, and substantial transformation5. The wholly obtained or produced category applies only to one PTA member, and asks whether the commodities and related products were entirely grown, harvested, or extracted from the soil in the territory of that member, or manufactured there from any such products. The rule of origin is met by not using any second-country components or materials. Most countries apply this strict and precise definition. The substantial transformation-criterion is more complex, involving four main components that can be used on their own or in combination with each other. The first component of the substantial transformation criterion is a change in tariff classification (CTC) between the manufactured good and the inputs from extra-PTA parties used in the production process. The CTC may require the product to alter its chapter (2 digits under the Harmonized System), heading (4 digits), subheading (6 digits) or item (8-10 digits)
5 The Revised Kyoto Convention is an international instrument adopted by the World Customs Organization (WCO) to standardize and harmonize customs policies and procedures around the world. The WCO adopted the original Convention in 1974. The revised version was adopted in June 1999.
4
numbers in the exporting PTA member. The second criterion is an exception attached to a particular CTC (ECTC). ECTC generally prohibit the use of non-originating materials from a certain subheading, heading, or chapter. The third criterion is value content (VC), which requires the product to acquire a certain minimum local value in the exporting country. The value content can be expressed in three main ways: as a minimum percentage of value that must have been added in the exporting country (domestic or regional value content, RVC); as the difference between the value of the final good and the costs of the imported inputs (import content, MC); or as the value of parts (VP), whereby originating status is granted to products meeting a minimum percentage of originating parts out of the total. The fourth RoO component is technical requirements, which require the product to undergo certain manufacturing operations in the originating country. Technical requirements (TECH) essentially prescribes or prohibits the use certain input(s) and/or the realization of certain process(es) in the production of the good. This is a particularly prominent feature in RoO governing textile products.
Besides product-specific RoO, RoO regimes vary by the types of general RoO they employ—including in the degree of de minimis, the use of the roll-up principle, and the type of cumulation chosen. First, most PTAs contain a de minimis rule, which allows for a specified maximum percentage of non-originating materials to be used without affecting origin status. Second, the absorption principle allows materials that have acquired origin status by meeting specific processing requirements to be considered originating when used as input in a subsequent transformation. That is, when allowed, non originating materials are not taken into account in the calculation of the value added in the subsequent transformation. Third, cumulation allows producers from one PTA member to use materials from another PTA member (or other members) without losing preferential status for the final product. There are three types of cumulation. Bilateral cumulation operates between two PTA partners and permits them to use products that originate in the other PTA partner as if they were their own when seeking to qualify for preferential treatment in that partner conferred by the PTA. All RoO regimes basically apply bilateral cumulation. Under diagonal cumulation, countries tied by the same set of preferential origin rules may use products that originate in any part of the common RoO zone as if they originated in the exporting country. This really means that where there is an agreement signed by more than two parties, materials originating in any party are cumulable. The only broad exception to this is the Pan-Euro Cumulation System (PECS) where the European Union (EU) has separate agreements with several countries, and permits cumulation among them conditional on their signing bilateral agreements with each other that specify the same RoO as do their agreements with the EU. Full cumulation extends diagonal cumulation. It provides that countries bound by the same RoO regime can use goods produced in any part of the common RoO zone even if these were not originating products: any and all processing done in the zone is calculated as if it had taken place in the final country of manufacture. As such, diagonal and full cumulation can notably expand the geographical and product coverage of a RoO regime.6
Whereas de minimis, roll-up, and cumulation allow for leniency in the 6 For bilateral cumulation, the use of partner country components is favored; for diagonal cumulation, all the beneficiary trading partners in the cumulation area are favored. Full cumulation is more liberal than diagonal cumulation in that it allows greater use of third-country materials. However, it is rarely allowed in RoO regimes.
5
application of RoO, there are three provisions that may have the opposite effect, namely increasing the stringency of RoO7. First, most PTAs contain a separate list indicating the operations that are in all circumstances considered insufficient to confer origin, such as preservation during transport and storage, as well as simple operations such as cleaning, sorting, painting, packaging, assembling, and marking and labeling. Second, many PTAs prohibit duty drawback—precluding the refunding of tariffs on non-originating inputs that are subsequently included in a final product that is exported to a PTA partner. Many developing countries employ drawback in order to attract investment and to encourage exports; however, drawback in the context of a PTA is viewed as providing a cost advantage to PTA-based producers who export their final goods over producers selling their final goods in the domestic market.8 The end of duty drawback entails an increase in the cost of non-originating components for PTA-based final goods producers in the country or countries that permitted drawback ex ante. Agreements between countries that had drawback provisions before the agreements generally do not prohibit drawback as part of the agreement. It is only the case in agreements where one or more parties do not have a drawback provision before the agreement that they seek to prohibit such a program as a condition for preferential access. As such, the end of drawback in the presence of cumulation may encourage intra-PTA producers to shift to suppliers in the cumulation area (WTO 2002). Third, a complex method of certifying the origin of goods can impose high administrative costs on exporters. The main certification methods are self certification by exporters, certification by the exporting country government or an industry umbrella group to which the government has delegated the task of issuing the certificate, and a combination of private self-certification and public governmental certification. The more numerous the bureaucratic hurdles and the higher the costs for an exporter to obtain an origin certificate, the lower the incentives to seek PTA-conferred preferential treatment. Countries with greater bureaucratic hassle may find it difficult to manage the cumulation system and thereby reduce the use of this incentive by traders.
3. Empirical Assessment of RoOs It is a general consensus that RoO should be less restrictive. The restrictiveness index shown in the Appendix clearly indicates that rules of origin have far reaching implications, as some FTAs are associated with rather high degrees of restrictiveness. Thus though the objective of rules of origin is to increase the trade flow, how much it has facilitated that objective may be drawn into question for each FTA, depending on the complexity of procedures and other trade distorting factors. Ideally, RoO should be as neutral as possible in their impacts on trade flows. (Scollay 2003) Simpler RoO will help promote regional trade and the international competitiveness of member states. This is also of particular relevance in compliance with and administration of trade and customs procedures. To minimize the potential for unproductive rent-seeking and corruption, a simple and transparent ROO is important. (ADB 2002)
7 Non-members of a cumulation area may view the cumulation system as introducing another layer of discrimination by virtue of its provision of incentives to member countries to outsource from within the cumulation zone at the expense of suppliers outside the zone. 8 Cadot, de Melo and Olarreaga (2001) show that duty drawback may have a protectionist bias by reducing the interest of producers in lobbying against protection of intermediate products.
6
The internationalization of production and accompanying technological change requires modifications in RoO, especially in product groups where technologies and production processes change rapidly. RoO should be flexible enough to accommodate these changes. Otherwise, they will cause unnecessary wastes of time and lost opportunities. On the other hand, there should be well-defined procedures or guiding principles for the introduction of amendments in the harmonized RoO. This is because the consequent uncertainty regarding RoO would increase burdens on negotiators from developing countries. (Harilal and Beena 2003) Additionally, cumulation provides a certain degree of flexibility among producers to source of their inputs. However it may also require the consideration and balancing of other national interests such as commitments in other arrangements, be they multilateral or preferential. For example, full cumulation is an important factor in the development of regional production networks. This provides for deeper integration and allows for more advanced countries to outsource labor-intensive production stages to low-wage partners. Coupled with simple RoO, full cumulation should make it easier for regionally-based firms to exploit economies of scale. (Brenton 2003). Finally, the treatment of duty drawback and of outward processing aside from free trade or preferential trade partners may also be considered. (Brenton 2003). Restrictive RoO can discourage exporters from taking advantage of tariff preferences provided by FTAs, undercutting the economic gains of FTAs which suggests there may be under utilization of FTA preferences. Two pioneering works on this subject are Estevadeordal (2003) and The Productivity Commission (PC, 2004). The PC provides a comprehensive index approach for measuring the stringency and restrictiveness of RoOs and improves on Estevadeordal’s index, which is too simple to use for empirical work. Both approaches are designed to calculate the degree of restrictiveness of RoOs, making the numerical comparison of FTA RoOs possible. The PC approach has a bottom-up structure, requiring an initial survey of detailed components of the RoO in the relevant appendix of a FTA, and aggregation of those into relevant upper categories. Each component is valued with weights for higher categories, and aggregated up to the top level for a single index number. The top level has three categories: primary criteria, supplementary criteria, and other RoO effects. Primary RoO criteria in most FTAs have two components: the wholly obtained criterion and the substantial transformation criterion. In order to mitigate the restrictiveness of the RoO, supplementary criteria such as Cumulation and De Minimis have been widely adopted. In particular, Singapore’s FTAs introduce outward processing to facilitate global outsourcing and the flow of intermediate goods across countries. If a product is ‘wholly obtained’ in the exporting country (such as agricultural commodities), origin will be granted without any further rules. If products are manufactured in the exporting country using only such ‘wholly obtained’ materials they will also get preferential treatment right away. But if imported materials from non-member countries are used in the manufacture of a product then there are two rules which must both be met to satisfy ‘origin.’ First, the value of the imported materials may not exceed 65 per cent of the f.o.b. value for the concerned product (for example, implying 35 per cent DVA9) Second, the product should be classified under a different H.S. level heading (4-digit) than that in which the
9 DVA: Domestic Value Added
7
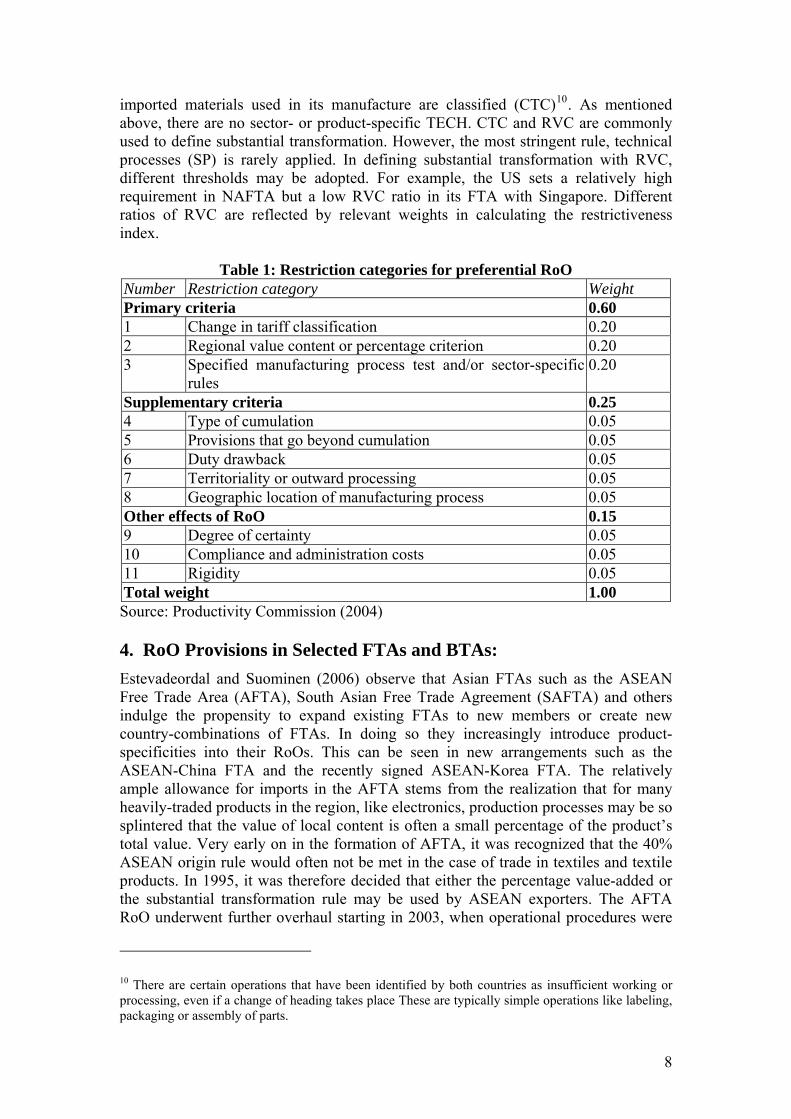
imported materials used in its manufacture are classified (CTC)10. As mentioned above, there are no sector- or product-specific TECH. CTC and RVC are commonly used to define substantial transformation. However, the most stringent rule, technical processes (SP) is rarely applied. In defining substantial transformation with RVC, different thresholds may be adopted. For example, the US sets a relatively high requirement in NAFTA but a low RVC ratio in its FTA with Singapore. Different ratios of RVC are reflected by relevant weights in calculating the restrictiveness index.
Table 1: Restriction categories for preferential RoO Number Restriction category Weight Primary criteria 0.60 1 Change in tariff classification 0.20 2 Regional value content or percentage criterion 0.20 3 Specified manufacturing process test and/or sector-specific
rules 0.20
Supplementary criteria 0.25 4 Type of cumulation 0.05 5 Provisions that go beyond cumulation 0.05 6 Duty drawback 0.05 7 Territoriality or outward processing 0.05 8 Geographic location of manufacturing process 0.05 Other effects of RoO 0.15 9 Degree of certainty 0.05 10 Compliance and administration costs 0.05 11 Rigidity 0.05 Total weight 1.00 Source: Productivity Commission (2004) 4. RoO Provisions in Selected FTAs and BTAs:
Estevadeordal and Suominen (2006) observe that Asian FTAs such as the ASEAN Free Trade Area (AFTA), South Asian Free Trade Agreement (SAFTA) and others indulge the propensity to expand existing FTAs to new members or create new country-combinations of FTAs. In doing so they increasingly introduce product-specificities into their RoOs. This can be seen in new arrangements such as the ASEAN-China FTA and the recently signed ASEAN-Korea FTA. The relatively ample allowance for imports in the AFTA stems from the realization that for many heavily-traded products in the region, like electronics, production processes may be so splintered that the value of local content is often a small percentage of the product’s total value. Very early on in the formation of AFTA, it was recognized that the 40% ASEAN origin rule would often not be met in the case of trade in textiles and textile products. In 1995, it was therefore decided that either the percentage value-added or the substantial transformation rule may be used by ASEAN exporters. The AFTA RoO underwent further overhaul starting in 2003, when operational procedures were
10 There are certain operations that have been identified by both countries as insufficient working or processing, even if a change of heading takes place These are typically simple operations like labeling, packaging or assembly of parts.
8
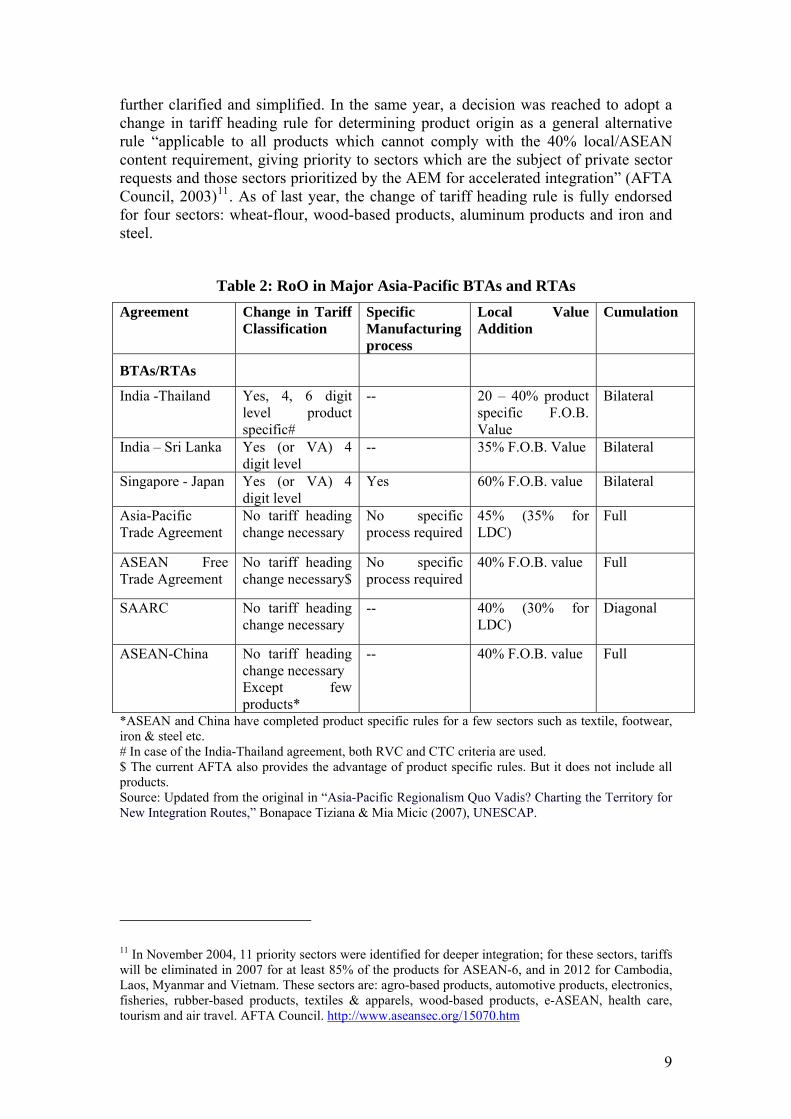
further clarified and simplified. In the same year, a decision was reached to adopt a change in tariff heading rule for determining product origin as a general alternative rule “applicable to all products which cannot comply with the 40% local/ASEAN content requirement, giving priority to sectors which are the subject of private sector requests and those sectors prioritized by the AEM for accelerated integration” (AFTA Council, 2003)11. As of last year, the change of tariff heading rule is fully endorsed for four sectors: wheat-flour, wood-based products, aluminum products and iron and steel.
Table 2: RoO in Major Asia-Pacific BTAs and RTAs
Agreement Change in Tariff Classification
Specific Manufacturing process
Local Value Addition
Cumulation
BTAs/RTAs
India -Thailand Yes, 4, 6 digit level product specific#
-- 20 – 40% product specific F.O.B. Value
Bilateral
India – Sri Lanka Yes (or VA) 4 digit level
-- 35% F.O.B. Value Bilateral
Singapore - Japan Yes (or VA) 4 digit level
Yes 60% F.O.B. value Bilateral
Asia-Pacific Trade Agreement
No tariff heading change necessary
No specific process required
45% (35% for LDC)
Full
ASEAN Free Trade Agreement
No tariff heading change necessary$
No specific process required
40% F.O.B. value Full
SAARC No tariff heading change necessary
-- 40% (30% for LDC)
Diagonal
ASEAN-China No tariff heading change necessary Except few products*
-- 40% F.O.B. value Full
*ASEAN and China have completed product specific rules for a few sectors such as textile, footwear, iron & steel etc. # In case of the India-Thailand agreement, both RVC and CTC criteria are used. $ The current AFTA also provides the advantage of product specific rules. But it does not include all products. Source: Updated from the original in “Asia-Pacific Regionalism Quo Vadis? Charting the Territory for New Integration Routes,” Bonapace Tiziana & Mia Micic (2007), UNESCAP.
11 In November 2004, 11 priority sectors were identified for deeper integration; for these sectors, tariffs will be eliminated in 2007 for at least 85% of the products for ASEAN-6, and in 2012 for Cambodia, Laos, Myanmar and Vietnam. These sectors are: agro-based products, automotive products, electronics, fisheries, rubber-based products, textiles & apparels, wood-based products, e-ASEAN, health care, tourism and air travel. AFTA Council. http://www.aseansec.org/15070.htm
9

China and ASEAN began talks on a free trade accord in early 2002 and signed a framework agreement in November, which contained general goals for the bilateral FTA between ASEAN and China. In the agreement, both parties agreed to work faster toward a free trade agreement on market access for commodities in 2004 which was implemented in July 2005. The agreement reduced bilateral tariffs, which should be down to zero for most products by 2010. According to Article 3 (4) of the ASEAN-China FTA framework agreement, the products which are subject to the tariff reduction or elimination program shall be categorized into two Tracks as follows: Normal Track and Sensitive Track. For products listed in the Normal Track, MFN tariff rates were gradually reduced or eliminated over the period from July 1, 2005 to 2012 for ASEAN 6 and China, and in the case of the new ASEAN Member States, from July 1, 2005 to 2018 with higher starting tariff rates and different staging. ASEAN 6 and China can not have more than 400 HS6 tariff lines, while the sensitive track items for new member countries can not exceed 500 items (HS6). The sensitive track items will be categorized into two groups: Sensitive List items and Highly Sensitive List items. A maximum 40% of sensitive track items may be listed as highly sensitive goods. Since the ASEAN-China FTA involves 11 countries and special considerations were made in determining tariff elimination concessions, the appendices of tariff elimination are quite complicated. However, small numbers of items, which are listed as highly sensitive, will have their tariffs reduced to not higher than 50% not later than January 1, 2015 for ASEAN 6 and China, and January 1, 2018 for the newer ASEAN member countries.
The ASEAN-China FTA adopts the same general value-added rule used in the AFTA: 40% local/regional content with full cumulation. The Agreement on Trade in Goods extends the liberalization commitments from the limited ‘Early-Harvest’ agricultural products (HS chapter 01 – 08), to the rest of the traded sectors in the normal inclusion list. As in the AFTA RoO, an alternative change of tariff heading criteria can be invoked for a number of products.6 In the case of ACTFA, the rule applies for 424 (HS6) textiles and textile products, 2 items of preserved fish, 6 items of wool, 22 of leather goods, 14 for fur skins and 4 item lines of footwear. It is only in 5 wool tariff items that the change of tariff heading is set as the exclusive rule12.
For Singapore FTAs, such as the one concluded with Japan (JSEPA), the degree of restrictiveness of the RoO largely reflects the sensitivities of Singapore’s partners. Agricultural products, textiles and apparel are characterized by particularly complex rules even though 384 agricultural items are excluded, constituting 90% of total Singapore exports to Japan. RoOs are product specific, relying mostly on the change of tariff heading rule13. For some products an alternative RVC rule is allowed, albeit at a high rate of 60%. In cases where RVC is an additional criterion to be satisfied, the content requirement is lower, at 40%. It is important to consider why this is the case, as it matters for the design and interpretation of the restrictiveness index more generally. When an RVC requirement is added to a CTC requirement, there is already
12 Attachment B of the ASEAN-China FTA Agreement (http://app.fta.gov.sg/data//fta/file/ACFTA_Annex3.pdf ) 13 Heading changes are needed for HS 01- 24, HS 38 (chemical products), HS 85 (machinery), while subheading or value content requirements apply for liquor and cordials. For the rest a RVC requirement of 60% with a combination of subheading changes is required. The yarn-forward rule applies for textile fabrics and articles (HS 59).
10
some value added inherent in the compliance with the CTC, but it is uncertain how much value that might be. Thus, the marginal cost to producers of complying with the RVC, having already met the CTC, is much lower than meeting the RVC independently. Alternatively we can say that the process of adding value in the production of a good is likely to result in some change of classification, and so the marginal cost of meeting the change specified in the rule, conditional on having met the RVC requirement, is lower. In general, one observes that when CTC and RVC criteria are combined, the level of each is lower (e.g. change of heading instead of change of chapter, and lower percentage requirement on originating content). For example, ASEAN uses CTC for a very small number of products, and not at all in its agreements with China and Korea. The EU’s regimes utilize a fairly even split between change of heading and non-CTC rules.
However, about half of the tariff subheadings in the agreement already have duty-free MFN status, so that in practice, RoOs’ effect is quite limited. De minimis is permitted, also varying across products. The Singaporean agreements allow the value of the materials exported from Singapore for further processing to be considered as originating, despite the processing that occurred outside Singapore. The value added by processing outside Singapore does not count as originating. Outward processing is really a provision for flexibility in Direct Shipment, not a form of extended cumulation. The SAFTA includes Change in tariff heading as a qualifying criterion, and the value content needs to be at least 40 per cent for India and Pakistan, 35 per cent for Sri Lanka and 30 per cent for least developed countries. Cumulation is diagonal. On September 1, 2004, Thailand and India entered into an FTA reducing MFN rates by 50% for 82 commodity items and lowering other rates by 75% by 2005 and 100% by 2006. These goods span a wide range, from tropical fruits and polycarbonates to other appliances like fans, refrigerators, televisions and automobile parts. The rules of origin for this EHP excepts those tropical fruits and seafood to which the wholly obtained standard applies, requiring in almost all cases that two standards-a change of 4-digit or 6-digit tariff codes and a local procurement of 40% or greater-be simultaneously satisfied. Thus India-Thailand RoO are stricter than AFTA rules, and goods cleared under AFTA’s CEPT rule cannot be used under the India-Thailand FTA. In this case domestic value addition in Thailand alone has to meet a minimum of 40%.
Results from index calculations show the variation in restrictiveness of origin rules across PTAs. They suggest that the restrictiveness of RoO is low to moderate. They also suggest that the most restrictive rules tend to be associated with regimes that adopt multiple criteria for determining origin, more restrictive variants of individual criteria and product specific rules, particularly in areas otherwise supported by higher tariffs. For example, in case of the Japan-Singapore agreement, the restrictiveness is quite high as indicated in Appendix 1. If we take a closer look we see that the primary criteria for determining the restrictiveness of the rules of origin is quite high compared to other agreements like SAARC or China-ASEAN. This has an overall impact on the restrictiveness index as observed in the figure below. AFTA and the ASEAN-China FTA have similar types of rules, but supplementary criteria are more stringent in case of the ASEAN-China FTA, making its overall restrictiveness slightly higher. In case of SAARC, the primary criteria are stringent but the supplementary criteria for calculating restrictiveness results in a lower figure. SAARC’s rules are simple and also provide differential treatment to LDCs and Sri Lanka.
11
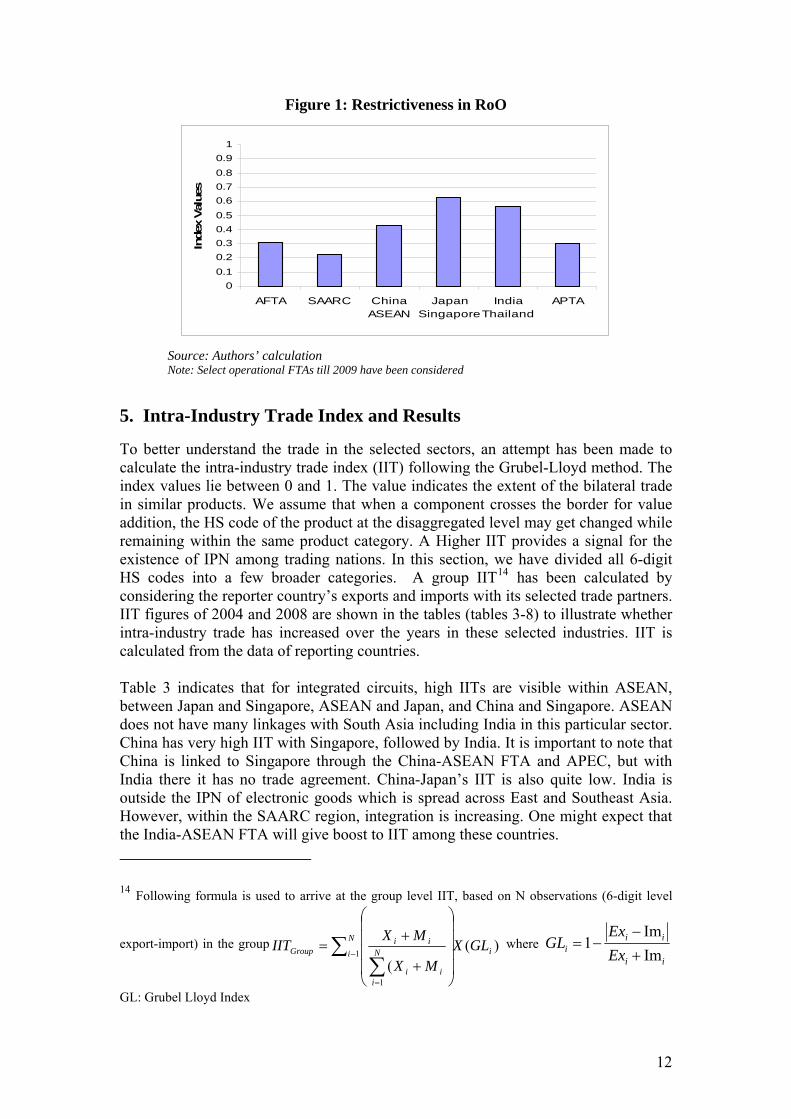
Figure 1: Restrictiveness in RoO
0
0.1
0.2
0.3
0.4
0.5
0.6
0.7
0.8
0.9
1
AFTA SAARC ChinaASEAN
JapanSingapore
IndiaThailand
APTA
Index
Val
ues
Source: Authors’ calculation Note: Select operational FTAs till 2009 have been considered
5. Intra-Industry Trade Index and Results
To better understand the trade in the selected sectors, an attempt has been made to calculate the intra-industry trade index (IIT) following the Grubel-Lloyd method. The index values lie between 0 and 1. The value indicates the extent of the bilateral trade in similar products. We assume that when a component crosses the border for value addition, the HS code of the product at the disaggregated level may get changed while remaining within the same product category. A Higher IIT provides a signal for the existence of IPN among trading nations. In this section, we have divided all 6-digit HS codes into a few broader categories. A group IIT14 has been calculated by considering the reporter country’s exports and imports with its selected trade partners. IIT figures of 2004 and 2008 are shown in the tables (tables 3-8) to illustrate whether intra-industry trade has increased over the years in these selected industries. IIT is calculated from the data of reporting countries. Table 3 indicates that for integrated circuits, high IITs are visible within ASEAN, between Japan and Singapore, ASEAN and Japan, and China and Singapore. ASEAN does not have many linkages with South Asia including India in this particular sector. China has very high IIT with Singapore, followed by India. It is important to note that China is linked to Singapore through the China-ASEAN FTA and APEC, but with India there it has no trade agreement. China-Japan’s IIT is also quite low. India is outside the IPN of electronic goods which is spread across East and Southeast Asia. However, within the SAARC region, integration is increasing. One might expect that the India-ASEAN FTA will give boost to IIT among these countries.
14 Following formula is used to arrive at the group level IIT, based on N observations (6-digit level
export-import) in the group )((
1
1
i
N
i
i
N
ii
iiGroup GLX
MX
MXIIT
where
ii
iii Ex
GLIm
1
Ex Im
GL: Grubel Lloyd Index
12
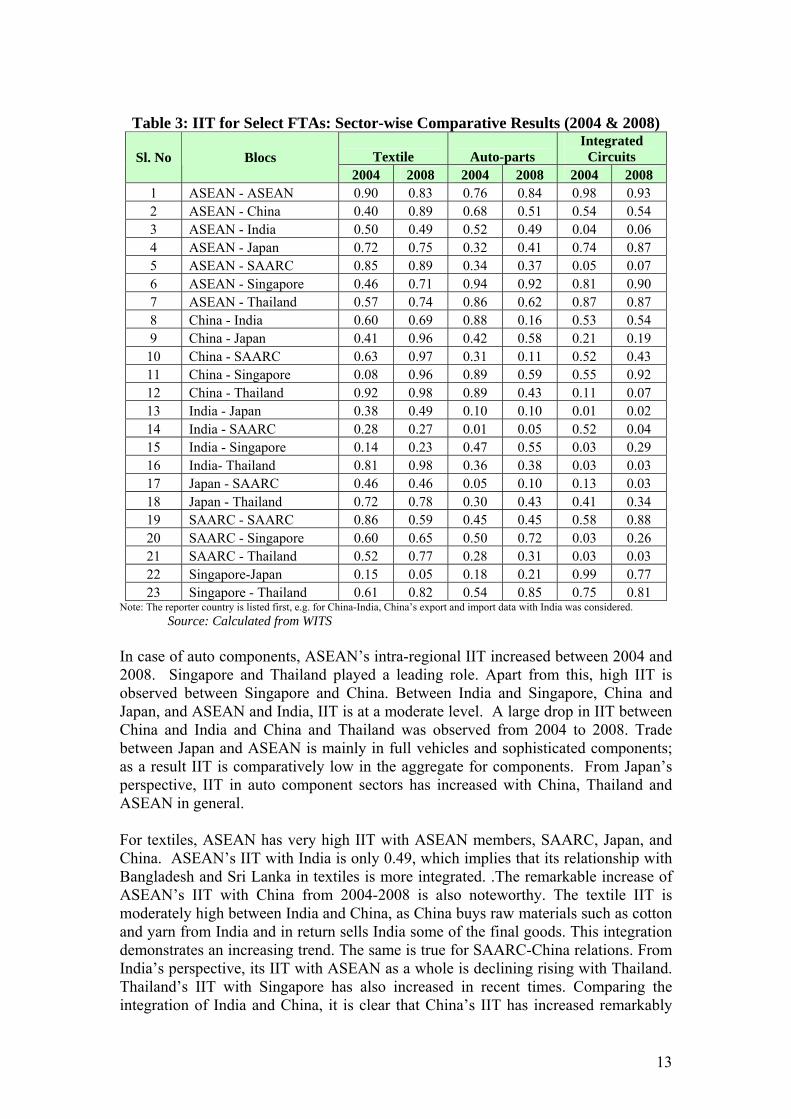
Table 3: IIT for Select FTAs: Sector-wise Comparative Results (2004 & 2008)
Textile Auto-parts Integrated
Circuits Sl. No Blocs 2004 2008 2004 2008 2004 2008
1 ASEAN - ASEAN 0.90 0.83 0.76 0.84 0.98 0.93 2 ASEAN - China 0.40 0.89 0.68 0.51 0.54 0.54 3 ASEAN - India 0.50 0.49 0.52 0.49 0.04 0.06 4 ASEAN - Japan 0.72 0.75 0.32 0.41 0.74 0.87 5 ASEAN - SAARC 0.85 0.89 0.34 0.37 0.05 0.07 6 ASEAN - Singapore 0.46 0.71 0.94 0.92 0.81 0.90 7 ASEAN - Thailand 0.57 0.74 0.86 0.62 0.87 0.87 8 China - India 0.60 0.69 0.88 0.16 0.53 0.54 9 China - Japan 0.41 0.96 0.42 0.58 0.21 0.19
10 China - SAARC 0.63 0.97 0.31 0.11 0.52 0.43 11 China - Singapore 0.08 0.96 0.89 0.59 0.55 0.92 12 China - Thailand 0.92 0.98 0.89 0.43 0.11 0.07 13 India - Japan 0.38 0.49 0.10 0.10 0.01 0.02 14 India - SAARC 0.28 0.27 0.01 0.05 0.52 0.04 15 India - Singapore 0.14 0.23 0.47 0.55 0.03 0.29 16 India- Thailand 0.81 0.98 0.36 0.38 0.03 0.03 17 Japan - SAARC 0.46 0.46 0.05 0.10 0.13 0.03 18 Japan - Thailand 0.72 0.78 0.30 0.43 0.41 0.34 19 SAARC - SAARC 0.86 0.59 0.45 0.45 0.58 0.88 20 SAARC - Singapore 0.60 0.65 0.50 0.72 0.03 0.26 21 SAARC - Thailand 0.52 0.77 0.28 0.31 0.03 0.03 22 Singapore-Japan 0.15 0.05 0.18 0.21 0.99 0.77 23 Singapore - Thailand 0.61 0.82 0.54 0.85 0.75 0.81
Note: The reporter country is listed first, e.g. for China-India, China’s export and import data with India was considered.
Source: Calculated from WITS In case of auto components, ASEAN’s intra-regional IIT increased between 2004 and 2008. Singapore and Thailand played a leading role. Apart from this, high IIT is observed between Singapore and China. Between India and Singapore, China and Japan, and ASEAN and India, IIT is at a moderate level. A large drop in IIT between China and India and China and Thailand was observed from 2004 to 2008. Trade between Japan and ASEAN is mainly in full vehicles and sophisticated components; as a result IIT is comparatively low in the aggregate for components. From Japan’s perspective, IIT in auto component sectors has increased with China, Thailand and ASEAN in general. For textiles, ASEAN has very high IIT with ASEAN members, SAARC, Japan, and China. ASEAN’s IIT with India is only 0.49, which implies that its relationship with Bangladesh and Sri Lanka in textiles is more integrated. .The remarkable increase of ASEAN’s IIT with China from 2004-2008 is also noteworthy. The textile IIT is moderately high between India and China, as China buys raw materials such as cotton and yarn from India and in return sells India some of the final goods. This integration demonstrates an increasing trend. The same is true for SAARC-China relations. From India’s perspective, its IIT with ASEAN as a whole is declining rising with Thailand. Thailand’s IIT with Singapore has also increased in recent times. Comparing the integration of India and China, it is clear that China’s IIT has increased remarkably
13

with most partners while India’s has not. SAARC in general has lower IITs with East and South East Asian countries other than China. Interestingly, within SAARC IIT declined between 2004 and 2008. A simple exercise shows that the RoO restrictiveness index is negatively correlated with changes in the IIT index for the selected three sectors. This implies that when the restrictiveness index is higher, IIT generally fell between 2004 and 2008, and vice versa.
Table 4: Correlation between the Change in IIT index & RoO Restrictiveness Index
Sectors Values Textile -0.16 Integrated Circuit -0.22 Auto Components -0.16
Note: Calculated from 15 restrictiveness indexes in Appendix 3
However, change in IIT depends more on the growth of exports in that sector, and the level of already existing IITs in 2004. A regression analysis reflects that in auto components and integrated circuits, RoO restrictiveness hampered the growth of IIT between 2004 and 2008. However, the values are not statistically significant. However, in the textile sector, intra-industry trade growth has surpassed the restrictiveness posed by RoO barriers mainly because of the huge growth in trade between ASEAN members and China. As a result, the regression coefficient of the restrictiveness index for the textile industry turns out to be positive. Hence, it may be argued that though prima facie RoO has an impact on intra industry trade, its degree depends on other variables as well. The regression results show that though the restrictiveness index produces expected results in two out of three cases, none of them are significant. The result is given in Table 5.
Table 5: Regression Results
Dependent Variable IIT value in 2008 IIT value in 2008 IIT value in 2008
Independent Variable Auto Components Integrated Circuits Textiles
Constant 0.313192* 0.074506 0.419822IIT value for 2004 0.711889* 0.929151* 0.524532
Export growth between 2004-08 -0.000502* 0.000263 -0.000465
RoO Restrictiveness Index -0.346489 -0.130149 0.132928R-Sq 0.70 0.71 0.22
Note: * these coefficients are significant at 95%. For data source, refer to Table Appendix 3
14
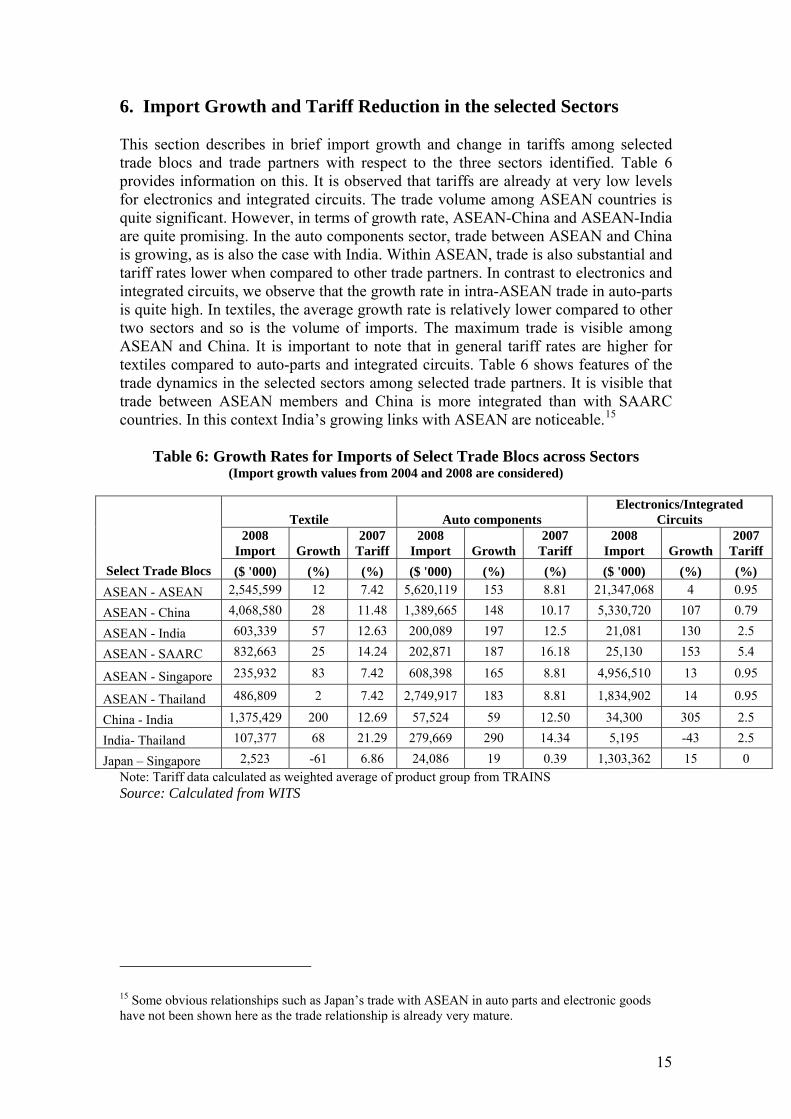
6. Import Growth and Tariff Reduction in the selected Sectors This section describes in brief import growth and change in tariffs among selected trade blocs and trade partners with respect to the three sectors identified. Table 6 provides information on this. It is observed that tariffs are already at very low levels for electronics and integrated circuits. The trade volume among ASEAN countries is quite significant. However, in terms of growth rate, ASEAN-China and ASEAN-India are quite promising. In the auto components sector, trade between ASEAN and China is growing, as is also the case with India. Within ASEAN, trade is also substantial and tariff rates lower when compared to other trade partners. In contrast to electronics and integrated circuits, we observe that the growth rate in intra-ASEAN trade in auto-parts is quite high. In textiles, the average growth rate is relatively lower compared to other two sectors and so is the volume of imports. The maximum trade is visible among ASEAN and China. It is important to note that in general tariff rates are higher for textiles compared to auto-parts and integrated circuits. Table 6 shows features of the trade dynamics in the selected sectors among selected trade partners. It is visible that trade between ASEAN members and China is more integrated than with SAARC countries. In this context India’s growing links with ASEAN are noticeable.15
Table 6: Growth Rates for Imports of Select Trade Blocs across Sectors (Import growth values from 2004 and 2008 are considered)
Textile Auto components Electronics/Integrated
Circuits 2008
Import Growth 2007
Tariff 2008
Import Growth 2007
Tariff 2008
Import Growth 2007
Tariff
Select Trade Blocs ($ '000) (%) (%) ($ '000) (%) (%) ($ '000) (%) (%)
ASEAN - ASEAN 2,545,599 12 7.42 5,620,119 153 8.81 21,347,068 4 0.95
ASEAN - China 4,068,580 28 11.48 1,389,665 148 10.17 5,330,720 107 0.79
ASEAN - India 603,339 57 12.63 200,089 197 12.5 21,081 130 2.5
ASEAN - SAARC 832,663 25 14.24 202,871 187 16.18 25,130 153 5.4
ASEAN - Singapore 235,932 83 7.42 608,398 165 8.81 4,956,510 13 0.95
ASEAN - Thailand 486,809 2 7.42 2,749,917 183 8.81 1,834,902 14 0.95
China - India 1,375,429 200 12.69 57,524 59 12.50 34,300 305 2.5
India- Thailand 107,377 68 21.29 279,669 290 14.34 5,195 -43 2.5
Japan – Singapore 2,523 -61 6.86 24,086 19 0.39 1,303,362 15 0 Note: Tariff data calculated as weighted average of product group from TRAINS Source: Calculated from WITS
15 Some obvious relationships such as Japan’s trade with ASEAN in auto parts and electronic goods have not been shown here as the trade relationship is already very mature.
15
7. Rules of origin, Trade Growth and the Potential for Regional Production Networks With the fragmentation of world trade it is very difficult to ascertain sources of goods as there is no single correct definition of origin. (La Nasa 1995) This being so, apart from the harmonization efforts of the WTO, several initiatives have been taken by different regional groupings if only to agree on a system beneficial to all. These RTAs and FTAs are expected to improve trade creation, reducing trade distortion. Sometimes, liberalization commitments in RTAs and FTAs go beyond WTO commitments in certain areas. The objective obviously remains unfulfilled in others:
(a) The RoO should be simple but precise, transparent and to the extent possible, predictable and stable.
(b) RoO should be designed to have the least trade distorting impact and should not become a disguised non-tariff barrier to trade.
(c) As much as possible, the rules should be consistent across products and across agreements. The greater the inconsistencies, the greater the complexity of the system of ROO both for companies and for officials administering the various trade schemes. (Brenton, 2003). However, consistency of rules across products and agreements would make the analysis easier and would increase transparency for those not familiar with production processes and the availability of cost-competitive materials within a given cumulation zone. This being said, imposed harmonization would likely have unintended and undesirable consequences. A harmonized RVC requirement would leave producers exposed to fluctuations in international commodity prices and exchange rates, and a harmonized CTC requirement would not account for the fact that the Harmonized System is not, and never has been, designed to be used for definition of rules of origin. A change of heading requirement has a very different implications for cost structures in the production of live animals (Chapter 01) than it does for shirts (chapters 61-62), refrigerators (chapter 84), or automobiles (Chapter 87). Imposing artificial simplicity on a complex system will not work. Most of these propositions are actually the same as the basic principles enunciated in the WTO RoO. However, in practice, a country will tend to suit its FTA to serve the different purposes it might have in dealing with its FTA partners. Negotiations themselves are mainly politically motivated and so the coverage of each trade agreement is expected to be different as well as their governing rules. As much as there is the need for simplicity and flexibility, the efficacy of these rules against rent-seekers should not be compromised. In reality, it has been observed that the burden of stricter RoO affects large, small and medium sized firms as well as firms from low-income countries, as they are unable to satisfy all the clauses laid down by the laws. Recent study by Kawai and Wignaraja at the ADBI found that large multinationals report more difficulty with RoO than smaller firms in surveys. Larger firms have more negative perceptions of multiple RoOs than SMEs, probably because large firms tend to export to multiple markets and are more likely to complain about issues stemming from multiple RoOs. In contrast, smaller firms tend to export to single markets. This makes sense in that larger firms should tend to trade large numbers of products and have more complicated and longer supply chains. However, as a counter argument we should mention that there may be cases where SMEs are more
16
hurt since they do not supply to many players and are more directly affected by RoO, than MNCs. Also, in a competitive world, SMEs do business on small margins and low volume. The stricter value addition criteria of RoO or CTH thus definitely affect SMEs. In this section we juxtapose trade growth in the identified sectors with changes in IIT, tariff liberalization and restrictiveness of respective RoO. By doing so, we seek to gauge the probable role of RoO in promoting international production networks in the region. As mentioned earlier, trade in components, parts and semi-finished goods comprises a major portion of intra-regional trade in Asia-Pacific. As components are mostly of low value products, simplification of RoO would promote growth of the trade in components among trade partners.
Integrated Circuits IIT figures for integrated circuits are quite impressive within ASEAN. Apart from this, it is also high between Singapore and Japan but declined during the period 2004-08. It increased for ASEAN-Japan and China-Singapore. IIT is at a moderate level in case of ASEAN-China and China-India, and is at very low level for ASEAN-India, India-Japan, and ASEAN-SAARC.
Correspondingly, we have noticed that restrictiveness is quite low for AFTA compared to other important agreements such as the ASEAN-China FTA or the Japan-Singapore FTA (JSFTA). Under AFTA some electronic products fall under product specific rules and thereby take advantage of the situation. For electronic goods, change of tariff heading is allowed at the six digit level. Trade in these goods is promoted via this route despite having lower value addition. On the contrary, JSFTA is quite stringent as the value addition criteria is quite high (60%) and change of tariff heading is allowed only at the 4 digit level. Moreover, supplementary criteria are more prohibitive in comparison to ASEAN, as there are conditions beyond cumulation. On the other hand, the ASEAN-China FTA started only with an Early Harvest Scheme covering agricultural goods. Later on, RoO which primarily used AFTA type regulations were also adopted. However, its product specific rules in terms of CTH are limited to only few sectors which do not include electronic goods. The India-Thailand Bilateral agreement is operational for only 82 Early Harvest scheme products. Its RoO are quite stringent as products must clear both RVC and CTH parameters. Hence, the agreement has not been used extensively for electronic goods. The trade scenario shows that the highest amount of intra-regional imports of integrated circuits occurred within ASEAN, followed by ASEAN-China and Japan-Singapore. The key issue is that the tariff rate is zero for integrated circuits imported in Japan from Singapore, where as it is 0.95% within ASEAN. Hence, we can conclude that within ASEAN, favorable RoO promote intra-regional trade, while for Japan-Singapore, trade is more influenced by the zero tariff rate as the RoO is quite restrictive. Between ASEAN and China, trade is promoted by the combined effect of low tariffs and relatively less restrictive RoO. Only the lack of a CTH rule for integrated circuits is hampering deeper trade relations at the B2B level in this sector. South Asia in general and India in particular is still outside of this production network.
17
Auto Components In the auto-components sector, trade is substantially governed by the tariff rates. Most of the selected countries still have higher tariff rates, except for countries like Japan. ASEAN and China maintain moderate tariff levels. India and Thailand have relatively higher tariffs. Analyzing IIT figures, we found that intra-industry trade was promoted within the ASEAN region. However, the same has declined for Thailand which implies that intra-industry trade increased among other ASEAN members significantly in recent times. From Thailand’s point of view, its integration with Singapore increased compared to other ASEAN members. ASEAN’s IIT with China declined, while the IIT between India and Thailand was flat. China’s integration in the auto-component sector with Japan and Singapore, and other partners remained moderate. It dropped substantially for India, Singapore, and Thailand. Consequently, we can conclude that despite lower tariff rates between Japan and Singapore, overall trade and IIT in auto components did not increase between these countries, perhaps due to stringent RoO. Low-value products could not reach the level of 60% value addition or CTH for the 4-digit classification. On the other hand, trade is growing fast among ASEAN countries despite relatively higher tariff rates (see Table 4). One of the reasons for this could be simpler and less restrictive RoO. Auto-components enjoy the benefit of the CTH rule at the six digit level. However, despite having similar RVC, in ASEAN-China RoO overall IIT declined due to higher tariff rates and the absence of product specific CTH. These two factors can act as severe barriers to low value auto components. India’s integration with ASEAN and China is still at low levels. As with Thailand, only Early Harvest products are under operation. With ASEAN, the FTA has just become operational, and with China there is no trade agreement meaning tariffs remain high.16 Textiles For textiles, tariff rates are relatively higher compared to the sectors mentioned above. Trade between ASEAN and China is quite significant, as is also the case between China and India and within ASEAN. Japan and Singapore do not have a comparative advantage in these products and hence trade volume between them is quite low. Intra-industry trade is here mainly promoted by the complementarity of raw materials, differences in skills and product design, and economies of scale. This is due to the fact that wage costs in most of these countries are quite low except in countries like Japan and Singapore. High IIT was observed between ASEAN and SAARC, ASEAN and China, and India and Thailand. Interestingly, all blocs studied showed higher restrictiveness indexes. This implies that despite higher RoO restrictiveness, IITs and intra-industry trade among these countries still had higher values. On this basis we can argue that benefits derived from complementarity in resources and economies of production outweigh the negative impacts of restrictive RoO in the textile sector. Also
16 See more in “Fighting Irrelevance: Fighting irrelevance: The role of regional trade agreements in international production networks” (A Study of ARTNeT) ESCAP 2011
18
19
both AFTA and ASEAN-China have similar kinds of product specific rules for textiles. In sum, the effects of trade promotion are highly visible within ASEAN and between ASEAN and China, which is reflected in Table 4.
8. Conclusion
In summary, we can say that in the integrated circuits sector, RoO along with very low tariff levels play an important role in the flourishing intra-industry trade, particularly within the ASEAN region. Favorable RoO promoted IPN growth within ASEAN, but in case of Japan and Singapore, the free trade regime characterized by lower tariff rates was more influential. Between ASEAN and China a lack of CTH played a negative role. In auto-parts, ASEAN enjoyed the benefit of less restrictive RoO in terms of RVC and CTH at the 6-digit level, compared to Japan-Singapore which has higher RVC and CTH at the 4-digit level. For ASEAN-China, higher tariff rates and the lack of CTH provisions created a barrier for low value auto components. In the textile sector, complementarity in resources and economies of production worked as a stronger variable to promote intra-industry trade among countries in which RoO restrictiveness is higher, such as ASEAN-China and India-Thailand. IIT was high even in blocs where there are no formal trade agreements, such as between China and India, ASEAN and SAARC, and China and SAARC. However, both AFTA and ASEAN-China have similar kinds of product specific CTH rules for textiles, which are quite less restrictive. The textile trade is promoted within ASEAN and between ASEAN and China through a business friendly RoO regime. We conclude this study by highlighting the fact that RoO does play a significant role in promoting IPN. Apart from the RVC criteria, CTH criteria at the 6-digit level is more helpful in promoting trade in low value components. So although tariff reduction is the most important tool for making a trade agreement work efficiently, simpler RoO with product specific rules can act as a catalyst even if tariff rates are not so low. We also note through the regression analysis that a higher RoO restrictiveness index inhibits the positive growth of intra-industry trade. RoO have a significant impact on strategic planning, since the importance of IPNs is well-recognized and some agreements have been made to encourage and promote their development. The ASEAN Industrial Cooperation Scheme (AICO) encourages technology investments in the ASEAN area by reducing tariffs on goods produced by companies partially owned by ASEAN citizens (30% equity), incorporated and operating in member countries and cooperating or sharing resources (such as sharing technology or consolidating raw materials purchases) with another company in the region. (ADB 2002). RoO should be supportive of the expansion and development of these initiatives. Favorable RoO should be able to exploit the sectoral exceptions in these arrangements, maximizing investment leading to more trade and development.

Appendix 1: Restrictiveness Index Calculation for RoOs in Select FTAs & BTAs Restriction category
AFTA SAARC
China ASEAN
Japan Singapore
India Thailand APTA
PRIMARY CRITERIA Change in tariff classification 0 0 0 0.1 0.1 0 Regional value content or percentage criterion Percentage of originating material 0.04 0.04 0.04 0.08 0.02 0.04 Formulation of regional value content 0.006 0.012 0.006 0.006 0.006 0.006 Elements of production costs for domestic content 0.001 0.006 0 0 0 0.001 Treatment of DMRM 0.01 0 0.02 0.02 0.02 0.01 Methods of qualifying production costs 0.005 0.02 0.005 0.005 0.005 0.005 Valuation of non-originating material 0.015 0.015 0.01 0.01 0.01 0.015 Specified manufacturing process test 0 0 0 0.05 0.05 0 Sector-specific rules 0 0 0 0 0 0 Subtotal 0.077 0.093 0.081 0.271 0.211 0.077 SUPPLEMENTARY CRITERIA Type of cumulation 0.03 0.03 0.02 0.03 0.03 0.02 Provisions that go beyond cumulation 0.005 0.005 0.05 0.05 0.05 0.005 Duty drawback 0 0 0.05 0.05 0.05 0 Territoriality or outward processing 0.05 0 0.05 0.05 0.05 0.05 Geographic location of manufacturing process 0.025 0 0.05 0.05 0.05 0.025 Subtotal 0.11 0.035 0.22 0.23 0.23 0.1 Other Effects of RoO Degree of certainty 0.05 0.05 0.05 0.05 0.05 0.05 Compliance and administration costs 0.025 0.025 0.025 0.025 0.025 0.025 Rigidity 0.05 0.025 0.05 0.05 0.05 0.05 Subtotal 0.125 0.1 0.125 0.125 0.125 0.125 GRAND TOTAL 0.312 0.228 0.426 0.626 0.566 0.302
Source: Author’s Calculation based on different Agreements
20

Appendix 2: Rationale for RoO Restrictiveness Index
Weight Score Restriction category Rationale for provision
PRIMARY CRITERIA 0.2 Change in tariff classification
0 Tariff item (HS 8-digit)
0.2 Sub-heading (HS 6-digit)
0.5 Heading (HS 4-digit)
1 Chapter (HS 2-digit)
The CTC method can be applied at different levels in the HS. A change in tariff classification at the broad (2-digit) chapter level provides the highest hurdle for conferring origin and is therefore given the highest restrictiveness score of one. Progressively lower scores are assigned to the heading (4-digit), sub-heading (6-digit) and tariff item (8-digit) levels.
0.1 Regional value content or percentage criterion
Percentage of originating material 17
0 Less than 25%
0.2 26-35%
0.4 36-45%
0.6 46-55%
0.8 56-65%
1 More than 65%
The pivotal sub-criterion for the application of the DVA method is the threshold percentage adopted, expressed as either a minimum percentage of value that must have been added in the PTA region, or a maximum percentage of import value from non-member economies allowed. This sub-category takes the highest weight of 0.1. The remaining five sub-criteria are given an equal weight of 0.02 each. The rule used in assessing restrictiveness in the percentage criterion is unambiguous. The higher the percentage of originating material required, the higher the restrictiveness score.
0.02 Formulation of regional value content
0 Any method
0.3 Import content
0.6 Domestic content
1 Value of parts
The percentage of originating and non-originating materials can be formulated in three different ways: value of parts, domestic content and import content. Wherever the value of parts test is used, it is assessed as the most restrictive of the alternatives because it focuses on a very small set of either local or non-local material inputs. Formulation of the percentage criterion based on domestic content is considered to be more restrictive than a specification based on the imported content because it is considered to facilitate manipulation and to add to compliance and administration costs.
0.02 Elements of production costs for domestic content
0 All costs included
0.1 Taxes and duties paid on materials excluded
0.2 Indirect labor also excluded
Typically, the narrower the range of qualifying expenditures relative to total costs, the harder it is for a firm to reach the origin threshold, meaning the origin rule is more restrictive. Accordingly, RoO which count
fewer expenditure items as qualifying are considered to be more restrictive and are assigned a higher score.
17 Agreements applying regional content thresholds to confer origin can use different valuation methods. To improve comparability of thresholds in alternate agreements, the thresholds have been normalised to a factory cost basis.
21

0.3 Other capital costs also excluded
0.4 Inner containers also excluded
0.5 Other packaging expenses also excluded
0.7 Selling, general and administrative expenses also excluded
1 Profits also excluded
0.02 Treatment of determined manufactured raw materials
0 Imports from all zero tariff line items to member economies are treated as eligible expenditures
0.5 Imports from selected zero tariff line items to member economies are treated as eligible expenditures
1 No provision for allowing DMRM in calculating domestic content
Determined manufactured raw materials (DMRM) provisions allow certain materials of third country origin that are not manufactured in either partner economy to be defined as ‘manufactured raw materials’ and treated as qualifying expenditures for the determination of origin. The inclusion of DMRM provisions in a trade agreement tends to have a liberalizing effect. Thus, origin rules without such provisions are treated as more restrictive than rules that allow the inclusion of certain materials from third countries.
0.02 Methods of qualifying production costs
0 Any method
0.25 Transaction value method
0.5 Net cost method
1 Factory cost method
Of the DVA methods applied, the factory cost method is typically considered to have the narrowest cost base (since it focuses on the manufacturing aspect of the production and distribution chain), affording the least flexibility to businesses in making their input choices. It is also administratively more complicated. This method is treated as most restrictive. In contrast, the transaction value method is typically considered to have the widest cost base (since it focuses on transaction values, typically including transport and distribution costs), affording the most flexibility to firms in making their input choices.
0.02 Valuation of non-originating materials
0 Not relevant or unspecified
0.25 Free into store (fis)
0.5 Cost, insurance and freight (cif)
0.75 Free on board (fob)
1 Ex-factory cost
An ‘ex-factory’ cost basis is considered to be the narrowest valuation basis and origin rules incorporating this provision are treated as the most restrictive on this account. Less restrictive valuation bases, in order of restrictiveness, include free on board at port of embarkation (fob), cost insurance and freight at port of unloading (cif) and free into store (fis).
0.1 Type of specified manufacturing process test applied
0 No test
0.5 Positive test for specific process
The inclusion of specific process tests adds to the restrictiveness of origin rules. Such tests typically are specified in terms of particular industrial processes and ways of working, limiting the prospect for
22
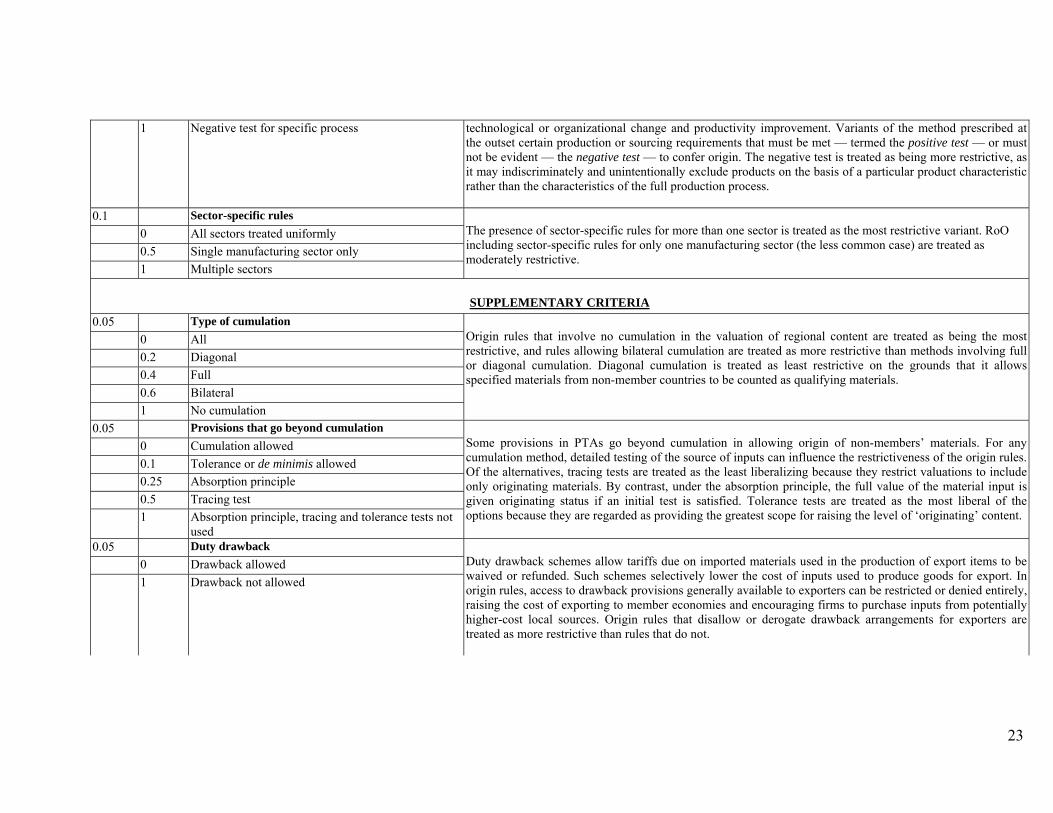
1 Negative test for specific process technological or organizational change and productivity improvement. Variants of the method prescribed at the outset certain production or sourcing requirements that must be met — termed the positive test — or must not be evident — the negative test — to confer origin. The negative test is treated as being more restrictive, as it may indiscriminately and unintentionally exclude products on the basis of a particular product characteristic rather than the characteristics of the full production process.
0.1 Sector-specific rules
0 All sectors treated uniformly
0.5 Single manufacturing sector only
1 Multiple sectors
The presence of sector-specific rules for more than one sector is treated as the most restrictive variant. RoO including sector-specific rules for only one manufacturing sector (the less common case) are treated as moderately restrictive.
SUPPLEMENTARY CRITERIA
0.05 Type of cumulation
0 All
0.2 Diagonal
0.4 Full
0.6 Bilateral
1 No cumulation
Origin rules that involve no cumulation in the valuation of regional content are treated as being the most restrictive, and rules allowing bilateral cumulation are treated as more restrictive than methods involving full or diagonal cumulation. Diagonal cumulation is treated as least restrictive on the grounds that it allows specified materials from non-member countries to be counted as qualifying materials.
0.05 Provisions that go beyond cumulation
0 Cumulation allowed
0.1 Tolerance or de minimis allowed
0.25 Absorption principle
0.5 Tracing test
1 Absorption principle, tracing and tolerance tests not used
Some provisions in PTAs go beyond cumulation in allowing origin of non-members’ materials. For any cumulation method, detailed testing of the source of inputs can influence the restrictiveness of the origin rules. Of the alternatives, tracing tests are treated as the least liberalizing because they restrict valuations to include only originating materials. By contrast, under the absorption principle, the full value of the material input is given originating status if an initial test is satisfied. Tolerance tests are treated as the most liberal of the options because they are regarded as providing the greatest scope for raising the level of ‘originating’ content.
0.05 Duty drawback
0 Drawback allowed
1 Drawback not allowed
Duty drawback schemes allow tariffs due on imported materials used in the production of export items to be waived or refunded. Such schemes selectively lower the cost of inputs used to produce goods for export. In origin rules, access to drawback provisions generally available to exporters can be restricted or denied entirely, raising the cost of exporting to member economies and encouraging firms to purchase inputs from potentially higher-cost local sources. Origin rules that disallow or derogate drawback arrangements for exporters are treated as more restrictive than rules that do not.
23
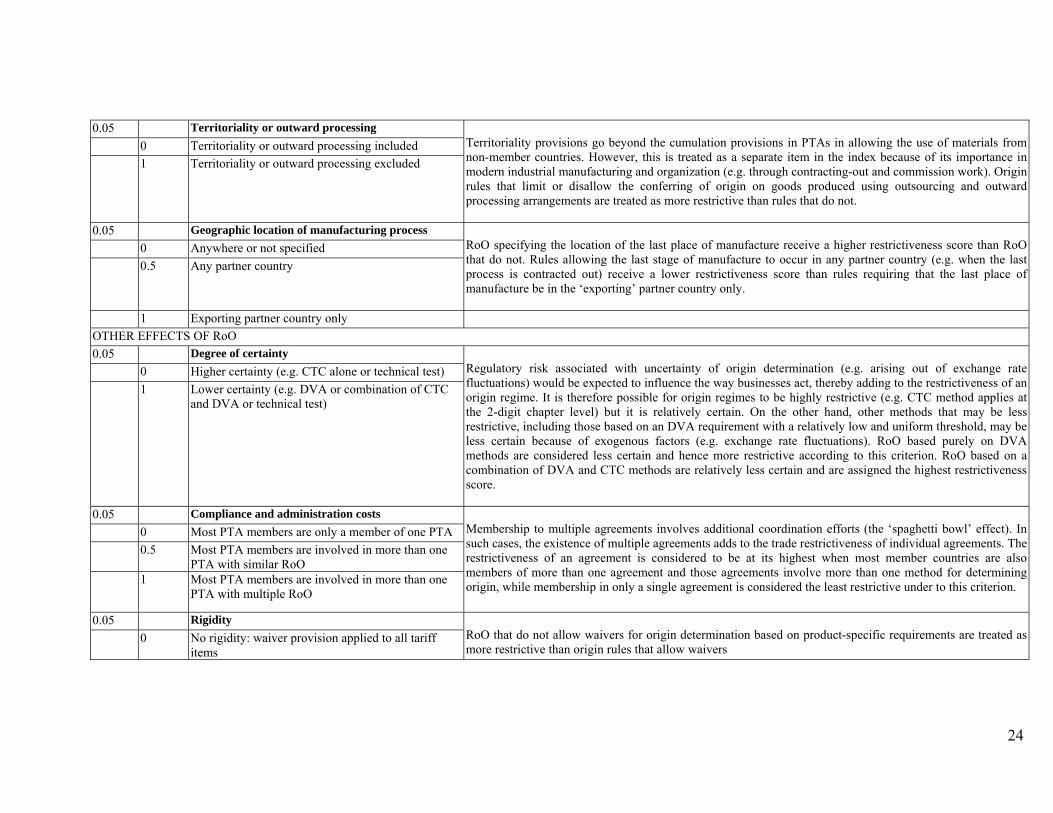
0.05 Territoriality or outward processing
0 Territoriality or outward processing included
1 Territoriality or outward processing excluded
Territoriality provisions go beyond the cumulation provisions in PTAs in allowing the use of materials from non-member countries. However, this is treated as a separate item in the index because of its importance in modern industrial manufacturing and organization (e.g. through contracting-out and commission work). Origin rules that limit or disallow the conferring of origin on goods produced using outsourcing and outward processing arrangements are treated as more restrictive than rules that do not.
0.05 Geographic location of manufacturing process
0 Anywhere or not specified
0.5 Any partner country
RoO specifying the location of the last place of manufacture receive a higher restrictiveness score than RoO that do not. Rules allowing the last stage of manufacture to occur in any partner country (e.g. when the last process is contracted out) receive a lower restrictiveness score than rules requiring that the last place of manufacture be in the ‘exporting’ partner country only.
1 Exporting partner country only
OTHER EFFECTS OF RoO
0.05 Degree of certainty
0 Higher certainty (e.g. CTC alone or technical test)
1 Lower certainty (e.g. DVA or combination of CTC and DVA or technical test)
Regulatory risk associated with uncertainty of origin determination (e.g. arising out of exchange rate fluctuations) would be expected to influence the way businesses act, thereby adding to the restrictiveness of an origin regime. It is therefore possible for origin regimes to be highly restrictive (e.g. CTC method applies at the 2-digit chapter level) but it is relatively certain. On the other hand, other methods that may be less restrictive, including those based on an DVA requirement with a relatively low and uniform threshold, may be less certain because of exogenous factors (e.g. exchange rate fluctuations). RoO based purely on DVA methods are considered less certain and hence more restrictive according to this criterion. RoO based on a combination of DVA and CTC methods are relatively less certain and are assigned the highest restrictiveness score.
0.05 Compliance and administration costs
0 Most PTA members are only a member of one PTA
0.5 Most PTA members are involved in more than one PTA with similar RoO
1 Most PTA members are involved in more than one PTA with multiple RoO
Membership to multiple agreements involves additional coordination efforts (the ‘spaghetti bowl’ effect). In such cases, the existence of multiple agreements adds to the trade restrictiveness of individual agreements. The restrictiveness of an agreement is considered to be at its highest when most member countries are also members of more than one agreement and those agreements involve more than one method for determining origin, while membership in only a single agreement is considered the least restrictive under to this criterion.
0.05 Rigidity
0 No rigidity: waiver provision applied to all tariff items
RoO that do not allow waivers for origin determination based on product-specific requirements are treated as more restrictive than origin rules that allow waivers
24
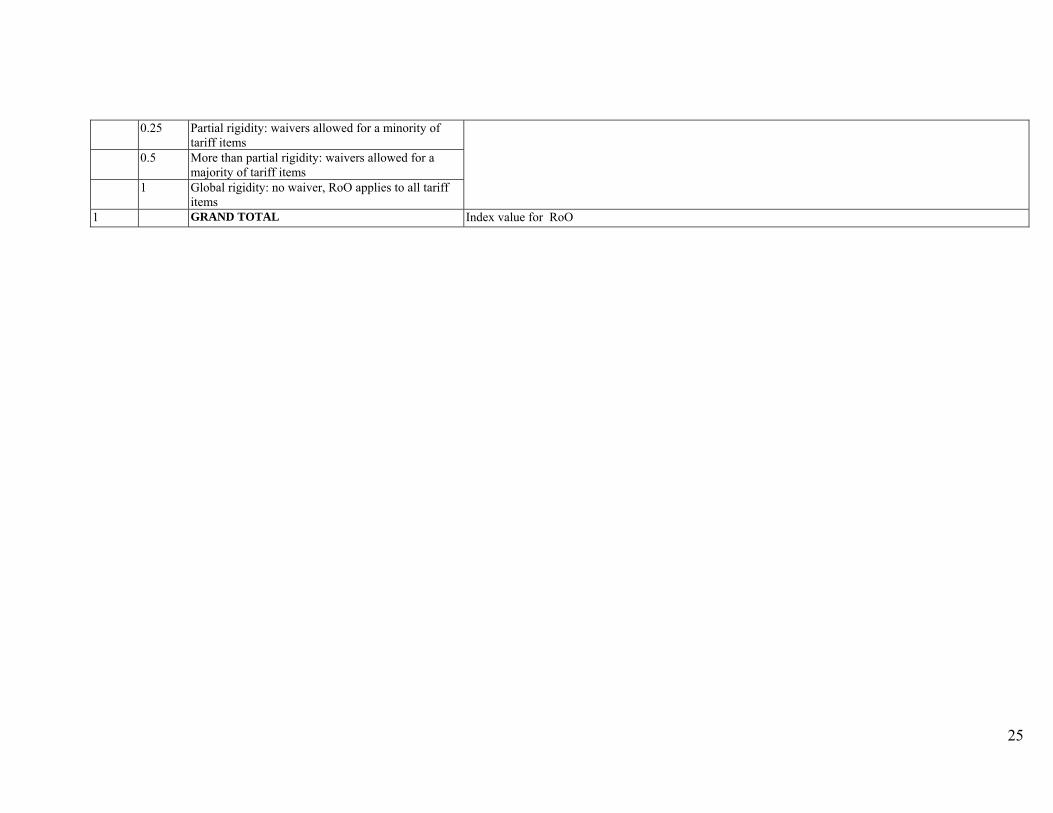
0.25 Partial rigidity: waivers allowed for a minority of tariff items
0.5 More than partial rigidity: waivers allowed for a majority of tariff items
1 Global rigidity: no waiver, RoO applies to all tariff items
1 GRAND TOTAL Index value for RoO
25

26
Appendix 3: Export Growth, IIT values, Change in the IIT values, RoO Index for select economies
Textiles Auto parts Circuits Textile IIT
Auto-parts IIT I C IIT Textile
Auto parts Circuits
Partner
Export Growth
Export Growth
Export Growth 2004 2008 2004 2008 2004 2008
Change in IIT
Change in IIT
Change in IIT
RoO Restrictivenes
s Index ASEAN - ASEAN 29.19 114.32 -10.23 0.9 0.83 0.76 0.84 0.98 0.93 -7.78 10.53 -5.10 0.31 ASEAN - China -6.19 63.84 111.06 0.4 0.89 0.68 0.51 0.54 0.54 122.50 -25.00 0.00 0.43 ASEAN - Singapore 0.57 99.51 -38.06 0.46 0.71 0.94 0.92 0.81 0.9 54.35 -2.13 11.11 0.31 ASEAN - Thailand 49.74 67.82 12.81 0.57 0.74 0.86 0.62 0.87 0.87 29.82 -27.91 0.00 0.31 China - India 101.81 1354.47 302.95 0.6 0.69 0.88 0.16 0.53 0.54 15.00 -81.82 1.89 0.30 China - Singapore 49.09 197.70 167.12 0.08 0.96 0.89 0.59 0.55 0.92 1100.00 -33.71 67.27 0.43 China - Thailand 173.43 405.45 24.49 0.92 0.98 0.89 0.43 0.11 0.07 6.52 -51.69 -36.36 0.43 India - SAARC 165.44 -2.51 -80.99 0.28 0.27 0.01 0.05 0.52 0.04 -3.57 400.00 -92.31 0.23 India- Thailand 140.43 312.90 -36.43 0.81 0.98 0.36 0.38 0.03 0.03 20.99 5.56 0.00 0.57 Japan - Singapore 28.01 21.91 2.31 0.15 0.05 0.18 0.21 0.99 0.77 -66.67 16.67 -22.22 0.63 SAARC - SAARC 135.53 -5.61 -81.18 0.86 0.59 0.45 0.45 0.58 0.88 -31.40 0.00 51.72 0.23 SAARC – Singapore* -21.81 213.61 336.33 0.6 0.65 0.5 0.72 0.03 0.26 8.33 44.00 766.67 0.27 SAARC - Thailand 62.54 313.22 -36.43 0.52 0.77 0.28 0.31 0.03 0.03 48.08 10.71 0.00 0.23 Singapore - Thailand 32.08 23.08 60.80 0.61 0.82 0.54 0.85 0.75 0.81 34.43 57.41 8.00 0.31 ASEAN - ASEAN 29.19 114.32 -10.23 0.9 0.83 0.76 0.84 0.98 0.93 -7.78 10.53 -5.10 0.31
Note: SAAR- Singapore’s restrictiveness is calculated from the average of SAARC and ASEAN’s restrictiveness Source: Authors’ calculations
References
1. AFTA Council reports. http://www.aseansec.org/15070.htm
2. ADB (2002). “Preferential Trade Agreements in the Asia and the Pacific”. Asian Development Outlook.
3. ASEAN-China FTA Agreement Attachment B http://app.fta.gov.sg/data//fta/file/ACFTA_Annex3.pdf )
4. Brenton, P 2003, ‘Rules of origin in free trade agreements’, <http://siteresources.worldbank.org/INTRANETTRADE/Resources/TradeNote4.pdf >.
5. Cadot, O. and de Melo, J. 2008 “Why OECD Countries Should Reform Rules of Origin” World Bank Research Observer 2008; 23: 77-105
6. Cadot, O., A. Estevadeordal, and A. Suwa-Eisenmann 2006 “Rules of Origin as Export Subsidies” in Cadot, O., Estevadeordal, A., Suwa-Eisenmann, A., and Verdier, T. eds. The Origin of Goods. Oxford University Press. Oxford.
7. Cadot, O, de Melo, J, Estevadeordal, A, Suwa-Eisenmann, A & Tumurchudur, B 2002, ‘Assessing the effects of NAFTA’s rules of origin’, Research Unit Working Papers, No.0306.
8. Carrière, C. and J. de Melo, 2004. “Are Different Rules of Origin Equally Costly? Estimates from NAFTA”, CEPR Discussion Paper No. 4437.
9. Estevadeordal A., J. Harris, and K. Suominen, 2009 “Multilateralising Preferential Rules of Origin around the World”, IDB WORKING PAPER SERIES # IDB-WP-137, Inter-American Development Bank, Vice Presidency for Sectors and Knowledge Integration and Trade Sector.
10. Estevadeordal A., J. Harris, and K. Suominen 2009, “Harmonizing Preferential Origin Regimes around the World.” In R. Baldwin and P. Low (eds.), Multilateralizing Regionalism: Challenges for the Global Trading System. Cambridge: Cambridge University Press.
11. Estevadeordal, A 2000, ‘Negotiating preferential market access: the case of the North American Free Trade Agreement’, Journal of World Trade, vol 34, no 1, pp 141–166.
12. Estevadeordal, Antoni and Kati Suominen, ‘Measuring Rules of Origin in the World Trading System and Proposals for Multilateral Harmonisation,’ Inter-American Development Bank, Washington DC, 2003.
13. Estevadeordal, A & Suominen, K 2006, ‘Mapping and measuring rules of origin around the world’, in The origin of goods: rules of origin in regional trade agreements, eds. O Cadot, A Estevadeordal, A Suwa-Eisenmann, & T Verdier, Oxford University Press & CEPR, Oxford & New York.
14. Harilal, K.N. and P.L. Beena, ‘The WTO Agreement on Rules of Origin: Implications for South Asia,’ Working Paper 353, Centre for Development Studies, Thiruvananthapuram, India, 2003.
15. Harris, J.T. 2007 “Measurement and Determination of Rules of Origin in Preferential Trade Agreements” Ph.D. dissertation, University of Maryland, College Park.
27
28
16. Harris, J.T. 2009 “Rules of Origin for Development: From GSP to Global Free Trade” IDB WORKING PAPER SERIES #IDB WP-135.
17. Kawai, M., and G. Wignaraja. 2009. The Asian “Noodle Bowl”: Is It Serious for Business? ADBI Working Paper 136. Tokyo: Asian Development Bank Institute. Available: http://www.adbi.org/working-paper/2009/04/14/2940.asian.noodle.bowl.serious.business/
18. Krishna, K & Krueger, A 1995, ‘Implementing Free Trade Areas: Rules of Origin & Hidden Protection’, NBER working paper No. 4983, National Bureau of Economic Research, Cambridge.
19. Krueger, A 1993, ‘Free Trade Agreements as Protectionist Devices: Rules of Origin’, NBER Working Paper No. 4352, National Bureau of Economic Research, Cambridge.
20. Krishna, K. 2006 “Understanding Rules of Origin” in Cadot, O., Estevadeordal, A., Suwa-Eisenmann, A., and Verdier, T. eds. The Origin of Goods. Oxford University Press. Oxford.
21. Manchin, M. and A. O. Pelkmans-Balaoing, 2007. “Rules of Origin and the Web of East Asian Free Trade Agreements”. World Bank Policy Research Working Paper 4273 (July).
22. Nag Biswajit & Debdeep De 2008: ‘Integration of small and medium-sized Enterprises in International Production Networks: The automotive industry in Asia’, published in Macao Regional Knowledge Hub, Working Papers, No. 12, December 2008
23. Portugal-Perez, A. 2006 “Disentangling the determinants of Rules of Origin in North-South Preferential Trade Agreements. Evidence for NAFTA” Mimeo. Université de Genève.
24. Productivity Commission, 2004, Rules of Origin under the Australia-New Zealand CER Trade Agreement, Canberra.
25. Scollay, Robert 2003. Proposal for an APEC Common Understanding on RTAs. 15th PECC General Meeting. Focus Workshop on Trade. September 1.
26. Vermulst, EA 1994, ‘Rules of origin as commercial policy instruments?- revisited’, in Rules of Origin in International Trade, E. Vermulst, P. Waer & J. Bourgeois, eds. The University of Michigan Press, Ann Arbor.
27. World Bank 2004, Customs Modernization Initiatives: Case Studies, Washington D.C.
28. WTO 2002 ‘Rules of Origin Regimes in Regional Trade Agreements’, WT/REG/W/45